o.' · quantitative techniques maximum marks is 50 duration: 90 minutes 1.. ... what is the...
TRANSCRIPT

INTERACTIVE DISTANCE LEARNING CENTRElndlanlnatltute Of 1Manage me nt, Kozhikode
ePGP- 03 & eMEP -10END TERM EXAMINATION·
QUANTITATIVE TECHNIQUESMaximum Marks is 50 Duration: 90 minutes
1.. Use of calculators is permitted2.. Use of Normal ond Ii' probability tables is permitted3.. Use of text book or any other material is not permitted4. For Part A questions write the question number and the choice in the Answer book.
Do not enclose the question paper.5. Write question numbers clearly for all your answers. Answers without mentioning
the question numbers will not be valued.6. Answer on Iv the required number of questions under each Part.
Section AAnswer all questions. Each question carries ONE mark
1. A numerical description of the outcome of an experiment is called aa. descriptive statisticb. probability functionc. variance
/- random variable
. . :
·2 .. A probability distribution showing the probability of x successes in n trials, where theprobability of success does not change from trial to trial, is termed a
a.. uniform probability distribution/' binomial probability distribution
c. hypergeometric probability distributiond. normal probability distribution
3. The standard deviation is thea. variance squared
.. b. square root of the sum of the deviations from the mean.c. same as the expected value
./" positive square root of the variance 'V
cJt /)J-')
y -:;r:S
\lo-"' :;.
\I\~ f'K. (\,_~)~-K
- <::::::r ..~ k ~ - .~ .:<£-Cj;;/ ?c ·Ir~C\ ~'?)
P -:!..- IL--.·v-.,
~ -Qo
.-- r(J", (l-r.;)!1A
.~
pX _X(..q. e
x.~
I- }..fJ.(
- e1- --><'/.Ajue

/
4. Twenty percent of the students in a class of 100 are planning to go to graduate school.The standard deviation of this binomial dis~tribution is
~
a. 20 :\~\h) S
~l\,,«/ . . 'V f- .
4 '{'Q • i .. ~~ \~d. 2 .
5. The expected value of a discrete random variablea. is the most likely or highest prob~bilityvalue for the random variable
. b. will always be one of the values x can take on, although it may not be the highest. probability value for the random variable('/is the average value for the random variable. over many. repeats of the
V' experimentd. None of these alternatives is correct.
. .
6. The key difference between the binomial and hvpergeornetric dlstributiqn is that withthe hypergeometric distribution
a. the probability of success must be less than 0.5 .'./ the probability of success changes from trial to trial.
c. the trials are independent of each other .d. the random variable is continuous
7. Assume that you have a binomial experiment with p = OA and a sample size of .50. Thevarianazffthisdistribution is +r=:" .
o .'" 'f.- SO so'!P ;v, 'f.d ,,1,2012
c. 3.46
~144
8. For any continuous random variable, the probability that the tandom variable takes onexactly a specific value is
a. 1.00b. 0.50c. any value between 0 to 1
~zero
9. Ina standard normal distribution, the range of values of z is fromv( minus infinity to infinity
b. -1 to 1c. 0 to 1d. -3.09 to 3.09
2

10~Fora uniform probability density function,~/.he height of the function can not be larger than one .
v.r:- :he height of the function is the same for each value of xc. the height of the function is different for various values of xd. the height ofthe function decreases as x increases
11. The probability density function for a uniform distribution ranging between 2 and 6 isa. 4 . \ ...-?' ~:;.
b. undefined \ . .:; ~ y:::: ~· ~any positive value \(t) '7 ~~p.. b r
V·o.25 ..
·12. Larger values of the standard deviation result in a normalcurve that is· a. shifted to the right·b.. shifted to the leftc. narrower and more peaked
/ wider and flatter
13. For a standard normal distribution, the probability of z sO is .a. zero
.b. ,;0.5..y 0.5
d. one
14. A random variable X is uniformly distributed between 45 and 150. What is theprobability of X = 48.
/?ooob. 0.1429c. 0.9524d. 0.97.5
15. The point estimator with the smaller variance is said to have :
~
. saller relative efficiencygreater relative efficiency
c. smaller relative consistencyd; greater relative consistency
16. Since the sample size is always smaller than the size of the population, the sample meana. must always be smaller than the population meanb. must be larger than the population meanc. must be equal to the population mean
Jean be smaller, larger, or equal to the population meant:::>
3

J1'. 6:17. A population has a mean of 75 and a standard deviation of 8,
is selected. The expected value of x isa. 8./75c. 800
~; None of these alternatives is correct.
18. Whenever the population has a 'normal probability distribution, the samplinglstrlbutlon of x is a normal probability distribution.for
a. only large sample sizes~./. b. only small sample sizes
~any sample siteV. only samples of size thirty or greater
A random sample of 800I::>
c;O
'/-
~-;?' .
19. A sample of 25 observations is taken from an infinite population.
distribution of P is
The sampling
- ~b. approximately normal because P is always normally distributedL- approximately normal if np ~ 5 and n(l-P} ~ 5d. approximately normal if np > 30 and n(l-P} > 30
a. not normal since n < 30
20. The purpose of statistical inference is to provide information about the.a. sample based UP9n information contained in the population
/'population based upon information contained in the samplec.' population based upon information contained in the populationd. mean of the sample based upon the mean of the population
21. The level of significance in hypothesis testing is the probability ofa. accepting a true null hypothesis ~ ..
. b/ccepting a false null hypothesis~. ~ejecting a true null hypothesis. ·d. None of these alternatives is correct.
22. When the following hypotheses are being tested at a level of significance of.«. Ho: ).l ~ 100H1: ).l < 100,
the null hypothesis will be rejected if the p-value is/~a .'b. > a.c.> «nd. ~ a/2
4

23. In order to test the following hypotheses at an a level of significance.Ho: I-!:::; 100Ha: u > 100
the null hypothesis will be rejected if the test statistic Z is
/~Zexb. :::;t;C. < -Zex
,. d. < 100 . . .. .
2f The average life expectancy of tires produced by the JK,Tyres has ~een 40,000 miles.Management believes that due to a new production' process! the life expectancy of theirtires has Lncreased.:- In order to test the validity of their belief, the correct set ofhypotheses is
~HO: I-! < 40,000I V". ~o: I-!:::; 40,000
c. Ho: I-! > 40,000d. Ho: /-! ~ 40,000
Ha: I-! ~ 40,000Ha: I-! > 40,000Ha: I-!:::; 40,000Ha: /-! < 40,000
~
14·
~ _ () .0.3. ~
~25. For a one-tailed hypothesis test (upper tail) the p-value is computed to be 0.034. If the
test is being conducted at 95% confidence, the null hypothesisa. could be rejected or not rejected depending on the sample sizeb. could be rejected or not rejected depending on the value of the mean, of the
. /mple ~.I :::::.',6SVA ~not rejected ~ !::> :;:::::::::::::
~rejected Yt; k£z.. /Section B 0 --
Answer any five questions. Each question carries 5 marks k J:11-~7. The probability function for the number of insurance policies John will sell to a customer. is given by f(X) = 0.5 - (X/6) for X = 0, 1, or 2
a. Is this a valid probability function? Explain your answer. ~~.:::,b .. What is the probability that John will sell exactly 2 policies to a customer? +<:Yc. What is the probability that John will sell at least 2 policies to a customer? +Q)
d. What is the expected number of policies John will sell? z::- :K.~)
2. The daily dinner bills in a local restaurant are normally distributed with a mean of $28and a standard deviation of $6. »: ~ 2-d'
/ a. What is the probability that a randomly selected bill will be at least $39.1 O? cr-:; /,/' . .b. What percentage. of the bills will be less than $16.907~l'What are the minimum and maximum of the middle 95% of the bills?
,--i \(,.0 m twelve of one day's bills had a value of at least $43.06, how many bills did the~ . restaurant collect on that day?
....\,~<, . iU~ - I.,>.vk .. ;v:... VI5
5 3 ~---1 ./ 6
\~~

, , Q.bobs ~" \/\cf\~ / ",8 ~
, , ~A.," ~,\)\
, ~e time it takes a worker on an assembly line to complete a task is exponentiallyV· d;~tributed with a mean of 8 minutes. JAy J'.r:" a. What is the probability density function for the time it takes to complete the task?y;'b.What is the probability that it will take a worker less t,han 4 minutes to complete
"f-.-t2..--.x(;A the task? ,\ ~;9. What is the probability that it will take a worker between 6 and 10 minutes ton<:tJ """, ' - I complete the task?
....•."118 ~)~:::. U. \,
'I - 'AI' An, ew so~ drink is being market tested,' It is e~timated that, 60% of consumers will like/'YA ~ , the new dnnk. A sample of ~ted the new dnnk. ' , ~_ ~~ "'-.::0 q ,(
\,/ rz a. Determine the standard error of the proportion '- ~I 1/b. What is the probability that more than 70.4% of consumers Will indicate they like
1/'/the drink? ,G(~ c. What is the probability that more than 30% of consum,ers will indicate they do notQ'j".r- like the drink? , \/.\ ' ,o.~
~,' I A~5. Consider the following hypothesis test
l: "
, Ho: !l ~ 14Ha: !l < 14
~ ~ ~Asample of 64 provides a sample mean ofAand a sample standard deviation of 4.
, 'a. Detenriine the standard error of the ~an. :::=-<:::r/J'C\ «r. ~ ~ --~/" b. Compute the value of the test stati.stic. , " ~ - - cs;:/~
~ ,/ /1 c. Determine the p-value; and at 9S% confiden£-, test the above hypotheses.1C\~rQ)" , " ' '~1-Y-- ~ ~ 'f (,:1»-~ . The ti~e it takes to hand car,ve a guitar neck is uniformly, distributed between, 110 and..----~ ~ 190 minutes,<y- /' " a. What is the probability that a guitar neck can 'be carved between 95 and 165
minutes?What is the probability that the guitar neck can be carved between 120 and 200minutes? 'L
Determine the expected completion time for carving the guitar_neck. 70-...4 ~ ~
Compute the standard deviation. '---- ' ' ,. ~ \ '2--
jfi(-tJ,-~
- 'if!] ~
~\~O r",w'" '1;;- c.d.
7. Define Scatter diagram and explain how it helps in understanding the relationshipbetween variables. How do you numerically measure the relationship between two
, variables? _, ~"',
A ~-::.'1- ", ," . Seventy-two percent of Americans have online access (CNBC,' December 3, 2001). In a
random sample of 30 people, what is the expected number of persons with onlineaccess? What are the variance and standard deviation? '
~ Y\ \>CJ -V~ ..\- "",~
""0""/- "'~-::::::::-
r \, '\
i--?6\ ,
"-, )
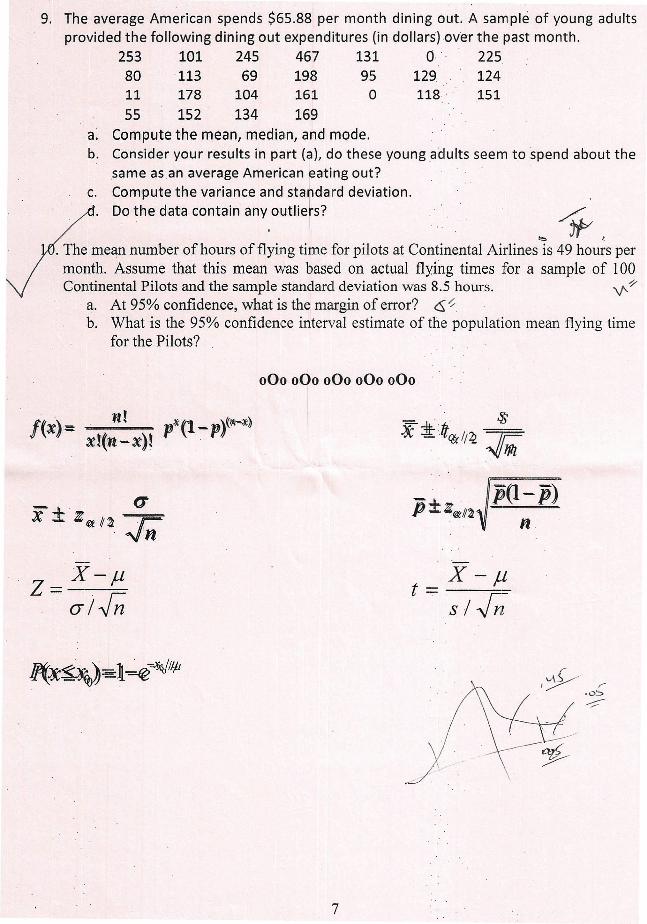
9. The average American spends $65.88 per month dining out. A sample of young adultsprovided the following dining out expenditures (in dollars} over the past month.
253 101 245 467 131 0 .. 22580 ·113 69 198 95 129 12411 178 104 161 0 118· .: 15155 152 134 169
a. Compute the mean, median, and mode.b. Consider your results in part (a}, do these young adults seem to spend about the
same asan average American eating out?c. Compute the variance and stardard deviation.
Do the data contain any outliers?
000000000000000
Ii·) . n! ~t1 r»,X ~ x!(n-x)! p ,~~p
aX ± »: Ql .,J;
~~ ~ ltc& /(~ Jj;
... . ~p(l p)P±ZfJt/j~ It
X-Jlz= o-/-J;z
X-Jlt= I. s /....,;n
1(~~;=1=f€?~/I# v\{~ r,~ .0::>
~
.e:
7
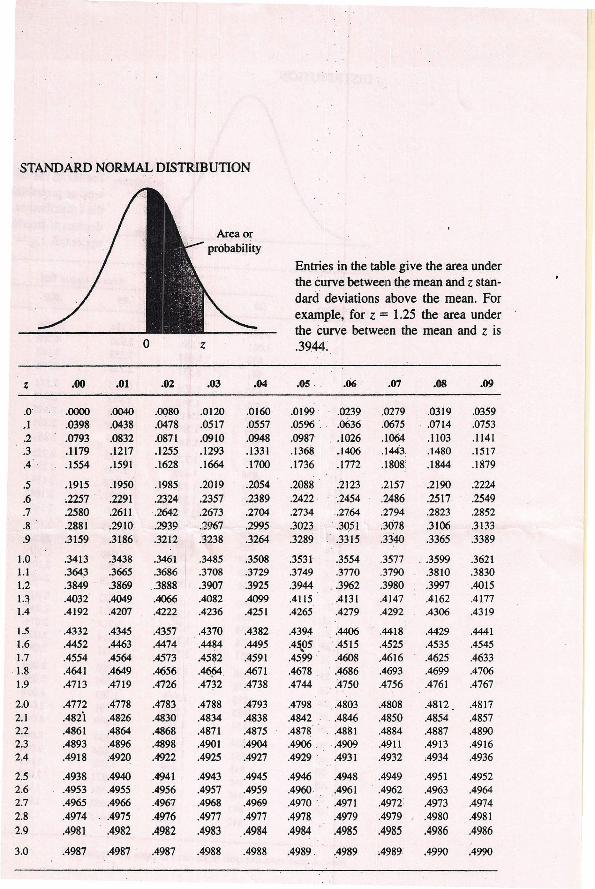
STANDARD NORMAL DISTRIBUTION
Area orprobability
Entries in the table give the area underthe curve between the mean and z stan-darddeviations above the mean. Forexample. for z = 1.25 the area underthe curve between the mean and z is
0 z .3944.
z .00 .01 .oz .03 .04 .os .06 .07 .08 .09
.0 00סס. .0040 .0080 .0120 .0160 .0199 .0239 .0279 .0319 .0359..1 .0398 .0438 .0478 .0517 .OS57 .0596 .. :0636 .0675 .0714 .0753.2 .0793 .0832 .0871 .0910 .0948 .0987 · .1026 .1064 .1103 .1141.3 . 1179 .1217 .1255 .1293 .1331 .1368 . .1406 .1443 .1480 .1517.4 .1554 .1591 .1628 .1664 .1700 .1736 :1772 .1808 .1844 .1879
.5 .1915 .1950 .1985 .2019 .2054 .2088 .2123 .2157 .2190 .2224
.6 ,2257 . .2291 .2324 .2357 .2389 .2422· .2454 .2486 .2517 .2549
.7 .2580 .2611 .2642 .2673 .2704 .2734 .2764 .2794 .2823 .2852
.8 .2881 r2910 .2939 .2967 .2995 .3023 .3051 .3078 .3106 .3133
.9 .3159 .3186· .3212 .3238 .3264 .3289 .3315 .3340 .3365 .3389
1.0 . .3413 .3438 .3461 .3485 .3508 .3531 ,3554 .3577 .. 3599 .36211.1' .3643 .3665 .3686 .3708 .3729 .3749 .3770 .3790 .3810 .38301.2 .3849 . .3869 .3888 .3907 .3925 .3944 · .3962 .3980 .3997 .4015l.~ .4032 .4049 .4066 .4082 .4099 .4115 .4131 .4147 .4162 .41771.4 .4192 .4207 .4222 .4236 .4251 .4265 .4279 .4292 .4306 .4319
1.5 .4332 .4345 .4357 .4370 .4382 .4394. .4406 .4418 .4429 .44411.6 .4452 .4463 .4474 .4484 .4495 .4\05. .4515 .4525 .4535 .45451.7 .4554 .4564 .4573 .4582 .4591 .4599 . .4608 .4616 .4625 .46331.8 .4641 .4649 .4656 .~ .4671 .4678 · .4686 .4693 .4699 .47061.9 .4713 .4719 .4726 .4732 .4738 .4744 · ,4750 .4756 .4761 .4767
2.0 .4772 .4778 .4783 .4788 .4793 .4798 ... 4803 .4808 .4812 .48172.1 .482i .4826 .4830 .4834 .4838 .4842 · .4846 .4850 .4854 .48572.2 .4861 .4864 .4868 .4871 .4875 .4878 " .. 4881 .4884 .4887 .48902.3 .4893 .4896 .4898 .4901 .4904 .4906 .4909 .4911 .4913 .49162.4 .4918 .4920 .4922 .4925 .4927 .4929 .4931 .4932 .4934 .4936
2.5 .4938 .4940 .4941 . .4943 .4945 .4946 .4948 .4949 .4951 .49522.6 .4953 . .4955 .4956 .4957 .4959 .4960 . .4961 .4962 .4963 .49642.7 .4965 .4966 .4967 .4968 .4969 .4970 .. .4971 .4972 .4973 .49742.8 .4974 .4975 .4976 .4977 .4977 .4978. .4979 .4979 .4980 .49812.9 .4981 .4982 .4982 .4983 .4984 .4984 .4985 .4985 .4986 .4986
3.0 .4987 .4987 .4987 .4988 .4988 .4989 . .4989 .4989: .4990 .4990