o l . 7, is s u e 2, ma y - o 2017 issn : 2249-5762 ... in abaqus and application of fld, ... north...
TRANSCRIPT

IJRMET Vol. 7, IssuE 2, May - ocT 2017 ISSN : 2249-5762 (Online) | ISSN : 2249-5770 (Print)
w w w . i j r m e t . c o m 108 INterNatIONal JOurNal Of reSearch IN MechaNIcal eNgINeerINg & techNOlOgy
Development of Forming Limit Diagram for Rupture Prediction of thin Inconel 718 Sheets
1Onkar P. Bhise, 2Siva Sai Kishore Palli1,2Modelling and Simulation CoE, Eaton India Engineering Center, Pune, India
AbstractIn sheet metal forming simulations, a Forming Limit Diagram (FLD) serves as a powerful tool to predict material behaviour and forming limits. FLD development needs extensive testing to characterize the material behaviour, which requires significant time and cost investment. As an alternative, evaluated Finite Element Analysis (FEA) and analytical based approaches to generate a FLD without requiring testing. Development of a FLD for thin Inconel 718 sheets and formability prediction of diaphragms made of Inconel 718 sheets is the objective of present investigation. Based on the literature survey, we selected the Hill-Swift and North American Deep Drawing Research Group (NADDRG) analytical models for development of the Inconel 718 FLD. Anisotropy coefficients and work hardening coefficients of Inconel 718 sheet are derived analytically from available literature and uniaxial tension test data, respectively. As data is limited to support construction of the analytical FLD, applied a finite element method-based approach for thin Inconel sheet under consideration. The results of the FE-based FLD model were compared to the results from the Hill-Swift and North American Deep Drawing Research Group analytical models. It was observed that Hill-Swift model was most conservative of the three and was taken forward for formability prediction. This FLD was ultimately utilized to support rupture prediction of an Inconel 718 diaphragm produced through a hydroforming process. Based on this diaphragm forming simulation in ABAQUS and application of FLD, identified critical locations in the diaphragm and its susceptibility to rupture. Ultimately, the rupture susceptibility predictions were compared with diaphragm hydroforming test data. For future applications, need to mature the FLD approach further considering the effect of variation in Inconel 718 sheet material coefficients for probabilistic rupture prediction.
KeywordsForming Limit Diagram, Inconel 718, hydroforming, FEA
I. IntroductionDesign and development of sheet metal products from a manufacturing perspective was main experience based in the past. This required part and tooling development with multiple design iterations. With advancement in simulation capabilities, sheet metal forming simulations are deployed from concept to detailed part design level. The most important goal in sheet metal forming simulation is to evaluate sheet metal part formability and obtain vital information on part and tooling design. Availability of material forming limits enables optimization of part and forming process design to avoid defects such as wrinkles, necking, rupture, etc.
In sheet metal forming simulations, FLD serves as a powerful tool to predict sheet rupture and forming limits. FLD is experimentally established through bulge testing, where elongations or strains at crack appearance are measured and plotted on a diagram. Changes in the material generate different combinations of elongations,
resulting in need to generate a separate FLD with change in material. However, FLD development needs extensive material testing leading to significant time and cost investment. As an alternative, analytical and Finite Element Analysis (FEA) enabled approaches of FLD development were evaluated in present work to minimize detailed material testing.
The objective of present investigation is FLD development for thin Inconel 718 sheets and formability prediction of diaphragms made of Inconel 718 sheets. This paper discusses the development of analytical and FEA based FLD for Inconel 718 material and its application for rupture prediction. Based on this diaphragm hydroforming simulation in ABAQUS and application of FLD, identified critical locations in the diaphragm and its susceptibility to rupture. Ultimately, the rupture susceptibility predictions were compared with diaphragm hydroforming test data.
II. Forming Limit DiagramThe idea of a sheet metal evaluation with a diagram consisting of major strain versus minor strain was named as forming limit diagram (FLD). It was introduced in the late 1960’s by Keeler and Goodwin. The forming limit curve (FLC) defines the maximum strain combinations that a metallic sheet can undergo for different forming conditions, such as deep drawing (tension – compression), stretching (tension – tension), bending and die drawing without failure. Using FLD for a given material, we can identify three marked zones as shown in the fig. 1. Zone 1 corresponds to the failure, wherein strain level for any point lies above the forming limit curve. Zone 2 corresponds to excessive thinning or necking region, wherein point lies in the proximity of the FLC. Zone 3 corresponds to safe zone or good part.
In the past, many techniques have been developed to evaluate FLD experimentally. These include evaluation of part friction, sheet profile and parameters obtained from conventional tensile testing to determine experimental FLD. The FLD can be experimentally constructed by using a hemispherical punch biaxial stretch test as well as a tension test to strain the specimen and then by recording the major and minor strains just before necking or fracture occurs. Ideally one should consider a range for FLC curve rather than a single curve, considering scatter observed in measured strains just prior to failure. FLD is material dependent and also depends on the sheet thickness, since thicker specimens will have a larger volume to respond to in the forming process. The key material properties that affect FLD are the strain hardening exponent ‘n’ and anisotropy coefficient ‘R’. For materials with higher n value, the limiting major strain will also be higher (i.e. ᵋ1=n and ᵋ2=0 point on FLD).

IJRMET Vol. 7, IssuE 2, May - ocT 2017
w w w . i j r m e t . c o m INterNatIONal JOurNal Of reSearch IN MechaNIcal eNgINeerINg & techNOlOgy 109
ISSN : 2249-5762 (Online) | ISSN : 2249-5770 (Print)
Fig. 1: Typical Forming Limit Diagram
With advancement of computational techniques, several researchers have proposed numerical methods to predict FLD’s. These numerical FLD’s are developed based on different failure criterions or models as discussed by F. Djavanroodi and A. Derogar [1]. Somecommonly used failure criterions are diffused necking by Swift, localized necking introduced by Hill and the thickness imperfection model developed by Marciniak and Kuczynski. Predicting the FLD requires complex calculations and this will limit their use in practical applications.
III. Development of FLD for Inconel 718 SheetInconel 718, an austenitic nickel based alloy, is readily fabricated by conventional forming and welding. It has an extensive application in aerospace and land based gas turbine applications, due to high resistance to creep and stress - rupture up to 1300ᵒF and oxidation resistance up to 1800ᵒF [2]. The present study focuses on development of FLD for Inconel 718 sheet of 0.002” thickness and AMS5596 grade. These thin 718 sheets are used for hydroformed diaphragms. The present work scope pertains to hydroforming simulation of a thin Inconel 718 diaphragm in ABAQUS. This involved application of relevant FLD for prediction of crack initiation in the diaphragm. FLD development needs extensive testing to characterize the material behaviour, which requires significant time and cost investment. As an alternative, evaluated FEA and analytical based approaches to generate a FLD without requiring testing. This FLD was applied for prediction of crack initiation in the diaphragm.
Anisotropy coefficient (R) and work hardening coefficient (n) of Inconel 718 sheet are derived from respective AMS5596 specification. Literature and uniaxial tension test data are available from the part vendor.
A. Development of Analytical FLD for Inconel 718 sheetBased on the literature survey, the selected Hill-Swift model and North American Deep Drawing Research Group (NADDRG) model are used for development of an analytical FLD of thin Inconel 718 sheet. It has been observed that a good simulation of the forming limit strains can be given on the basis of the Swift diffuse instability theory and the Hill localized instability theory. Swift’s and Hill’s theories are used to calculate the forming limit strains on the left and the right side of the FLD respectively. Equation (1) – (4) explains the Hill-Swift model [1] for calculating a FLD.
For ε2<0: α = σ2 / σ1
(1)
(2)
Where,α=Ratio of minor stress to major stress,r=Average anisotropy factor,n=Average strain hardening exponent
For ε2>0: α = σ2 / σ1
(3)
(4)
For simplifying the experimental and theoretical determination of the FLD and utilizing the FLD more easily in the press workshop, the NADDRG introduced an empirical equation for predicting the FLD. According to this model, the FLD is composed of two lines through origin. The slopes of the lines located on the left and right side of the FLD are about 45o and 20o respectively. Equation (5) shows NADDRG model for calculating the forming limit strains [1, 3].Where, t0= Original thickness
(5)
B. Development of FEA based FLD for Inconel 718 SheetMarciniak and Kuczynski developed a theoretical model aiming to predict the occurrence of sheet metal instability under biaxial loading with stress ratio range of 0.5 to 1.0. L. Paraianu [4] applied this Marciniak model for development of FEA based FLD.
Fig. 2: Typical Sheet Geometry Considered for Development of FLD
IJRMET Vol. 7, IssuE 2, May - ocT 2017 ISSN : 2249-5762 (Online) | ISSN : 2249-5770 (Print)
w w w . i j r m e t . c o m 110 INterNatIONal JOurNal Of reSearch IN MechaNIcal eNgINeerINg & techNOlOgy
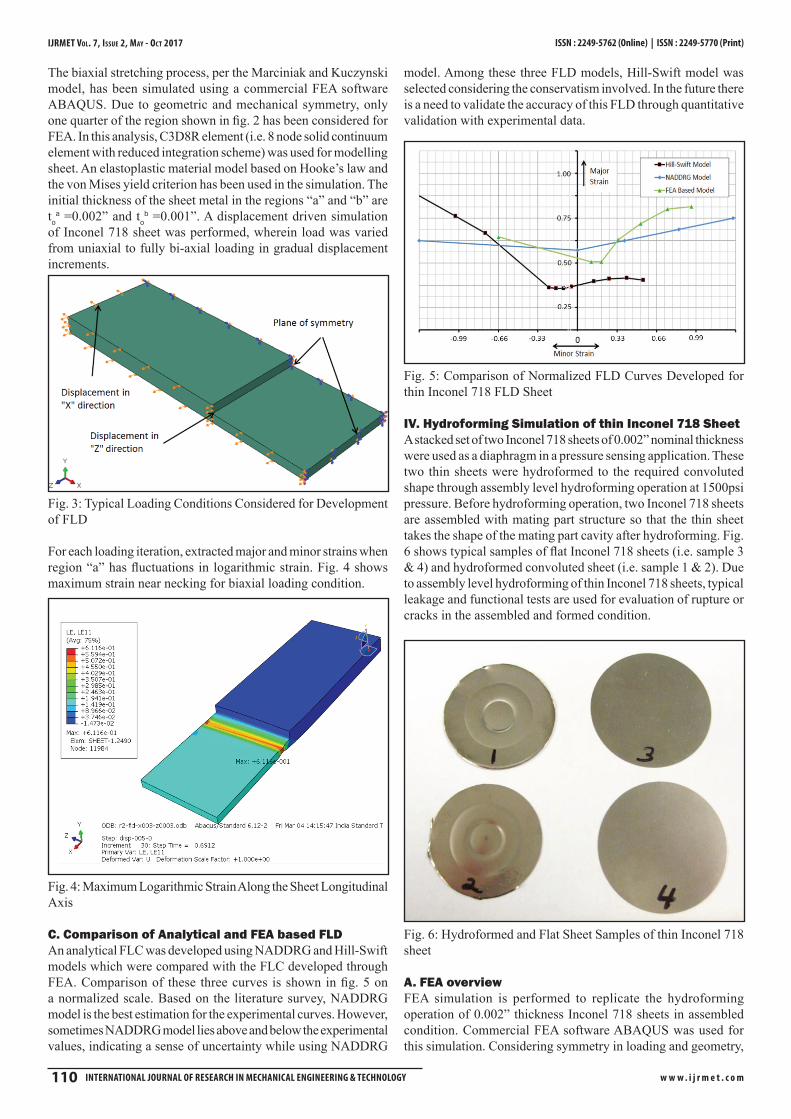
The biaxial stretching process, per the Marciniak and Kuczynski model, has been simulated using a commercial FEA software ABAQUS. Due to geometric and mechanical symmetry, only one quarter of the region shown in fig. 2 has been considered for FEA. In this analysis, C3D8R element (i.e. 8 node solid continuum element with reduced integration scheme) was used for modelling sheet. An elastoplastic material model based on Hooke’s law and the von Mises yield criterion has been used in the simulation. The initial thickness of the sheet metal in the regions “a” and “b” are to
a =0.002” and tob =0.001”. A displacement driven simulation
of Inconel 718 sheet was performed, wherein load was varied from uniaxial to fully bi-axial loading in gradual displacement increments.
Fig. 3: Typical Loading Conditions Considered for Development of FLD
For each loading iteration, extracted major and minor strains when region “a” has fluctuations in logarithmic strain. Fig. 4 shows maximum strain near necking for biaxial loading condition.
Fig. 4: Maximum Logarithmic Strain Along the Sheet Longitudinal Axis
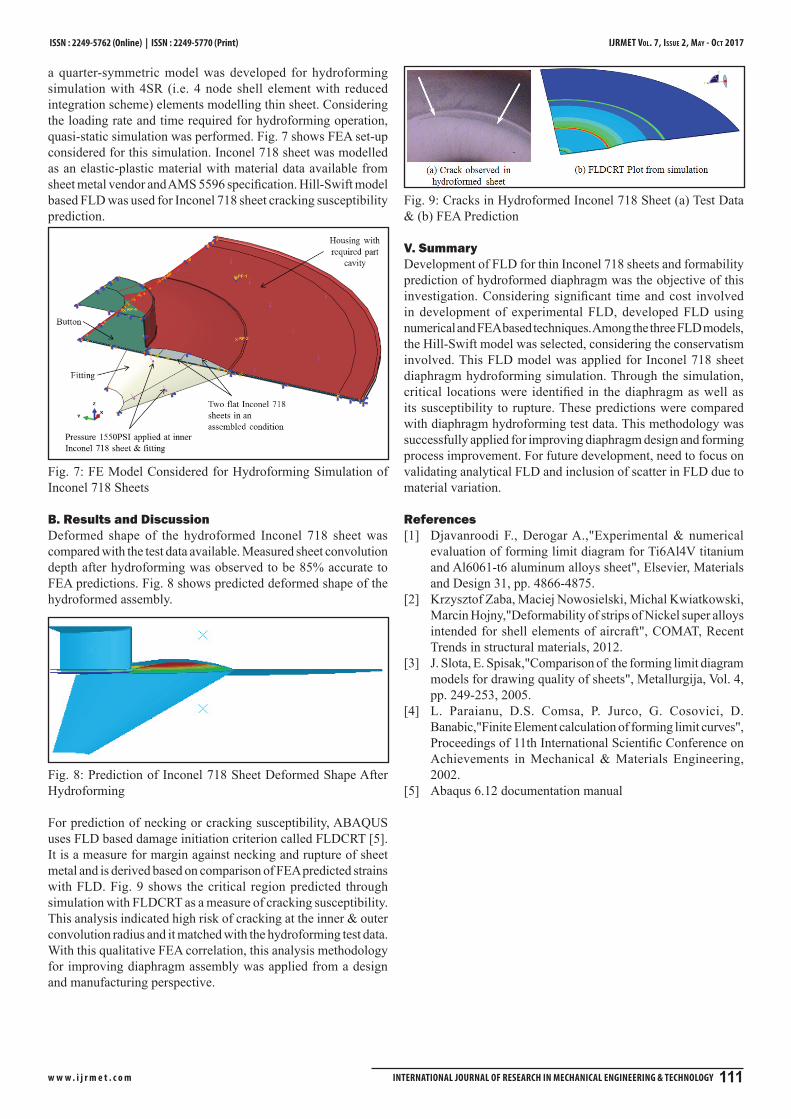
C. Comparison of Analytical and FEA based FLDAn analytical FLC was developed using NADDRG and Hill-Swift models which were compared with the FLC developed through FEA. Comparison of these three curves is shown in fig. 5 on a normalized scale. Based on the literature survey, NADDRG model is the best estimation for the experimental curves. However, sometimes NADDRG model lies above and below the experimental values, indicating a sense of uncertainty while using NADDRG
model. Among these three FLD models, Hill-Swift model was selected considering the conservatism involved. In the future there is a need to validate the accuracy of this FLD through quantitative validation with experimental data.
Fig. 5: Comparison of Normalized FLD Curves Developed for thin Inconel 718 FLD Sheet
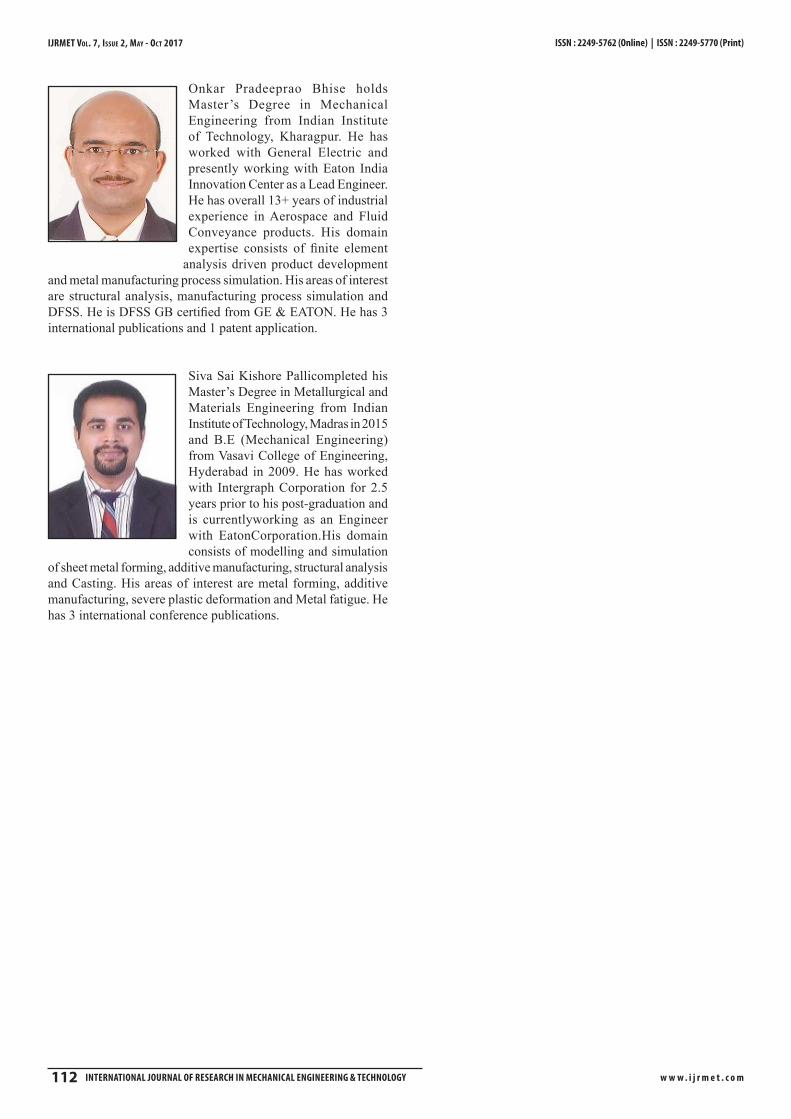
IV. Hydroforming Simulation of thin Inconel 718 SheetA stacked set of two Inconel 718 sheets of 0.002” nominal thickness were used as a diaphragm in a pressure sensing application. These two thin sheets were hydroformed to the required convoluted shape through assembly level hydroforming operation at 1500psi pressure. Before hydroforming operation, two Inconel 718 sheets are assembled with mating part structure so that the thin sheet takes the shape of the mating part cavity after hydroforming. Fig. 6 shows typical samples of flat Inconel 718 sheets (i.e. sample 3 & 4) and hydroformed convoluted sheet (i.e. sample 1 & 2). Due to assembly level hydroforming of thin Inconel 718 sheets, typical leakage and functional tests are used for evaluation of rupture or cracks in the assembled and formed condition.
Fig. 6: Hydroformed and Flat Sheet Samples of thin Inconel 718 sheet
A. FEA overviewFEA simulation is performed to replicate the hydroforming operation of 0.002” thickness Inconel 718 sheets in assembled condition. Commercial FEA software ABAQUS was used for this simulation. Considering symmetry in loading and geometry,
IJRMET Vol. 7, IssuE 2, May - ocT 2017
w w w . i j r m e t . c o m INterNatIONal JOurNal Of reSearch IN MechaNIcal eNgINeerINg & techNOlOgy 111
ISSN : 2249-5762 (Online) | ISSN : 2249-5770 (Print)
a quarter-symmetric model was developed for hydroforming simulation with 4SR (i.e. 4 node shell element with reduced integration scheme) elements modelling thin sheet. Considering the loading rate and time required for hydroforming operation, quasi-static simulation was performed. Fig. 7 shows FEA set-up considered for this simulation. Inconel 718 sheet was modelled as an elastic-plastic material with material data available from sheet metal vendor and AMS 5596 specification. Hill-Swift model based FLD was used for Inconel 718 sheet cracking susceptibility prediction.
Fig. 7: FE Model Considered for Hydroforming Simulation of Inconel 718 Sheets
B. Results and DiscussionDeformed shape of the hydroformed Inconel 718 sheet was compared with the test data available. Measured sheet convolution depth after hydroforming was observed to be 85% accurate to FEA predictions. Fig. 8 shows predicted deformed shape of the hydroformed assembly.
Fig. 8: Prediction of Inconel 718 Sheet Deformed Shape After Hydroforming
For prediction of necking or cracking susceptibility, ABAQUS uses FLD based damage initiation criterion called FLDCRT [5]. It is a measure for margin against necking and rupture of sheet metal and is derived based on comparison of FEA predicted strains with FLD. Fig. 9 shows the critical region predicted through simulation with FLDCRT as a measure of cracking susceptibility. This analysis indicated high risk of cracking at the inner & outer convolution radius and it matched with the hydroforming test data. With this qualitative FEA correlation, this analysis methodology for improving diaphragm assembly was applied from a design and manufacturing perspective.
Fig. 9: Cracks in Hydroformed Inconel 718 Sheet (a) Test Data & (b) FEA Prediction
V. SummaryDevelopment of FLD for thin Inconel 718 sheets and formability prediction of hydroformed diaphragm was the objective of this investigation. Considering significant time and cost involved in development of experimental FLD, developed FLD using numerical and FEA based techniques. Among the three FLD models, the Hill-Swift model was selected, considering the conservatism involved. This FLD model was applied for Inconel 718 sheet diaphragm hydroforming simulation. Through the simulation, critical locations were identified in the diaphragm as well as its susceptibility to rupture. These predictions were compared with diaphragm hydroforming test data. This methodology was successfully applied for improving diaphragm design and forming process improvement. For future development, need to focus on validating analytical FLD and inclusion of scatter in FLD due to material variation.
References[1] Djavanroodi F., Derogar A.,"Experimental & numerical
evaluation of forming limit diagram for Ti6Al4V titanium and Al6061-t6 aluminum alloys sheet", Elsevier, Materials and Design 31, pp. 4866-4875.
[2] Krzysztof Zaba, Maciej Nowosielski, Michal Kwiatkowski, Marcin Hojny,"Deformability of strips of Nickel super alloys intended for shell elements of aircraft", COMAT, Recent Trends in structural materials, 2012.
[3] J. Slota, E. Spisak,"Comparison of the forming limit diagram models for drawing quality of sheets", Metallurgija, Vol. 4, pp. 249-253, 2005.
[4] L. Paraianu, D.S. Comsa, P. Jurco, G. Cosovici, D. Banabic,"Finite Element calculation of forming limit curves", Proceedings of 11th International Scientific Conference on Achievements in Mechanical & Materials Engineering, 2002.
[5] Abaqus 6.12 documentation manual
IJRMET Vol. 7, IssuE 2, May - ocT 2017 ISSN : 2249-5762 (Online) | ISSN : 2249-5770 (Print)
w w w . i j r m e t . c o m 112 INterNatIONal JOurNal Of reSearch IN MechaNIcal eNgINeerINg & techNOlOgy
Onkar Pradeeprao Bhise holds Master’s Degree in Mechanical Engineering from Indian Institute of Technology, Kharagpur. He has worked with General Electric and presently working with Eaton India Innovation Center as a Lead Engineer. He has overall 13+ years of industrial experience in Aerospace and Fluid Conveyance products. His domain expertise consists of finite element
analysis driven product development and metal manufacturing process simulation. His areas of interest are structural analysis, manufacturing process simulation and DFSS. He is DFSS GB certified from GE & EATON. He has 3 international publications and 1 patent application.
Siva Sai Kishore Pallicompleted his Master’s Degree in Metallurgical and Materials Engineering from Indian Institute of Technology, Madras in 2015 and B.E (Mechanical Engineering) from Vasavi College of Engineering, Hyderabad in 2009. He has worked with Intergraph Corporation for 2.5 years prior to his post-graduation and is currentlyworking as an Engineer with EatonCorporation.His domain consists of modelling and simulation
of sheet metal forming, additive manufacturing, structural analysis and Casting. His areas of interest are metal forming, additive manufacturing, severe plastic deformation and Metal fatigue. He has 3 international conference publications.