o il price instability, - the world bank · o il price instability, veneyuela could use market- ......
TRANSCRIPT
POLICY RESEARCH WORKING PAPER 1290
O il Price Instability, Veneyuela could use market-based risk management
Hedging, and an Oil instrume.nts to reduce short-
Stabilization Fu d *run risk on oil prices and to
complement an oil
stabilization fund. Using such
The Case of Venezuela instruments would decreasethe probability that the
Stiin Claessens stabilization fund would run
Panos Varangis out of funds, and the fund
could be significantly smaller.
The World BankInternatonal Economics DepartmentInternational Trade DivisionandEurope and Central Asia/Middle Eastand North Afica Regions Technical DeparmientFinance and Private Sector Development GroupApril 1994
Pub
lic D
iscl
osur
e A
utho
rized
Pub
lic D
iscl
osur
e A
utho
rized
Pub
lic D
iscl
osur
e A
utho
rized
Pub
lic D
iscl
osur
e A
utho
rized
Pub
lic D
iscl
osur
e A
utho
rized
Pub
lic D
iscl
osur
e A
utho
rized
Pub
lic D
iscl
osur
e A
utho
rized
Pub
lic D
iscl
osur
e A
utho
rized

cy RESEARCH WORKING PAPER 1290
Suminary findingsThe Venezuelan government and PDVSA (Venezuela's For products, the liquidity is concentrated in the neareststate oil companies) are both exposed to oil price 4-5 months. So, for short-term hedges (6-9 monthsinstability. Given the existing tax structure, PDVSA Las a ahead), there is sufficient liquidity for Venezuela tohigher exposure than the government, especially when hedge a substantial part of its exports. For longer-terniprices drop below $18-20 a barrel. hedges, the over-the-counter market is the more
Claessens and Varangis show that the volatility of appropriate vehicle. In either case, it will not usually beprices for crude oil is higher (but not significantly) than the case that all production or exports should be hedgethe volatility of prices for refined oil products. And both Claessens and Varangis also e- amined the issue of anprices are highly correlated. So, there is not much oil stabilization fund. For an oil stabilization fund to bestrength to the argument that Venezuela, being now effective, several preconditions must be met. Mostmainly an exporter of refinca products, faces less notably: oil prices should not follow a random walk;volatility than when it was exporting m-'nly crude oil financial markets are incomplete; and there are large
The basis risk for hedging Venezuelan crude oil was adjustment costs. These conditions do likely apply infound to be higher than for other crudes of comparable Venezuela.quality in the region. One explanation could be the Venezuela's best strategy would be to remove as muchpricing policies Venezuela follows, which leads short-term oil price risk as possible by using short-datedVenezuelan crude oil prices to deviate for long periods hedging instruments (such as futures, options, or shott-from international prices. The basis risk in Venezuelan dated swaps) and to also do some longer term hedgingrefined products is much lower and at acceptable levels (using mainly over-the-counter options and long-datedfor doing risk management. swaps). They also find that an oil stabilization fund
The issue of liquidity in the hedging markets is crucial, should be complemented by using market-based riskas Venezuela is a major oil producer. Oil futures and management tools. The oil stabilization fund could thenoptions markets are liquid, but the liquidity is be used to ma Age any remaining interperiod oil priceconcentrated in contracts for periods of less than a year. risk to the extent considered necessary.
This paper - a joint product of the Incernational Trade Division, International Economics Department, and the Financeand Private Sector Development Group, Europe and Central Asia/Middle East and North Africa Regions TechnicalDepartment -- is part of a larger effort in the Bank to study how developing countries can better manage commodity pricerisk. Copies of this paper are available free from the World Bank, 1818 H Street NW, Washington DC 20433. Please contactDawn Gustafson, room S7-044, extension 33714 (52 pages). April 1994.
7'he Policy Research Working Paper Series disseminates the findings of work in progress to encourage the exchange of ideas aboutdevelopment issues. An objective of the series is to get the findings out quickly, even if the presentations are less than fully polished. Thepapers carry the names of the authors and should be used and cited accordingly. The findings, interpretations, and conclusions are theauthors' oum and should not be attributed to the World Bank, its Executive Board of Directors, or any of its member countries.
Produced by the Policy Research Dissemination Center

OIL PRICE INSTABILITY, HEDGIN( AND AN OIL STABILIZATION FUND: THECASE OF VENEZUELA
by Stijn Claessens and Panes VarangisInternational Economics Departnent
The World Bank

SUMMARY
Both the Venezuelan government and PDVSA--Venezuela's state oil companies--are quiteexposed to oil price instability. Given the existing oil tax structure, PDVSA has a higherexposure than the government, particularly when prices are below $18-20 per barrel.
Our analysis shows that the volatility of crude oil prices is higher, but not significantly,than the volatility of refined oil product prices and both prices are highly correlated. Thus theargument that Venezuela, being now mainly a refined products exporter, faces less volatility thanwhen it was exporting mainly crude oil is not very strong.
The basis risk for hedging Venezuelan crude oil was found to be higher than for othercrudes of comoarable quality in the region. One explanation could be the pricing policiesfollowed by Venezuela. The basis risk in Venezuelan prodicts is much lower and at acceptablelevels for doing risk management.
The issue of liquidity in the hedging markets is crucial as Venezuela is a large oilproducer. Oil futures/options markets are liquid but the liquidity is concentrated in contractswith a period of less than year. For products, the liquidity is concentrated in the nearest 4-5months. Thus, for short-term hedges (six-nine months ahead) there is sufficient liquidity forVenezuela to hedge a substantial part of its exports. For longer-term hedges, the over-the-counter market is the rnore appropriate avenue to use. In either case it will not usually be thecase that all production or exports should be hedged.
We also examined the issue of an oil stabilization fund (OSF). For an OSF to beeffective, several pre-conditions need to be met; some of these are not met in the case ofVenezuela. The most notable conditions which do not exist are the absence of a random walkin oil prices, incompleteness of financial markets, and the existence of large adjustment costs.'
We conclude that the best strategy for Venezuela to follow is to remove as much short-term oil price risk as possible through use of short-dated hedging instruments (such asfutures/options/short-dated swaps) as well as to do some longer-term hedging (using mainlyover-the-counter options and long-dated swaps). We also find that an OSF should becomplemented by the use of market-based risk management tools. The OSF could then be usedto manage any remaining interperiod oil price risk to the extent considered necessary.
'Incompleteness of financial markets means that not every contigency (time, type) is coveredby a financial contract.

1. INSTRODUC TION 2
Much of Venezuela's economic management during the last two decades has focussed on
how to accommodate to changes in the international oil market. The particular choice of
economic policy instruments and institutional practices has resulted in the poor management of
oil resources with flow-on effects to the economy, reflected in the high variability of savings and
investments (Edwards, 1992).
In 1992, Venezuela received about 80% of its merchandise export revenues and 80% of
government revenues from oil-related activities. This dependence on oil exports has to a large
extent determined the economic policies implemented in Venezuela. Forecasts of oil prices are
crucial in projecting fiscal revenues in preparing the government budget each year. Under the
current system, the budget office depends on the oil company, PDVSA, for forecasts of oil
prices and other relevant data, such as production and export volumes. Under the taxation rules
variations of projected tax payment are settled at the end of the year.3 Export volumes are
much less uncertain and more stable than prices. Daily developments in the oil market directly
influence the fiscal agencies' expenditure commitments. Politically stronger ministers usually
find it easier than others to commit funds beyond their original budget when oil prices seem
high. This makes it difficult to control public expenditures even after the budget has been voted
2The authors wish to thank Ron Duncan, Mayra Zermeno, Ramon Espinasa, and MudassarImran for valuable comments.
3Income taxes are paid by PDVSA each quarter based on oil price projections made at theb& ginning of the year for each quarter. At the end of the year, a reconciliation using the actualyear's price determines whether PDVSA makes additional income tax payments to thegovernment. During the period 1980-89, predicted oil export revenues were about 7% lowerthan actual oil export revenues.

2
by Congress. On the monetary side, monetization of the oil revenues, in the absence of effective
domestic sterilization instruments, is a major source of (price) instability.
The issue of oil price uncertainty and its effects on the Venezuelan economy has been
studied extensively. Noteworthy studies are those of asmann and of Powell (1990) and
Hausmann et al. (1991) which describe the main concerns and the costs imposed on the
Venezuelan economy due to the necessary adjustments. In the Hausmann etLaL (1991) study,
a stabilization fund is proposed to "smooth-out" the effects of oil price volatility on the
Venezuelan economy. A stabilization fund along these lines is currently under consideration by
the Venezuelan government.
What has yet to be examined for Venezuela is the possibility of using financial
instruments to "smooth out" oil price volatility. These instruments can be substitutes for an oil
stabilization fund (OSF) or, as we shall see later in the paper, could complement it. Experience
with commodity stabilization funds (CSFs) has shown that few have worked well and many have
failed. This is to be expected because of the time series properties of commodity prices. Price
swings are too large, too long-lived and too uncertain to be smoothed by any reasonably-sized
CSF. The necessary accumulation of reserves during booms has to be very large, and is
therefore very expensive and, most probably, politically unacceptable. Correspondingly,
drawings from the fund in times of price slumps tend to be very large and with uncertain dates
of replenishment (Deaton, 1992).

3
Finarcial instruments can achieve efficient hedgng of oil price exposures and may hold
the following advantages over non-market schemes (such as a stabilization fund): 1) they are
more efficient, because they are more economical in using monetary and physical resources; 2)
they are able to shift price risk externally; 3) they provide longer term price assurance; 4) they
provide market-based expectations of future prices; and 5) they are less likely to introduce
economic distortions because they are market-based.
Because they are in principle more efficient, financial instruments could provide an
attractive alternative to an OSF in the case of Venezuela. To date, Venczuela has not used
financial risk management instruments on any significant scale. Some reasons put forward as
to why Venezuela has not used financial instruments for hedging purposes are: first, PDVSA has
diversified its export basket from mainly selling crude oil to mainly selling refined products and,
as a result, it faces less volatility as product prices are less volatile than crude oil prices.
Second, because of quality differences and the pricing policies pursued, the basis risk between
futures prices and Venezuelan spot crude oil prices is high. Third, there is too little liquidity
in international financial markets given the size of Venezuela's oil exports. Fourth, financial
instruments are assumed to be costly. Finally, there is the question of who should be using the
financial instruments for hedging purposes: the government or PDVSA? These issues, as well
as further discussion on an OSF and how market-based financial instruments can complement
an OSF, are analyzed in detail in this paper. In general, we find little support for the arguments
made as to why financial instruments cannot be used effectively. We conclude that market-based
risk management tools could and should be used by Venezuela.

4
The structure of the paper is as follows: Section 2 analyzes the allocation of oil price risk
within Venezuela. Section 3 analyzes in detail the claims that petroleum product prices are less
volatile than crude oil, that products offer price diversification, and that the basis risk is too high
and there is too little liquidity in the oil derivatives markets. Section 4 analyses the necessary
requirements for the establishment of an OSF, and the rules under which an OSF, if deemed
necessary, should operate. The section also outlines how an OSF can be complemented with
financial instruments. Section 5 discusses the institutional arrangements for hedging and section
6 presents the conclusions.

5
2. ALLOCATION OF OIL PRICE RISK IN VENEZUELA: GOVERNMENT AND PDVSA
In recent years, the petroleum sector has accounted for about 23% of GDP; howtver,
inclusion of its indirect contributions (spillover effects to other sectors) brings its share up to
two-thirds of the GDP. Between 1982 and 1988 oil-related revenues (mainly PDVSA's taxes
and royalties) accounted for an average of 67.3% of total government revenues. In 1991 the
share of oil-related revenues rose to 78.5%. These statistics indicate the high exposure of the
Venezueia
1.4
i 3
1.2
1.1
I
0.4
c 073
L 0.2
0.1
0.
w 0.3-0.2
-0.1
-0.2
-0.3
-0.7
1971 1973 1975 1977 1979 1981 1993 1985 1987 1989 1991
D3 oil tax rev. + Oil prices
Fig=r 1

6
government of Venezuela (GOV) to oil prices. Figure 1 shows the high correlation between
GOV's oil fiscal revenues and petroleum prices.4 Regression analysis for the period 1970-91
finds that about 94% of the volatijity in the GOV's oil fiscal revenues can be attributed to
volatility in oil prices. Also, oil price volatility explains about 74% of the volatility in total
government revenues.5 Furthermore, a 10% change in oil prices trans!ates into a 7% change
in the GOV's oil fiscal revenues. In terms of total government revenues (oil and non-oil), a
10% cOiange in oil prices brings about a 6.1% change in total government revenues.
The two main items contributing to the GOV's oil fiscal revenues (and total GOV
reveinues) are income taxes and royalties paid by PDVSA. The income tax is calculated as
follows. (a) the oil export revenue is multiplied by a factor of 1.2 and to that domestic sales are
added to arrive at gross sales (b) from the gross sales are deducted: operating costs (including
depreciation), the so called legal contribution (aporte legal), royalty payments, and 10% of the
gross profits before taxes; (c) the remainder, (a) minus the reductions in (b), is taxed at a rate
of 67%. Proceeds from PDVSA's income taxes accounted for 59% (,f GOV's total reveinues
and 74% of GOV's oil tax revenues in 1991.
In addition, in 1991 royalties accounted for about 20% of GOV's revenues and 26% of
GOV's oil tax revenues. Taken together, the royalty and the incomue tax account for a little over
4GOV oil fiscal revenues is the sum of oil tax revenues and royalties.
5Over the period 1974-91 the volatility of total government revenues was estimated to be27.6%, while that of oil-related revenues was 28.3%. The volatility of govermnent revenuesis thus significant. Such volatility makes the carrying through of government plans extremelydifficult. Volatility is defined as the standard deviation of the relevant variable in first differenceform.
7
ROYALTIES AND OIL PRICESpercentaQe chancQes
350
300
250
200
150
100
-50 , , , , , 1971 1973 1975 1977 1979 1981 1983 1985 1987 1989 1991
0 ROYALTIES + OIL PRICES
Figure 2
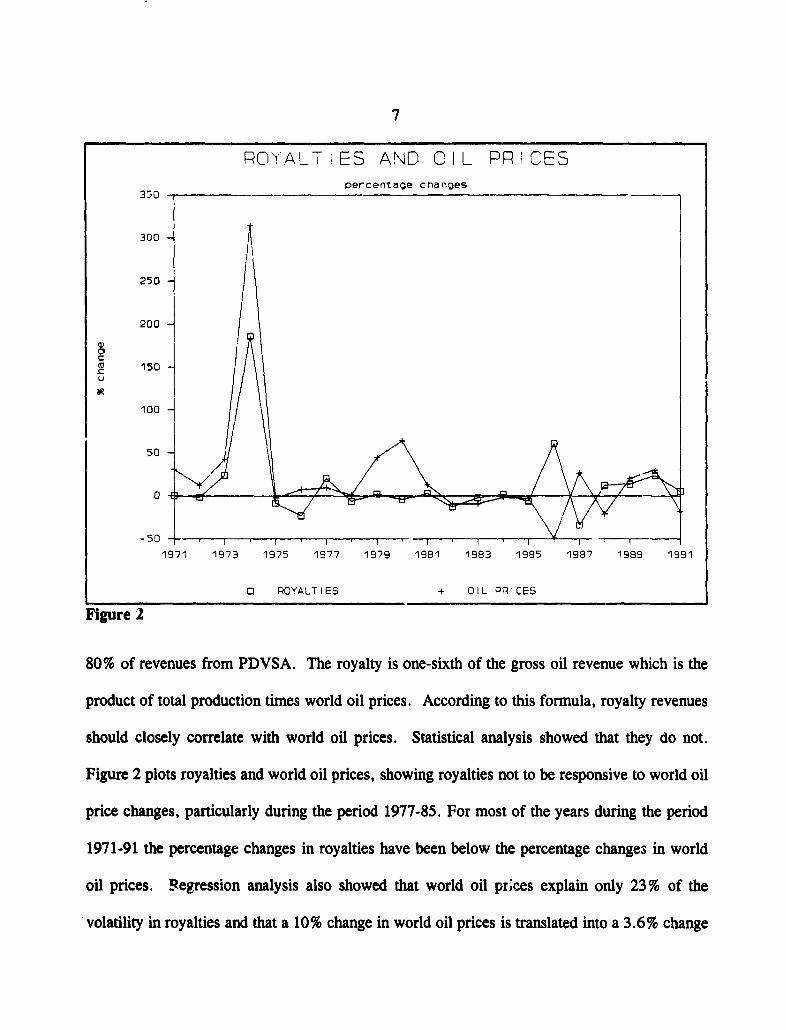
80% of revenues from PDVSA. The royalty is one-sixth of the gross oil revenue which is the
product of total production times world oil prices. According to this formula, royalty revenues
should closely correlate with world oil prices. Statistical analysis showed that they do not.
Figure 2 plots royalties and world oil prices, showing royalties not to be responsive to world oil
price changes, particularly during the period 1977-85. For most of the years during the period
1971-91 the percentage changes in royalties have been below the percentage changes in world
oil prices. Regression analysis also showed that world oil prices explain only 23% of the
volatility in royalties and that a 10% change in world oil prices is translated into a 3.6% change

8
in rcyalties. Thus, histoAcally, royalties have not been very responsive to worid oil price
changes. One reason could be that the oil price used to calculate the royalty has been
determined with soine discretion by the Ministry of Energy and Mines.
Sensitivity oi I revenues and profits24 - Cpercentage change for $1 price change)
23
22
21
20
19
18
16
15
14
13
1211
7
S
4
3
12 14 16 18 20 22 24 26 2c.. 30 32 34
D Gov t oll rev. PDVSA profits c Oil revenues
Figure 3a

9
Figure 3a shows the sensitivity of gross oil export revenues, GOV's oil fiscal revenues,
and PDVSA's after tax profits per barrel to different levels of the oil price.6 At low prices, the
sensitivity of GOV's oil tax returns is much lower--about 13 percentage points--than the
sensitivity of PDVSA's after tax profits per barrel This is because a; low oil prices the
percentage of the royalty--which is not very responsive to oil prices--in the GOV's oil
fiscal revenues is high.7 As prices increase and the share of royalty payments in total oil tax
revenues drops, the sensitivity of GOV oil fiscal revenues to oil prices is close to that of
PDVSA's. Particularly in the case of a low price, royalty payments provide a kind of hedge for
the GOV as payments are not very sensitive to oil price changes. If royalty payments become
more srnsitive to oil prices, PDVSA's exposure becomes somewhat closer to the government's
exposure.3 Even then, PDVSA has a higher exposure than the government because of the role
of production costs. PDVSA incurs costs of production that we assumed to be fixed at any oil
price level. That is, PDVSA is incurring the same cost of production whether oil prices are
US$15 per barrel or US$30 per barrel. Thus, at low oil prices the percentage of costs in
PDVSA's gross revenues is high, causing PDVSA's after tax profit per barrel to be more
sensitive at low world oil prices.
6Sensitivity refers to the percentage charge in the total dollar amounts of PDVSA's netincome, government revenues and gross oil revenues following a $1 oil price change. Theresults are based on he current tax regime.
'Based on the regression analysis for the period 1971-91, we assumed that a 10% changein oil prices corresponds to a 3.6% change in royalties.
81f royalties responded completely to world oil price movements, at low world prices thedifference in the sensitivity between the GOV's oil fiscal revenues and PDVSA's after-tax profitsdrops from about 13% to about 8%.
10
Ser- m i iK i ty of oi I revenues to pr icesCpercentage crange for $1 price change)
7
5
4
2
12 14 18 18 20 22 24 26 28 30 32 34
Gov t. oilI rev 4- PDVSA r-even~ues Q 0) I revenLieS
Figure 3b
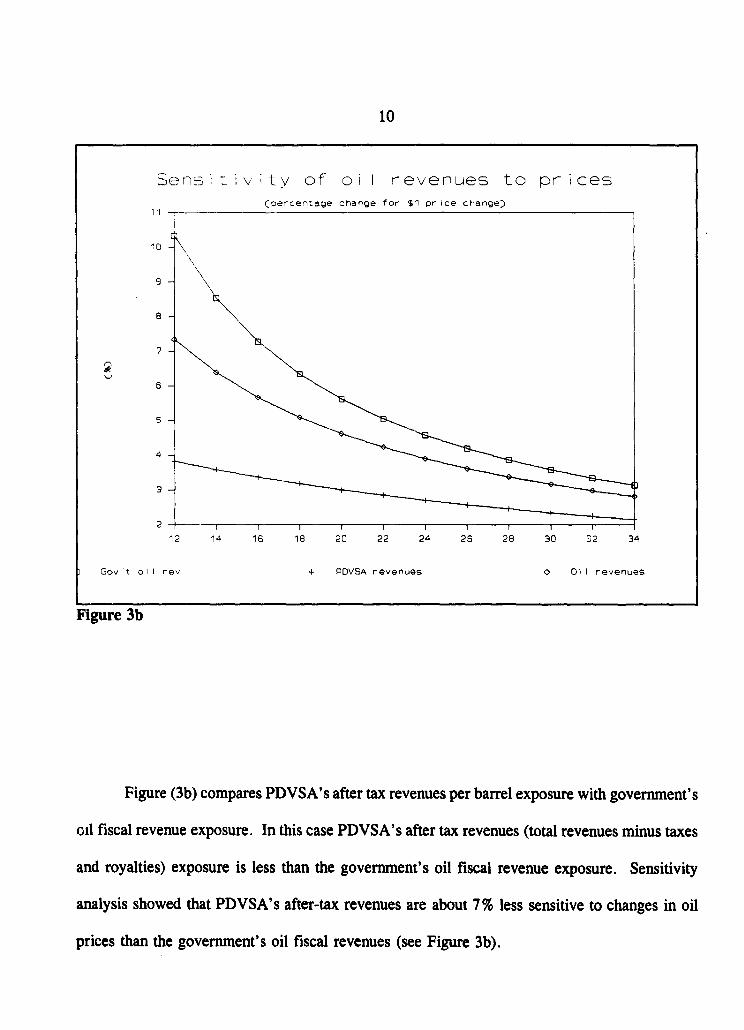
Figure (3b) compares PDVSA's after tax revenues per barrel exposure with government's
oil fiscal revenue exposure. In this case PDVSA' s after tax revenues (total revenues minus taxes
and royalties) exposure is less than the government's oil fiscal revenue exposure. Sensitivity
analysis showed that PDVSA's after-tax revenues are about 7% less sensitive to changes in oil
prices than the governiment's oil fiscal revenues (see Figure 3b).
11
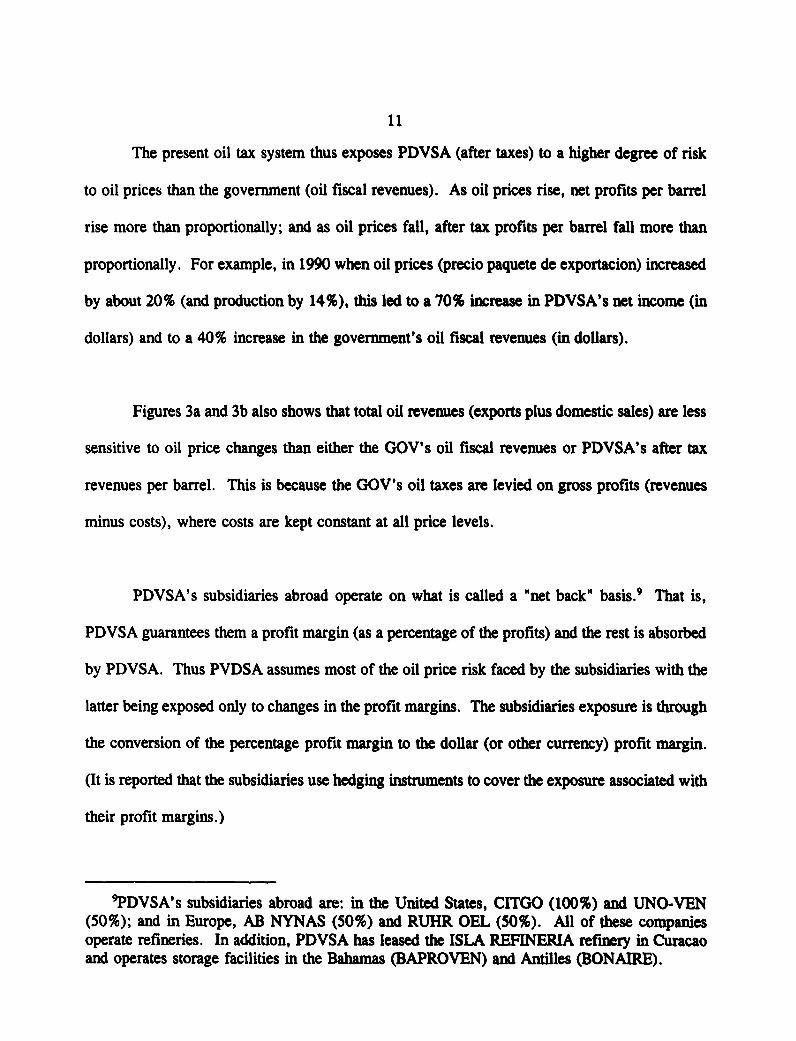
The present oil tax system thus exposes PDVSA (after taxes) to a higher degree of risk
to oil prices than the government (oil fiscal revenues). As oil prices rise, net profits per barrel
rise more than proportionally; and as oil prices fall, after tax profits per barrel fall more than
proportionally. For example, in 1990 when oil prices (precio paquete de exportacion) increased
by about 20% (and production by 14%), this led to a 70% increase in PDVSA's net income (in
dollars) and to a 40% increase in the government's oil fiscal revenues (in dollars).
Figures 3a and 3b also shows that total oil revenues (exports plus domestic sales) are less
sensitive to oil price changes than either the GOV's oil fiscal revenues or PDVSA's after tax
revenues per barrel. This is because the GOV's oil taxes are levied on gross profits (revenues
minus costs), where costs are kept constant at all price levels.
PDVSA's subsidiaries abroad operate on what is called a "net back" basis.9 That is,
PDVSA guarantees them a profit margin (as a percentage of the profits) and the rest is absorbed
by PDVSA. Thus PVDSA assumes most of the oil price risk faced by the subsidiaries with the
latter being exposed only to changes in the profit margins. The subsidiaries exposure is through
the conversion of the percentage profit margin to the dollar (or other currency) profit margin.
(It is reported that the subsidiaries use hedging instruments to cover the exposure associated with
their profit margins.)
9PDVSA's subsidiaries abroad are: in the United States, CITGO (100%) and UNO-VEN(50%); and in Europe, AB NYNAS (50%) and RUHR OEL (50%). All of these companiesoperate refineries. In addition, PDVSA has leased the ISLA REFINERIA refinery in Curacaoand operates storage facilities in the Bahamas (BAPROVEN) and Antilles (BONAIRE).

12
In "Netback" schemes, the original supplier/producer is essentially exposed to all the
transfer price "risk" while the buyers are insulated against risks due to price volatility. The
seller, therefore does not know the price he will eventually receive. In other pricing schemes
such as "built-up" or "add-on" schemes, the supplier/producer is to some extent insulated against
"risk" between the wellhead/port and the point-of-consumption because these costs are added on
the production costs (either actual or expected), and thus reflected in consumer prices.'0
'°We owe the implications of "netback" schemes on price risk allocation to Mr. MudassarImran.

13
3. VOLATILITY OF CRUDE OIL AND PRODUCTS PRICES. BASIS RISK. AND
LIQUIDITY
A. Volatility of Crude Oil vis-a-vis Products
During the past 15 years PDVSA has been transformed from an exporter of mainly crude
oil to an exporter of mainly refined products. In 1976, out of a total production of 2.3 million
barrels per day, PDVSA refined domestically 43.4% and exported about two-thirds of the
refined output. The remaining 56.6% of production was exported as crude oil. In 1991, out
of a total production of 2.5 million barrels per day, PDVSA refined domestically 43.1 % and
again exported about two-thirds of the refied output. Of the remaining production, 38.7% was
refined and sold abroad by PDVSA's subsidiaries. Thus only 18.2% of total production was
sold as crude oil.
One of the reasons given for PDVSA's shift to refined product exports was to achieve
a reduction in the price volatility faced by PDVSA. This would be so if product prices are less
volatile than crude oil prices and/or have a low correlation with oil prices. However, based on
the estimated coefficients of variation, the price volatility of crude oil prices is not significantly
higher than the price volatility of diesel and gasoline for the period 1970-90 as well as the sub-
period 1980-9011 (see Table 1).
"The coefficients of variation were calculated on annual data. Monthly data of productprices tend to show seasonality, which could raise the estimated volatility. Seasonal adjustmentswould be necessary if monthly data were used.

14
Table 1: Coefficients of Variation for Crude Oil and Products (9M)
_________ _ 1970-1990 1980-1990
Crude Oil 59.1 31.1Gasoline 55.7 27.0Diesel 55.4 28.0
Source: International Trade Division, The World Bank.
We also examined the volatility of refined products and crude oil using weekly data for
the period 1988 to 1990. The volatility was calculated for the whole period and for a sub-period
which excluded the 1990-91 Gulf War. This was done because a number of analysts have
claimed that the volatility of products, and in particular jet fuel, increased significantly more
during the Gulf War than it did for crude oil. Table 2 shows that for both the total period and
for the subperiod, crude oil volatility was above product volatility but not significantly (except
for gasoline). This result holds whether we consider Gulf Coast/N.Y. or MARAVEN's prices
for the refined products (MARAVEN is one of the three principal operating subsidiaries of
PDVSA).
Table 2: Volatility of Crude Oil and Products Prices: Weekly Data (%)
1988-90 1988-90 (excluding the Gulf War)
Gasoline 14.64 10.79Diesel 17.28 12.09Diesel (MARAVEN) 16.43 13.03Jet fuel 19.96 12.93Jet fuel (MARAVEN) 19.39 14.02Fuel oil 18.08 15.25Fuel oil (MARAVEN) 17.50 13.84Crude (Tia Juana) 20.81 15.06Crude (Bonny Light) 20.11 13.69
Source: International Trade Division, The World Bank.
Notes: Gasoline, regular unleaded gasoline (87), Gulf Coast; Diesel, Gulf Coast andMARAVEN; Jet Fuel, Gulf Coast and MARAVEN; Fuel Oil, 2.2% sulfur, NewYork and 2.8% sulfur, MARAVEN. Source of raw price data: Platt's.

15
If prices of the products are not closely correlated to the price of crude, then even if the
volatilities between the products and crude are not significantly different, the overall volatility
of PDVSA's export basket may drop. To see this, let us view the measure of the overall
volatility of PDVSA's export basket. This is equal to:
Var(B) = W? Var (P,) + 2 w W5 COV(PjP,)i-i 1.1 J-1
where VAR ('r) is the variance of the export basket, n is equal to the number of refined products
plus crude oil, Pi is the price of the ith product or crude oil, W, is the weight (share) of the ith
product or crude oil in the export basket and COV signifies the covariance. As an illustration,
let us assume that all variances are equal, all covariances (or correlations) are zero and we have
five products (including crude) with equal shares (0.2) in the export basket. It can easily be seen
that then the volatility of the overall export basket would be 20% (or one fifth) of the volatility
of crude oil alone. Thus, the covariances play an important role in the determination of the
magnitude of the volatility of the overall basket.
Table 3 shows the correlation coefficients between major refined products and crude oil
for the period 1981-1991. The correlations are high enough (except for bunker) to make it
unlikely that the overall volatility of an export basket consisting mainly of products, will be

16
significantly lower than the volatility of an export basket consisting mainly of crude oil.'2
Diversification into refined products has led to the reduction of the overall volatility of export
and tax revenues. However, this reduction was not found to be statistically significant. We also
calculated the volatility of the 1976 and 1991 export baskets of PDVSA, based on an estimate
of the weights (shares) for each of the products plus crude oil. The volatility of this basket was
28.3% for the 1991 expon basket and 32.39% for the 1976 export basket over the period 1981-
1991 (compared to 31.1 % for crude oil only). This shows that volatility declined somewhat with
the diversification of exports away from crude oil to products, but not significantly.
Table 3: Correlation Between Crude Oil and Products (
1981-91
Crude oil 100.00Residual oil (low sulfur) 95.8Residual oil (high sulfur) 94.6Gasoline 96.8Diesel 9W.4LPG 79.1Bunker 62.8
Source: International Trade Division, The World Bank.
B. Basis Risk
One important reason why one may not want to use established futures/options markets
"2Using monthly data for the pe.riod 1988-90, the correlation coefficients were found to besomewhat lower, ranging from 75% to 85%. But these correlations using monthly data are stillhigh enough not to expect a statistically significant reduction in the overall volatility of adiversified oil export basket compared to exporting crude only.

17
for a commodity is the existence of basis risk."3 In the case of Venezuelan crude oils, high
basis risk could be expected because of the quality differential between Venezuelan crudes and
West Texas Intermediate (on which the futures contract in New York is based) and because a
price formula is used to set the prices of Venezuelan crudes.
Table 4 shows the basis risk of some Latin American crudes and Brent against West
Texas Intermediate (WTI) crude for the period January 1986 to December 1990. The ',','TI
crude was chosen as the standard of comparison because the crude oil futures contract in New
York (NYMEX) is based on WTI. Alternatively, Brent could have been chosen as the London
(IPE) crude oil futures contract is based on Brent. The results show that the Venezuelan crudes
do have high basis risk. Basis risk was also computed for different subperiods for Lagotreco
and Tia Juana Light (August 1988 to December 1990 and October 1988 to December 1990
respectively). These sub-periods were selected because prices showed more responsiveness to
world oil prices (as reflected by WTI and Brent) for these periods than for the overall period.
During these subperiods, the basis risk for both Lagotreco and Tia Juana Light was significantly
reduced compared to that for the overall period. However, even during these sub-periods, the
basis risk was somewhat high.14
'3Basis risk refers to the divergence between the nmovements (changes) in the price of acommodity and the movements (changes) in the price of underlying futures contract. It ismeasured as 1-R2 from the regression of changes in the commodity price on the changes in thefutures price (for that or another grade or commodity).
"4Basis risk is considered to be high when it exceeds 15-20%.

18
Table 4: Basis Risk for Latin American Crudes and Brent. 1986-1990
Crude Country Basis Risk (%)
Istmo Mexico 12Oriente Ecuador 22Cano Limon Colombia 15Lagotreco Venezuela 31Lagotreco 1/ Venezuela 22Tia Juana Light 2/ Venezuela 35Tia Juana Light Venezuela 27Bachaquero Venezuela 40Brent United Kingdom 11
I/ Regression results for the sub-period August 1988 to December 1990.Z/ Regression results for the sub-period October 1988 to December 1990.
Source: Claessens and Varangis (1991).
The quality of Venezuelan crudes is different from that of WTI and Brent crudes; this
difference is due to the differences in API gravity and sulfur content (see Table 5). However,
the qualities of the Mexican, Colombian and Ecuadorian crudes are quite similar to the
Venezuelan crudes. Thus, if quality were the only difference, we would expect basis risk
Table 5: Quality Characteristics of Selected Crude Oils
________ API % Sulfur Vanadium
Brent 38.2 0.3 0WTI 39.0 0.4 0Venezuela (average) 28.4 1.5 +Mexico (average) 27.4 2.4 +Colombia (Cano Limon) 29.4 0.5 NAEcuador (Orito) 29.9 0.75 NA
Source: PDVSA, ECOPETROL.
Note: Tia Juanna Light has 310 API, Bachaquero 170 API and Lagotreco 300 API, andLagotreco 300 API.
19
for the Venezuelan crudes to be close to that of the other Latin American crudes. 5 Even if
one considers Mexican crudes to be of inferior quality to the Venezuelan crudes, the argument
does not change. If Mexican crude prices move closeby in line with the N.Y. oil futures
contract prices then Venezuelan crude prices should be expected to do at least the same based
on the quality argument only. That is because Vei.ezuelan crudes are of higher quality than the
Mexican crudes and relatively closer in quality to WTI, the underlying crude for the N.Y. oil
futures contract.
Another, more likely reason why Tia Juana Light and Lagotreco have a relatively high
basis risk is that Venezuelan crudes are priced on the basis of formulae that "smooth-out" price
fluctuations. These formulae use long-run moving averages of spot prices. While the largest
part of the price-setting formulae is based on the Platt's, the "smoothing-out" of short-term price
fluctuation can cause deviations between Venezuela and other crude prices over some periods.
Both the Ecuadorian and the Venezuelan crudes exhibited higher basis risk than the Mexican and
Colombia crudes. Given that both Ecuador and Venezuela were OPEC members during the
sample period, the higher basis risk may also be due to the fact that their crude oil pricing was
affected by OPEC pricing policies.
"5The only exception is Bachaquero which is a very heavy crude (170 API) and we wouldnot expect WTI to be a good hedge for that crude. Indeed, Khafji (Neutral Zone), a similaralthough lighter crude than Bachaquero, was found to have high basis risk (26%) against WTI.See further Claessens and Varangis (1991).

20
Even though the basis risk for the Venezuelan crudes was found to be relatively high,
it does not mean that there is no scope for hedging. Even with a basis risk of 30%, the use of
futures contracts will reduce the volatility associated with oil prices by 70% (100-30%) over
short-run periods (one to three months). For longer-term hedges, the reduction in volatility will
be somewhat less, but no less than 62% (Claessens and Varangis, 1991).
While basis iisk was not formally analyzed for the refined products due to the lack of
data, an indication of the basis risk can be obtained from seeing how closely cash prices of
refined product from Venezuela and international market prices for these products (as expressed
in the New York market) move together. Regression analysis for monthly data for 1990 shows
that changes in the New York spot fuel oil price and the WTI crude price explain about 78%
and 67%, respectively, of the changes in MARAVEN's fuel oil prices. For the same time
period, changes in the New York spot diesel price explain about 84% of the changes in
MARAVEN's diesel oil prices. Also, 82% of the changes in MARAVEN's gasoline prices are
explained by New York gasoline prices.
Doing the same regression analysis for gasoline, but using weekly data instead of monthly
data, we find that the correlation between gasoline spot price changes in New York and in
MARAVEN changes significantly. Using weekly data for 1989 and 1990, the changes in the
New York gasoline spot price explain less than 10% of MARAVEN's gasoline spot price
changes. If, instead, the New York gasoline spot price change lagged one week is used, about
50% of MARAVEN's gasoline spot price changes can be explained. With regards to fuel oil,
21
using weekly data for 1989 and 1990, changes in New York's fuel oil prices explain only 4%
of MARAVEN's changes in fuel oil prices. However, if we include the changes in N.Y. prices
lagged two weeks, New York fuel oil prices explain 61 % of the volatility in MARAVEN's
weekly fuel oil prices. For diesel, we compared MARAVEN's diesel prices with Gulf Coast
diesel prices. Gulf Coast diesel price volatility explains 18% of MARAVEN's diesel price
volatility and 45 % if we include price changes lagged two weeks. For jet fuel, Gulf Coast price
movements explain 15% of MARAVEN's prices and 45% if we include price changes lagged
two weeks.
Comparing the weekly with the monthly results, the following observations can be made:
first, MARAVEN's product (gasoline, diesel, fuel oil, and jet fuel) prices do not respond to
market changes (as reflected by New York and Gulf Coast prices) oi a week to week basis but
when prices are aggregated over a month they are closely related to New York and Gulf Coast
price movements. Second, the fact that the lagged New York and Gulf Coast product price
movements influence MARAVEN's product price movements more than current prices reflects
some inefficiencies in the way MARAVEN prices its products. Observations of the price data
reveal that MARAVEN keeps its product prices fixed for a long time, sometimes for up to eight
to twelve weeks.16
16For example, between the 4th and 12th week of 1989 MARAVEN's gasoline price wasfixed at $20.06/bbl. Meanwhile, the New York gasoline price fluctuated between $21.71/bbland $25.07/bbl. Similarly, in 1990, between the 20th and 32nd week MARAVEN's price wasunchanged at $26.15/bbl, with the New York gasoline price fluctuating between $24.96/bbl and$37.07/bbl.
22
On balance, these findings imply that, at least for fue' oil, diesel and gasoline, basis risk
is likely to be small provided MARAVEN removes some of the inefficiencies in its current
pricing system. That is, MARAVEN's product prices should be allowed to become more
responsive to product prices in the international markets. However, this judgement should be
supporteu by a formal analysis of the basis risk involving futuMa price data for heating oil, Wll,
and gasoline instead of New York spot prices, and doing the analysis over a longer time period.
Heating oil futures contracts are typically used to hedge diesel and (in combination with gasoline
futures contracts) some "cracxed" fuel oil prices. For hedging "uncracked" fuel oil, the WTI
or Brent crude oil futures contracts are usually used.'7
C. Liquidity
Currently, the futures/options market for crude oil is the most liquid amongst all
commodity markets. More crude oil is traded daily on the NYMEX (the light, sweet crude oil
futures contract based on the WTI crude) than the total world production of crude oil (about 65-
80 million barrels in futures versus 60 million barrels of physical).18 Options on NYMEX's
oil futures contracts account for about 25-30 million barrels or half of world crude oil
production. In addition, Brent crude oil futures contracts traded at IPE have a daily trading
volume of about 40-50 million barrels, and options on these contracts account for 5-7 million
"A more appropriate crude oil contract to hedge fuel oil could be the sour crude contract.However, NYMEX's and SIMEX's sour crude contracts do not yet have adequate liquidity.
'Liquidity has expanded rapidly. In 1989 and 1990, the average daily NYMEX crude oilfutures contract trading volume was 55 million barrels and 63.4 million barrels respectively,compared to 22 million barrels in 1986.

23
barrels in daily trades. Thus, in New York and London, roughly twice the world's physical
crude oil daily production is traded in futures and about one-half in options.'9
The daily futures trading volume of heating oil (used to hedge diesel, jet fuel and fuel
oil) is currently about 1 billion gallons; and there is about 50 million gallons of trades in
options. Gasoline's daily futures and options trading volumes on NYMEX are some 800 million
gallons and 150 million gallons, respectively. Since 1988, daily trading volumes in futures and
options for heating oil have increased by over 50% and they have more than doubled for
gasoline.
Measured in terms of open interest (the number of futures/options contracts outstanding
at any moment), most of the liquidity on the NYMEX is concentrated in the short-run. While
as of March 1993 the maturities of crude oil futures contracts extend beyond December 1995,
the most liquidly-traded contracts are concentrated in the nearest nine to ten months. That is,
about 75 % of the open interest is concentrated in the first nine months. For Brent crude, most
(up to 90%) of the open interest is concentrated in the first four to five months. The same holds
true for NYMEX's heating oil and gasoline futures contracts (78% and 90% of the open interest,
respectively). In options, most of the interest is also concentrated in short-term maturities.
19We do not count two other crude oil contracts, NYMEX's sour crude and SIMEX's Dubai,as they are not very liquid at present.
24
An additional source of market liquidity can be the over-the-counter market (OCM).
This market includes options and swaps and covers periods longer than those covered by the
futures/options traded at the exchanges. For example, it is not uncommon to be able to enter
an oil price swap extending to seven or even ten years. Because the OCM market is relatively
new and because it is not as tightly monitored as the exchanges, we do not have good evidence
of the degree of liquidity. However, there are indications that this market is growing rapidly.
Several developing countries have used the OCM oil market in recent years for hedging
purposes. During the Gulf War, the OCM was used by Brazil, Chile, and Mexico, mainly for
short-dated swaps and options.
Sumiarizing, the following can be said regarding liquidity:
(i) For short-term hedges, say up to six-nine months, the existing futures/options
contracts provide considerable liquidity. Of course, on a single day or even over
the course of one week, there is not enough liquidity to cover all of Venezuela's
exports for six months (roughly 380 million barrels); but nobody would advocate
Venezuela placing such a hedge over such a short period of time. During the
Gulf War, Mexico hedged six month's worth of exports, roughly 250 million
barrels, and did so by spreading the sale and purchase of futures, options, OCM
options and short-dated swaps over a period of two months. Placing large hedges
gradually overcomes any liquidity problem, and because doing so "locks-in"
prices over several trading days rather than on a single trading day, it achieves
a smoother price path.

25
(ii) For longer-term hedges, i.e., more than a year, the use of exchange-traded
futures/options contracts can only provide very limited coverage. Currentiy, all
the open interest in crude oil futures contracts of more than a year is about equal
to two month's of Venezuela's oil exports. For refined products, longer-term
futures/options hedges can provide even less coverage. But, liquidity for longer-
term hedges can be enhanced by using the OCM. The liquidity of the OCM can
be assessed by approaching various brokerage firms or banks. It should be noted
that in the case of longer-term hedges, the access and terms of using the OCM
will depend on the perception in international financial markets regarding
Venezuela's creditworthiness.
(iii) There are few instances where hedging all the commodity price exposure is
advisable. In most cases, partial hedges covering a faction of the exposure are
carried out. The fraction of the exposure covered is determined by an analysis
of the existing market circumstances, the amount of risk that is acceptable, the
cost of hedging, the possible offset between price and quantity fluctuations as well
as other circumstances specific to the company's or the government's interest.

26
4. OIL STABILIZATION FUND
A. Conditions for the Establishment of a Government Oil Stabilization Fund
From an analytical point of view, there are certain conditions and empirical relationships
that are required to hold in order to make the establishment of an oil stabilization fund (OSF)
economically and financially attractive.20 The following five are necessary conditions which
need to hold jointly:
1. Hedging against oil price instability by transferring risk abroad is impossible or
suboptimal. The reasons can be incomplete international financial markets (in futures,
options, and oil-linked loans and bonds and other (OTC) instruments to insure against oil
price variability), or (domestic) restrictions on the ability of companies and individuals
to access international financial markets.
2. Access to international credit markets is imperfect for creditworthiness reasons. A pro-
cyclical foreign lending pattern may exist which reduces available lending to sub-optimal
levels, possibly to zero, during periods of low oil price.
3. The government's objective function includes intertemporal government expenditure
smoothing, i.e., the government attempts to save revenue perceived as transitory while
spending revenue anticipated as permanent.
20This section draws on notes by Schmidt-Hebbel (1992).

27
4. The private sector cannot or is not able to offset (completely) any changes in the level
and variability of the government's consumption or saving through its own consumption
or saving.
5. 1 he government's main revenue uncertainty stems from oil price instability.
However, these conditions are not sufficient. In addition, establishing an OSF requires
either:
6. oil prices do not follow a random walk or other martingale process. Prices are
stationary, allowing the government to distinguish between transitory and permanent
shocks; or,
7. The government's objective function includes adjustment (or political-economy) costs
when adjusting spending. As a result, the government will prefer to avoid changing or
scaling back programs in order to minimize macroeconomic or sectoral disruptions or
alienation of constituencies and voters.
Do these conditions hold in V -.Luela? Conditions 1-3 are typically mentioned when
justifying the establishment of an OSF for Venezuela. Conditions 2 and 3 are reasonably
28
realistic conditions for Venezuela, but condition 1 is questionable.21 For short-term oil
hedging, it has been shown in Section 3 that the market is available and suitable for Venezuela.
Margin requirements assure that credit risk is not an issue, and, in principle, make these
instruments available to Venezuela at very low cost. We have shown above that oil futures can
remove up to 85 % of the oil price risk for horizons of one to two months ahead and up to 81 %
for somewhat longer horizons. Because these hedging instruments have short maturities,
however, they provide less hedging value over longer periods--even with rolling over of the
hedges.22 Use of longer-dated instruments would thus be desirable. The market for longer-
term commodity hedging instruments, i.e., oil swaps and oil-linked loans and bonds, has
develop,.d quite rapidly in recent years. Longer-term hedging instruments involve credit risk,
however, and may thus be incompletely available to Venezuela (as its access to international
credit markets is imperfect) or at less attractive terms. Nevertheless, some long- term hedging
should be possible.
Condition 4 in part arises from the imperfect access of private corporations and citizens
in Venezuela to foreign finance (due to creditworthiness), preventing them from offsetting public
savings and expenditure decisions (even though the occurrence of capital flight needs to be
2"With regards to condition 3, Deaton (1992) argues that cases where commodity booms orslumps are obviously temporary are far from typical. Alss, shocks that could or should havebeen considered as temporary, as in the late 1970s for coffee and cocoa, were perceived asrather permanent by many analysts and producing countries.
'The problem with rolling-over coverage based on short-term maturing instruments is thatthis usually implies a large exposure in these instruments. This can imply the possibility of largemargin calls and/or large option premiums, as well as large exposures to basis risks, making theinstruments less attractive for foreign exchange constrained countries.
29
considered here too).23 In addition, imperfect domestic financial markets (such as the lack of
a long-term bond market) may contribute to the inability of the private sector to offset public
actions.
As was shown above, condition 5 (oil price volatility being the largest source of GOV
revenue variability) is a realistic assumption for Venezuela. Moreover, the government has
taken most of the oil price risks (looking forward, this will change somewhat as a result of the
new tax formula which will pass more risk to PDVSA).
1. is difficult to argue that condition 6 or 7 holds. It has proved difficult to reject the
random-walk hypothesis assumed by condition 6 for most oil prices (and many other
commodities)--at least in the short-term.4 Tests of the main Venezuelan oil price, Tia Juana
Light (310), confirm that non-stationarity in levels cannot be rejected.' Even where the pure
random-walk hypothesis is rejected, the evidence suggests that the commodity-price time series
23There is a high correlation between the oil price and the level of capital flight, R2 = 0.67.Higher oil prices allowed more capital flight and was the rational savings response of the privatesector to the lack of savings by the public sector.
24See further Arrau and Claessens (1992) for copper and oil prices, Basch and Engel (1992)for copper prices, Morales (1992) for tin prices, and Hausmann et al. (1992) for Venezuelanoil revenues. The random walk hypothesis is consistent with efficient arbitrage in financial andcommodity markets when rational expectations prevail.
2sAugmented Dickey-Fuller (ADF) tests with 1, 4 and 52 lags, and using a constant or aconstant and a time trend applied to weekly data (4/1983-7/1991), indicate rejection ofstationarity for the nominal price level (the ADF-test with 4 lags and a constant and a time trendcan only be rejected at the 10% level). Over longer periods and using monthly data (e.g.,1/1970 - 6/1989), price stationarity can also be rejected (both with a constant and a time trendand with a constant only).

30
process is not quickly mean reverting.26 Deaton and Laroque (1992) show that most
commodity prices do revert eventually to their mean, but only very slowly, with an average
reversal time measured in years, not months. Arrau and Claessens (1992) even find positive
autocorrelation in the first differences of monthly oil prices, indicating no mean reversion in the
short run, but instead the opposite. On balance, there is thus no convincing evidence that oil
prices display the quick mean-reverting behavior required to make use of an OSF rational.
If the GOV bears some adjustment or other costs when changing its expenditure programs
(condition 7), an OSF could be useful in smoothing government expenditures. This motivation
underlics the recommendations made by Hausmann et al. (1991, 1993), and also those by Basch
and Engel (1992).27 In general, these are more politically-oriented explanations and have less
appeal from an economic point of view.
Finally, an OSF has often been justified on the grounds that such a fund provides positive
externalities, such as an increase in overall confidence, which justifies keeping a large amount
of low-yielding foreign assets even when the country is credit-constrained. Part of this improved
26Williams and Wright (1991), Deaton and Laroque (1992), and Trivedi (1991) reject therandom walk as they find that there is more linear and nonlinear dependence in the firstdifference of most commodity prices than is consistent with the random walk hypothesis. Partof this behavior can be explained by the competitive storage model, which indicates that pricejumps due to "stock-outs" lead to skewed price distributions and nonlinear, serial dependence.
27An OSF could be also motivated by other benefits including reduction in: (a) publicpressures to quickly spend revenues increases, (b) spending which takes on a life of its own andcannot be reversed, and (c) spending which is inefficient. These considerations may make sensein some institutional contexts but should not be taken as a generally valid feature of GOV policy.

31
confidence could come from stabilization of the real exchange rate, which may benefit other
sectors of the economy when there are costs of adjustment (see also Gilbert, 1992, and
Cuddington, 1989). However, these adjustment costs alone cannot be a sufficient reason to
establish an OSF when the private sector can hedge against these changes itself. This
justification thus relies on the lack of access of the private sector to external hedging
instruments, something which cannot be taken for granted (as the existence of capital flight
shows), or can be due to imperfectly functioning domestic financial markets, something which
requires policy changes directed at improving these markets.
B. Policy ImDlications
This section develops the implications of various policy options GOV has in coping with
oil price uncertainty. It assumes, for the purposes of argument, that the main concem of the
GOV is that variability in expenditures leads to real exchange rate and output variability; and
that the GOV has an advantage over the private sector in hedging against oil price risks. The
following implications are then derived.
o Diversification. Intemational risk diversification should be encouraged. To some extent
this can be done through production and export diversification in the oil sector.
However, the benefits from doing this are limited for a number of reasons; 1) other oil
sector activities, e.g., moving down stream, have a positive correladon between net
profits and the oil price; 2) activity diversification takes a long time to achieve; and 3)
establishment of new activities can be counter to Venezuela's long-run comparative

32
advantage.28 The first-best policy is to allow and encourage oil risk hedging operations
in international financial markets.29 Short-term, market-based, commodity risk
management instruments--futures and options--are the best possibility here, complemented
with longrr-term hedging tools to the extent available to Venezuela.
o Oil Stabilization Fund. The effectiveness of an OSF requires a large number of
conditions to hold simultaneously. As discussed above, it is not very likely that this is
the case. As a second best solution, an OSF may still be pursued, however. Any OSF
will still provide some smoothing benefits, even though not necessarily in the most cost-
effective way, especially when compared to market-based hedging techniques.
28It is sometimes argued that, to cope with export price instability, economic diversificationshould be encouraged by taxing existing commodity production or exports and subsidizing other,more stable, production or export sectors. This is a faulty policy prescription, leading to aninefficient resource allocation (Hausmann VW. 1993). Once commodity risk management hasbeen put in place to deal with oil revenue risk, and oil project evaluation has considered theriskiness of expected returns, no additional policies need to be put into place to achieveeconomic diversification.
29 This is a corollary of the finding that the benefits from portfolio diversification and risksharing may dominate the gains from accessing foreign saving when the capital account isopened i anson,; 2).

33
C. Optimal Spending Rules and the Design of an Oil Stabilization Fund
In principle, government spending should be determined on the basis of economic
efficiency criteria. Investment as well as transfer payment decision should be derived from an
analysis of expected future costs and benefits and using appropriate discounting methods. This
implies that spending rules should, to some extent, be independent of the behavior of fiscal
revenues over time. Only to the extent that a permanent change in future expected revenue
occurs, shou!d (projected) spending be adjusted.
Taking this approach will in itself already imply a significant reduction in overall macro-
instabili., as the government will reduce the variability units spending. Any variability in
revenues over time is then simply saved (or dissaved).
An OSF can aid in this process by separating the spending decisions more formally from
fiscal revenues. If the GOV were to decide to move forward with an OSF, in spite of the
arguments made earlier against the economic and financial soundness of such a decision, then
ideally the OSF should feature three properties:
* Accumulation of reserves should be based on a forward-lgokin revenue (or
price) projection, rather than a backward-looking revenue (or price) rule.
Backward-looking price schemes have seldom worked in practice because of the
long time it takes for commodity prices to return to their long-run equilibrium.
Long before prices revert to their mean, the fund will either have run out of
money or have accumulated large amounts of reserves (which will lead to political
34
pressures to spend them). The best forward-looking prices available are the
prices set in the futures and other oil-derivative markets. They are efficient
predictors of future spot prices (see Kaminsky and Kumar (1990)). Currently,
futures go out about three years, but by supplementing them with the forward
prices implicit in oil swaps, market forecasts up to ten years can be derived. The
GOV should therefore use these implicit long-run price forecasts in setting the
withdrawal and savings rules for the fund (as well as in setting parameters in its
annual budget exercise).
* The design of an OSF should be directly related to the stochastic behavior of oil
revenues and GOV objectives. This implies that the size of the fund should
depend on: a) the stochastic properties of uncertain revenues or oil prices or the
magnitude of the adjustment costs paid by the GOV when changing or down-
scaling its spending programs; and b) the degree of intertemporal smoothing the
GOV wants to attain.
* The rules should operate on the stock of reserves in the OSF, and not on the
annual accumulation of reserves. Consequently, the rules should be defined in
terms of an optimal stock level (given prize expectations) and annual deposits and
withdrawals will follow from that optimal stock level.
35
There have been several papers written in recent years on the optimal design of
commodity stabilization funds (CSFs), each of them consistent with the three properties
mentioned above. The best summary on the design of CSFs is probably Deaton (1992) who
argues that, because comnmodity prices exhibit only slow mean-reversion, either a CSF would
have to be irrationally large to be effective in smoothing revenues or the country would need to
have ample access to foreign borrowing opportunities. A large CSF is for domestic political
reasons not feasible--it is too much subject to spending pressure from domestic constituencies--
and sovereign risk prohibits the necessary access to foreign borrowing. As a small CSF is not
effective, Deaton argues that there is little scope for countries to stabilize their domestic
consumption levels through a CSF or through borrowing in the international capital markets.3
In the next section we investigate an example of a simple OSF complemented with
market-based hedging instruments. The OSF used for the simulations does not have the ideal
properties described here, but it still could be instrumental in achieving more macroeconomic
stability. As a second best solution, such an opinion--comple.menting an OSF with market-based
hedging inscrument--may be worth pursuing by the Government of Venezuela.
300ther studies on this subject are as follows: Hausmann and Powell (1992) assume arandom walk process for oil prices (which would imply that no fimd would be necessary as pricewould not revert to a mean). However, they justify the creation of a fund on adjustment costsin the economy. A more stable real exchange rate would prevent these adjustment costs. Thefund would have to be large, however, to reduce the exchange rate volatility over an extendedperiod. Basch and Engel (1991) combine the predictions of a large-scale copper model with thepolicy functions derised by Deaton (1991) in his optimal model for the case when income isassumed stationary. They thus introduce an inconsistency in that they derive thesaving/withdrawal policy functions independent of the price process. Arrau and Claessens(1992) estimate the oil price process and use the Deaton 1991 model to determine the optimalsaving rules consistent with the estimated price process.

36
E. Complementing an OSF with Market-Based Hedging
To the extent that an OSF or general revenue stabilization fund is desired, it can be
usefully complemented by market-based risk management tools. One possibility is to use
market-based instruments such as options to hedge against the occurrence of price spikes or
sharp drops. Given the presence of fat tails in the oil price distribution (see Figure 4) it may
be efficient to hedge using market-based instruments (especially instruments designed to remove
the effects of spikes, such as options) instead of holding low-yielding assets in reserves. To the
extent desired, the OSF could be used to manage any remaining interperiod risk or more general
government revenues risk.
Histogram Tia Juana LightWeekly prices
45-
40 -
35 -
30
25-
C7
a) 2L 2UA.
15
10
5
12 13. 5 15 16 5 19 19.-5 21 22. 5 24 25. 5 27 29. 5 30 31. 5 33 34. 5 36 37. 5
Pr I ce
Flgure 4: Price Histogram: 1983-1991
37
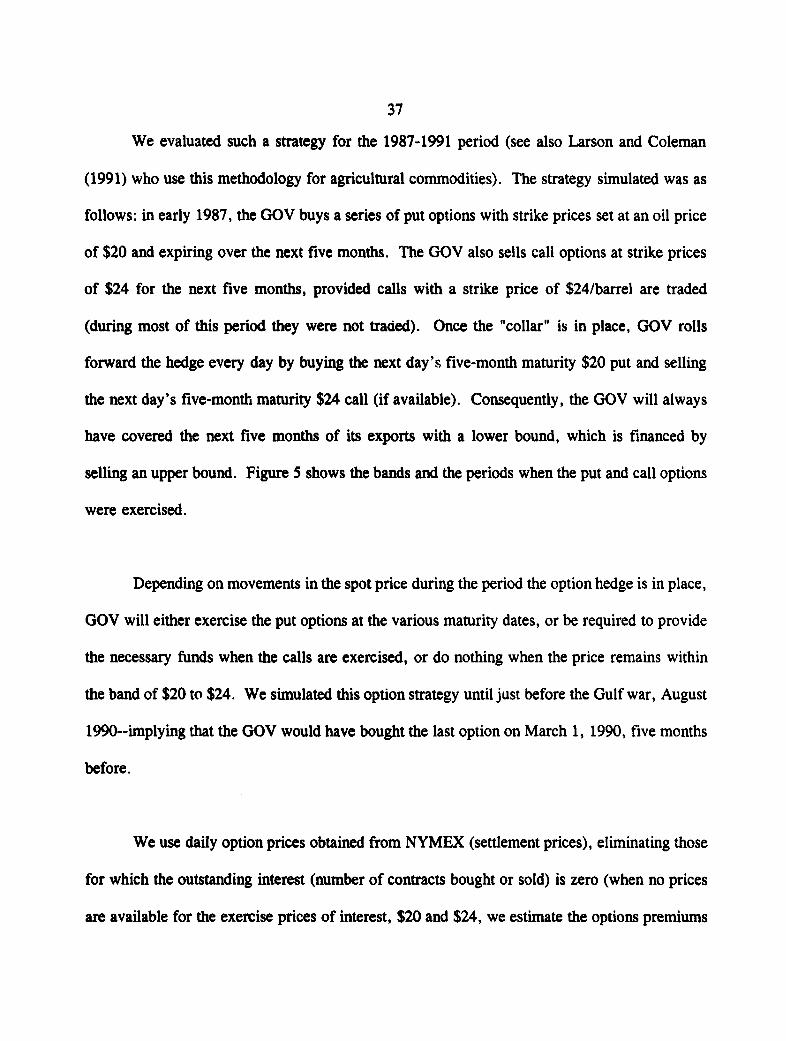
We evaluated such a strategy for the 1987-1991 period (see also Larson and Coleman
(1991) who use this methodology for agricultural commodities). The strategy simulated was as
follows: in early 1987, the GOV buys a series of put options with strike prices set at an oil price
of $20 and expiring over the next five months. The GOV also sells call options at strike prices
of $24 for the next five months, provided calls with a strike price of $24/barrel are traded
(during most of this period they were not traaed). Once the "collar" is in place, GOV rolls
forward the hedge every day by buying the next day's five-month maturity $20 put and selling
the next day's five-month maturity $24 call (if available). Consequently, the GOV will always
have covered the next five months of its exports with a lower bound, which is financed by
selling an upper bound. Figure 5 shows the bands and the periods when the put and call options
were exercised.
Depending on movements in the spot price during the period the option hedge is in place,
GOV will either exercise the put options at the various maturity dates, or be required to provide
the necessary funds when the calls are exercised, or do nothing when the price remains within
the band of $20 to $24. We simulated this option strategy until just before the Gulf war, August
1990--implying that the GOV would have bought the last option on March 1, 1990, five months
before.
We use daily option prices obtained from NYMEX (settlement prices), eliminating those
for which the outstanding interest (number of contracts bought or sold) is zero (when no prices
are available for the exercise prices of interest, $20 and $24, we estimate the options premiums

38
Price Band: Tia Juana Light and WTICUSS PER BARREL, week Iy)
40 -
36
34-
32-
30
28
26 2
22-
18
16
14
12
86 67 88 69 90 91
Year
0 Tia Juana WTI
Figure 5: Price Band
using Black's model, the futures prices on that date, and the estimate of the volatility of oil
prices implied by the option premiums on contracts which are quoLed on that day). We use the
spot WTI-price obtained from DRI on a weekly basis.3 ' For the period 1/1/87 - 7/31/90 the
results are as follows: buying daily over the period 1/1/87 - 3/1/90 the five-month-out $20 put
option costs on average $2.07/barrel. Only a limited amount of $24 calls were available, which
cost on average $0.26/barrel. Over the period 1/1/87 - 8/1/90 the put options were exercised
3"As shown earlier, the WTI price correlates closely with the Venezuelan spot price in recentperiods. However, before 1989 the Tia Juana price did not follow WTI as closely (see Figure5).
39
by GOV during the periods of low oil prices, resulting in price protection equal on average to
$1.77/barrel. The cost of exercising the call options was very limited, only $0.03/barrel. On
net the strategy resulted in a $0.04/barrel gain. Individual year results are shown in Table 6.
Since the WTI price behaved differently over this period from the Tia Juana price--the
Tia Juana priced was fixed for several periods--we also simulated the same hedging strategy
using the Tia Juana price (see Table 7). Since in more recent times the Tia Juana price has
followed the WTI price closely, and can be expected to continue to do so, the WTI results are
more relevant.
The results for the Tia Juana price may appear to be better. This is ir, part due, however,
to the fact that Tia Juana trades on average about $0.92/barrel below WTI. As a result the put
options were more beneficial, leading to an overall gain of $0.6/barrel. This is misleading,
however, since the options are exercisable on the WTI-price, and on not the Tia Juana prices.
Consequently, the cash gains would not have been realized to the extent indicated here. Table
6 is thus the more relevant comparison.
The results depend heavily on whether or not the Gulf war period is included. If we
extend the hedging period from 1/1/87 through 2/1/91, the net result is a loss of $0.98/barrel
for WTI and $0.34/barrel for Tia Juana (the results are in the last row of the Tables). The put
option still provides a net gain, but the call strategy results in a loss as the calls sold before the
Gulf war were exercised at a high price.

40
Table 6: Option Strategy: WTI-price(dollars per barrel)
Put: Put: Call: Call: NetCosts Gains Sales Costs
1987 $1.183 $0.978 $0.250 $0.000 $0.05
1988 $2.970 $4.055 $0.049 $0.000 $1.13
1989 $1.785 $0.610 $0.100 $0.000 $-1.18
1990 (whole year) $0.978 $0.668 $1.708 $3.029 $-1.63
1991 (until March) $2.572 $0.386 $1.224 $0.382 $-1.34
All Years: Excluding Gulf $2.068 $1.771 $0.260 $0.003 $0.040War
All Years: Including Gulf $1.917 $1.542 $0.218 $0.821 $-0.978War
Table 7: Option Strategy: Tia Juana Price(dollars per barrel)
Put: Put: Call: Call: NetCosts Gains Sales Costs
1987 $1.183 $2.294 $0.250 $0.000 $1.36
1988 $2.970 $3.222 $0.049 $0.000 $0.973
1989 $1.785 $1.647 $0.100 $0.001 $-0.04
1990 (whole year) $0.978 $1.568 $1.708 $2.573 $-0.28
1991 (until March) $2.572 $0.9245 $1.224 $1.260 $-1.68
All Years: Excluding Gulf $2.068 $2.440 $0.260 $0.025 $0.607WarAll Years: Including Gulf $1 .917 $2.118 $0.218 $0.758 $-0.339War

41
We also simulated other optic i strategies, including one in which a band around the
futures prices for the six-month ahead period was created (the band thus varied over time). The
results were similar.
F. Complementaritv Between the Fund and Options Strategy
The simulations have shown that options can be useful in stabilizing Venezuelan oil
prices. The options are effective in removing the impact of sharp price drops at the cost of
slightly lower revenues at times when prices rise sharply. The net upfront financing costs of this
particular options' strategy was about $1.81 per barrel ($2.060 for the puts minus $0.260 for
the calls). This compares to an average overall gain of about $0.38 per barrel (for the WTI-
hedge, Table 6). As the length of the hedge horizon was five months, the rate of return on the
upfront financing was on average high, 4.4% ($0.04/$181 x 2) which compares favorable to the
possi' le retunrI on holding assets in an OSF (presumably the risk-free rate of return).
The complementarity between an OSF and an options strategy can be further illustrated
by investigating what would happen if a fund were implemented and operated under a set of
rules, and this fund were combined with an options strategy. Since we have not analyzed the
optimal rules for an OSF for Venezuela, we build for this exercise some simple rules for an
OSF. The exact rules we use are set out in Table 8. These rules were inspired and are similar,
but not quite, to those used by Oman (see Annex I). The major differences between the rules
used in this paper and Oman's rules are that the Oman fund does not stipulate the rules for

42
withdrawals and the rules for fund accumulation during certain oil prices (above $22 per
barrel).3 2
Table 8: Rules of the Fund
Prices Withdrawal (%) Deposit (%)
P< $10 50 i
$10 <P < $12 25
$12<P<$14 10
$14 <P < $16 7.5
$16 <P < $18 0
$18 <P <$20 7.5
$20 <P < $22 10
$522 <P <$25 _ 25
$25 <P 50
Note that these rules are ad-hoc, and certainly not consistent with the requirements for
the optimal rules outlined above. Using these rules now for the period 1987-1991 leads to a
slightly more stabilized price (see Figure 6). The standard deviation of the price with the fund
only is 3.55, somewhat less then the standard deviation of TJLIGHT without a fund (4.53).
However, including the options strategy (the fund is then only in operation in the $20 to $24
price band) leads to an even more stable price with the standard deviation only 1.26. The
options strategy allows Venezuela to do away with much of the required withdrawals from and
deposits in the fund. This can also be seen from Figure 7 which plots the (weekly) deposits
32Because of these differences, it is hard to compare our simulations with the actual workingof the Oman fund.

43
Prices with and without fund or options40 -___
3 5 -
30-
-bo 25-
20-
1 5
86 87 88 89 90 9 1Year
- Fund Only - Fund and Options TJLight
Figure 6: Price with and without fund or options

44
Deposits with and without options8
7-
6 -
5-
4-
3
2-
86 87 88 89 90 9 1Year
- Fund Only Fund and Options
Figure 7: Deposits with and without Options

45
Funds with and without options
1.5 -
1
0.5-
0
86 87 88 89 90 91Year
F-Fund Only -Fund and Options
Figure 8: Fund with and without options, dolla per barrel.
which are much less with a fund when the options hegding strategy is used. In exchange, of
course, the options strategy required that Venezuela pays for puts, but as we showed above,
these puts are to some extent financed by calls.
The main advantage of combining the OSF with an options strategy is that it avoids the
large rundowns and accumulations of an OSF. Figure 8 shows the size of the fund under a OSF
only and under a combined OSF/options strategy (expressed in dollars per barrel). As can be
seen, the fund is much more stable under the combined strategy than under the fund-only
strategy. Excluding the period of the Gulf War, the fund under the combined strategy varies

46
only between $0 and $0.05 per barrel exported (with a standard deviation of 0.018), while using
the fund-only strategy leads to a consistently negative fund, which reaches a lowest value of -
$0.28 cents (with a standard deviation of 0.069). Thus, under the combined strategy the fund
takes on much less extreme values. This is particularly clear once we include the Gulf War
period. The standard deviation for the fund without the options strategy increases to 0.58, while
with the options strategy the fund has only a standard deviation of 0.03. This shows that the
combined strategy has appeal from an economic point of view. Whenever the fund reached a
large negative values it would require large borrowings which is presently not feasible for
Venezuela. From a political point of view, there are some advantages to a combined strategy
too. The option strategy involves using the discipline of international markets to reduce
volatility and is thus better shielded from political pressures than a (large) fund kept under the
control of the government. Whenever the fund reached large positive values, there would be
strong political pressures to divert the fund to other expenditures.
5. WHO SHOULD HEDGE?
There really is no clear-cut answer to the question of whether the GOV or PDVSA
should hedge. Who should hedge depends on the specific country and company circumstances.
Usually, when it comes to hedging, the entity in the best position to carry out the hedges is the
one that handles the physical trade. In the case of Venezuela this is PDVSA. The entity that
handles the physical trade has better information regarding production, dates of shipping the
exports, long-term plans for exports, and developments in the world oil market. There is
already an infrastructure in place that follows developments in the world oil markets, makes
analyses and projections and runs the physical operations. In addition, it is our understanding

47
that in the case of Venezuela, PDVSA can implement a hedging program without forma
approval from the Congress. On the other hand, if the government was to implc'nont such a
program, it would need specific approval from the Congress. However, if PDVSA is to execute
the hedges, the government needs to be involved in the design of the hedging strategy to be
pursued. Ideally, a committee should be formed, consisting of staff from different ministries
(such as planning and finance), the Central Bank and PDVSA that would meet periodically to
review the performance of the existing hedging strategy and, if ncessary, propose
modifications. The day-to-day execution of hedges would fall to PDVSA.
However, it is not uncommon to find a government ministry or a cental bank
implementing a risk management program and executing hedges. During the Gulf War, the
Ministries of Finance and the Central Banks in Chile, El Salvador, and Mexico executed the oil
risk hedging. More recently, the Central Bank of Ecuador is reportedly hedging the crude oil
price risk affecting the govermnent's revenues.

48
6. CONCLUSIONS
Our analysis has shown that both the GOV and PDVSA are exposed to oil price
volatility. Oil price volatility is responsible for a large part of the volatility of GOV's total (oil
and non-oil) revenues. Under the current oil tax system, PDVSA's exposure increases as oil
prices fall.
Comparisons of price volatility esdmates show that crude oil price volatility is higher than
refined product price volatility, but not by much. Also, as product prices are closely correlated
with crude oil prices, diversification into down-steam activides provides little risk reduction.
Regarding the issue of basis risk, Venezuelan crude oils have a relatively high basis risk vis-a-
vis WTI as compared to other, similar quality Latin American crudes. This relatively high basis
risk is mainly attributed to the pricing policies for Venezuelan crudes. While a thorough
evaluation of the basis risk in refined products was not pursued, preliminary analysis indicates
that it is not high. To the extent basis risk exists, it may be due to Venezuela's inefficiencies
in pricing these products.
The analysis raises concerns regarding the establishment of an OSF. It was argued that
international financial markets are not as incomplete as perceived. In addition, the random walk
hypothesis for oil prices cannot be easily challenged based on recent empirical work. Finally,
adjustment costs deriving from price/revenue instability cannot alone be a sufficient reason to
establish an OSF when the private sector can hedge. A jusdfication based on adjustment costs
relies on the lack of access of the private sector to external hedging instruments, something
which cannot be taken for granted as the existence of capital flight shows.

49
As a short-term hedging tool, market-basod instuments perform equally well or better
than an OSF in removing short-period volatility, and at lower costs. The best strtegy for
Venezuela to follow is to remove as much short-period commodity price risk as possible through
short-dated instruments as well as--to the extent possible--using longer-term hedging tools. The
analysis also shows that an OSP or a government revenue stabilizadon hnd could be
complemented by market-baed risk management tools. The OSF could then be used to manage
any remaining interperiod risk or more general government revenue risk. It should be noted,
however, that the use of market-based hedging instruments will not necessarly render the OSF
immortal; but it should generate benefits to the government by extending the probable life of the
OSF (Larson and Coleman, 1991).

50
ANNEX I: THE OMAN CONTINGENCY FUND
The Oman Contingency Fund (OCF) operates under the following rules:
* If oil prices range between $18 and $20 per barrel, 7.5% of net oil revenues will
be deposited in the fund.
* If oil prices range between $20 and $22 per barrel, 10% of the additional net oil
revenues will be deposited.
* If oil prices are above $22 per barrel, additional deposits (unspecified) will be
required.
* If oil prices are above $25 per barrel, all additional oil revenues will be
transferred to the State General Reserve Fund.
* Withdrawals of the two funds are unspecified with respect to the oil prices, but
are determined (up to a limit) by the government for deficit financing.
Furthermore, withdrawals are subject to approval by the Council of Ministers.

51
References
Arrau, Patricio (1990), "Intertemporal Substitution in a Monetary Framework: Evidence from Chile andMexico," PRE Working Paper # 549, The World Bank, December.
Arrau, Patricio and Stijn Claessens (1992), "Cornmnodity Stabilization Funds," PRE Working Paper #853,The World Bank, January.
Basch, Miguel and Eduardo Engel (1991), "Shocks transitorios y mecanissnos de estabilizacion," mimeo,CIEPLAN, October.
Claessens, Stijn and Jonathan Coleman (1991), "Hedging Commodity Price Risks in Papua New Guinea,"PRE Working Paper # 749, The World Bank, August
Claessens, Stijn and Panos Varangis (1991), "Hedging Crude Oil Imports In Developing Countries",PRE Working Paper #755, The World Bank, August.
Cuddington, John (1989), "Commuodity Export Booms in Developing Ccnutries," World Bank ResearchObserver, Vol 4:2, pp. 143-165.
Deaton, Angus (1991), "Saving and Liquidity Constraints," Econometrica, vol. 59, no. 5, September,pp. 1221-1248.
Deaton, Angus (1992), "Commodity Prices, Stabilization, and Growth in Africa," mimeo, PrincetonUniversity.
Deaton, Angus and Guy Laroque (1992), "On the Behavior of Commodity Prices," Review of EconomicStudies, vol. 59(1), no. 198, pp. 1-23.
Edwards, Sebastian (1992), "Venezuela: Oil and Real Exchange Date: Historical Experiences and PolicyOptions", mimeo, The World Bank.
Gilbert, Christopher L. (1992), "Domestic Price Stabilization Schemes for Developing Countries,"mimeo, IECIT, The World Bank.
Hanson, James (1992), "Opening the Capital Account: A Survey of Issues and Results", PRE WorkingPaper # 901, The World Bank.
Hausmrann, Ricardo and Andrew Powell (1990), 'El fondo de estabilizacion macroeconomica:lineamientos generales," mimneo, IESA, Caracas, November.
Hausmann, Ricardo, Andrew Powell and Roberto Rigobon (1991), "Facing Oil Income Uncertainty inVenezuela: An Optimal Spending Rule with Liquidity Constraints and Adjustment Costs", mimeo,IESA, Caracas, December.

52
(1993), "An Optimal Spending Rule Facing Oil Income Uncertainty (Venezuela)", inExternal Shocks and Stabilization Mechanisms, E. Engel and P. Meller, eds., Inter-AmericanDevelopment Bank and CIEPLAN (Chile).
Kaminsky, Graciela and Manmohan S. Kumar (1990), "Efficiency in Conmmodity Futures Markets", IMFStaff Papers, vol. 37, no. 3, September, pp. 670-699.
Larson, Donald and Jonathan Coleman (1991), "The Effects of Option-Hedging on the Costs of DomesticPrice Stabilization Schemes," PRE Working Paper #653, The World Bank, April.
Morales, J.A. and J. Espejo (1992), Fluctuaciones de los Ingresos de Exportaci6r, y EstabilidadMacroecon6mica," Second Draft, IISEC, Universidad Cat6lica Boliviana, La Paz.
Powell, Andrew (1992), "Commodity, Exchange Rate and Interest Rate Risks in Colombia," inimeo,IECIT, The World Bank.
Schmidt-Hebbel, Klauss (1992), "Commodity Price Instability and Government Policies," Round TableDiscussion, Seminar on Export Price Instability in Latin America, Santiago, Chile, May 8.
Trivedi, Pravin (1991), "Time Series Behavior of Some Commodity Prices," mimeo, IECIT, The WorldBank.
Williams, Jeffrey and Brian Wright (1991), Storage and Commodity Markets, Cambridge UniversityPress.
Policy Research Working Paper Series
ContactTitle Author Date for paper
WPS 1264 A Rock and a Hard Place: The Two J. Michaei Finger March 1994 M. PatehaFaces of U.S. Trade Policy oward Korea 37947
WPS1265 Parallel Exchange Rates in Miguel A. Kiguel March 1994 R. LuzDeveloping Countries: Lessons from Stephen A. O'Connell 34303Eight Case Studies
WPS1266 An Efficient Frontier for International Sudhakar Satyanarayan March 1994 D. GustafsonPortfolios with Commodity Assets Panos Varangis 33732
WPS1267 The Tax Base in Transition: The Case Zeljko Bogetic March 1994 F. Smithof Bulgaria Arye L. Hillman 36072
WPS1268 The Reform of Mechanisms for Eliana La Ferrara March 1994 N. ArtisForeign Exchange Allocation: Theory Gabriel Castillo 38010and Lessons from Sub-Saharan John NashAfrica
WPS1269 Union-Nonunion Wage Differentials Alexis Panagides March 1994 I. Conachyin the Developing World: A Case Harry Anthony Patrinos 33669Study of Mexico
WPS1270 How Land-Based Targeting Affects Martin Ravallion March 1994 P. CookRural Poverty Binayak Sen 33902
WPS1271 Measuring the Effect of External F. Desmond McCarthy March 1994 M. DivinoShocks and the Policy Response to J. Peter tNeary 33739Them: Empirical Methodology Applied Giovanni Zanaldato the Philippines
WPS1272 The Value of Superfund Cleanups: Shreekant Gupta March 1994 A. MaranonEvidence from U.S. Environmental George Van Houtven 39074Protection Agency Decisions Maureen L. Cropper
WPS1273 Desired Fertility and the Impact of Lant H. Pritchett March 1994 P. CookPopulation Policies 33902
WPS1274 The New Trade Theory and Its Asad Alam March 1994 A. AlamRelevance for Developing Countries 87380
WPS1275 Female-Headed Households, Ricardo Barros March 1994 K. BinkleyPoverty, and the Welfare of Children Louise Fox 81143in Urban Brazil
WPS1276 Is There Persistence in the Growth Ashoka Mody March 1994 M. Patefiaof Manufactured Exports? Evidence Kamil Yilmaz 37947from Newly Industrializing Countries
WPS1277 Private Trader Response to Market Steven Jaffee March 1994 C. SpoonerLiberalization in Tanzania's Cashew 32116Nut Industry
Policy Research Working Paper Series
ContactTitle Author Date for paper
WPS1278 Regulation and Commitment in the Ahmed Gabal March 1994 B. MooreDevelopment of Telecommunicaticns 38526in Chile
WPS1279 Optimal Hedging Strategy Revisited: Ying Oban March 1994 S. UpscombAcknowledging the Existence of Ronald Duncan 33718Nonstatbonary Economic Time Series
WPS1280 The Economic Impact of Export Wendy E. Takacs March 1994 M. PatefiaControls: An Appicatlon to Mongolian 37947Cashmere and Romanian Wood Products
WPS1281 Human and Physical Infrastructure: Emmanuel Jimenez April 1994 L. LongoPublic Investment and Pricing Policies 37786In Deveboping Countries
WPS1282 Copper and the Negative Price of Donald Frederick Larson April 1994 A. KImStorage 33715
WPS1283 Interest Rates in Open Economies: Dipak Das Gupta April 1994 B. KimReal Interest Rate Parity, Exchange Bejoy Das Gupta 82407Rates, and Country Risk in Industrialand Developing Countries
WPS1284 The Soviet Economic Decline: William Easterly April 1994 R. MarthnHistorical and Republican Data Stanley Fischer 31320
WPS1285 Capital Fundamenialism, Economic Robert G. King April 1994 P. Sintlm-AboagyeDevelopment, and Economic Growth Ross Levine 38526
WPS1286 Economic Transformation and the Luca Barbone Aprl 1994 S. HarbiFiscal Crisis: A Critical Look at the Domenico jr. Marchetti 37143Central European Experience of the 1990s
WPS1287 Unstable Inflation and Seignorage Jacques Morisset April 1994 D. JenkdnsRevenues in Laffn America: How Many 37890Times Can the Govemment Fool People?
WPS1288 The Public Finance of infrastructure: Vinaya Swaroop April 1994 C. JonesIssues and Options 37699
WPS1289 A Fiscal Needs Approach to Anwar Shah April 1994 C. JonesEqualization Transfers in a Decentralzed 37754Federamfon
WPS1290 Oil Price Instability, Hedging, and an Stijn Claessens April 1994 D. GustafsonOil Stabilization Fund: Tho Case of Panos Varangis 33714Venezuela