o excellence elegance - singapore exchange€¦ · co ltd and the global council for asia society....
TRANSCRIPT

Wing Tai Holdings LimitedAnnual Report 2015
Of Excellence & Elegance

Strategic Review2 Chairman’s Message4 Board of Directors7 Key Management8 Corporate Data
Operating and Financial Review9 Property14 Hospitality15 Retail16 Calendar of Events17 Corporate Social Responsibility
Corporate Governance
18 Corporate Governance Report
Financial25 Financial Reports
Contents
Printed on environmentally friendly paper

“ All other elements that come into this ‘super-white’ structure will become elements of identifiable life, they will play and interact with the white grid and its green figures. ”
Jean NouvelPritzker Prize-winning architect of the Le Nouvel Ardmore,
freehold luxury residences par excellence

overviewThe lackluster performance of global economies this year resulted in a decline in overall property transaction volume for the Group. Under prevailing business conditions and with cooling measures still in place, the Group braced itself for moderate success in a trying operating environment. The Singapore economy grew by 2.8% in 2014. In the second quarter of 2015, it reported weak growth of 1.7% on a year-on-year basis, lower than the 2.8% growth in the previous quarter. Faced with economic volatility in global market conditions, the Ministry of Trade and Industry has maintained its economic growth forecast at 2.0% to 2.5% for 2015.
URA’s private residential property index decreased by 0.9% in the second quarter of 2015; this is the seventh straight quarter of price decline across all segments of the private residential property market. In the first half of 2015, the total number of new residential units sold in Singapore was 3,427, as compared to 4,409 units a year ago.
In Malaysia, cautious buying sentiment in the property market remains as a result of credit tightening rules by Bank Negara. In China, although residential sales are expected to improve with some relaxation of home purchase restrictions in certain cities, the government is expected to maintain its policy of ensuring stability of the real estate market.
GrouP PerformANceFor the financial year ended 30 June 2015, the Group recorded a total revenue of S$676.7 million, a 16% decrease from the S$803.4 million revenue recorded in the
previous year. Revenue for the current year was mainly attributable to the progressive sales recognised from The Tembusu, the additional units sold in Le Nouvel Ardmore, Foresque Residences and Helios Residences in Singapore and The Lakeview in China.
The Group’s operating profit decreased by 48% from S$197.6 million to S$103.3 million, in line with the lower revenue. In the current year, the Group’s operating profit includes fair value gains on investment properties of S$12.5 million, as compared to S$11.1 million gains in the previous year.
The Group’s share of profits of associated and joint venture companies decreased by 23% to S$119.3 million in the current year. This decrease is primarily due to the lower share of profit from Wing Tai Properties Limited in Hong Kong.
The Group’s net profit attributable to shareholders for the current year is S$150.3 million, a decrease of 41% over the net profit of S$254.4 million recorded in the previous year.
The Group’s net asset value per share as at 30 June 2015 was S$4.07 as compared to S$3.78 as at 30 June 2014.
The Group’s net gearing ratio has been reduced to 0.10 times as at 30 June 2015 from 0.16 times as at 30 June 2014.
DiviDeNDThe Board recommended a first and final dividend of 3 cents per share. This payout is consistent with the Group’s dividend policy in the exercise of financial discipline. The Group aims to maximise shareholder value in a balanced measure of profitability and prudence.
The Group has demonstrated resilience and fortitude. It is committed to achieving business excellence... it consistently delivers premier products and services of uncompromised quality and design elegance to its customers.
chAirmAN’s messAGe
Strategic review
2 WING TAI HOLDINGS LIMITED

of exceLLeNce AND eLeGANceDespite the weak economic climate during the year in review, the Group achieved a total sales value of S$417 million with 436 homes transacted in Singapore, Malaysia and China.
The Group has exposure in the mid and high-end segments with properties of exceptional qualities that are especially rare in Asia, such as the Le Nouvel Ardmore and The Crest in Singapore. In Malaysia and China, it has maintained a mindful exposure across different segments of the growth markets.
The Group remains committed to the strategies it has mapped out. It has a strong balance sheet with low net gearing, poised to take advantage of arising opportunities in the region.
In its investment property portfolio, the Group’s commercial developments and serviced apartments continued to do well, earning revenue of S$37.5 million. Through its branded chain of hotels and serviced apartments, Lanson Place has achieved consistently high occupancies and expanded its management contracts.
The Group is consolidating its retail business to stay relevant and focus on stores that yield positive returns. It will further streamline operations and develop the knowledge and skills of its staff, to be even more competitive in the evolving retail landscape.
In the face of unprecedented challenges, the Group has demonstrated resilience and fortitude. It is committed to achieving business excellence. Upholding its brand promise, it consistently delivers premier products and services of uncompromised quality and design elegance to its customers.
ProsPectsThe Wing Tai Asia brand is thus strengthened across its key markets. The Group will continue to work with its valued partners to capitalise on expertise and insights in the growth markets. It will also strengthen its talent pool and staff capability to adroitly respond to new challenges ahead.
corPorAte citizeNryThe Group cares for its community through corporate citizenry programmes of the Wing Tai Foundation, which grants financial aid to the needy elderly and needy young. It will continue to build on its community partnerships to give back to society.
APPreciAtioN On behalf of the Board, I thank our customers, tenants, bankers and business partners for their patronage and support. To our directors, management and staff, I thank them for their dedication, commitment and perseverance.
I especially appreciate the confidence and support of our shareholders as we push ahead to transform the business in these challenging times. With your encouragement, the Group shall make steady strides on its continuing growth strategy.
CheNg Wai KeuNgChairman16 september 2015
ANNUAL REPORT 2015 | Of EXCELLENCE & ELEGANCE 3
boArD of Directors
Strategic review
edmuNd CheNg Wai WiNg
Edmund Cheng Wai Wing has served as the Deputy Chairman and Deputy Managing Director of the Company, and as the Executive Director of Wing Tai Malaysia Berhad since 1984. He is also the Chairman of SATS Ltd., a company listed on the SGX-ST, and Mapletree Investments Pte Ltd. He is a member of The Esplanade Co Ltd and the Global Council for Asia Society. He was the President of REDAS (Real Estate Developers’ Association of Singapore) and now serves as a member on its Presidential Council. For his contribution to public service, he was awarded the Meritorious Service Medal in 2015, Public Service Star Award (Bar) in 2010, Public Service Star Award (BBM) in 1999 and Outstanding Contribution to Tourism Award in 2002 by the Singapore Government. Mr Cheng graduated from Northwestern University and Carnegie Mellon University in USA, with a Bachelor’s degree in Civil Engineering and a Master’s degree in Architecture, respectively. Mr Cheng was re-elected a director on 28 October 2014.
Boey TaK hap
Boey Tak Hap has served as a Non-Executive Director since 2 May 1997. He is a member of both the Audit & Risk Committee and Remuneration Committee. Mr Boey was formerly the Chief of Army, Singapore Armed Forces and the President and CEO of the Singapore Power Group. He was also the President and CEO of SMRT Corporation as well as Chief Executive of the Public Utilities Board. Mr Boey graduated from the University of Manchester Institute of Science and Technology with a Bachelor of Science degree in Automatic Control and System Engineering with Management Sciences. In January 2002, he was conferred Honorary Doctor of Engineering by his alma mater. He also holds a Diploma in Business Administration from the National University of Singapore and attended the Harvard Business School’s Advanced Management Programme in Boston, USA. Mr Boey was re-elected a director on 28 October 2014.
CheNg Wai KeuNg
Cheng Wai Keung is the Chairman of the Board of Wing Tai Holdings Limited (the “Company”), appointed since 1994. He is also the Managing Director of the Company and a member of the Nominating Committee. Mr Cheng is also the Deputy Chairman of Temasek Holdings (Private) Limited, Vice Chairman of Singapore-Suzhou Township Development Pte Ltd, and Managing Director of Wing Tai Malaysia Berhad, a company listed on the Bursa Malaysia Securities Berhad. He holds directorships in public and private companies, including Singapore Health Services Pte Ltd, and has served on the boards of several government organisations. He was awarded the Distinguished Service Order (DUBC) by the Singapore Government in August 2007, Public Service Star (Bar) (BBM-Lintang) in 1997 and Public Service Star (BBM) in 1987. He has been appointed Justice of The Peace by the Singapore President since 2000. Mr Cheng graduated with Masters of Business Administration from the University of Chicago, after obtaining his Bachelor of Science degree from Indiana University. Mr Cheng was re-elected a director on 30 October 2012.
4 WING TAI HOLDINGS LIMITED
CheNg maN TaK
Cheng Man Tak has served as a Non-Executive Director since 11 May 1981. He is the Vice Chairman of the Federation of Hong Kong Industries – Group 24 and a Director of the Federation of Hong Kong Garment Manufacturers. He is also an authority member of the Clothing Industry Training Authority and a committee member of the Federation of Hong Kong Industries in Hong Kong. Mr Cheng graduated from the University of Southern California with a Bachelor of Science degree and holds a Master’s degree in Business Administration from Pepperdine University, USA. Mr Cheng was re-elected a director on 25 October 2013.
Lee Kim Wah
Lee Kim Wah has been appointed the Senior Advisor to the Company since 5 December 2008 and remains on the Board as a Non-Executive Director. He is the Chairman of the Nominating Committee and a member of the Remuneration Committee. He serves as the Treasurer of the Singapore National Employers Federation. Educated in Accountancy in Australia, Mr Lee was a manager in a public accounting firm before joining the Company, where he has served for over 40 years, as the Finance Director from May 1977 to December 2008. Mr Lee was conferred the Public Service Medal (PBM) by the Singapore Government in 2000. In 2009, he was awarded the prestigious Medal of Commendation (Gold) for his significant contribution towards the Singapore Labour Movement. Mr Lee was re-elected a director on 28 October 2014.
ChrisTopher Lau LoKe sam
Christopher Lau Loke Sam joined the Board as a Non-Executive Director on 28 October 2013. He has been appointed as the Chairman of the Audit & Risk Committee as well as a member of the Nominating Committee. He is a Senior Counsel and an Independent Arbitrator. He has been in practice for over 35 years and his arbitration practice encompasses all aspects of commercial disputes. Mr Lau is also a Non-Executive Director of Singapore Technologies Marine Ltd and the Chairman of its Risk and Audit Committee. He currently serves as the Vice Chairman of the Council for Estate Agencies’ Appeals Board and is a member of several international arbitral institutions. Mr Lau is a former Judicial Commissioner of the Supreme Court of Singapore and a former Chairman of the Chartered Institute of Arbitrators (Singapore) Limited. He was also an Independent Non-Executive Director of Neptune Orient Lines Limited between May 2004 and April 2013. He was called to the English Bar in 1972 and the Singapore Bar in 1975. Mr Lau was re-elected a director on 28 October 2014.
ANNUAL REPORT 2015 | Of EXCELLENCE & ELEGANCE 5

Strategic review
Board oF direCTors
TaN hWee BiN
Tan Hwee Bin has been appointed as an Executive Director of the Company since 5 December 2008. Prior to her appointment to the Board, Ms Tan was the Chief Operating Officer of the Company. Ms Tan is the Chairman of NTUC Health Co-operative Ltd. She serves as a Director of the Singapore Labour Foundation and Agency for Integrated Care Pte Ltd. She is a Council Member of Singapore National Employers Federation. She has also served in the Chinese Development Assistance Council and the Central Singapore Community Development Council, as well as on the board of NTUC Fairprice Co-operative Ltd. She was awarded the Public Service Medal (PBM) by the Singapore Government in 2011. Ms Tan is a Certified Public Accountant and holds a Bachelor of Accountancy degree from the National University of Singapore. She has also completed the Advanced Management Program at Harvard Business School in Boston, USA. Ms Tan was re-elected a director on 30 October 2012.
pauL hoN To ToNg
Paul Hon To Tong has served as a Non-Executive Director since 16 August 2007 and is a member of both the Audit & Risk Committee and Nominating Committee. Mr Tong is currently a Non-Executive Director of Chinney Investments, Limited, publicly listed on the Stock Exchange of Hong Kong. He has many years of senior management experience in manufacturing and trading businesses with global operations. He was formerly the Executive Vice President and General Counsel of Johnson Electric Holdings Limited. He also served as a member on the Inland Revenue Board of Review in Hong Kong. Mr Tong obtained his Bachelor of Science (Economics) degree and postgraduate Certificate of Management Studies from the University of London and the University of Oxford in England, respectively. He was admitted as a Barrister of the Middle Temple in England, the Supreme Court of Hong Kong and the High Court of Australia. He is also a Certified Public Accountant of The Hong Kong Institute of Certified Public Accountants and an Associate Member of The Institute of Chartered Secretaries and Administrators. Mr Tong was re-elected a director on 25 October 2013.
Loh soo eNg
Loh Soo Eng has served as a Non-Executive Director since 1 June 2004, after retiring as the Director-Property of the Company. He is the Chairman of the Remuneration Committee and a member of the Audit & Risk Committee. He has experience in power, oil, shipbuilding and ship repair industries as well as in banking, where he had been for 17 years with the DBS Group as the Executive Director of Raffles City Pte Ltd and the General Manager of DBS Land. Mr Loh has served on government committees, including the SAFTI Military College and Temasek Polytechnic. He was the Chairman of SLF Properties Pte Ltd and SLF Management Services Pte Ltd, and was the President of the Real Estate Developers’ Association of Singapore (REDAS) from 2001 to 2003. He graduated with a Bachelor of Engineering (Mechanical) degree from the University of Adelaide, Australia. Mr Loh was re-elected a director on 28 October 2014.
6 WING TAI HOLDINGS LIMITED
daTo’ roger ChaN WaN ChuNgDato’ Roger Chan Wan Chung joined Wing Tai Malaysia Berhad as the General Manager in June 1971 and is a pioneer staff of the Company. With over 40 years of business experience in Malaysia, he assists the Managing Director in overseeing the day-to-day operation of the Wing Tai Malaysia Berhad group. He was appointed to the board of Wing Tai Malaysia Berhad in August 1988 and currently sits on the boards of several subsidiaries of the group.
hooN TeCK miNgHoon Teck Ming joined Wing Tai Property Management Pte Ltd as the Property Director in October 2013. He is responsible for the project and property management of the Company’s development projects. A Professional Engineer (Civil) with close to 30 years’ experience, he was named Outstanding Leader in Creation of Urban Real Estate Value and Real Estate Meritorious Character of the Year by Chengdu TV (2010–2012). Mr Hoon graduated from the National University of Singapore with a Bachelor of Civil Engineering (First Class Honours) degree and a Master’s degree in Science (Civil Engineering). He is a senior member of The Institution of Engineers, Singapore.
heLeN ChoWHelen Chow is a Director of Wing Tai Property Management Pte Ltd appointed since November 1991, having held various positions in the Company since 1975. She is responsible for marketing and sales functions in the property division. She develops and implements strategies to achieve optimal marketing mix for property products, as well as manages sales operations across geographies to achieve revenue goals. She holds a Bachelor of Arts degree from Mills College, Oakland, California, USA.
heLeN KhooHelen Khoo is the Executive Director of Wing Tai Retail Pte Ltd and drives the growth and expansion of the Company’s portfolio of retail brands. She was conferred the Miflora M. Gatchalian Medal for Women Global Quality Leadership 2013 and Achievers & Leaders Award (Business Leadership) 2012. A member of the Civil Service College board, the National Productivity and Continuing Education Council and ITE’s Business & Services Academic Advisory Committee, she is also the Honorary Secretary of the Singapore Retailers Association and the Orchard Road Business Association. Mrs Khoo graduated with a Bachelor of Arts (Honours) degree from the University of Hong Kong.
LeN sieW LiaNLen Siew Lian is the General Manager (Property) of Wing Tai Holdings Limited. She oversees the commercial properties and serviced apartments in Singapore and Malaysia. She is also responsible for sales and marketing of residential development projects in Suzhou and Shanghai. Ms Len graduated with a Bachelor of Science (Estate Management) degree from the National University of Singapore and, in 2008, completed the Advanced Management Program at Harvard Business School. She has been with the company since 1989.
sTaCey oW yeoNg suiT yeNgStacey Ow Yeong Suit Yeng joined Wing Tai Property Management Pte Ltd as the General Manager, Marketing in August 2014. She is responsible for the sales and marketing of the Company’s portfolio of residential properties in Singapore and Malaysia. She has over 25 years of sales and marketing experience, including 10 years in the residential and integrated properties industry in Asia and the Middle East. Ms Ow Yeong graduated with a Bachelor of Arts degree from the National University of Singapore.
Ng Kim huaTNg Kim Huat is the Chief Financial Officer of Wing Tai Holdings Limited. He has been with the Company since December 2003 and oversees financial reporting and controls, treasury, information technology and tax functions. He has more than 10 years’ auditing experience with an international public accounting firm in Singapore as a Certified Public Accountant. He graduated with a Bachelor of Accountancy (Honours) degree from the National University of Singapore.
KariNe LimKarine Lim is the General Manager, Group Human Resource of Wing Tai Holdings Limited. She has been with the Company since March 2004 and has more than 20 years’ human resource management experience in the retail, property and public transport industries. Ms Lim graduated with a Bachelor of Arts (Honours) degree from the National University of Singapore and acquired a Diploma in Human Resource Management from the Singapore Human Resource Institute.
key mANAGemeNt
ANNUAL REPORT 2015 | Of EXCELLENCE & ELEGANCE 7

corPorAte DAtA
Strategic review
Board oF direCTors
executiveCheng Wai Keung Chairman/ Managing Director
Edmund Cheng Wai Wing Deputy Chairman/Deputy Managing Director
Tan Hwee Bin Executive Director
Non-executive Boey Tak Hap Independent
Cheng Man Tak
Christopher Lau Loke SamIndependent
Lee Kim WahIndependent
Loh Soo EngIndependent
Paul Hon To TongLead Independent DirectorIndependent
audiT & risK CommiTTee
Christopher Lau Loke Sam Chairman
Boey Tak Hap
Loh Soo Eng
Paul Hon To Tong
NomiNaTiNg CommiTTee
Lee Kim WahChairman
Cheng Wai Keung
Christopher Lau Loke Sam
Paul Hon To Tong
remuNeraTioN CommiTTee
Loh Soo Eng Chairman
Boey Tak Hap
Lee Kim Wah
CompaNy seCreTaries
Gabrielle Tan
Ooi Siew Poh
regisTered oFFiCe
3 Killiney Road #10-01 Winsland House I Singapore 239519 Tel : 6280 9111 Fax: 6732 9956 www.wingtaiasia.com.sg
share regisTrar
Tricor Barbinder Share Registration Services (A division of Tricor Singapore Pte. Ltd.) 80 Robinson Road #02-00 Singapore 068898
audiTors
PricewaterhouseCoopers LLP Public Accountants and Certified Public Accountants 8 Cross Street #17-00 PWC Building Singapore 048424 Audit Partner: Choo Eng Beng (Year of Appointment: 2011)
priNCipaL BaNKers
DBS Bank Limited12 Marina Boulevard DBS Asia Central @ Marina Bay Financial Centre Tower 3Singapore 018982
the Hongkong and Shanghai Banking corporation Limited21 Collyer QuayHSBC BuildingSingapore 049320
Malayan Banking Berhad2 Battery RoadMaybank TowerSingapore 049907
Overseas-chinese Banking corporation Limited65 Chulia StreetOCBC CentreSingapore 049513
the Bank of tokyo-Mitsubishi UFJ, Ltd 9 Raffles Place #01-01 Republic PlazaSingapore 048619
United Overseas Bank Limited80 Raffles Place UOB PlazaSingapore 048624
8 WING TAI HOLDINGS LIMITED

siNGAPore In the year under review, the Group’s residential properties continued to generate buyer interest and fair sales; remaining units at Foresque Residences, L’Viv and Helios Residences were all successfully sold.
Le Nouvel Ardmore, designed by Pritzker Prize laureate Jean Nouvel, is a 43-unit freehold development at Ardmore Park. Private previews of the development commenced in March 2015 and four units were sold as at 30 June 2015; marketing activities have been planned for the next financial year.
The adjacent development also designed by Jean Nouvel, Nouvel 18 at Anderson Road, a joint venture freehold development with City Developments Limited, obtained its Temporary Occupation Permit in November 2014. The launch strategy is currently being assessed.
OPeratiNg aND FiNaNciaL review
ProPerty
Resembling elevated bungalows, each of the 43 apartments at the Le Nouvel Ardmore features spacious interiors and its own unique orientation, maintaining a heightened sense of privacy and exclusiveness.
ANNUAL REPORT 2015 | Of EXCELLENCE & ELEGANCE 9

PROPERTY
OPERATING AND FINANCIAL REvIEw
The Crest, located at Prince Charles Crescent in the tranquil Jervois precinct fronting the good class bungalows of Chatsworth and Bishopsgate estates, is a leasehold development with 469 units comprising three 23-storey towers and four 5-storey island villas. Designed by Toyo Ito, who was awarded the Pritzker Prize in 2013, the development was almost 20% sold as at 30 June 2015. Previews are being conducted in Singapore and regional markets viz. Malaysia, China, Indonesia and Hong Kong. Temporary Occupation Permit for this premier residential development is expected to be obtained in the fourth quarter of 2016.
The Tembusu, a 337-unit freehold development comprising five 18-storey towers and one commercial unit, is situated at the Company’s former headquarter site on Tampines Road. The project was over 90% sold. Temporary Occupation Permit is expected to be obtained in the fourth quarter of 2016.
The Group’s investment properties Winsland House I and Winsland House II achieved average occupancy of around 95%.
Low-rise island villas nestled amid lush greenery and the waterscape of The Crest, connecting private living space to natural elements.
The Group’s investment properties Winsland House I and Winsland House II achieved average occupancy of around 95%.
10 WING TAI HOLDINGS LIMITED

In Penang, Phase 4 of Taman Bukit Minyak Utama, comprising 98 units of 2-storey terrace houses and 3-storey semi-detached houses, was close to 90% and 100% completed, respectively, for Phase 4A and Phase 4B, and 45% sold. Phase 5 will comprise 97 units of 2-storey terrace houses and 2-storey semi-detached houses, and is yet to be launched.
Mahkota Impian comprises three high-rise blocks of 360 units located within a 7.36-acre mixed development. As at 30 June 2015, the first block comprising 112 units was more than 60% sold and the second block comprising 136 units was 30% sold. The third block comprising 112 units is not yet launched. Impiana Commercial Hub comprises 2- and 3-storey shop offices along Jalan Rozhan namely Impiana Boulevard, Impiana Avenue and Impiana Gallery. These were 80%, 95% and close to 60% sold, respectively, as at 30 June 2015.
mALAysiA The Group’s property business activities in Malaysia are conducted through its subsidiary company, Wing Tai Malaysia Berhad.
Le Nouvel KLCC, a high-end 195-unit freehold development at Jalan Ampang in Kuala Lumpur also designed by Jean Nouvel, is currently under construction. Completion is expected in the first quarter of 2016. A launch strategy dovetailing with that of the Le Nouvel Ardmore in Singapore is tentatively scheduled after the completion.
Also in Kuala Lumpur, Verticas Residensi, a 423-unit freehold development comprising three 43-storey towers and one 9-storey tower at Bukit Ceylon in Kuala Lumpur, was 95% sold as at 30 June 2015. Nobleton Crest, a 25-unit freehold development located within the prestigious Ampang and Jalan U-Thant district was close to 20% sold.
Comprising 25 exclusive residential apartments, Nobleton Crest is located in Jalan U-Thant, the diplomatic enclave of Kuala Lumpur, minutes from the iconic Petronas Twin Towers.
Verticas Residensi, a 423-unit freehold development at Bukit Ceylon in Kuala Lumpur, was 95% sold.
ANNUAL REPORT 2015 | Of EXCELLENCE & ELEGANCE 11

chiNAThe Group’s property business activities in China are conducted through its subsidiary companies, Jiaxin (Suzhou) Property Development Co., Ltd, Wing Tai (China) Investment Pte Ltd and Wing Tai China Pte Ltd.
In Suzhou, Phase 3 of The Lakeview, which comprises 190 units in two residential towers, was 90% sold as at 30 June 2015. The final tranche of remaining units has been released for sale.
In Shanghai, planning approval was obtained for the choice residential site in Luodian New Town of Baoshan District to be developed into 301 units of low- to mid-rise housing comprising terraced houses, duplexes and apartments. Piling work has commenced, and a sales launch is planned towards the second half of 2016, subject to the prevailing market sentiment.
The commercial site at Madang Road and Jian Guo Dong Road, in the vicinity of Huai Hai Middle Road in Shanghai Huangpu District will be developed into a destination retail and office development with over 473,000 square feet of construction floor area. Construction is expected to commence in the first quarter of 2016 and scheduled to be completed by end 2019.
In Guangzhou, Horizon Lakeview in the Sino-Singapore Guangzhou Knowledge City comprising 2,185 apartments and 24 terraced units will be built and launched in phases. Of the initial release of 182 units, 45% have been sold. The first batch of units is expected to be ready for handover to owners by June 2016.
OPeratiNg aND FiNaNciaL review
properTy
Horizon Lakeview comprises 2,185 apartments and 24 terraced units.
Horizon Lakeview in the Sino-Singapore Guangzhou Knowledge City will be built and launched in phases.
12 WING TAI HOLDINGS LIMITED

hoNG koNGThe Group’s property interests in Hong Kong are represented by investment in its associated company, Wing Tai Properties Limited.
As at 30 June 2015, The Warren, The Pierre, Providence Bay, Providence Peak and The Graces were between 80% to 95% sold; Seymour was fully sold.
Homantin Hillside is a residential site in Hung Hom, in close proximity to the future Ho Man Tin MTR interchange station. The development comprises 173 units with gross saleable area of 128,000 square feet. Construction is in progress and completion is expected in 2016.
At Kau To, Shatin, foundation works for two low-density high-end residential sites are in progress and the projects are scheduled for completion in 2017.
The prime harbourfront residential site in Shau Kei Wan and a low-density residential site at Siu Sau, Tuen Mun, are scheduled for completion in 2018 and 2019, respectively.
The Group’s luxury project located in Pudong, Shanghai, is undergoing interior fitting out works scheduled for completion in 2015. Upper Riverside is a joint venture project with Nan Fung Group comprising 97 apartment units with a gross floor area of 210,000 square feet.
The investment properties viz. Landmark East in Kowloon East and W Square in Wan Chai continued to record positive results, achieving average occupancy of 95%.
Completion of the interior fitting out works at Upper Riverside, located in Shanghai’s Pudong district, is expected in 2015.
The investment properties viz. Landmark East in Kowloon East and W Square in Wan Chai continued to record positive results, achieving average occupancy of 95%.
ANNUAL REPORT 2015 | Of EXCELLENCE & ELEGANCE 13
hosPitALity
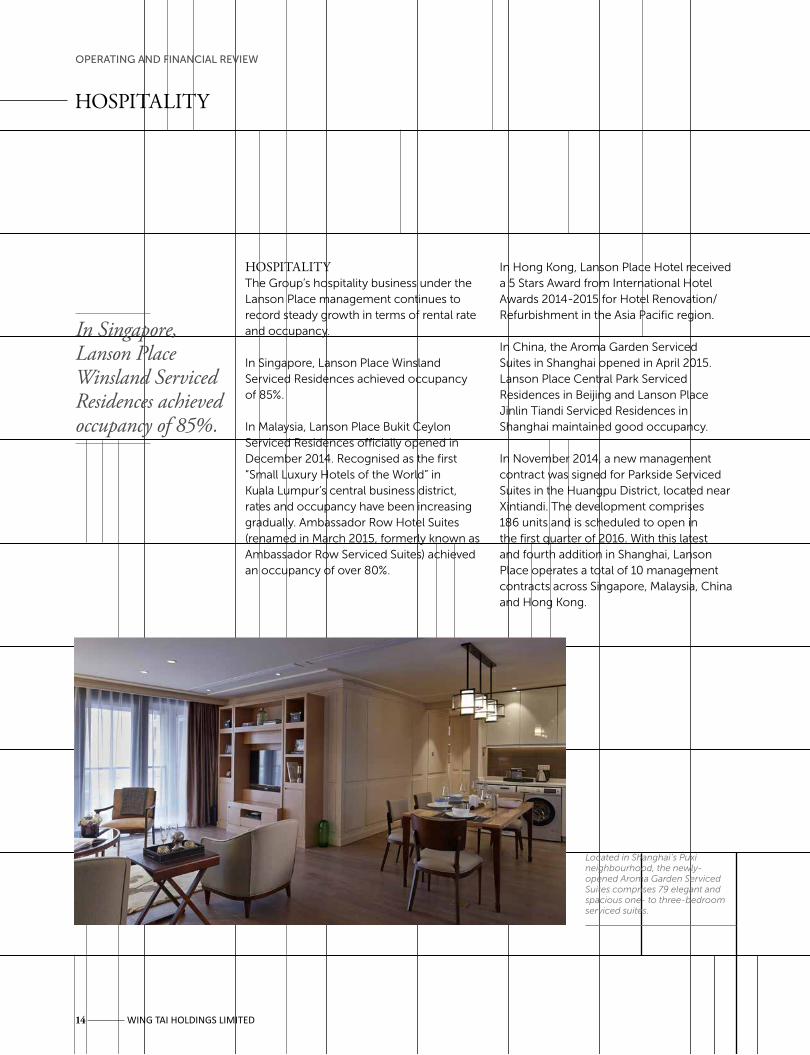
hosPitALityThe Group’s hospitality business under the Lanson Place management continues to record steady growth in terms of rental rate and occupancy.
In Singapore, Lanson Place Winsland Serviced Residences achieved occupancy of 85%.
In Malaysia, Lanson Place Bukit Ceylon Serviced Residences officially opened in December 2014. Recognised as the first “Small Luxury Hotels of the World” in Kuala Lumpur’s central business district, rates and occupancy have been increasing gradually. Ambassador Row Hotel Suites (renamed in March 2015, formerly known as Ambassador Row Serviced Suites) achieved an occupancy of over 80%.
OPeratiNg aND FiNaNciaL review
In Hong Kong, Lanson Place Hotel received a 5 Stars Award from International Hotel Awards 2014-2015 for Hotel Renovation/ Refurbishment in the Asia Pacific region.
In China, the Aroma Garden Serviced Suites in Shanghai opened in April 2015. Lanson Place Central Park Serviced Residences in Beijing and Lanson Place Jinlin Tiandi Serviced Residences in Shanghai maintained good occupancy.
In November 2014, a new management contract was signed for Parkside Serviced Suites in the Huangpu District, located near Xintiandi. The development comprises 186 units and is scheduled to open in the first quarter of 2016. With this latest and fourth addition in Shanghai, Lanson Place operates a total of 10 management contracts across Singapore, Malaysia, China and Hong Kong.
Located in Shanghai’s Puxi neighbourhood, the newly- opened Aroma Garden Serviced Suites comprises 79 elegant and spacious one- to three-bedroom serviced suites.
In Singapore, Lanson Place Winsland Serviced Residences achieved occupancy of 85%.
14 WING TAI HOLDINGS LIMITED

retAiL
retAiLThe Group’s retail division continued to keep its place as a leading retailer in Singapore and Malaysia. As at 30 June 2015, the Group’s retail footage spanned over 924,000 square feet with 255 stores, with a portfolio of 17 brands in Singapore and 12 in Malaysia.
A new loyalty programme wt+ was launched in April 2015, creating an innovative new platform for customers to enjoy cross-brand privileges of the Group’s fashion and lifestyle brands.
In October 2014, high street fashion brand, Dorothy Perkins embarked on an e-commerce initiative with Zalora, an Asia online fashion retailer. Its success viz. profit returns, brand visibility, customer engagement and ability to attract new customers on e-commerce platform for Singapore and Malaysia markets saw the possibility and opportunity to include additional brands on Zalora. This will be rolled out progressively in the second half of 2015.
Japanese brand Uniqlo continued to expand its footprint in both Singapore and Malaysia, from 18 in each to 23 and 25 stores, respectively. The launch of Uniqlo’s e-commerce platform in September 2014 further heightened the brand’s visibility in the market.
With the shift in consumption habits and falling tourist arrivals in Singapore, the Group’s retail division is focused on allocating resources in markets, brands and business activities that remain relevant.
Dorothy Perkins’ e-commerce success generated profit returns, brand visibility and customer appeal and engagement.
The Group’s retail footage spanned over 924,000 square feet with 255 stores, with a portfolio of 17 brands in Singapore and 12 in Malaysia.
ANNUAL REPORT 2015 | Of EXCELLENCE & ELEGANCE 15

cALeNDAr of eveNts
OPeratiNg aND FiNaNciaL review
JuLy 2014
Awarded Arts Supporter Award conferred by National Arts Council, Singapore
Winsland House II accorded GoldPlus in BCA Green Mark Award, Singapore
Retail brand Yoshinoya awarded Outstanding Business with Families Mark Certification, Singapore
augusT 2014
Announcement of full-year results for year ended 30 June 2014, Singapore
L’Viv accorded Star rating for BCA Quality Mark for Good Workmanship, Singapore
sepTemBer 2014
Retail brand Uniqlo launched e-commerce platform, Singapore
oCToBer 2014
50th Annual General Meeting, Singapore
Awarded Runner-up in Most Transparent Company Award (Real Estate) at SIAS Investors’ Choice Awards, Singapore
Retail brand Dorothy Perkins launched e-commerce initiative on Zalora, followed by Warehouse in June 2015, Singapore
NovemBer 2014
Received Extraordinary Employer Award from National Kidney Foundation, Singapore
Nouvel 18 obtained Temporary Occupation Permit, Singapore
deCemBer 2014
Organised Wing Tai-Boys’ Brigade Share-A-Gift project to support needy members in the community, Singapore
marCh 2015
Participated in Earth Hour to support environmental sustainability, Singapore
The Tembusu accorded Gold in BCA Green Mark Award, Singapore
apriL 2015
Retail division launched its new rewards programme wt+, Singapore
Lanson Place Hospitality Management Limited unveiled Aroma Garden Serviced Suites, Shanghai
JuNe 2015
Group corporate social responsibility event held at Willing Hearts soup kitchen, where staff prepared meals for the needy in the community, Singapore
16 WING TAI HOLDINGS LIMITED

wiNG tAi fouNDAtioNThe Group is committed to fulfilling its corporate social responsibility (CSR) through the Wing Tai Foundation, which extends assistance to the community through financial aid and donations to the needy elderly and needy young. By this, it recognises the contributions of the elderly to Singapore’s progress and nation-building, and aspires to nurture the younger generation.
The Wing Tai Foundation funds the needy elderly at Kidney Dialysis Foundation and contributed towards educational development for needy students through the Chinese Development Assistance Council, among others.
In the year under review, the Group participated in the Wing Tai-Boys’ Brigade Share-A-Gift project aimed at collecting food and daily necessities for the less fortunate young and old. Additionally, over 100 staff volunteered at the Willing Hearts soup kitchen, a wholly volunteer-based non-profit organisation which provides daily meals and support services to the needy elderly in the community.
The Group believes in giving back and caring for its society. Through the Wing Tai Foundation, the Group continues to fulfil its corporate citizenry role in improving the lives of the less privileged young and elderly in the community.
corPorAte sociAL resPoNsibiLity
Staff volunteered at the Willing Hearts soup kitchen, helping with the cooking, cleaning, packing and delivery of meals to almost 5,000 beneficiaries.
ANNUAL REPORT 2015 | Of EXCELLENCE & ELEGANCE 17

corPorAte GoverNANcerePort
cOrPOrate gOverNaNce
Directors’ attendance at Board and Board committee Meetings for FY2015
Name Board Audit & Risk Committee
Remuneration Committee
NominatingCommittee
MeetingsHeld: 4
MeetingsHeld: 4
MeetingsHeld: 2
MeetingsHeld: 1
MeetingsAttended
MeetingsAttended
MeetingsAttended
MeetingsAttended
Cheng Wai Keung 4 1Edmund Cheng Wai Wing 4Boey Tak Hap 4 4 2Cheng Man Tak 4Christopher Lau Loke Sam 4 4 1Lee Kim Wah 4 2 1Loh Soo Eng 4 4 2Paul Tong 4 4 1Tan Sri Dato’ Mohamed Noordin bin Hassan# 2 1 1Tan Hwee Bin 4
# Retired on 28 October 2014
Matters which require the Board’s approval include those involving material acquisitions and disposal of assets, dividends and other returns to shareholders, fund raising exercises, corporate and financial restructuring and interested person transactions of a material nature. A Director’s contribution may extend beyond the confines of formal Board meetings, through the sharing of views, advice, experience, and strategic networking relationships which would further the interests of the Company.
The Board is responsible for the overall strategy and direction of the Group and is regularly updated on changes to regulations and accounting standards. Where regulatory changes have an important bearing on the Company’s or Directors’ disclosure obligations, Directors are briefed during Board meetings. Newly appointed Directors are given orientations/briefings by the Management on their duties as a director and how to discharge those duties and the Group’s business, directions and policies, and are encouraged to attend courses organised by the Singapore Institute of Directors as well as other relevant organisations. For first-time directors, the Company provides training in areas such as accounting, legal and industry-specific knowledge as appropriate. It is important that every Director receives further relevant training, particularly on relevant new laws, regulations and changing commercial risks from time to time. The Company Secretary keeps the Directors informed as and when there are appropriate courses, conferences and seminars such as those conducted by the Singapore Institute of Directors. The Directors are encouraged to attend
The Company recognises the importance of good corporate governance and is committed to continuously maintaining high standards of corporate governance, which is essential to ensuring the sustainability of the Company’s businesses and performance as well as safeguarding shareholders’ interests and maximise long-term shareholder value. The principles, structures and processes of corporate governance as adopted by the Company are set out in this report which is in line with the principles and guidelines of the Code of Corporate Governance 2012 (the “Code”).
boArD mAttersthe Board’s conduct of its affairsThe board of directors (the “Board” or “Directors”) is responsible for the overall management of the Company, and the Directors objectively make decisions in the interests of the Company. The Board continues to set the Company’s values and standards to ensure obligations to shareholders and other stakeholders are properly understood and met. The principal functions of the Board include approving strategic business plans and major acquisitions or disposal of assets, reviewing Management performance, reviewing the Group’s corporate policies and financial performance, approving quarterly and annual financial results of the Group, and establishing a framework of prudent and effective controls to assess and manage risk. The Board conducts regular meetings on a quarterly basis and as necessary when circumstances arise. A total of four Board meetings were held in FY2015. Details of attendance of the Directors at the Board and Board Committee meetings for the year are as follows:
18 WING TAI HOLDINGS LIMITED

and experience are extensive and complementary, to be appropriate. The Board will examine its size and composition whenever circumstances require. No individual or smaller group of individuals dominates the Board’s decision-making process. chairman and Managing DirectorThe Chairman of the Board is also the Managing Director (“MD”) of the Group and has overall responsibility for the management and operation of the Group supported by the respective Heads of Departments. To address the issue of independence since the Chairman and MD is the same person, the Board has appointed Mr Paul Tong as Lead Independent Director to serve as a sounding board for the Chairman and also as an intermediary between the non-executive Directors and the Chairman. In addition, Mr Paul Tong is available to shareholders where they have concerns and for which contact through the normal channels of the executive Directors or the chief financial officer (the “CFO”) has failed to resolve or is inappropriate.
Mr Cheng Wai Keung’s primary role as Chairman of the Board is to assist the Board in developing policies and strategies and ensuring that they are implemented effectively. Mr Cheng also provides leadership to the Board and ensures that Board meetings are held when necessary and that Board members are provided with complete, adequate and timely information. As the MD, he makes key decisions on the management and operations of the Group and is responsible for the conduct of the business and affairs of the Group, supported by the respective Heads of Departments. The sustained growth of the Company under Mr Cheng’s leadership shows his ability to discharge the responsibilities of both roles effectively.
boArD committeesTo assist the Board in the execution of its responsibilities, the Board delegates specific functions to the various Board committees, namely, the Audit & Risk Committee, the Nominating Committee and the Remuneration Committee. Each of these committees has its own terms of reference and reports its activities regularly to the Board.
Nominating committeeBoard MembershipThe Nominating Committee (“NC”) comprises four members, namely, Mr Lee Kim Wah - Chairman of the NC, Mr Christopher Lau Loke Sam, Mr Paul Tong (all of whom are independent non-executive Directors, and Mr Paul Tong is the Lead Independent Director) and Mr Cheng Wai Keung.
such training at the Company’s expense. During FY2015, the Directors attended the “ACRA-SGX-SID: Audit Committee Seminar - Preparing for 2015”, a session on “Hay Group Director & Executive Remuneration Survey Re-evaluating Rewards” and a training session conducted by KPMG on “Risk Management”. Upon appointment of each Director, the Company will provide a formal letter to the Director, setting out the Directors’ duties and obligations.
Board composition and BalanceThe Board currently comprises a majority of non-executive Directors, with more than one-half of the Board being independent Directors. The Nominating Committee reviews the independence of each Director annually based on the definition of “independence” as stated in the Code to ensure that there is a strong and independent element on the Board. Pursuant to the Code, an “independent” director is one who has no relationship with the company, its related companies, its 10% shareholders or its officers that could interfere, or be reasonably perceived to interfere, with the exercise of the Director’s independent business judgement with a view to the best interests of the company.
When considering the independence of the Directors, the NC also reviews the annual declaration by the independent non-executive Directors regarding their independence and the Directors’ disclosures of interests in transactions. There are currently nine members on the Board, three of whom are executive Directors and five are independent non-executive Directors. Although three of the independent Directors have served for more than nine years on the Board, the Board has reviewed their appointments and considers each of them to be independent as the NC placed more emphasis on whether each of the Directors has demonstrated independent judgment, integrity, professionalism and objectivity in the discharge of his duties, rather than imposing a maximum number of years that he should serve, which can be arbitrary. The Board is satisfied as to the performance and continued independence of judgment of each of these Directors. Further, the Board does not consider it to be in the interests of the Company or shareholders to require all Directors who have served for nine years or longer to retire at the same time and strongly favours ensuring continuity and stability through orderly succession.
Given the present scope and nature of the Company’s operations, the Board considers its current size and members whose core competencies, qualifications, skills
ANNUAL REPORT 2015 | Of EXCELLENCE & ELEGANCE 19

cOrPOrate gOverNaNce
CorporaTe goverNaNCe reporT
On 28 October 2014, Tan Sri Dato’ Mohamed Noordin bin Hassan retired and ceased to be a member of the NC. The NC has adopted specific written terms of reference. The principal functions of the NC are to make recommendations to the Board for the appointment and re-appointment of Directors to the Board and to review the independence of each Director annually and as and when circumstances require. The NC will review board succession plans for Directors (in particular, for the Chairman and the MD) and the composition of the Board from time to time, and to search for and identify suitable candidates with the right qualifications, expertise and experience. Each candidate will be evaluated based on his ability to enhance the Board through his contributions in his area of expertise and to improve the Group’s business strategies, controls or corporate governance.
All Directors are required to submit themselves for re-nomination and re-election once every three years. At least one-third of the Directors retire at each Annual General Meeting (“AGM”) subject to re-election annually. Directors above the age of 70 are also required under the Companies Act to retire and offer themselves for re-appointment by the shareholders at every AGM. Since 2014, local Directors who reach the age of 80 years old and overseas Directors who reach the age of 75 years old will automatically retire from the Board. Key information on the Directors are set out on pages 4 to 6 of this Annual Report.
Multiple Board representationWhen a Director serves on multiple boards, that Director is to ensure that sufficient time and efforts are allocated to the affairs of each company with assistance from the Management, which provides relevant and complete information on a regular basis for effective discharge of his/her duties. To address the competing time and commitments that a Director may face holding multiple board appointments, the internal guideline recommended by the NC provides that the maximum number of listed company board representations which any Director may hold is five.
Board Performance The NC’s assessment of the effectiveness and performance of the Board as a whole and its board committees is conducted on an annual basis (by circulating board evaluation forms amongst the Directors) taking into account the level of participation and contribution of individual Directors towards the Board’s effectiveness and competencies, strategic insight, financial literacy, business
judgment, integrity and relevant industry knowledge to the Group. The aim of the evaluation is to assess if each Director continues to contribute effectively and demonstrate commitment to their respective roles. Individual evaluation of each Director by way of self-assessment is also conducted on an annual basis.
access to informationPrior to each meeting and when the need arises, the Board is furnished with complete and adequate information in a timely manner to enable full deliberation of issues to be considered. To ensure that the Board is able to fulfill its responsibilities, the Management provides the Board with board papers and related materials, background or explanatory information relating to matters to be brought before the Board, and copies of disclosure documents, periodic management reports, forecasts/budgets, financial statements and other relevant information of the Group. The Board has separate and independent access to the Management and the Company Secretary at all times. Directors are entitled to request from Management and are provided with such additional information as needed to make informed decisions. The Board seeks independent professional advice at the Company’s expense as and when necessary to enable the Directors (whether individually or as a group) to discharge their responsibilities effectively. The Company Secretary attends all Board meetings and ensures that Board procedures are followed. The Company Secretary, together with the Management, also ensures that the Company complies with all applicable statutory and regulatory rules.
remuNerAtioN mAtters remuneration committeeThe Remuneration Committee (“RC”) comprises three members, all of whom, including the Chairman, are independent non-executive Directors. The RC members are Mr Loh Soo Eng - Chairman of the RC, Mr Boey Tak Hap and Mr Lee Kim Wah. On 28 October 2014, Tan Sri Dato’ Mohamed Noordin bin Hassan retired and ceased to be a member of the RC. The RC reviews and recommends to the Board the remuneration of Directors and key executives of the Group and obtains advice on remuneration matters (including but not limited to Director’s fees, salaries, allowances, bonuses, options, share-based incentives and awards, and benefits in kind) as and when required from human resource advisers and Carrots Consulting Pte Ltd (“Carrots”). Carrots has no relationship with the Company. The RC reviews the structure of the remuneration
20 WING TAI HOLDINGS LIMITED

Remuneration Bands
Fees (%)
Salary (%)
Bonus (%)
Other benefits
(%)Total
(%)
Shares granted
during the year
$3,000,001 to $3,250,000 Cheng Wai Keung - 43 44 13# 100 -$2,750,001 to $3,000,000Edmund Cheng Wai Wing - 43 44 13# 100 -$1,250,001 to $1,500,000Tan Hwee Bin - 40 39 21^ 100 160,000Below $250,000Boey Tak Hap 100 - - - 100 -Cheng Man Tak 100 - - - 100 -Christopher Lau Loke Sam 100 - - - 100 -Lee Kim Wah 75 - - 25 100 -Loh Soo Eng 100 - - - 100 -Paul Tong 100 - - - 100 -Tan Sri Dato’ Mohamed Noordin bin Hassan#+ 60 - - 40 100 -
# Includes fees, allowance and other benefits from Wing Tai Malaysia Berhad (where applicable)^ Includes the fair value of restricted shares and performance shares+ Retired on 28 October 2014
package for the Directors and key executives to ensure that the package is competitive and sufficient to attract, retain and motivate key executives. No Director is involved in deciding his/her own remuneration. The Company’s remuneration framework for executive Directors and key executives comprises a fixed component (in the form of a base salary, annual wage supplement, fixed allowances where applicable, together with other benefits-in-kind in accordance with the Company’s human resource policies), a variable component in the form of variable bonuses, as well as a share-based component. The remuneration packages take into account the individual’s performance, the Group’s overall performance, as well as practices and employment conditions within the industry. Carrots performs a benchmarking exercise on the remuneration packages of the executive Directors and key executives on an annual basis. Non-executive Directors are paid a fixed fee. Directors who participate in Board Committees receive higher fees for the additional responsibilities. All Directors’ fees are approved by shareholders at the AGM of the Company before they are paid. The RC reviews the Company’s obligations arising in the event of termination of the executive Directors’ and key management personnel’s contracts of service, to ensure that such contracts of service contain fair and reasonable termination clauses which are not overly generous.
The Company uses the Wing Tai Performance Share Plan (“Wing Tai PSP”) and the Wing Tai Restricted Share Plan (“Wing Tai RSP”) to incentivise employees and Directors.
The performance conditions in the Wing Tai PSP are stretched targets aimed at sustaining longer-term growth. The performance conditions under the Wing Tai RSP are shorter term targets aimed at encouraging continued service. Under the Wing Tai PSP, performance conditions are set over a three-year performance period. Under the Wing Tai RSP, the shares have a vesting schedule of three years. Other than the restricted shares and performance shares (“Shares”) granted to Ms Tan Hwee Bin, no Shares nor share options were granted to the rest of the Directors during the financial year. The RC has the discretion not to award variable incentive in any year if an executive Director or a key management personnel is involved in exceptional circumstances of misstatement of financial statements or of misconduct resulting in financial loss to the Company.
Directors’ and key executives’ remuneration packages are a competitive advantage of the Group. Given the sensitivity and confidentiality of such information, the Company has chosen to make disclosure in relation thereto in bands of $250,000 (except for key management where there is no upper limit for the top band) with a breakdown in terms of base salary, bonus, allowance/benefits and share awards. The Company is of the view that such disclosures would provide adequate information on the remuneration policies and practice for Directors and key executives. There are no termination, retirement and post-employment benefits granted to the Directors and key executives. The breakdown (in percentage terms) of the Directors’ remuneration for FY2015 are as follows:-
ANNUAL REPORT 2015 | Of EXCELLENCE & ELEGANCE 21

Remuneration Bands
Salary (%)
Bonus (%)
Share awards
(%)^
Other benefits
(%)Total
(%)
Above $500,000Dato’ Roger Chan Wan Chung# 34 46 3 17 100Hoon Teck Ming 48 32 14 6 100Helen Chow 42 51 - 7 100Helen Khoo 50 37 9 4 100Len Siew Lian 40 37 18 5 100Ng Kim Huat 43 39 13 5 100Karine Lim 43 38 14 5 100$250,001 to $500,000Stacey Ow Yeong* 70 20 - 10 100
# Includes allowance, other benefits and fair value of restricted shares from Wing Tai Malaysia Berhad^ Includes the fair value of restricted shares and performance shares (where applicable)* Joined on 4 August 2014
cOrPOrate gOverNaNce
CorporaTe goverNaNCe reporT
The breakdown of the remuneration of the top eight key executives (Ms Helen Chow is the spouse of the MD) in bands of $250,000 for FY2015 is set out above. The total remuneration paid to the top eight key executives for FY2015 amounted to $6.7 million.
Mrs Kit Cheng, who is the spouse of the Deputy Chairman, received remuneration that is between $300,000 and $350,000 during FY2015.
AccouNtAbiLity AND AuDitaccountabilityIn presenting the annual financial statements and announcements of financial results to shareholders, it is the aim of the Board to provide shareholders with a balanced and understandable assessment of the Company’s performance, financial position and prospects on a quarterly basis, as well as other price-sensitive public reports, and reports to regulators, if required.
The Management furnishes the Board with periodic management reports which present a balanced and understandable assessment of the Company and its businesses, and all other information that will enable the Board to make a balanced and informed assessment of the Company’s performance, position and prospects.
Audit & risk committeeThe Audit & Risk Committee (“ARC”) comprises four members, all of whom are independent non-executive Directors. The ARC members are Mr Christopher Lau Loke Sam - Chairman of the ARC, Mr Boey Tak Hap, Mr Paul Tong and Mr Loh Soo Eng.
The Board considers the members of the ARC appropriately qualified to discharge the responsibilities of the ARC. The majority of the members of the ARC, including the Chairman, have sufficient accounting and financial management expertise and experience. The ARC held four meetings in FY2015. The ARC meetings were held with the internal and external auditors without the presence of the Management during FY2015.
The ARC is guided by the written terms of reference setting out its authority and duties. The ARC has explicit authority to investigate any matter within its terms of reference, full access to and co-operation by the Management and full discretion to invite any Director or executive officer to attend its meeting, and reasonable resources to enable it to discharge its functions properly. The ARC maintains a high standard of corporate governance and risk management by reviewing the annual audit plan, internal audit process, the adequacy of internal controls and interested person transactions. The ARC also reviews the quarterly and annual financial statements before submitting to the Board for its approval. Any changes to accounting standards and issues which have a direct impact on financial statements will be raised at such meetings.
The ARC takes measures to keep abreast of the changes to accounting standards and issues which have impact on financial statements, by participating in training conducted and regular updates provided by professionals or external auditors/consultants. The ARC meets on a periodic basis to perform, inter alia, the following: (i) recommend the appointment, reappointment and removal of the external auditor; (ii) review the scope, results of the audit and its
22 WING TAI HOLDINGS LIMITED

Group’s existing internal controls and the risk registers on a regular basis. Risk workshops are carried out with the risk owners to identify, assess and prioritise the risks. Mitigating actions in managing the key risks, as well as action plans to address the gaps, are considered and documented.
Risk tolerance limits are set to align with the Group’s risk appetite and are subject to review annually. Operating within risk tolerances provides the Management with greater assurance that the Group remains within its risk appetite.
The Board has received assurance from the Managing Director and the Chief Financial Officer that (i) the financial records have been properly maintained and the financial statements give a true and fair view of the Group’s operations and finances; and (ii) the Group’s framework of internal controls and procedures is adequate to provide reasonable assurance of the adequacy and effectiveness of internal controls addressing financial, operational, compliance and information technology risks and system of risk management.
Based on the internal controls established and the reviews conducted by the internal and external auditors and the existing management controls in place, the Board, with the concurrence of the ARC, is satisfied that there are adequate internal controls and risk management systems in place within the Group addressing the key material risks relating to, financial, operational, compliance, and information technology risks areas, to meet the needs of the Group in its current business environment as at 30 June 2015. The system of internal controls established by the Group provides reasonable, but not absolute, assurance that the Group will not be adversely affected by any event that can be reasonably foreseen as it strives to achieve its business objectives. The Board, however, notes that no system of internal controls can provide absolute assurance in this regard, or absolute assurance against poor judgement in decision making, human error, losses, fraud or other irregularities.
whistle-blowing PolicyThe Group has put in place a policy on whistle-blowing to facilitate the reporting of activities or practices which are in violation of the Group’s work rules. The Group encourages employees or any other parties with whom the Group has a business relationship to report unlawful, unethical or fraudulent activities or practices in confidence. All whistle-blowing reports are submitted either to the internal auditor (the “IA”) or chairman of the ARC so that independent
cost effectiveness; and (iii) review the independence and objectivity of the external auditors. Having reviewed the value of non-audit services by the external auditors to the Group, the ARC is satisfied that the nature and extent of such services will not prejudice the independence and objectivity of the external auditors. The aggregate amount of fees, broken down into audit and non-audit services provided by the auditors to the Company for FY2015 is disclosed on page 57 of this Annual Report.
The Group has complied with Rule 712 and 715 of the Listing Manual issued by the Singapore Exchange Securities Trading Limited in relation to its external auditors.
risk Management/internal controls The Board recognises the importance of sound internal controls and risk management practices in relation to good corporate governance. The Group’s internal controls provide reasonable assurance that assets are safeguarded, proper accounting records are maintained, financial information are reliable and applicable laws and regulations are properly complied with.
The Board ensures that the Management maintains an adequate and sound system of internal controls addressing key material risks including financial, operational, compliance and information technology risks. The Board requires the ARC to review and report annually on the adequacy and effectiveness of the internal controls and to assist in its risk management oversight.
The Group has in place an enterprise risk management (“ERM”) framework to provide the Board with a Group-wide view of the risks in the respective business units. The ERM framework enables the identification, assessment, management and monitoring of key risks to the Group’s business. As part of the framework, risk registers were set up to document the identified key material risks and mitigating controls/actions. The procedures and processes within the framework allow the Group to regularly review the significance and adequacy of its key material risks, consider the effectiveness of the Group’s system of internal controls to limit, mitigate and monitor identified key material risks and the implementation of further action plans to manage strategic business risks.
As part of its continuing efforts to improve the risk management policies and systems, the Group, with the assistance of KPMG Services Pte Ltd (“KPMG”), reviews the
ANNUAL REPORT 2015 | Of EXCELLENCE & ELEGANCE 23

Rules and the Companies Act, the Company promptly informs shareholders of all major developments that impact the Group. Shareholders are updated on the business and affairs of the Company through the quarterly release of the Company’s results. Material and price-sensitive information is publicly released by the Company via the Singapore Exchange Network (“SGXNET”) on an immediate basis where required by SGX-ST. The Company does not practise selective disclosure. Timely and detailed disclosure of pertinent corporate information is communicated via SGXNET and the Company’s website. All shareholders receive the annual report of the Company and notice of the AGM. The notice (which is also advertised in the press) and results are published via SGXNET. To address shareholders’ concerns and share views, the Company also conducts media and analysts briefing for its full-year results to provide market updates on the Group’s business. Shareholders are given the opportunity to raise relevant questions and communicate their views at general meetings and these are minuted accordingly and available upon request. The Company practices having separate resolutions at general meetings on each distinct issue. A shareholder can vote in person or by way of proxy at general meetings.
The Company’s website is at www.wingtaiasia.com.sg. The Company’s latest financial results and annual reports are available on the Company’s website. If shareholders have any queries on investor relations, they may contact [email protected].
The Company has a dividend policy of around 30% payout ratio based on underlying net profits taking into consideration the financial position, capital needs, plans for expansion and other factors as the Board may deem appropriate.
DeALiNGs iN securities The Company has adopted and implemented an internal guideline on share dealings in the Company’s securities in compliance with Rule 1207(19)(c) of the Listing Manual of the SGX-ST. All the officers of the Company are prohibited from dealing in securities of the Company while in possession of price-sensitive information. They are also prohibited from dealing in securities of the Company during the closed period, which is two weeks before the date of announcement of results for each of the first three quarters of the Company’s financial year and one month before the date of announcement of the full-year financial results. In addition, officers of the Company are also discouraged from dealing in the Company’s securities on short-term considerations.
cOrPOrate gOverNaNce
CorporaTe goverNaNCe reporT
investigation and appropriate follow-up action can be carried out. The ARC has the responsibility of overseeing this whistle-blowing policy, which is administered with the assistance of the internal auditors. The process of raising the concerns about possible improprieties in matters of financial reporting or other matters has been communicated to all employees. It is believed that this will encourage openness, promote transparency and act as a form of check and balance against the internal controls and risk management practices of the Group.
interested Person transaction The Company has established an internal policy for transactions with interested persons and has set out the procedures for review and approval of the Company’s interested person transactions (“IPT”). The Company did not obtain any shareholders’ mandate pursuant to Rule 920 of the SGX-ST Listing Manual. During FY2015, there was no discloseable IPT. internal audit The ARC approves the hiring, removal, evaluation and compensation of the head of the internal audit function of the Group, which is carried out by KPMG. The internal auditors meet and carry out their work based on the standards for the Professional Practice of Internal Auditing set by The Institute of Internal Auditors. The IA is provided unfettered access to all the Company’s documents, records, properties and personnel, including access to the ARC. The IA reports directly to the Chairman of the ARC. The ARC ensures that the internal auditors are adequately resourced and has appropriate standing within the Company and reviews, on an annual basis, the adequacy and effectiveness of the internal audit function through a review of activities carried out by the IA on a quarterly basis and is satisfied that there are adequate internal controls in the Company.The Company has adopted a set of internal controls which sets out approval limits for expenditure, investments and divestments and cheque signatory arrangements. The IA assists the ARC in its functions by reporting their audit findings to the ARC and to the Management. The scope of the IA is to perform detailed work to assist the ARC and the Board in the evaluation of internal controls and risk management. The IA submits its plans and recommendations to the ARC for approval.
commuNicAtioN with shArehoLDersIn line with the disclosure obligations under the Singapore Exchange Securities Trading Limited (“SGX-ST”) Listing
24 WING TAI HOLDINGS LIMITED

ANNUAL REPORT 2015 | OF EXCELLENCE & ELEGANCE ———— 25
FINANCIAL REPORTS
For the
Financial Year
2015 26 Five-Year Financial Summary
27 Directors’ Report
33 Statement by Directors
34 Independent Auditor’s Report
35 Consolidated Income Statement
36 Consolidated Statement of Comprehensive Income
37 Statements of Financial Position
38 Consolidated Statement of Changes in Equity
39 Consolidated Statement of Cash Flows
41 Notes to the Financial Statements
113 Shareholding Statistics

26 ———— WING TAI HOLDINGS LIMITED
FIVE-YEAR FINANCIAL SUMMARY
Note: 1. The number of shares used for this purpose is as follows:
’000 2015 784,455 2014 785,482 2013 783,216 2012 780,803 2011 779,181
2015 2014 2013 2012 2011 $'000 $'000 $'000 $'000 $'000
Revenue 676,715 803,393 1,332,500 624,888 751,109 Property 467,720 581,497 1,115,041 401,810 540,185 Retail 199,012 213,519 210,020 216,462 202,350 Investment and others 9,983 8,377 7,439 6,616 8,574
Profit before income tax 175,295 312,471 690,817 317,821 465,675
Total profit
165,943 276,342 587,891 284,134 407,691
Profit attributable to equity holders of the Company
150,304
254,390
531,126
262,366
371,377
Shareholders' equity 3,173,169 2,969,655 2,840,640 2,230,989 1,996,704
Total assets 4,887,560 4,883,414 4,977,772 4,008,341 3,785,992
Total liabilities and non-controlling interests 1,714,391
1,913,759
2,137,132
1,777,352
1,789,288
Earnings per share1
(cents) 19.16 32.39 67.81 33.60 47.66
Net tangible assets per share ($) 4.07 3.78 3.62 2.85 2.56
Cash dividends per share (cents) 3.00 6.00 12.00 7.00 7.00
ANNUAL REPORT 2015 | OF EXCELLENCE & ELEGANCE ———— 27
DIRECTORS’ REPORT For the Financial Year Ended 30 June 2015
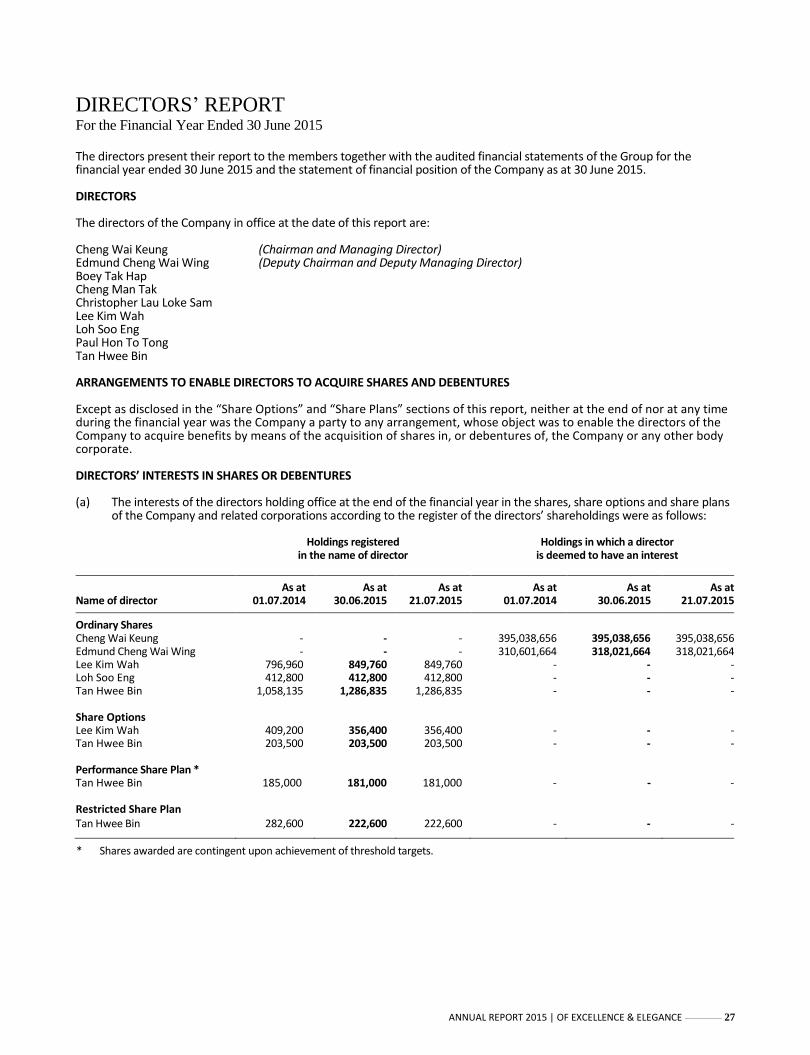
The directors present their report to the members together with the audited financial statements of the Group for the financial year ended 30 June 2015 and the statement of financial position of the Company as at 30 June 2015. DIRECTORS The directors of the Company in office at the date of this report are: Cheng Wai Keung (Chairman and Managing Director) Edmund Cheng Wai Wing (Deputy Chairman and Deputy Managing Director) Boey Tak Hap Cheng Man Tak Christopher Lau Loke Sam Lee Kim Wah Loh Soo Eng Paul Hon To Tong Tan Hwee Bin ARRANGEMENTS TO ENABLE DIRECTORS TO ACQUIRE SHARES AND DEBENTURES Except as disclosed in the “Share Options” and “Share Plans” sections of this report, neither at the end of nor at any time during the financial year was the Company a party to any arrangement, whose object was to enable the directors of the Company to acquire benefits by means of the acquisition of shares in, or debentures of, the Company or any other body corporate. DIRECTORS’ INTERESTS IN SHARES OR DEBENTURES (a) The interests of the directors holding office at the end of the financial year in the shares, share options and share plans
of the Company and related corporations according to the register of the directors’ shareholdings were as follows:
Holdings registered in the name of director
Holdings in which a director is deemed to have an interest
Name of director As at
01.07.2014 As at
30.06.2015 As at
21.07.2015 As at
01.07.2014 As at
30.06.2015 As at
21.07.2015
Ordinary Shares
Cheng Wai Keung - - - 395,038,656 395,038,656 395,038,656 Edmund Cheng Wai Wing - - - 310,601,664 318,021,664 318,021,664 Lee Kim Wah 796,960 849,760 849,760 - - - Loh Soo Eng 412,800 412,800 412,800 - - - Tan Hwee Bin 1,058,135 1,286,835 1,286,835 - - - Share Options Lee Kim Wah 409,200 356,400 356,400 - - - Tan Hwee Bin 203,500 203,500 203,500 - - - Performance Share Plan * Tan Hwee Bin 185,000 181,000 181,000 - - - Restricted Share Plan Tan Hwee Bin 282,600 222,600 222,600 - - -
* Shares awarded are contingent upon achievement of threshold targets.

28 ———— WING TAI HOLDINGS LIMITED
DIRECTORS’ REPORT For the Financial Year Ended 30 June 2015
DIRECTORS’ INTERESTS IN SHARES OR DEBENTURES (continued)
Holdings registered in the name of director
Holdings in which a director is deemed to have an interest
Name of director As at
01.07.2014 As at
30.06.2015 As at
21.07.2015 As at
01.07.2014 As at
30.06.2015 As at
21.07.2015
Related Corporation
Wing Tai Malaysia Berhad Ordinary shares Cheng Wai Keung 15,900 848,900 848,900 191,384,062 191,384,062 191,384,062 Edmund Cheng Wai Wing 15,900 848,900 848,900 191,384,062 191,384,062 191,384,062 Share Options Cheng Wai Keung 800,000 - - - - - Edmund Cheng Wai Wing 800,000 - - - - - Restricted Share Plan Cheng Wai Keung 94,100 61,100 61,100 - - - Edmund Cheng Wai Wing 94,100 61,100 61,100 - - -
Except for the above, none of the directors of the Company at the end of the financial year had any interest in the shares or debentures of the Company or any other related corporations. (b) By virtue of Section 7 of the Singapore Companies Act, Cheng Wai Keung and Edmund Cheng Wai Wing, who by virtue
of their interest of not less than 20% in the issued capital of the Company, are also deemed to have an interest in the shares of the various subsidiary companies held by the Company.
DIRECTORS’ CONTRACTUAL BENEFITS
Since the end of the previous financial year, no director has received or become entitled to receive a benefit by reason of a contract made by the Company or a related corporation with the director or with a firm of which he is a member or with a company in which he has a substantial financial interest, except as disclosed in Note 33 to the financial statements. SHARE OPTIONS (a) The Wing Tai Holdings Limited (2001) Share Option Scheme (the “Scheme”) The Scheme was approved and adopted by the members of the Company at an Extraordinary General Meeting
(“EGM”) held on 31 August 2001. The Scheme was terminated by the members of the Company at an EGM held on 30 October 2008 (without prejudice to the rights of holders of options thereunder in respect of options which have been granted). The Scheme is administered by a committee comprising two directors, namely Cheng Wai Keung and Tan Hwee Bin.
No option was granted under the Scheme during the financial year. No controlling shareholder of the Company or
his associate participated in the Scheme.

ANNUAL REPORT 2015 | OF EXCELLENCE & ELEGANCE ———— 29
DIRECTORS’ REPORT For the Financial Year Ended 30 June 2015
SHARE OPTIONS (continued) (a) The Wing Tai Holdings Limited (2001) Share Option Scheme (the “Scheme”) (continued) The aggregate number of options granted since the commencement of the Scheme to the end of the financial
year is as follows:
Aggregate options since commencement of the Scheme to 30.06.2015 Aggregate
number of outstanding
options as at 30.06.2015
Name of participant
Number of
options granted
Number of
options exercised
Number of
options forfeited
Directors of the Company
Lee Kim Wah 877,200 520,800 - 356,400 Tan Hwee Bin 645,500 442,000 - 203,500
1,522,700 962,800 - 559,900 Group Executives 11,686,600 6,125,400 3,659,900 1,901,300
Total 13,209,300 7,088,200 3,659,900 2,461,200
Other than Lee Kim Wah, none of the participants of the Scheme received 5% or more of the total number of options granted under the Scheme.
Details of the movement in the options granted under the Scheme on the unissued ordinary shares of the Company
during the year were as follows:
Date of grant As at
01.07.2014
Number of options exercised
Number of options
forfeited As at
30.06.2015 Exercise price ($) Expiry date
19.11.2004 103,400 103,400 - - 0.849 18.11.2014
30.09.2005 315,800 48,400 37,400 230,000 1.300 29.09.2015
05.09.2006 825,400 46,200 77,000 702,200 1.645 04.09.2016
06.09.2007 1,688,500 - 159,500 1,529,000 3.136 05.09.2017
Total 2,933,100 198,000 273,900 2,461,200
(b) The Wing Tai Malaysia Berhad (“WTM”) Employees’ Share Option Scheme (the “ESOS”)
WTM, a subsidiary company of the Group, implemented the ESOS approved by the shareholders of WTM at an EGM held on 11 May 2005. The ESOS is administered by a committee comprising two directors of WTM, namely Cheng Wai Keung and Tan Sri Dato’ Paduka Dr. Mazlan bin Ahmad. The directors (including non-executive directors) and employees of WTM who as at the date of offer are confirmed with at least one year of continuous service in WTM and its subsidiary companies are eligible to participate in the scheme. The ESOS will allow granting of options to all eligible directors and employees by giving them the right to subscribe for new shares of RM1.00 each, subject to the terms and conditions of the by-laws of the ESOS. The details of the ESOS have been disclosed in the Directors’ Report of WTM. Details of the movement in the options granted under the ESOS on the unissued ordinary shares of WTM during the year were as follows:
Date of grant As at
01.07.2014
Number of options
exercised
Number of options
forfeited As at
30.06.2015 Exercise
price (RM) Expiry date
01.12.2005 1,005,000 1,000,000 5,000 - 1.00 15.05.2015
31.01.2007 46,600 4,200 42,400 - 1.00 15.05.2015
19.05.2010 774,600 720,000 54,600 - 1.20 15.05.2015
Total 1,826,200 1,724,200 102,000 -

30 ———— WING TAI HOLDINGS LIMITED
DIRECTORS’ REPORT For the Financial Year Ended 30 June 2015
SHARE OPTIONS (continued) (b) The Wing Tai Malaysia Berhad (“WTM”) Employees’ Share Option Scheme (the “ESOS”) (continued)
Except for the above, no other options were granted by the Company or any subsidiary companies during the financial year and there were no unissued shares under options at the end of the financial year.
SHARE PLANS (a) The Wing Tai Performance Share Plan (“Wing Tai PSP”) and the Wing Tai Restricted Share Plan (“Wing Tai RSP”) The Wing Tai PSP and the Wing Tai RSP (collectively referred to as the “Wing Tai Share Plans”) were adopted by the
members of the Company at an EGM held on 30 October 2008. The Wing Tai Share Plans are administered by a committee (the “Committee”) comprising two directors, namely Cheng Wai Keung and Tan Hwee Bin.
(i) Wing Tai PSP
One of the primary objectives of the Wing Tai PSP is to increase the Company’s flexibility and effectiveness in its continuous efforts to reward, retain and motivate key management staff. The Wing Tai PSP is primarily targeted at executives in key positions who are able to drive the growth of the Company through innovation, creativity and superior performance.
Full-time executives (including executive directors) of the Company, its subsidiary companies or associated
companies who hold such rank as may be designated by the Committee from time to time are eligible to participate in the Wing Tai PSP.
Under the Wing Tai PSP, performance conditions are set over a three-year performance period. A specified
number of shares will be released by the Committee to the participants at the end of the performance period, provided the threshold targets are achieved. The total number of shares released varies depending on the achievement of pre-set performance targets over the performance period. The achievement factor ranges from 0% to 200%.
Details of the movement in the awards of the Company during the year were as follows:
Date of grant
As at
01.07.2014 Number of
shares granted
Additional shares awarded
arising from targets achieved
Number of shares released
As at 30.06.2015
08.09.2011 183,000 - 11,200 194,200 -
19.09.2012 147,000 - - - 147,000
25.09.2013 115,000 - - - 115,000
26.09.2014 - 210,000 - - 210,000
Total 445,000 210,000 11,200 194,200 472,000
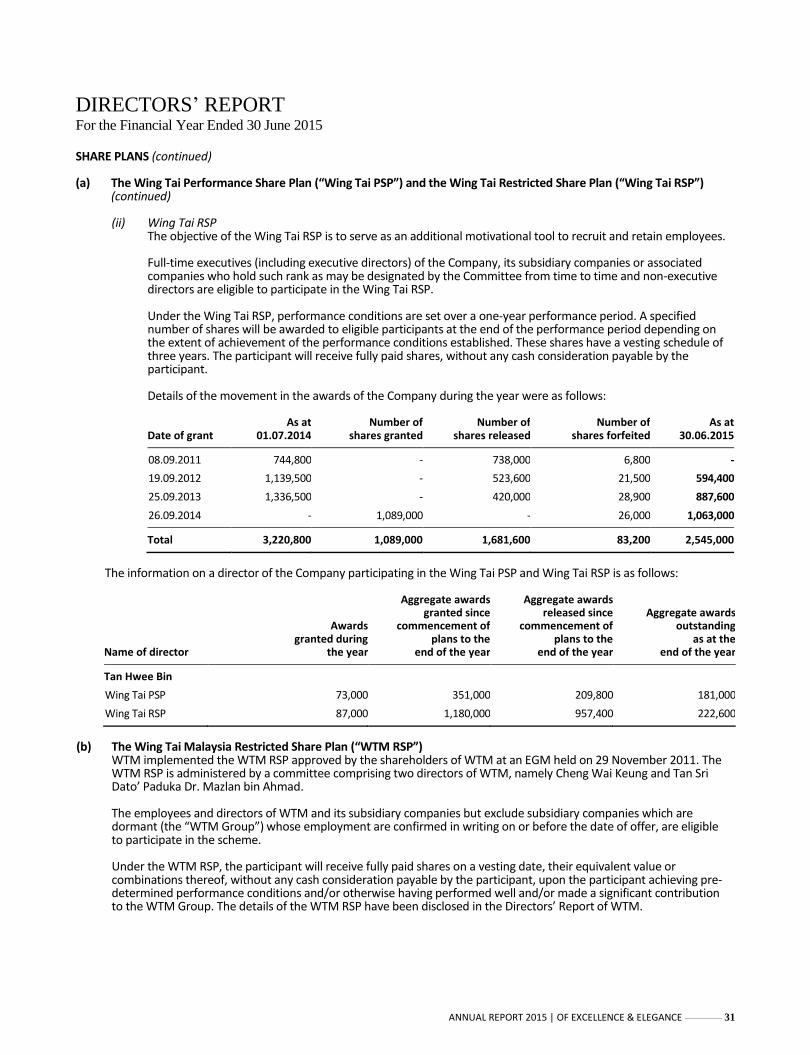
ANNUAL REPORT 2015 | OF EXCELLENCE & ELEGANCE ———— 31
DIRECTORS’ REPORT For the Financial Year Ended 30 June 2015
SHARE PLANS (continued) (a) The Wing Tai Performance Share Plan (“Wing Tai PSP”) and the Wing Tai Restricted Share Plan (“Wing Tai RSP”)
(continued) (ii) Wing Tai RSP
The objective of the Wing Tai RSP is to serve as an additional motivational tool to recruit and retain employees. Full-time executives (including executive directors) of the Company, its subsidiary companies or associated companies who hold such rank as may be designated by the Committee from time to time and non-executive directors are eligible to participate in the Wing Tai RSP. Under the Wing Tai RSP, performance conditions are set over a one-year performance period. A specified number of shares will be awarded to eligible participants at the end of the performance period depending on the extent of achievement of the performance conditions established. These shares have a vesting schedule of three years. The participant will receive fully paid shares, without any cash consideration payable by the participant.
Details of the movement in the awards of the Company during the year were as follows:
Date of grant As at
01.07.2014 Number of
shares granted Number of
shares released Number of
shares forfeited As at
30.06.2015
08.09.2011 744,800 - 738,000 6,800 -
19.09.2012 1,139,500 - 523,600 21,500 594,400
25.09.2013 1,336,500 - 420,000 28,900 887,600
26.09.2014 - 1,089,000 - 26,000 1,063,000
Total 3,220,800 1,089,000 1,681,600 83,200 2,545,000
The information on a director of the Company participating in the Wing Tai PSP and Wing Tai RSP is as follows:
Name of director
Awards granted during
the year
Aggregate awards granted since
commencement of plans to the
end of the year
Aggregate awards released since
commencement of plans to the
end of the year
Aggregate awards outstanding
as at the end of the year
Tan Hwee Bin
Wing Tai PSP 73,000 351,000 209,800 181,000
Wing Tai RSP 87,000 1,180,000 957,400 222,600
(b) The Wing Tai Malaysia Restricted Share Plan (“WTM RSP”) WTM implemented the WTM RSP approved by the shareholders of WTM at an EGM held on 29 November 2011. The WTM RSP is administered by a committee comprising two directors of WTM, namely Cheng Wai Keung and Tan Sri
Dato’ Paduka Dr. Mazlan bin Ahmad. The employees and directors of WTM and its subsidiary companies but exclude subsidiary companies which are
dormant (the “WTM Group”) whose employment are confirmed in writing on or before the date of offer, are eligible to participate in the scheme.
Under the WTM RSP, the participant will receive fully paid shares on a vesting date, their equivalent value or
combinations thereof, without any cash consideration payable by the participant, upon the participant achieving pre-determined performance conditions and/or otherwise having performed well and/or made a significant contribution to the WTM Group. The details of the WTM RSP have been disclosed in the Directors’ Report of WTM.
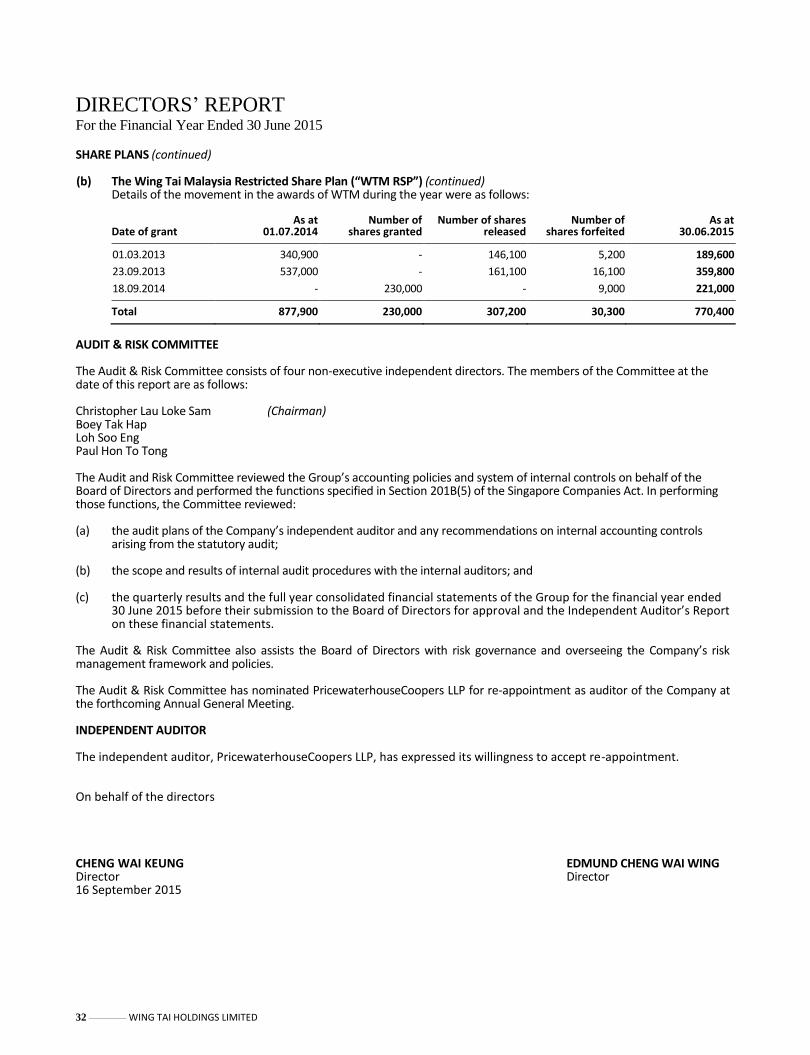
32 ———— WING TAI HOLDINGS LIMITED
DIRECTORS’ REPORT For the Financial Year Ended 30 June 2015 SHARE PLANS (continued) (b) The Wing Tai Malaysia Restricted Share Plan (“WTM RSP”) (continued) Details of the movement in the awards of WTM during the year were as follows:
Date of grant As at
01.07.2014 Number of
shares granted Number of shares
released Number of
shares forfeited As at
30.06.2015
01.03.2013 340,900 - 146,100 5,200 189,600
23.09.2013 537,000 - 161,100 16,100 359,800
18.09.2014 - 230,000 - 9,000 221,000
Total 877,900 230,000 307,200 30,300 770,400
AUDIT & RISK COMMITTEE The Audit & Risk Committee consists of four non-executive independent directors. The members of the Committee at the date of this report are as follows:
Christopher Lau Loke Sam (Chairman) Boey Tak Hap Loh Soo Eng Paul Hon To Tong
The Audit and Risk Committee reviewed the Group’s accounting policies and system of internal controls on behalf of the Board of Directors and performed the functions specified in Section 201B(5) of the Singapore Companies Act. In performing those functions, the Committee reviewed: (a) the audit plans of the Company’s independent auditor and any recommendations on internal accounting controls
arising from the statutory audit;
(b) the scope and results of internal audit procedures with the internal auditors; and
(c) the quarterly results and the full year consolidated financial statements of the Group for the financial year ended 30 June 2015 before their submission to the Board of Directors for approval and the Independent Auditor’s Report on these financial statements.
The Audit & Risk Committee also assists the Board of Directors with risk governance and overseeing the Company’s risk management framework and policies. The Audit & Risk Committee has nominated PricewaterhouseCoopers LLP for re-appointment as auditor of the Company at the forthcoming Annual General Meeting. INDEPENDENT AUDITOR
The independent auditor, PricewaterhouseCoopers LLP, has expressed its willingness to accept re-appointment.
On behalf of the directors CHENG WAI KEUNG Director
EDMUND CHENG WAI WING Director
16 September 2015

ANNUAL REPORT 2015 | OF EXCELLENCE & ELEGANCE ———— 33
STATEMENT BY DIRECTORS For the Financial Year Ended 30 June 2015 In the opinion of the directors,
(a) the statement of financial position of the Company and the consolidated financial statements of the Group as set
out on pages 35 to 112 are drawn up so as to give a true and fair view of the state of affairs of the Company and of the Group as at 30 June 2015 and of the results of the business, changes in equity and cash flows of the Group for the financial year then ended; and
(b) at the date of this statement, there are reasonable grounds to believe that the Company will be able to pay its
debts as and when they fall due.
On behalf of the directors
CHENG WAI KEUNG Director
EDMUND CHENG WAI WING Director
16 September 2015

34 ———— WING TAI HOLDINGS LIMITED
INDEPENDENT AUDITOR’S REPORT TO
THE MEMBERS OF WING TAI HOLDINGS LIMITED
REPORT ON THE FINANCIAL STATEMENTS We have audited the accompanying financial statements of Wing Tai Holdings Limited (the “Company”) and its subsidiary companies (the “Group”) set out on pages 35 to 112, which comprise the consolidated statement of financial position of the Group and the statement of financial position of the Company as at 30 June 2015, the consolidated income statement, the consolidated statement of comprehensive income, the consolidated statement of changes in equity and the consolidated statement of cash flows of the Group for the financial year then ended, and a summary of significant accounting policies and other explanatory information. Management’s Responsibility for the Financial Statements Management is responsible for the preparation of financial statements that give a true and fair view in accordance with the provisions of the Singapore Companies Act (the “Act”) and Singapore Financial Reporting Standards, and for devising and maintaining a system of internal accounting controls sufficient to provide a reasonable assurance that assets are safeguarded against loss from unauthorised use or disposition; and transactions are properly authorised and that they are recorded as necessary to permit the preparation of true and fair financial statements and to maintain accountability of assets. Auditor’s Responsibility Our responsibility is to express an opinion on these financial statements based on our audit. We conducted our audit in accordance with Singapore Standards on Auditing. Those standards require that we comply with ethical requirements and plan and perform the audit to obtain reasonable assurance about whether the financial statements are free from material misstatement. An audit involves performing procedures to obtain audit evidence about the amounts and disclosures in the financial statements. The procedures selected depend on the auditor’s judgement, including the assessment of the risks of material misstatement of the financial statements, whether due to fraud or error. In making those risk assessments, the auditor considers internal control relevant to the entity’s preparation of financial statements that give a true and fair view in order to design audit procedures that are appropriate in the circumstances, but not for the purpose of expressing an opinion on the effectiveness of the entity’s internal control. An audit also includes evaluating the appropriateness of accounting policies used and the reasonableness of accounting estimates made by management, as well as evaluating the overall presentation of the financial statements. We believe that the audit evidence we have obtained is sufficient and appropriate to provide a basis for our audit opinion. Opinion In our opinion, the consolidated financial statements of the Group and the statement of financial position of the Company are properly drawn up in accordance with the provisions of the Act and Singapore Financial Reporting Standards so as to give a true and fair view of the financial position of the Group and of the Company as at 30 June 2015, and of the financial performance, changes in equity and cash flows of the Group for the financial year ended on that date. REPORT ON OTHER LEGAL AND REGULATORY REQUIREMENTS In our opinion, the accounting and other records required by the Act to be kept by the Company and by those subsidiary corporations incorporated in Singapore, of which we are the auditors, have been properly kept in accordance with the provisions of the Act. PRICEWATERHOUSECOOPERS LLP Public Accountants and Chartered Accountants Singapore 16 September 2015

ANNUAL REPORT 2015 | OF EXCELLENCE & ELEGANCE ———— 35
CONSOLIDATED INCOME STATEMENT For the Financial Year Ended 30 June 2015
Group 2015 2014 Note $’000 $’000
Revenue 3 676,715 803,393 Cost of sales (417,348) (449,593)
Gross profit 259,367 353,800 Other gains – net 4 41,884 42,913 Expenses
– Distribution (106,160) (120,255) – Administrative and other (91,744) (78,864)
Operating profit 103,347 197,594 Finance costs 7 (47,335) (39,897) Share of profits of associated and joint venture companies 119,283 154,774
Profit before income tax 175,295 312,471 Income tax expense 8(a) (9,352) (36,129)
Total profit 165,943 276,342
Attributable to: Equity holders of the Company 150,304 254,390 Non-controlling interests 15,639 21,952
165,943 276,342
Basic earnings per share (cents) based on:
9(a) Net profit before fair value gains on investment properties
6.27 16.57
Net profit after fair value gains on investment properties 19.16 32.39
Diluted earnings per share (cents) based on:
9(b)
Net profit before fair value gains on investment properties 6.24 16.46 Net profit after fair value gains on investment properties 19.03 32.15

36 ———— WING TAI HOLDINGS LIMITED
CONSOLIDATED STATEMENT OF COMPREHENSIVE INCOME For the Financial Year Ended 30 June 2015
Group 2015 2014 Note $’000 $’000
Total profit 165,943 276,342
Other comprehensive income/(expense): Items that may be reclassified subsequently to profit or loss:
Cash flow hedges 11,743 2,979 Currency translation differences 86,534 (43,208) Share of other comprehensive (expense)/income of
associated and joint venture companies
(1,645) 1,202
96,632 (39,027)
Items that will not be reclassified subsequently to profit or loss: Revaluation gains on property, plant and equipment 3,109 1,569 Share of revaluation gains on property, plant and
equipment of an associated company
- 394
3,109 1,963
Other comprehensive income/(expense), net of tax 8(a) 99,741 (37,064)
Total comprehensive income 265,684 239,278
Attributable to: Equity holders of the Company 258,779 222,213 Non-controlling interests 6,905 17,065
265,684 239,278
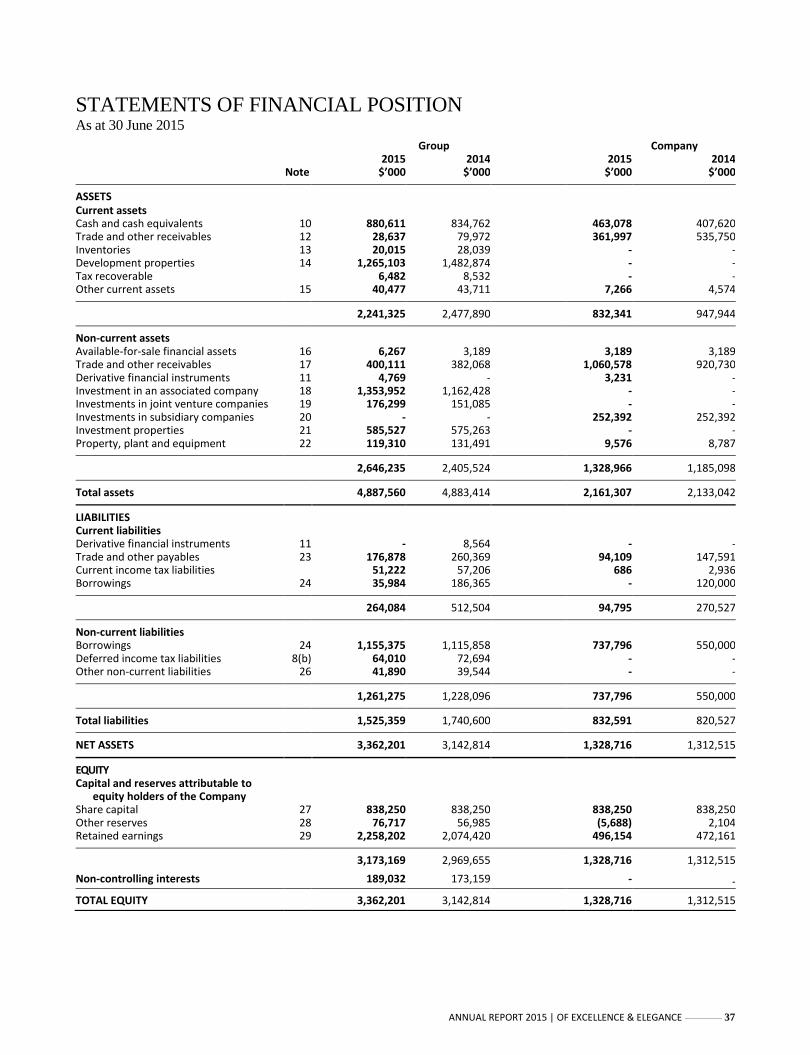
ANNUAL REPORT 2015 | OF EXCELLENCE & ELEGANCE ———— 37
STATEMENTS OF FINANCIAL POSITION As at 30 June 2015
Group Company 2015 2014 2015 2014 Note $’000 $’000 $’000 $’000
ASSETS Current assets Cash and cash equivalents 10 880,611 834,762 463,078 407,620 Trade and other receivables 12 28,637 79,972 361,997 535,750 Inventories 13 20,015 28,039 - - Development properties 14 1,265,103 1,482,874 - - Tax recoverable 6,482 8,532 - - Other current assets 15 40,477 43,711 7,266 4,574
2,241,325 2,477,890 832,341 947,944
Non-current assets Available-for-sale financial assets 16 6,267 3,189 3,189 3,189 Trade and other receivables 17 400,111 382,068 1,060,578 920,730 Derivative financial instruments 11 4,769 - 3,231 - Investment in an associated company 18 1,353,952 1,162,428 - - Investments in joint venture companies 19 176,299 151,085 - - Investments in subsidiary companies 20 - - 252,392 252,392 Investment properties 21 585,527 575,263 - - Property, plant and equipment 22 119,310 131,491 9,576 8,787
2,646,235 2,405,524 1,328,966 1,185,098
Total assets 4,887,560 4,883,414 2,161,307 2,133,042
LIABILITIES Current liabilities Derivative financial instruments 11 - 8,564 - - Trade and other payables 23 176,878 260,369 94,109 147,591 Current income tax liabilities 51,222 57,206 686 2,936 Borrowings 24 35,984 186,365 - 120,000
264,084 512,504 94,795 270,527
Non-current liabilities Borrowings 24 1,155,375 1,115,858 737,796 550,000 Deferred income tax liabilities 8(b) 64,010 72,694 - - Other non-current liabilities 26 41,890 39,544 - -
1,261,275 1,228,096 737,796 550,000
Total liabilities 1,525,359 1,740,600 832,591 820,527
NET ASSETS 3,362,201 3,142,814 1,328,716 1,312,515
EQUITY Capital and reserves attributable to
equity holders of the Company Share capital 27 838,250 838,250 838,250 838,250 Other reserves 28 76,717 56,985 (5,688) 2,104 Retained earnings 29 2,258,202 2,074,420 496,154 472,161
3,173,169 2,969,655 1,328,716 1,312,515
Non-controlling interests 189,032 173,159 - -
TOTAL EQUITY 3,362,201 3,142,814 1,328,716 1,312,515

38 ———— WING TAI HOLDINGS LIMITED
CONSOLIDATED STATEMENT OF CHANGES IN EQUITY For the Financial Year Ended 30 June 2015
Attributable to equity holders of the Company Non-
Share
capital Other
reserves Retained earnings Total
controlling interests
Total equity
Note $’000 $’000 $’000 $’000 $’000 $’000
2015 Beginning of financial year 838,250 56,985 2,074,420 2,969,655 173,159 3,142,814 Total comprehensive income - 108,475 150,304 258,779 6,905 265,684 Realisation of reserves - (84,545) 84,545 - - - Transfer to statutory reserve - 2,310 (2,310) - - - Transfer from share-based payment reserve - (61) 61 - - - Redemption of preference shares by a
subsidiary company -
462
(462) - - - Cost of share-based payment - 2,148 - 2,148 119 2,267 Reissuance of treasury shares - 264 - 264 - 264 Purchase of treasury shares - (12,550) - (12,550) - (12,550) Ordinary and special
dividends paid 25 -
- (47,267) (47,267) - (47,267) Dividends paid by subsidiary
companies to non-controlling interests -
- - - (4,145) (4,145) Issuance of ordinary shares by a subsidiary
company to non-controlling interests -
- (1,087) (1,087) 1,801 714 Acquisition of additional interest
in a subsidiary company -
- (2) (2) (2) (4) Disposal of a subsidiary company - 3,229 - 3,229 11,823 15,052 Liquidation of subsidiary companies - - - - (628) (628)
End of financial year 838,250 76,717 2,258,202 3,173,169 189,032 3,362,201
2014 Beginning of financial year 838,250 87,919 1,914,471 2,840,640 186,440 3,027,080 Total comprehensive (expense)/income - (32,177) 254,390 222,213 17,065 239,278 Realisation of reserves - (43) 43 - - - Cost of share-based payment - 2,849 - 2,849 153 3,002 Reissuance of treasury shares - 418 - 418 - 418 Purchase of treasury shares - (693) - (693) - (693) Ordinary and special
dividends paid 25 - - (94,328) (94,328) - (94,328) Dividends paid by subsidiary
companies to non-controlling interests - - - - (29,769) (29,769) Issuance of ordinary shares by a subsidiary
company to non-controlling interests - - (147) (147) 218 71 Acquisition of additional interest
in a subsidiary company - - (9) (9) (6) (15) Disposal of subsidiary companies - (1,288) - (1,288) - (1,288) Liquidation of a subsidiary company - - - - (942) (942)
End of financial year 838,250 56,985 2,074,420 2,969,655 173,159 3,142,814
An analysis of the movements in each category within “Other reserves” is presented in Note 28.

ANNUAL REPORT 2015 | OF EXCELLENCE & ELEGANCE ———— 39
CONSOLIDATED STATEMENT OF CASH FLOWS For the Financial Year Ended 30 June 2015
Group 2015 2014 Note $’000 $’000
Cash flows from operating activities Total profit 165,943 276,342 Adjustments for:
Income tax expense 9,352 36,129 Depreciation of property, plant and equipment 14,390 14,354 Write-off of property, plant and equipment 262 460 Impairment loss on property, plant and equipment 3,582 365 Dividend income (95) (125) Fair value gains on investment properties (12,522) (11,054) Fair value gains on derivative financial instruments (121) (58) (Write-back of allowance)/allowance for stock obsolescence (72) 2,725 Dilution loss on interest in an associated company 1,410 2,137 Write-back of allowance for foreseeable losses on
development properties - (3,985) Gain on disposal of subsidiary companies (20,963) (7,080) Fair value gain on re-measurement of retained interest
in a joint venture company - (5,792) Gain on disposal of property, plant and equipment (72) (236) Interest income (7,561) (12,705) Interest expense 47,335 39,897 Share of profits of associated and joint venture companies (119,283) (154,774) Share-based payment 2,267 3,002 Currency translation differences 4,972 (1,275)
Operating cash flow before working capital changes 88,824 178,327
Changes in operating assets and liabilities: Balances with associated and joint venture companies (310) (11,848) Development properties 211,794 (141,376) Inventories 7,266 (9,111) Trade and other receivables and other current assets 53,179 51,159 Trade and other payables and other non-current liabilities (68,978) 17,486
Cash generated from operations 291,775 84,637 Income tax paid (25,203) (46,775)
Net cash generated from operating activities 266,572 37,862

40 ———— WING TAI HOLDINGS LIMITED
CONSOLIDATED STATEMENT OF CASH FLOWS For the Financial Year Ended 30 June 2015
Group 2015 2014 Note $’000 $’000
Cash flows from investing activities Purchase of available-for-sale financial assets (2,985) - Acquisition of additional interest in a subsidiary company (4) (15) Acquisition of additional interest in a joint venture company (17,900) (45,865) Additions to investment properties (649) - Additions to property, plant and equipment (6,980) (20,367) Disposal of property, plant and equipment 156 1,775 Disposal of subsidiary companies, net of cash disposed of 10 27,133 58,896 Liquidation of joint venture companies 18 - Distribution to non-controlling interests upon liquidation of a
subsidiary company (628) (942) Capital reduction of a joint venture company - 75,339 Advancement of the loans to joint venture companies (17,186) (21,440) Dividends received 19,453 27,513 Interest received 7,803 4,061
Net cash generated from investing activities 8,231 78,955
Cash flows from financing activities Issuance of ordinary shares by a subsidiary company
to non-controlling interests 714 71 Reissuance of treasury shares 264 418 Purchase of treasury shares (12,550) (693) Repayment of the loans from non-controlling interests (3,232) (3,129) Proceeds from borrowings 292,794 188,181 Repayment of borrowings (401,746) (319,473) Ordinary and special dividends paid (47,267) (94,328) Dividends paid to non-controlling interests (4,145) (29,769) Interest paid (52,869) (44,213)
Net cash used in financing activities (228,037) (302,935)
Net increase/(decrease) in cash and cash equivalents 46,766 (186,118) Cash and cash equivalents at beginning of financial year 834,762 1,024,541 Effects of currency translation on cash and cash equivalents (917) (3,661)
Cash and cash equivalents at end of financial year 10 880,611 834,762
ANNUAL REPORT 2015 | OF EXCELLENCE & ELEGANCE ———— 41
NOTES TO THE FINANCIAL STATEMENTS For the Financial Year Ended 30 June 2015
These notes form an integral part of and should be read in conjunction with the accompanying financial statements.
1. GENERAL INFORMATION
Wing Tai Holdings Limited (the “Company”) is incorporated and domiciled in Singapore and is listed on the Singapore Exchange Securities Trading Limited. The address of its registered office is 3 Killiney Road, #10-01 Winsland House I,Singapore 239519.
The principal activity of the Company is that of an investment holding company. The principal activities of theCompany's subsidiary companies are shown in Note 35.
2. SIGNIFICANT ACCOUNTING POLICIES
2.1 Basis of preparation
These financial statements have been prepared in accordance with Singapore Financial Reporting Standards(“FRS”). The financial statements have been prepared under the historical cost convention, except as disclosed inthe accounting policies below.
The preparation of financial statements in conformity with FRS requires management to exercise its judgement inthe process of applying the Group’s accounting policies. It also requires the use of certain critical accountingestimates and assumptions that affect the reported amounts of assets and liabilities and the disclosure ofcontingent assets and liabilities at the date of the financial statements, and the reported amounts of revenues andexpenses during the financial year. Although these estimates are based on management’s best knowledge ofcurrent events and actions, actual results may ultimately differ from those estimates. The areas involving a higherdegree of judgement or complexity, or areas where assumptions and estimates are significant to the financialstatements are disclosed in Notes 2.7, 2.8, 8 and 32.
Amendments and interpretations to published standards effective in 2015On 1 July 2014, the Group adopted the new or amended FRS and Interpretations to FRS (“INT FRS”) that aremandatory for application for the financial year. Changes to the Group’s accounting policies have been made asrequired, in accordance with the transitional provisions in the respective FRS and INT FRS.
The adoption of these new or amended FRS and INT FRS did not result in substantial changes to the accountingpolicies of the Group and the Company and had no material effect on the amounts reported for the current orprior financial years except for the following:
FRS 112 Disclosure of Interests in Other Entities
The Group has applied FRS 112 retrospectively in accordance with the transitional provisions (as amendedsubsequent to the issuance of FRS 112 in September 2011) in FRS 112 and amended for consolidation exceptionsfor ‘investment entity’ from 1 July 2014. The Group has incorporated the additional required disclosures into thefinancial statements.

42 ———— WING TAI HOLDINGS LIMITED
NOTES TO THE FINANCIAL STATEMENTS For the Financial Year Ended 30 June 2015
2. SIGNIFICANT ACCOUNTING POLICIES (continued)
2.2 Revenue recognition
Revenue for the Group comprises the fair value of the consideration received or receivable for the sale of goods and the rendering of services in the ordinary course of the Group’s activities. Revenue is presented, net of goods and services tax, rebates and discounts, and after eliminating sales within the Group.
The Group recognises revenue when the amount of revenue and related cost can be reliably measured, it is probable that the collectability of the related receivables is reasonably assured and when the specific criteria for each of the Group’s activities are met as follows:
(a) Sale of goods
Revenue from the sale of goods is recognised when a Group entity has delivered the products to the customer, the customer has accepted the products and collectability of the related receivable is reasonably assured, except for income from the sale of development properties as disclosed in Note 2.8.
(b) Rental income
Rental income from operating leases (net of any incentives given to the lessees) is recognised on a straight-line basis over the lease term.
(c) Management fee
Management fee comprises charges for the management and maintenance of properties and finance and administration fees. Revenue from management fee is recognised when management services are rendered.
(d) Dividend income
Dividend income is recognised when the right to receive payment is established.
(e) Interest income Interest income is recognised using the effective interest method.
2.3 Group accounting
(a) Subsidiary companies (i) Consolidation
Subsidiary companies are all entities over which the Group has control. The Group controls an entity when the Group is exposed to, or has rights to, variable returns from its involvement with the entity and has the ability to affect those returns through its power over the entity. Subsidiary companies are fully consolidated from the date on which control is transferred to the Group. They are de-consolidated from the date on which control ceases. In preparing the consolidated financial statements, transactions, balances and unrealised gains on transactions between group entities are eliminated. Unrealised losses are also eliminated but are considered an impairment indicator of the asset transferred. Accounting policies of subsidiary companies have been changed where necessary to ensure consistency with the accounting policies adopted by the Group. Non-controlling interests comprise the portion of a subsidiary company’s net results of operations and its net assets, which is attributable to the interests that are not owned directly or indirectly by the equity holders of the Company. They are shown separately in the consolidated income statement, consolidated statement of comprehensive income, consolidated statement of financial position and consolidated statement of changes in equity. Total comprehensive income is attributed to the non-controlling interests based on their respective interests in a subsidiary company, even if this results in the non-controlling interests having a deficit balance.

ANNUAL REPORT 2015 | OF EXCELLENCE & ELEGANCE ———— 43
NOTES TO THE FINANCIAL STATEMENTS For the Financial Year Ended 30 June 2015
2. SIGNIFICANT ACCOUNTING POLICIES (continued)
2.3 Group accounting (continued)
(a) Subsidiary companies (continued)
(ii) Acquisitions The acquisition method of accounting is used to account for business combinations entered into by the Group. The consideration transferred for the acquisition of a subsidiary company or business comprises the fair value of the assets transferred, the liabilities incurred and the equity interests issued by the Group. The consideration transferred also includes any contingent consideration arrangement and any pre-existing equity interest in the subsidiary company measured at their fair values at the acquisition date. Acquisition-related costs are expensed as incurred. Identifiable assets acquired and liabilities and contingent liabilities assumed in a business combination are, with limited exceptions, measured initially at their fair values at the acquisition date. On an acquisition-by-acquisition basis, the Group recognises any non-controlling interest in the acquiree at the date of acquisition either at fair value or at the non-controlling interest’s proportionate share of the acquiree’s identifiable net assets. The excess of the consideration transferred, the amount of any non-controlling interest in the acquiree and the acquisition-date fair value of any previous equity interest in the acquiree over the fair value of the identifiable net assets acquired, is recorded as goodwill. Please refer to Note 2.4 for the accounting policy on goodwill on acquisitions.
(iii) Disposals
When a change in the Group’s ownership interest in a subsidiary company results in a loss of control over the subsidiary company, the assets and liabilities of the subsidiary company including any goodwill are derecognised. Amounts previously recognised in other comprehensive income in respect of that entity are also reclassified to the income statement or transferred directly to retained earnings if required by a specific FRS.
Any retained equity interest in the entity is re-measured at fair value. The difference between the carrying amount of the retained interest at the date when control is lost and its fair value is recognised in the income statement.
Please refer to Note 2.5 for the accounting policy on investments in subsidiary companies in the separate financial statements of the Company.
(b) Transactions with non-controlling interests Changes in the Group’s ownership interest in a subsidiary company that do not result in a loss of control over the subsidiary company are accounted for as transactions with equity owners of the Group. Any difference between the change in the carrying amounts of the non-controlling interest and the fair value of the consideration paid or received is recognised in a separate reserve within equity attributable to the equity holders of the Company.
44 ———— WING TAI HOLDINGS LIMITED
NOTES TO THE FINANCIAL STATEMENTS For the Financial Year Ended 30 June 2015
2. SIGNIFICANT ACCOUNTING POLICIES (continued) 2.3 Group accounting (continued)
(c) Associated and joint venture companies
Associated companies are entities over which the Group has significant influence, but not control, generally accompanied by a shareholding giving rise to voting rights of 20% and above but not exceeding 50%. Joint venture companies are entities over which the Group has joint control as a result of contractual arrangements, and rights to the net assets of the entities. Investments in associated and joint venture companies are accounted for in the consolidated financial statements using the equity method of accounting less impairment losses, if any. (i) Acquisitions
Investments in associated and joint venture companies are initially recognised at cost. The cost of an acquisition is measured at the fair value of the assets given, equity instruments issued or liabilities incurred or assumed at the date of exchange, plus costs directly attributable to the acquisition. Goodwill on associated and joint venture companies represents the excess of the cost of acquisition of the associated or joint venture companies over the Group’s share of the fair value of the identifiable net assets of the associated or joint venture companies and is included in the carrying amount of the investments. Please refer to Note 2.4 for the accounting policy on goodwill on acquisitions.
(ii) Equity method of accounting
In applying the equity method of accounting, the Group’s share of its associated or joint venture companies’ post-acquisition profits or losses are recognised in the income statement and its share of post-acquisition other comprehensive income is recognised in other comprehensive income. These post-acquisition movements and distributions received from the associated or joint venture companies are adjusted against the carrying amount of the investments. When the Group’s share of losses in an associated or joint venture company equals or exceeds its interest in the associated or joint venture company, the Group does not recognise further losses, unless it has legal or constructive obligations to make, or has made, payments on behalf of the associated or joint venture company. If the associated or joint venture company subsequently reports profits, the Group resumes recognising its share of those profits only after its share of the profits equals the share of losses not recognised. Unrealised gains on transactions between the Group and its associated or joint venture companies are eliminated to the extent of the Group's interest in the associated or joint venture companies. Unrealised losses are also eliminated unless the transactions provide evidence of impairment of the assets transferred. The accounting policies of associated and joint venture companies are changed where necessary to ensure consistency with the accounting policies adopted by the Group.
(iii) Disposals Investments in associated and joint venture companies are derecognised when the Group loses significant influence or joint control. If the retained equity interest in the former associated or joint venture company is a financial asset, the retained equity interest is measured at fair value. The difference between the carrying amount of the retained interest at the date when significant influence or joint control is lost, and its fair value and any proceeds on partial disposal, is recognised in the income statement.
Please refer to Note 2.5 for the accounting policy on investments in associated and joint venture companies in the separate financial statements of the Company.

ANNUAL REPORT 2015 | OF EXCELLENCE & ELEGANCE ———— 45
NOTES TO THE FINANCIAL STATEMENTS For the Financial Year Ended 30 June 2015
2. SIGNIFICANT ACCOUNTING POLICIES (continued) 2.4 Goodwill on acquisitions
Goodwill on acquisition of subsidiary companies on or after 1 July 2009 represents the excess of the sum of the consideration transferred, the amount of any non-controlling interest in the acquiree and the acquisition-date fair value of any previous equity interest in the acquiree over the fair value of the identifiable net assets acquired. Goodwill on acquisition of subsidiary companies prior to 1 July 2009 and on acquisition of associated and joint venture companies represents the excess of the cost of the acquisition over the fair value of the Group’s share of the identifiable net assets acquired.
Goodwill on subsidiary companies is recognised separately as intangible assets and carried at cost less accumulated impairment losses. Goodwill on associated and joint venture companies is included in the carrying amount of the investments.
Gains and losses on the disposal of subsidiary, associated and joint venture companies include the carrying amount of goodwill relating to the entity sold, except for goodwill arising from acquisitions prior to 1 July 2001. Such goodwill was adjusted against retained earnings in the year of acquisition and is not recognised in the income statement on disposal.
2.5 Investments in subsidiary, associated and joint venture companies
Investments in subsidiary, associated and joint venture companies are carried at cost less accumulated impairment losses in the Company’s statement of financial position. On disposal of such investments, the difference between the disposal proceeds and the carrying amounts of the investments are recognised in the income statement.
2.6 Property, plant and equipment
(a) Measurement (i) Land and buildings
Land and buildings are initially recognised at cost.
Freehold and 999-year leasehold land are subsequently carried at the revalued amounts less accumulated impairment losses. Buildings and leasehold land are subsequently carried at the revalued amounts less accumulated depreciation and accumulated impairment losses.
Land and buildings are revalued by independent professional valuers once every three years and whenever their carrying amounts are likely to differ materially from their revalued amounts. When an asset is revalued, any accumulated depreciation at the date of revaluation is eliminated against the gross carrying amount of the asset. The net amount is then restated to the revalued amount of the asset.
Increases in carrying amounts arising from revaluation, including currency translation differences, are recognised in other comprehensive income, unless they offset previous decreases in the carrying amounts of the same asset, in which case, they are recognised in the income statement. Decreases in carrying amounts that offset previous increases of the same asset are recognised in other comprehensive income. All other decreases in carrying amounts are recognised in the income statement.
(ii) Other property, plant and equipment
All other items of property, plant and equipment are initially recognised at cost and subsequently carried at cost less accumulated depreciation and accumulated impairment losses.

46 ———— WING TAI HOLDINGS LIMITED
NOTES TO THE FINANCIAL STATEMENTS For the Financial Year Ended 30 June 2015 2. SIGNIFICANT ACCOUNTING POLICIES (continued) 2.6 Property, plant and equipment (continued)
(a) Measurement (continued)
(iii) Components of costs The cost of an item of property, plant and equipment initially recognised includes its purchase price and any cost that is directly attributable to bringing the asset to the location and condition necessary for it to be capable of operating in the manner intended by management. Cost also includes borrowing costs that are directly attributable to the acquisition, construction or production of a qualifying asset. The projected cost of dismantlement, removal or restoration is also recognised as part of the cost of property, plant and equipment if the obligation for the dismantlement, removal or restoration is incurred as a consequence of either acquiring the asset or using the asset for purposes other than to produce inventories.
(b) Depreciation
Freehold and 999-year leasehold land are not depreciated. Depreciation on other items of property, plant and equipment is calculated using the straight-line method to allocate their depreciable amounts over their estimated useful lives. The annual depreciation rates are as follows:
Buildings and leasehold land 1 – 3% or over the remaining lease period, whichever is shorter Motor vehicles 20% Office equipment 10 – 33% Furniture and fittings 10% or over the remaining lease period, whichever is shorter
The residual values, estimated useful lives and depreciation method of property, plant and equipment are reviewed, and adjusted as appropriate, at the end of each reporting period. The effects of any revision are recognised in the income statement when the changes arise.
(c) Subsequent expenditure
Subsequent expenditure relating to property, plant and equipment that has already been recognised is added to the carrying amount of the asset only when it is probable that future economic benefits associated with the item will flow to the Group and the cost of the item can be measured reliably. All other repair and maintenance expenses are recognised in the income statement when incurred.
(d) Disposal
On disposal of an item of property, plant and equipment, the difference between the disposal proceeds and its carrying amount is recognised in the income statement. Any amount in the asset revaluation reserve relating to that asset is transferred to retained earnings directly.

ANNUAL REPORT 2015 | OF EXCELLENCE & ELEGANCE ———— 47
NOTES TO THE FINANCIAL STATEMENTS For the Financial Year Ended 30 June 2015
2. SIGNIFICANT ACCOUNTING POLICIES (continued) 2.7 Investment properties
Investment properties are held for long-term rental yields and/or for capital appreciation and are not occupied substantially by the Group.
Investment properties are initially recognised at cost and subsequently carried at fair value, determined annually by independent professional valuers on the highest and best use basis. Changes in fair values are recognised in the income statement.
Investment properties are subject to renovations or improvements at regular intervals. The cost of major renovations and improvements is capitalised and the carrying amounts of the replaced components are recognised in the income statement. The cost of maintenance, repairs and minor improvements is recognised in the income statement when incurred. On disposal of an investment property, the difference between the disposal proceeds and the carrying amount is recognised in the income statement.
2.8 Development Properties
(a) Properties under development
Properties under development are stated at cost plus attributable profits, less allowance for foreseeable losses and progress billings. An allowance is made when the estimated net realisable value of the property has fallen below the carrying value. Cost includes cost of land and other direct and related expenditure, including interest on borrowings incurred in developing the properties. Interest and other related expenditure are capitalised as and when the activities that are necessary to get the asset ready for its intended development are in progress.
Sales of development properties under construction in respect of sale and purchase agreements entered into prior to completion of construction are recognised when the properties are delivered to the buyers, except for in cases where the control and risk and rewards of the property are transferred to the buyers as construction progresses. For sales of development properties of the Group that are within the scope as described in paragraph 2 of the Accompanying Note to INT FRS 115 Agreements for the Construction of Real Estate, the Group recognises revenue for sales of such development properties by reference to the stage of completion of the properties.
The stage of completion is measured by reference to the physical surveys of construction work completed as certified by the architects or quantity surveyors for the individual units sold. When it is probable that the total development costs will exceed the total revenue, the expected loss is recognised in the income statement immediately. Significant assumptions are required to estimate the total contract costs. In making this estimate, management has relied on past experience and the work of specialists.
(b) Properties held for sale Properties held for sale are stated at the lower of cost and net realisable value. Net realisable value is the estimated selling price in the ordinary course of business less selling expenses.

48 ———— WING TAI HOLDINGS LIMITED
NOTES TO THE FINANCIAL STATEMENTS For the Financial Year Ended 30 June 2015
2. SIGNIFICANT ACCOUNTING POLICIES (continued) 2.9 Impairment of non-financial assets
(a) Goodwill Goodwill recognised separately as an intangible asset is tested for impairment annually and whenever there is indication that the goodwill may be impaired.
For the purpose of impairment testing of goodwill, goodwill is allocated to each of the Group’s cash generating units (“CGU”) expected to benefit from synergies arising from the business combination.
An impairment loss is recognised when the carrying amount of a CGU, including the goodwill, exceeds the recoverable amount of the CGU. The recoverable amount of a CGU is the higher of the CGU’s fair value less cost to sell and value-in-use. The total impairment loss of a CGU is allocated first to reduce the carrying amount of goodwill allocated to the CGU and then to the other assets of the CGU pro-rata on the basis of the carrying amount of each asset in the CGU.
An impairment loss on goodwill is recognised in the income statement and is not reversed in a subsequent period.
(b) Property, plant and equipment
Investments in subsidiary, associated and joint venture companies Property, plant and equipment and investments in subsidiary, associated and joint venture companies are tested for impairment whenever there is any objective evidence or indication that these assets may be impaired. For the purpose of impairment testing, the recoverable amount (i.e. the higher of the fair value less cost to sell and the value-in-use) is determined on an individual asset basis unless the asset does not generate cash inflows that are largely independent of those from other assets. If this is the case, the recoverable amount is determined for the CGU to which the asset belongs. If the recoverable amount of the asset (or CGU) is estimated to be less than its carrying amount, the carrying amount of the asset (or CGU) is reduced to its recoverable amount. The difference between the carrying amount and the recoverable amount is recognised as an impairment loss in the income statement, unless the asset is carried at revalued amount, in which case, such impairment loss is treated as a revaluation decrease. Please refer to Note 2.6 for the treatment of a revaluation decrease. An impairment loss for an asset other than goodwill is reversed only if, there has been a change in the estimates used to determine the asset’s recoverable amount since the last impairment loss was recognised. The carrying amount of this asset is increased to its revised recoverable amount, provided that this amount does not exceed the carrying amount that would have been determined (net of any accumulated depreciation) had no impairment loss been recognised for the asset in prior years. A reversal of impairment loss for an asset other than goodwill is recognised in the income statement, unless the asset is carried at revalued amount, in which case, such reversal is treated as a revaluation increase. However, to the extent that an impairment loss on the same revalued asset was previously recognised in the income statement, a reversal of that impairment is also recognised in the income statement.
ANNUAL REPORT 2015 | OF EXCELLENCE & ELEGANCE ———— 49
NOTES TO THE FINANCIAL STATEMENTS For the Financial Year Ended 30 June 2015
2. SIGNIFICANT ACCOUNTING POLICIES (continued) 2.10 Financial assets
(a) Classification The Group classifies its financial assets in the following categories: at fair value through profit or loss, loans and receivables and available-for-sale. The classification depends on the nature of the assets and the purpose for which the assets were acquired. Management determines the classification of its financial assets at initial recognition.
(i) Financial assets at fair value through profit or loss
This category has two sub-categories: financial assets held for trading, and those designated at fair value through profit or loss at inception. A financial asset is classified as held for trading if it is acquired principally for the purpose of selling in the short term. Financial assets designated as at fair value through profit or loss at inception are those that are managed and their performances are evaluated on a fair value basis, in accordance with a documented Group investment strategy. Derivatives are also categorised as held for trading unless they are designated as hedges. Assets in this category are presented as current assets if they are either held for trading or are expected to be realised within 12 months after the end of the reporting period.
(ii) Loans and receivables
Loans and receivables are non-derivative financial assets with fixed or determinable payments that are not quoted in an active market. They are presented as current assets, except for those expected to be realised later than 12 months after the end of the reporting period which are presented as non-current assets. Loans and receivables are presented as “cash and cash equivalents” and “trade and other receivables” on the statement of financial position and also includes deposits and sundry receivables classified as “other current assets” and “amounts due from customers” included in development properties.
(iii) Available-for-sale financial assets
Available-for-sale financial assets are non-derivatives that are either designated in this category or not classified in any of the other categories. They are presented as non-current assets unless the investment matures or management intends to dispose of the assets within 12 months after the end of the reporting period.
(b) Recognition and derecognition
Regular way purchases and sales of financial assets are recognised on trade date - the date on which the Group commits to purchase or sell the asset.
Financial assets are derecognised when the rights to receive cash flows from the financial assets have expired or have been transferred and the Group has transferred substantially all risks and rewards of ownership. On disposal of a financial asset, the difference between the carrying amount and the sale proceeds is recognised in the income statement. Any amount previously recognised in other comprehensive income relating to that asset is reclassified to the income statement.
(c) Initial measurement Financial assets are initially recognised at fair value plus transaction costs except for financial assets at fair value through profit or loss, which are recognised at fair value. Transaction costs for financial assets at fair value through profit or loss are recognised immediately in the income statement.
50 ———— WING TAI HOLDINGS LIMITED
NOTES TO THE FINANCIAL STATEMENTS For the Financial Year Ended 30 June 2015 2. SIGNIFICANT ACCOUNTING POLICIES (continued) 2.10 Financial assets (continued)
(d) Subsequent measurement
Available-for-sale financial assets and financial assets at fair value through profit or loss are subsequently carried at fair value. Loans and receivables are subsequently carried at amortised cost using the effective interest method.
Changes in the fair values of financial assets at fair value through profit or loss including the effects of currency translation, interest and dividends, are recognised in the income statement when the changes arise.
Interest and dividend income on available-for-sale financial assets are recognised separately in the income statement. Changes in the fair values of available-for-sale equity securities (i.e. non-monetary items) are recognised in other comprehensive income, together with the related currency translation differences.
(e) Impairment
The Group assesses at the end of each reporting period whether there is objective evidence that a financial asset or a group of financial assets is impaired and recognises an allowance for impairment when such evidence exists.
(i) Loans and receivables
Significant financial difficulties of the debtor, probability that the debtor will enter bankruptcy and default or significant delay in payments are objective evidence that these financial assets are impaired.
The carrying amount of these assets is reduced through the use of an impairment allowance account which is calculated as the difference between the carrying amount and the present value of estimated future cash flows, discounted at the original effective interest rate. When the asset becomes uncollectible, it is written off against the allowance account. Subsequent recoveries of amounts previously written off are recognised against the same line item in the income statement.
The impairment allowance account is reduced through the income statement in a subsequent period when the amount of impairment loss decreases and the related decrease can be objectively measured. The carrying amount of the asset previously impaired is increased to the extent that the new carrying amount does not exceed the amortised cost had no impairment been recognised in prior periods.
(ii) Available-for-sale financial assets
In addition to the objective evidence of impairment described in Note 2.10(e)(i), a significant or prolonged decline in the fair value of an equity security below its cost is considered as an indicator that the available-for-sale financial asset is impaired. If any evidence of impairment exists, the cumulative loss that was previously recognised in other comprehensive income is reclassified to the income statement. The cumulative loss is measured as the difference between the acquisition cost (net of any principal repayments and amortisation) and the current fair value, less any impairment loss previously recognised in the income statement. The impairment losses recognised in the income statement on equity securities are not reversed through the income statement.
ANNUAL REPORT 2015 | OF EXCELLENCE & ELEGANCE ———— 51
NOTES TO THE FINANCIAL STATEMENTS For the Financial Year Ended 30 June 2015 2. SIGNIFICANT ACCOUNTING POLICIES (continued)
2.11 Financial guarantees
The Company has issued corporate guarantees to banks for bank borrowings of its subsidiary and joint venture companies. These guarantees are financial guarantees as they require the Company to reimburse the banks if the subsidiary or joint venture companies fail to make principal or interest payments when due in accordance with the terms of their borrowings.
Financial guarantees are initially recognised at their fair values plus transaction costs in the Company’s statement of financial position.
Financial guarantees are subsequently amortised to the income statement over the period of the subsidiary or joint venture companies’ borrowings, unless it is probable that the Company will reimburse the banks for an amount higher than the unamortised amount. In this case, the financial guarantees shall be carried at the expected amount payable to the banks in the Company’s statement of financial position.
Intra-group transactions are eliminated on consolidation.
2.12 Inventories
Inventories are carried at the lower of cost and net realisable value. Cost is determined using the weighted average method. The cost of finished goods and work-in-progress comprises raw materials, direct labour, other direct costs and related production overheads (based on normal operating capacity) but excludes borrowing costs. Net realisable value is the estimated selling price in the ordinary course of business, less the estimated costs of completion and applicable variable selling expenses.
2.13 Borrowings and borrowing costs
Borrowings are presented as current liabilities unless the Group has an unconditional right to defer settlement for at least 12 months after the end of the reporting period, in which they are presented as non-current liabilities.
Borrowings are initially recognised at fair value (net of transaction costs) and subsequently carried at amortised cost. Any difference between the proceeds (net of transaction costs) and the redemption value is recognised in the income statement over the period of the borrowings using the effective interest method.
Borrowing costs are recognised in the income statement using the effective interest method, except for those costs that are directly attributable to borrowings acquired specifically for the construction or development of properties. The actual borrowing costs incurred during the period up to the issuance of the temporary occupation permit less any investment income on temporary investment of these borrowings, are capitalised as cost of the property under development.
2.14 Derivative financial instruments and hedging activities
A derivative financial instrument is initially recognised at its fair value on the date the contract is entered into and is subsequently carried at its fair value. The method of recognising the resulting gain or loss depends on whether the derivative is designated as a hedging instrument, and if so, the nature of the item being hedged. The Group designates each hedge as either fair value hedge, cash flow hedge or net investment hedge.
Fair value changes on derivatives that are not designated or do not qualify for hedge accounting are recognised in the income statement when the changes arise.
The Group documents at the inception of the transaction the relationship between the hedging instruments and the hedged items, as well as its risk management objective and strategies for undertaking various hedging transactions. The Group also documents its assessment, both at hedge inception and on an ongoing basis, of whether the derivatives designated as hedging instruments are highly effective in offsetting changes in fair value or cash flows of the hedged items.

52 ———— WING TAI HOLDINGS LIMITED
NOTES TO THE FINANCIAL STATEMENTS For the Financial Year Ended 30 June 2015 2. SIGNIFICANT ACCOUNTING POLICIES (continued) 2.14 Derivative financial instruments and hedging activities (continued)
The carrying amount of a derivative designated as a hedge is presented as a non-current asset or liability if the remaining expected life of the hedged item is more than 12 months, and as a current asset or liability, if the remaining expected life of the hedged item is less than 12 months. The fair value of a trading derivative is presented as a current asset or liability.
The Group has entered into interest rate and cross currency swaps that are cash flow hedges for the Group’s exposure to interest rate and currency risks on its borrowings. These contracts entitle the Group to receive interest at floating rates on notional principal amounts and oblige the Group to pay interest at fixed rates on the same notional principal amounts or on notional principal amounts denominated in a different currency, thus allowing the Group to raise borrowings at floating rates and swap them into fixed rate borrowings denominated in the same or different currencies.
The fair value changes on the effective portion of interest rate and cross currency swaps designated as cash flow hedges are recognised in other comprehensive income and reclassified to the income statement when the hedged interest expense on the borrowings is recognised in the income statement and/or the hedged borrowing is settled. The fair value changes on the ineffective portion of the interest rate and cross currency swaps are recognised immediately in the income statement.
The Group has entered into currency forwards to manage the Group’s exposure to currency risk on highly probable forecasted transactions in foreign currencies. These contracts do not qualify for hedge accounting.
2.15 Fair value estimation of financial assets and liabilities
The fair values of financial instruments traded in active markets (such as exchange-traded and over-the-counter securities and derivatives) are based on quoted market prices at the end of the reporting period. The quoted market prices used for financial assets are the current bid prices; the appropriate quoted market prices used for financial liabilities are the current asking prices. The fair values of financial instruments that are not traded in an active market are determined by using valuation techniques. The Group uses a variety of methods and makes assumptions based on market conditions that are existing at the end of each reporting period. Where appropriate, quoted market prices or dealer quotes for similar instruments are used. Valuation techniques, such as discounted cash flow analysis, are also used to determine the fair values of the financial instruments. The fair values of interest rate and cross currency swaps are calculated as the present value of the estimated future cash flows discounted at actively quoted interest and forward exchange rates. The fair values of currency forwards are determined using actively quoted forward exchange rates.
The fair values of financial liabilities carried at amortised cost are estimated by discounting the future contractual cash flows at the current market interest rates that are available to the Group for similar financial liabilities. The fair values of current financial assets and liabilities carried at amortised cost approximate their carrying amounts.
2.16 Offsetting financial instruments
Financial assets and liabilities are offset and the net amount reported in the statement of financial position when there is a legally enforceable right to offset and there is an intention to settle on a net basis or realise the asset and settle the liability simultaneously.

ANNUAL REPORT 2015 | OF EXCELLENCE & ELEGANCE ———— 53
NOTES TO THE FINANCIAL STATEMENTS For the Financial Year Ended 30 June 2015 2. SIGNIFICANT ACCOUNTING POLICIES (continued) 2.17 Operating leases
(a) When the Group is the lessee: Leases where substantially all risks and rewards incidental to ownership are retained by the lessors are classified as operating leases. Payments made under operating leases (net of any incentives received from the lessors) are recognised in the income statement on a straight-line basis over the period of the lease.
Contingent rents are recognised in the income statement when incurred.
(b) When the Group is the lessor:
Leases of investment properties where the Group retains substantially all risks and rewards incidental to ownership are classified as operating leases. Rental income from operating leases (net of any incentives given to the lessees) is recognised in the income statement on a straight-line basis over the lease term. Contingent rents are recognised in the income statement when earned.
2.18 Income taxes
Current income tax for current and prior periods is recognised at the amount expected to be paid to or recovered from the tax authorities, using the tax rates and tax laws that have been enacted or substantively enacted by the end of the reporting period. Deferred income tax is recognised for all temporary differences arising between the tax bases of assets and liabilities and their carrying amounts in the financial statements except when the deferred income tax arises from the initial recognition of goodwill or an asset or liability in a transaction that is not a business combination and affects neither accounting nor taxable profit or loss at the time of the transaction. A deferred income tax liability is recognised on temporary differences arising on investments in subsidiary, associated and joint venture companies, except where the Group is able to control the timing of the reversal of the temporary difference and it is probable that the temporary difference will not reverse in the foreseeable future.
A deferred income tax asset is recognised to the extent that it is probable that future taxable profit will be available against which the deductible temporary differences and tax losses can be utilised.
Deferred income tax is measured:
(a) at the tax rates that are expected to apply when the related deferred income tax asset is realised or the
deferred income tax liability is settled, based on tax rates and tax laws that have been enacted or substantively enacted by the end of the reporting period; and
(b) based on the tax consequence that will follow from the manner in which the Group expects, at the end of the
reporting period, to recover or settle the carrying amounts of its assets and liabilities except for investment properties. Investment property measured at fair value is presumed to be recovered entirely through sale.
Current and deferred income taxes are recognised in the income statement, except to the extent that the tax arises from a business combination or a transaction which is recognised directly in equity. Deferred income tax arising from a business combination is adjusted against goodwill on acquisition.
2.19 Provisions
Provisions are recognised when the Group has a present legal or constructive obligation as a result of past events, it is more likely than not that an outflow of resources will be required to settle the obligation and the amount has been reliably estimated.

54 ———— WING TAI HOLDINGS LIMITED
NOTES TO THE FINANCIAL STATEMENTS For the Financial Year Ended 30 June 2015 2. SIGNIFICANT ACCOUNTING POLICIES
(continued)
2.20 Trade and other payables
Trade and other payables represent liabilities for goods and services provided to the Group prior to the end of the reporting period which are unpaid. They are classified as current liabilities if payment is due within one year or less (or in the normal operating cycle of the business, if longer). Otherwise, they are presented as non-current liabilities.
Trade and other payables are initially recognised at fair value, and subsequently carried at amortised cost, using the effective interest method.
2.21 Employee compensation Employee benefits are recognised in the income statement, unless the cost qualifies to be capitalised as an asset.
(a) Defined contribution plans
Defined contribution plans are post-employment benefit plans under which the Group pays fixed contributions into separate entities such as the Central Provident Fund on a mandatory, contractual or voluntary basis. The Group has no further payment obligations once the contributions have been paid.
(b) Share-based payment
The Group operates an equity-settled, share-based payment plan. The value of the employee services received in exchange for the grant of shares and share options is recognised in the income statement with a corresponding increase in the share-based payment reserve over the vesting period. The total amount to be recognised over the vesting period is determined by reference to the fair value of the shares and share options granted on the date of the grant. Non-market vesting conditions are included in the estimation of the number of shares and share options that are expected to vest on the vesting date. At the end of each reporting period, the Group revises its estimates of the number of shares and share options that are expected to vest on the vesting date and recognises the impact of the revision of the estimates in the income statement, with a corresponding adjustment to the share-based payment reserve over the remaining vesting period.
2.22 Currency translation
(a) Functional and presentation currency
Items included in the financial statements of each entity in the Group are measured using the currency of the primary economic environment in which the entity operates (“functional currency”). The financial statements are presented in Singapore Dollars, which is the functional currency of the Company.
(b) Transactions and balances
Transactions in a currency other than the functional currency (“foreign currency”) are translated into the functional currency using the exchange rates at the dates of the transactions. Currency translation differences resulting from the settlement of such transactions and from the translation of monetary assets and liabilities denominated in foreign currencies at the closing rates at the end of the reporting period are recognised in the income statement. However, in the consolidated financial statements, currency translation differences arising from borrowings in foreign currencies and other currency instruments designated and qualifying as net investment hedges and net investment in foreign operations, are recognised in other comprehensive income and accumulated in currency translation reserve. When a foreign operation is disposed of or any loan forming part of the net investment in the foreign operation is repaid, a proportionate share of the accumulated currency translation differences is reclassified to the income statement, as part of the gain or loss on disposal.
Non-monetary items measured at fair values in foreign currencies are translated using the exchange rates at the date when the fair values are determined.
ANNUAL REPORT 2015 | OF EXCELLENCE & ELEGANCE ———— 55
NOTES TO THE FINANCIAL STATEMENTS For the Financial Year Ended 30 June 2015 2. SIGNIFICANT ACCOUNTING POLICIES
(continued)
2.22 Currency translation (continued)
(c) Translation of Group entities’ financial statements The results and financial position of all the Group entities that have a functional currency different from the presentation currency are translated into the presentation currency as follows:
(i) Assets and liabilities are translated at the closing exchange rates at the end of the reporting period;
(ii) Income and expenses are translated at average exchange rates (unless the average is not a
reasonable approximation of the cumulative effect of the rates prevailing on the transaction dates, in which case the income and expenses are translated using the exchange rates at the dates of the transactions); and
(iii) All resulting currency translation differences are recognised in other comprehensive income and
accumulated in the currency translation reserve. These currency translation differences are reclassified to the income statement on disposal or partial disposal of the entity giving rise to such reserve.
Goodwill and fair value adjustments arising on the acquisition of foreign operations are treated as assets and liabilities of the foreign operations and translated at the closing rates at the end of the reporting period.
2.23 Segment reporting
Operating segments are reported in a manner consistent with the internal reporting provided to management, who are responsible for allocating resources and assessing the performance of the operating segments. Sales between segments are carried out at arm’s length. The revenue from external parties reported to management is measured in a manner consistent with that in the income statement. Management assesses the performance of the operating segments based on a measure of earnings before interest and tax (“EBIT”) for continuing operations. Interest income and finance costs are not allocated to the segments. The amounts provided to management with respect to total assets and liabilities are measured in a manner consistent with that of the financial statements. These assets and liabilities are allocated based on the operations of the segment. All assets and liabilities are allocated to the reportable segments other than tax recoverable and current and deferred income tax liabilities. Segment capital expenditure is the total cost incurred during the financial year to acquire property, plant and equipment and investment properties.
2.24 Cash and cash equivalents
For the purpose of presentation in the consolidated statement of cash flows, cash and cash equivalents include fixed deposits with financial institutions and cash and bank balances, which are subject to an insignificant risk of change in value. For cash subjected to restriction, assessment is made on the economic substance of the restriction and whether they meet the definition of cash and cash equivalents.
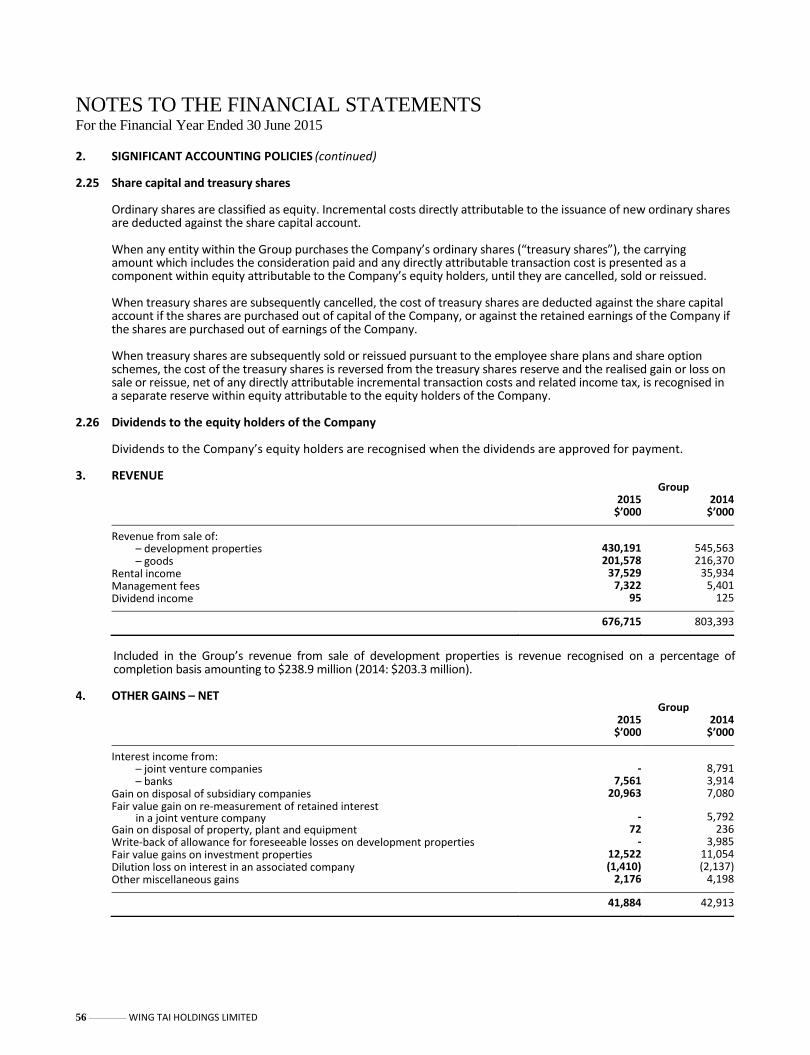
56 ———— WING TAI HOLDINGS LIMITED
NOTES TO THE FINANCIAL STATEMENTS For the Financial Year Ended 30 June 2015 2. SIGNIFICANT ACCOUNTING POLICIES
(continued)
2.25 Share capital and treasury shares
Ordinary shares are classified as equity. Incremental costs directly attributable to the issuance of new ordinary shares are deducted against the share capital account. When any entity within the Group purchases the Company’s ordinary shares (“treasury shares”), the carrying amount which includes the consideration paid and any directly attributable transaction cost is presented as a component within equity attributable to the Company’s equity holders, until they are cancelled, sold or reissued. When treasury shares are subsequently cancelled, the cost of treasury shares are deducted against the share capital account if the shares are purchased out of capital of the Company, or against the retained earnings of the Company if the shares are purchased out of earnings of the Company. When treasury shares are subsequently sold or reissued pursuant to the employee share plans and share option schemes, the cost of the treasury shares is reversed from the treasury shares reserve and the realised gain or loss on sale or reissue, net of any directly attributable incremental transaction costs and related income tax, is recognised in a separate reserve within equity attributable to the equity holders of the Company.
2.26 Dividends to the equity holders of the Company Dividends to the Company’s equity holders are recognised when the dividends are approved for payment. 3. REVENUE
Group 2015
$’000 2014
$’000
Revenue from sale of: – development properties 430,191 545,563 – goods 201,578 216,370 Rental income 37,529 35,934 Management fees 7,322 5,401 Dividend income 95 125
676,715 803,393
Included in the Group’s revenue from sale of development properties is revenue recognised on a percentage of completion basis amounting to $238.9 million (2014: $203.3 million).
4. OTHER GAINS – NET
Group 2015
$’000 2014
$’000
Interest income from: – joint venture companies - 8,791 – banks 7,561 3,914 Gain on disposal of subsidiary companies 20,963 7,080 Fair value gain on re-measurement of retained interest
in a joint venture company - 5,792 Gain on disposal of property, plant and equipment 72 236 Write-back of allowance for foreseeable losses on development properties - 3,985 Fair value gains on investment properties 12,522 11,054 Dilution loss on interest in an associated company (1,410) (2,137) Other miscellaneous gains 2,176 4,198
41,884 42,913

ANNUAL REPORT 2015 | OF EXCELLENCE & ELEGANCE ———— 57
NOTES TO THE FINANCIAL STATEMENTS For the Financial Year Ended 30 June 2015
5. EXPENSES BY NATURE Group
2015 $’000
2014 $’000
Depreciation of property, plant and equipment 14,390 14,354
Employee compensation 74,939 71,999
Auditors’ remuneration paid/payable to: – auditor of the Company 459 409 – other auditors 237 230 Other fees paid/payable to: – auditor of the Company 15 66 – other auditors 330 1,026 Fair value gains on derivative financial instruments (121) (58) (Write-back of allowance)/allowance for stock obsolescence (72) 2,725
Write-off of property, plant and equipment 262 460
Impairment loss on property, plant and equipment 3,582 365
Rental expense on operating leases 61,261 60,843
Foreign exchange loss 3,279 100
Development cost included in cost of sales 315,630 326,055 Raw materials and finished goods included in cost of sales 89,952 90,517
Included in the Group’s rental expense on operating leases is contingent rent amounting to $1.5 million (2014: $2.2 million). Contingent rent on certain leases is based on a percentage of monthly sales in excess of specified amounts. Other contingent rent is based entirely on a percentage of sales.
6. EMPLOYEE COMPENSATION
Group
2015 $’000
2014 $’000
Wages and salaries (including directors’ remuneration) 65,989 63,025
Employer’s contribution to defined contribution plans
including Central Provident Fund 6,683 5,972 Share-based payment 2,267 3,002
74,939 71,999
Please refer to Note 33(b) for directors’ remuneration.
7. FINANCE COSTS
Group
2015 $’000
2014 $’000
Interest expense to banks 47,335 39,897
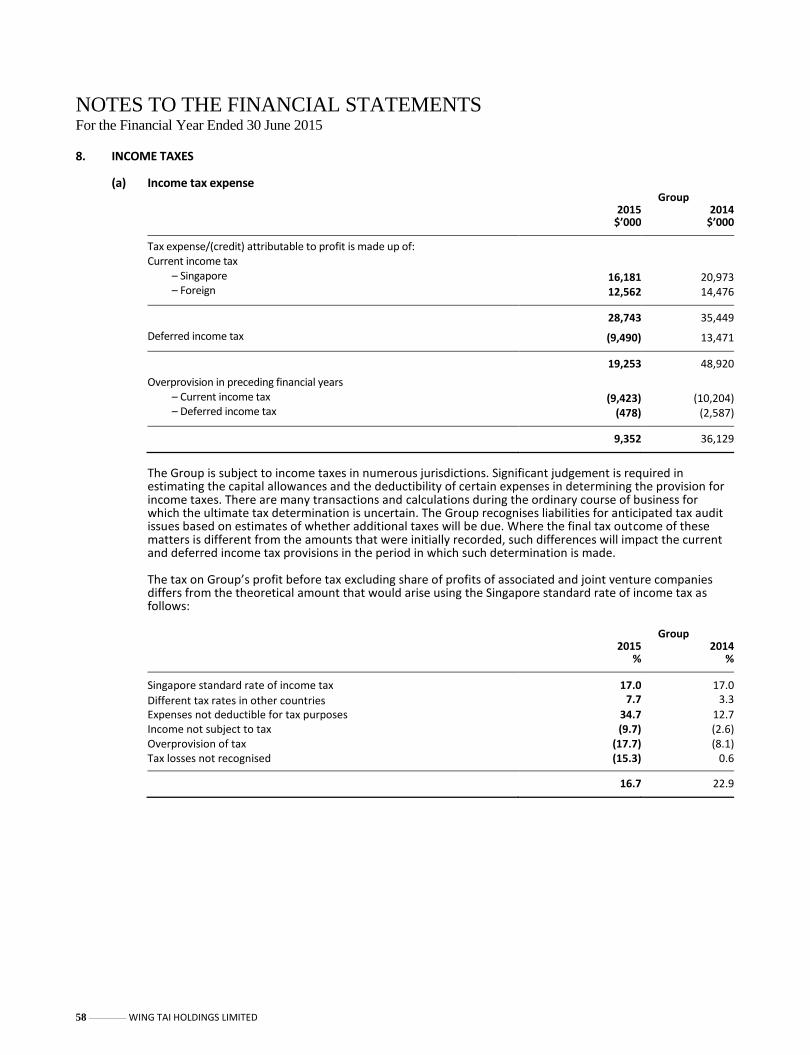
58 ———— WING TAI HOLDINGS LIMITED
NOTES TO THE FINANCIAL STATEMENTS For the Financial Year Ended 30 June 2015 8. INCOME TAXES (a) Income tax expense Group
2015 $’000
2014 $’000
Tax expense/(credit) attributable to profit is made up of:
Current income tax
– Singapore 16,181 20,973
– Foreign 12,562 14,476
28,743 35,449
Deferred income tax (9,490) 13,471
19,253 48,920
Overprovision in preceding financial years – Current income tax (9,423) (10,204)
– Deferred income tax (478) (2,587)
9,352 36,129
The Group is subject to income taxes in numerous jurisdictions. Significant judgement is required in estimating the capital allowances and the deductibility of certain expenses in determining the provision for income taxes. There are many transactions and calculations during the ordinary course of business for which the ultimate tax determination is uncertain. The Group recognises liabilities for anticipated tax audit issues based on estimates of whether additional taxes will be due. Where the final tax outcome of these matters is different from the amounts that were initially recorded, such differences will impact the current and deferred income tax provisions in the period in which such determination is made. The tax on Group’s profit before tax excluding share of profits of associated and joint venture companies differs from the theoretical amount that would arise using the Singapore standard rate of income tax as follows:
Group
2015 %
2014 %
Singapore standard rate of income tax 17.0 17.0 Different tax rates in other countries 7.7 3.3
Expenses not deductible for tax purposes 34.7 12.7 Income not subject to tax (9.7) (2.6) Overprovision of tax (17.7) (8.1)
Tax losses not recognised (15.3) 0.6
16.7 22.9
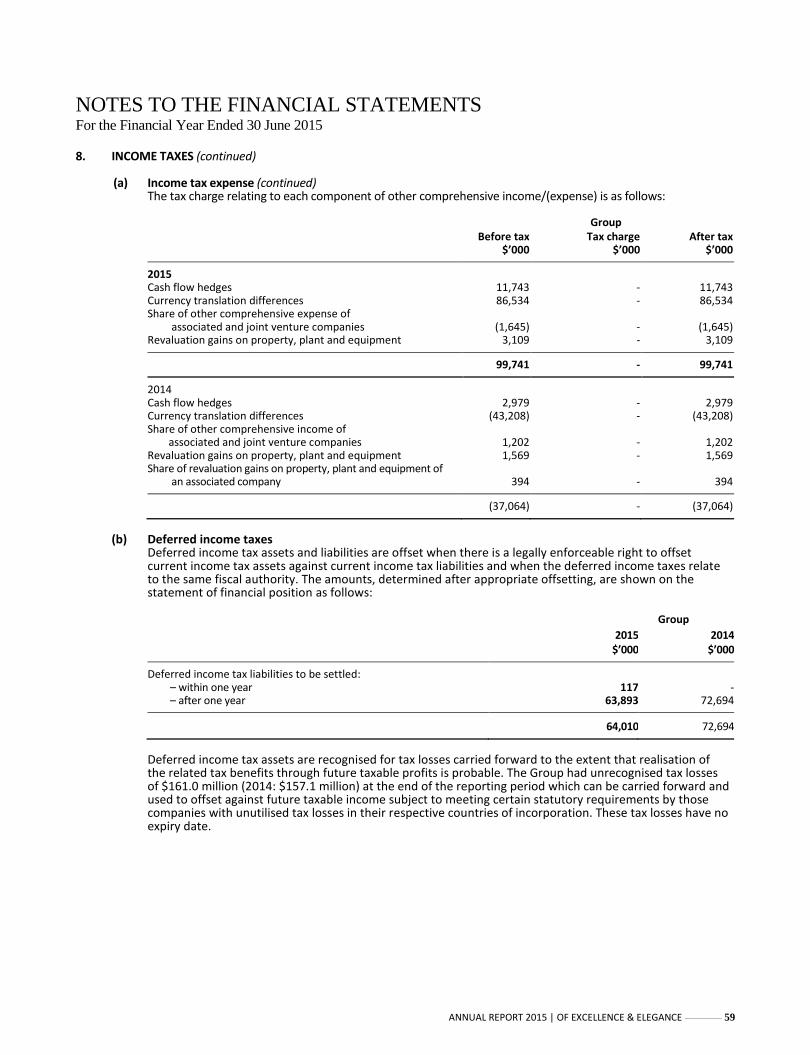
ANNUAL REPORT 2015 | OF EXCELLENCE & ELEGANCE ———— 59
NOTES TO THE FINANCIAL STATEMENTS For the Financial Year Ended 30 June 2015 8. INCOME TAXES (continued)
(a) Income tax expense (continued) The tax charge relating to each component of other comprehensive income/(expense) is as follows:
Group Before tax Tax charge After tax $’000 $’000 $’000
2015 Cash flow hedges 11,743 - 11,743 Currency translation differences 86,534 - 86,534 Share of other comprehensive expense of
associated and joint venture companies
(1,645) -
(1,645) Revaluation gains on property, plant and equipment 3,109 - 3,109
99,741 - 99,741
2014 Cash flow hedges 2,979 - 2,979 Currency translation differences (43,208) - (43,208) Share of other comprehensive income of
associated and joint venture companies 1,202 - 1,202 Revaluation gains on property, plant and equipment 1,569 - 1,569 Share of revaluation gains on property, plant and equipment of
an associated company 394 - 394
(37,064) - (37,064)
(b) Deferred income taxes
Deferred income tax assets and liabilities are offset when there is a legally enforceable right to offset current income tax assets against current income tax liabilities and when the deferred income taxes relate to the same fiscal authority. The amounts, determined after appropriate offsetting, are shown on the statement of financial position as follows:
Group
2015 2014 $’000 $’000
Deferred income tax liabilities to be settled: – within one year 117 -
– after one year 63,893 72,694
64,010 72,694
Deferred income tax assets are recognised for tax losses carried forward to the extent that realisation of the related tax benefits through future taxable profits is probable. The Group had unrecognised tax losses of $161.0 million (2014: $157.1 million) at the end of the reporting period which can be carried forward and used to offset against future taxable income subject to meeting certain statutory requirements by those companies with unutilised tax losses in their respective countries of incorporation. These tax losses have no expiry date.

60 ———— WING TAI HOLDINGS LIMITED
NOTES TO THE FINANCIAL STATEMENTS For the Financial Year Ended 30 June 2015 8. INCOME TAXES (continued)
(b) Deferred income taxes (continued) The movement in deferred income tax assets and liabilities
(prior to offsetting of balances within the same
tax jurisdiction) during the financial year is as follows:
Deferred income tax liabilities – Group
Accelerated
tax depreciation
Revaluation gains
Recognition of profits on
percentage of completion Others Total
$’000 $’000 $’000 $’000 $’000
2015 Beginning of financial year 4,067 27,592 31,019 10,471 73,149 Currency translation differences (30) 258 - 1,003 1,231 (Credited)/charged to income statement (128) 23 (16,881) 7,250 (9,736)
End of financial year 3,909 27,873 14,138 18,724 64,644
2014 Beginning of financial year 4,531 27,362 27,637 3,174 62,704 Currency translation differences (14) (168) - (285) (467) (Credited)/charged to income statement (450) 398 3,382 7,582 10,912
End of financial year 4,067 27,592 31,019 10,471 73,149
Deferred income tax assets – Group
Provisions Tax losses Others Total
$’000 $’000 $’000 $’000
2015 Beginning of financial year 19 343 93 455 Currency translation differences (3) (28) (22) (53) Credited to income statement - 4 228 232
End of financial year 16 319 299 634
2014 Beginning of financial year 19 328 90 437 Currency translation differences - (8) (2) (10) Credited to income statement - 23 5 28
End of financial year 19 343 93 455
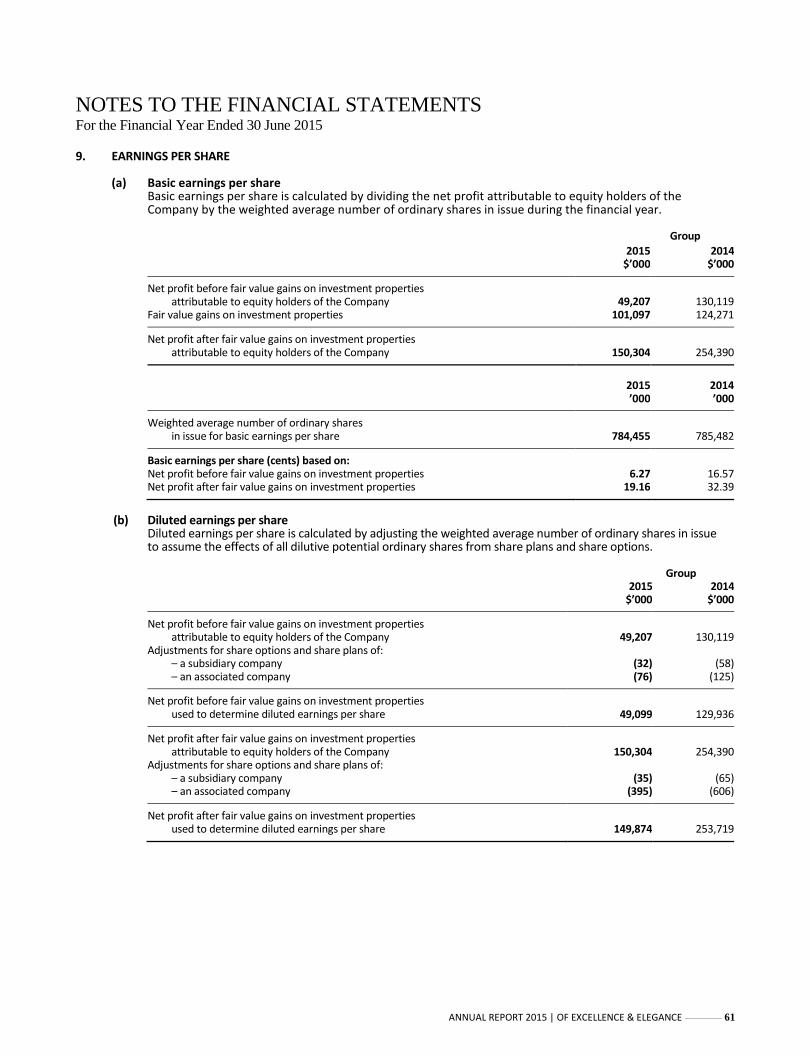
ANNUAL REPORT 2015 | OF EXCELLENCE & ELEGANCE ———— 61
NOTES TO THE FINANCIAL STATEMENTS For the Financial Year Ended 30 June 2015 9. EARNINGS PER SHARE
(a) Basic earnings per share Basic earnings per share is calculated by dividing the net profit attributable to equity holders of the Company by the weighted average number of ordinary shares in issue during the financial year.
Group
2015 $’000
2014 $’000
Net profit before fair value gains on investment properties attributable to equity holders of the Company 49,207 130,119
Fair value gains on investment properties 101,097 124,271
Net profit after fair value gains on investment properties attributable to equity holders of the Company 150,304 254,390
2015
’000 2014
’000
Weighted average number of ordinary shares in issue for basic earnings per share 784,455 785,482
Basic earnings per share (cents) based on: Net profit before fair value gains on investment properties 6.27 16.57 Net profit after fair value gains on investment properties 19.16 32.39
(b) Diluted earnings per share
Diluted earnings per share is calculated by adjusting the weighted average number of ordinary shares in issue to assume the effects of all dilutive potential ordinary shares from share plans and share options.
Group 2015 2014 $’000 $’000
Net profit before fair value gains on investment properties attributable to equity holders of the Company 49,207 130,119
Adjustments for share options and share plans of: – a subsidiary company (32) (58) – an associated company (76) (125)
Net profit before fair value gains on investment properties used to determine diluted earnings per share 49,099 129,936
Net profit after fair value gains on investment properties attributable to equity holders of the Company 150,304 254,390
Adjustments for share options and share plans of: – a subsidiary company (35) (65) – an associated company (395) (606)
Net profit after fair value gains on investment properties used to determine diluted earnings per share 149,874 253,719

62 ———— WING TAI HOLDINGS LIMITED
NOTES TO THE FINANCIAL STATEMENTS For the Financial Year Ended 30 June 2015 9. EARNINGS PER SHARE (continued)
(b) Diluted earnings per share (continued)
2015
2014 ‘000 ‘000
Weighted average number of ordinary shares in issue for basic earnings per share 784,455 785,482 Adjustments for: – share plans 2,805 3,424 – share options 138 313
Number of ordinary shares used to determine diluted earnings per share 787,398 789,219
Diluted earnings per share (cents) based on: Net profit before fair value gains on investment properties 6.24 16.46 Net profit after fair value gains on investment properties 19.03 32.15
10. CASH AND CASH EQUIVALENTS
Group Company 2015 2014 2015 2014 $’000 $’000 $’000 $’000
Fixed deposits with financial institutions 575,561 521,676 269,000 210,000 Cash and bank balances 305,050 313,086 194,078 197,620
880,611 834,762 463,078 407,620
Included in cash and cash equivalents of the Group are amounts held under project accounts totalling $128.5 million (2014: $182.9 million), withdrawals of which are restricted to payments for expenditures incurred on projects.
The carrying amounts of cash and cash equivalents approximated their fair values. Significant restrictions Cash and short-term deposits of $110.1 million (2014: $70.8 million) are held in the People’s Republic of China and are subject to local exchange control regulations. These local exchange control regulations provide for restrictions on exporting capital from the country, other than through normal dividends. Disposal of subsidiary companies On 5 September 2014, the Group disposed of its effective interests of 70% in PT Windas Development for a cash consideration of $27.1 million (net of withholding tax). On 25 June 2014, the Group disposed of its effective interests of 50% in Winnoma Investment Pte. Ltd., Winzen Investment Pte. Ltd. and Yong Yao (Shanghai) Property Development Co., Ltd for a cash consideration of $4.9 million. The Group retained effective interests of 50% in these entities as at 30 June 2014.

ANNUAL REPORT 2015 | OF EXCELLENCE & ELEGANCE ———— 63
NOTES TO THE FINANCIAL STATEMENTS For the Financial Year Ended 30 June 2015 10. CASH AND CASH EQUIVALENTS (continued)
Disposal of subsidiary companies (continued) The effects of the disposal on the cash flows of the Group were:
Group 2015 2014 $’000 $’000
Carrying amount of assets and liabilities disposed of: Cash and cash equivalents - 4,527 Development properties - 110,879 Other current assets 73 108 Property, plant and equipment - 105 Shareholders’ loans (39,450) - Trade and other payables (34) (117,363)
Net liabilities derecognised (39,411) (1,744) Equity interests retained as joint venture company - 872 Non-controlling interests 11,823 -
Net liabilities disposed of (27,588) (872) Re-classification of currency translation reserve 3,229 (1,288) Novation of shareholders’ loans 30,529 - Gain on disposal of subsidiary companies 20,963 7,080
Cash proceeds from disposal 27,133 4,920 Repayment of shareholder’s loan - 58,503 Cash and cash equivalents in subsidiary companies disposed of - (4,527)
Net cash inflow on disposal 27,133 58,896
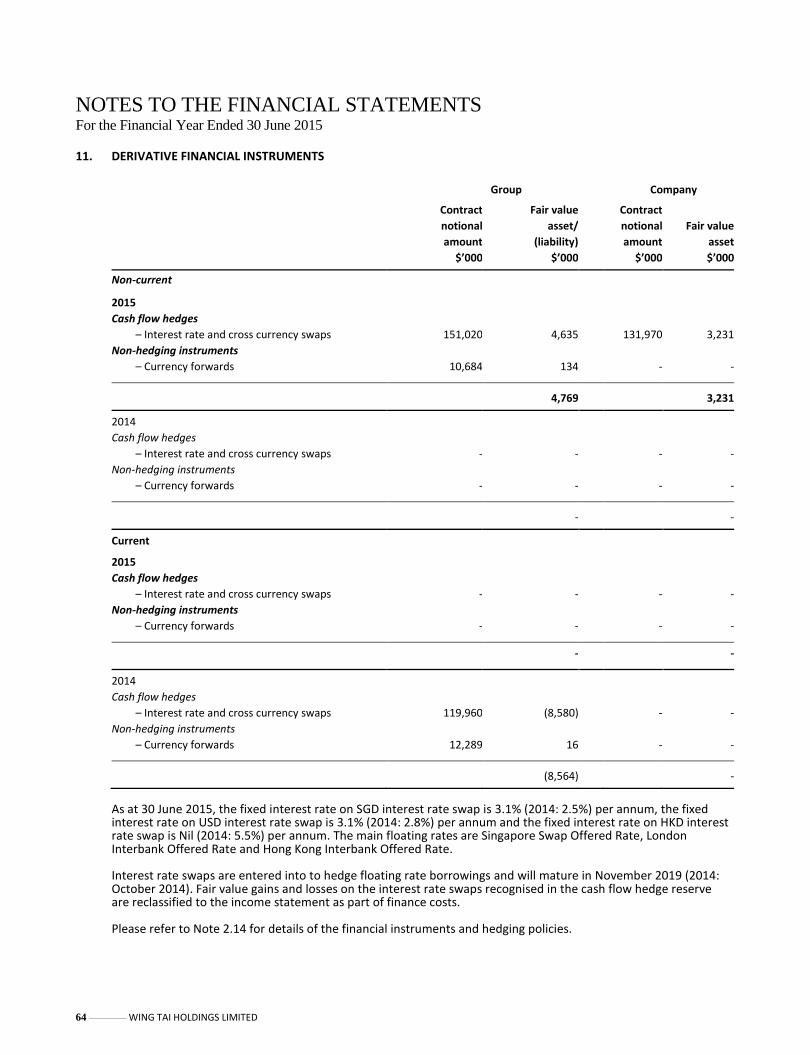
64 ———— WING TAI HOLDINGS LIMITED
NOTES TO THE FINANCIAL STATEMENTS For the Financial Year Ended 30 June 2015 11. DERIVATIVE FINANCIAL INSTRUMENTS
Group Company
Contract Fair value Contract
notional asset/ notional Fair value
amount (liability) amount asset
$’000 $’000 $’000 $’000
Non-current
2015
Cash flow hedges
– Interest rate and cross currency swaps 151,020 4,635 131,970 3,231
Non-hedging instruments
– Currency forwards 10,684 134 - -
4,769 3,231
2014
Cash flow hedges
– Interest rate and cross currency swaps - - - -
Non-hedging instruments
– Currency forwards - - - -
- -
Current
2015
Cash flow hedges
– Interest rate and cross currency swaps - - - -
Non-hedging instruments
– Currency forwards - - - -
- -
2014
Cash flow hedges
– Interest rate and cross currency swaps 119,960 (8,580) - -
Non-hedging instruments
– Currency forwards 12,289 16 - -
(8,564) -
As at 30 June 2015, the fixed interest rate on SGD interest rate swap is 3.1% (2014: 2.5%) per annum, the fixed interest rate on USD interest rate swap is 3.1% (2014: 2.8%) per annum and the fixed interest rate on HKD interest rate swap is Nil (2014: 5.5%) per annum. The main floating rates are Singapore Swap Offered Rate, London Interbank Offered Rate and Hong Kong Interbank Offered Rate.
Interest rate swaps are entered into to hedge floating rate borrowings and will mature in November 2019 (2014: October 2014). Fair value gains and losses on the interest rate swaps recognised in the cash flow hedge reserve are reclassified to the income statement as part of finance costs.
Please refer to Note 2.14 for details of the financial instruments and hedging policies.
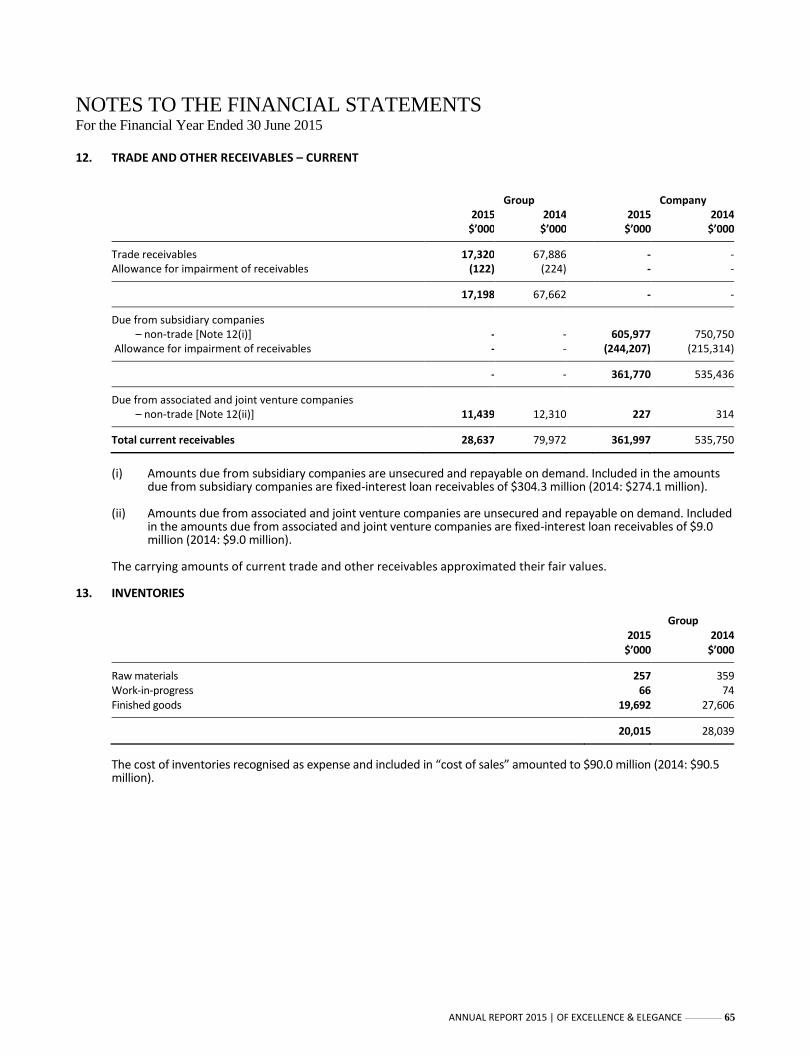
ANNUAL REPORT 2015 | OF EXCELLENCE & ELEGANCE ———— 65
NOTES TO THE FINANCIAL STATEMENTS For the Financial Year Ended 30 June 2015 12. TRADE AND OTHER RECEIVABLES – CURRENT Group Company 2015 2014 2015 2014 $’000 $’000 $’000 $’000
Trade receivables 17,320 67,886 - -
Allowance for impairment of receivables (122) (224) - -
17,198 67,662 - -
Due from subsidiary companies
– non-trade [Note 12(i)] - - 605,977 750,750 Allowance for impairment of receivables - - (244,207) (215,314)
- - 361,770 535,436
Due from associated and joint venture companies – non-trade [Note 12(ii)] 11,439 12,310 227 314
Total current receivables 28,637 79,972 361,997 535,750
(i) Amounts due from subsidiary companies are unsecured and repayable on demand. Included in the amounts
due from subsidiary companies are fixed-interest loan receivables of $304.3 million (2014: $274.1 million).
(ii) Amounts due from associated and joint venture companies are unsecured and repayable on demand. Included in the amounts due from associated and joint venture companies are fixed-interest loan receivables of $9.0 million (2014: $9.0 million).
The carrying amounts of current trade and other receivables approximated their fair values.
13. INVENTORIES
Group 2015 2014 $’000 $’000
Raw materials 257 359 Work-in-progress 66 74 Finished goods 19,692 27,606
20,015 28,039
The cost of inventories recognised as expense and included in “cost of sales” amounted to $90.0 million (2014: $90.5 million).
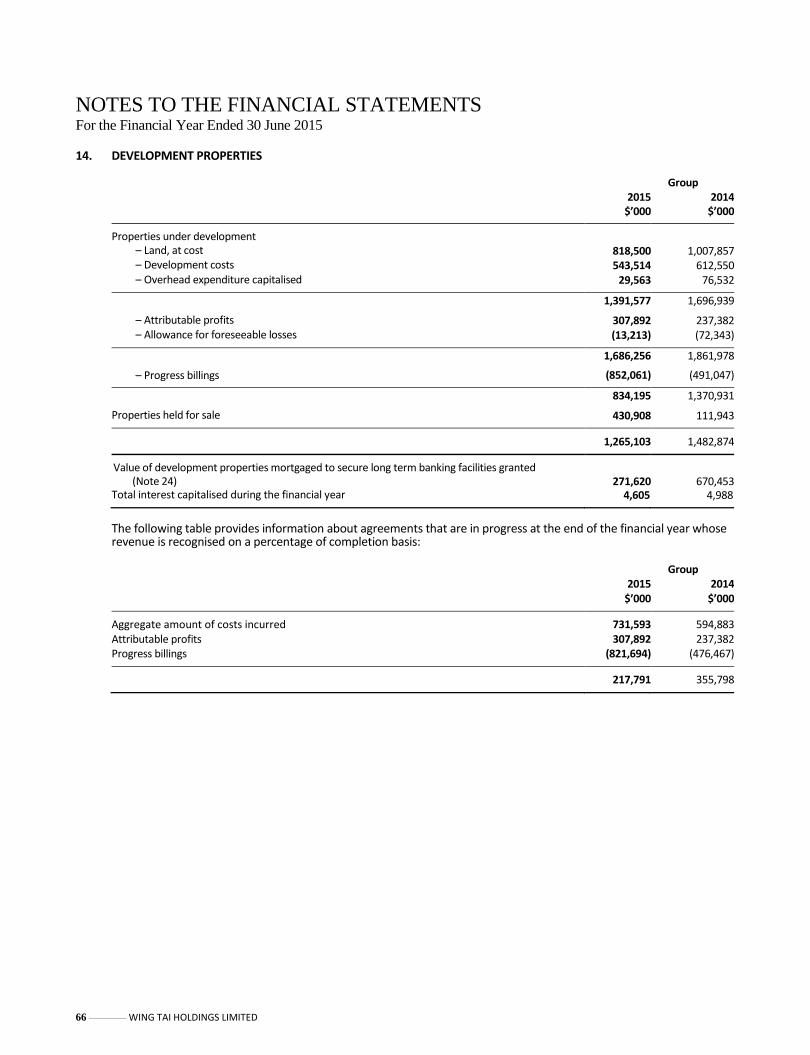
66 ———— WING TAI HOLDINGS LIMITED
NOTES TO THE FINANCIAL STATEMENTS For the Financial Year Ended 30 June 2015 14. DEVELOPMENT PROPERTIES
Group 2015 2014 $’000 $’000
Properties under development – Land, at cost 818,500 1,007,857 – Development costs 543,514 612,550 – Overhead expenditure capitalised 29,563 76,532
1,391,577 1,696,939
– Attributable profits 307,892 237,382 – Allowance for foreseeable losses (13,213) (72,343)
1,686,256 1,861,978 – Progress billings (852,061) (491,047)
834,195 1,370,931
Properties held for sale 430,908 111,943
1,265,103 1,482,874
Value of development properties mortgaged to secure long term banking facilities granted (Note 24) 271,620 670,453
Total interest capitalised during the financial year 4,605 4,988
The following table provides information about agreements that are in progress at the end of the financial year whose revenue is recognised on a percentage of completion basis:
Group 2015 2014 $’000 $’000
Aggregate amount of costs incurred 731,593 594,883 Attributable profits 307,892 237,382 Progress billings (821,694) (476,467)
217,791 355,798

ANNUAL REPORT 2015 | OF EXCELLENCE & ELEGANCE ———— 67
NOTES TO THE FINANCIAL STATEMENTS For the Financial Year Ended 30 June 2015 14. DEVELOPMENT PROPERTIES (continued)
The major development properties are as follows:
% of Gross Group's completion Expected Land floor interest in Type of at completion area area property Location development Tenure 30.06.2015 date (Sq m) (Sq m) (%)
Singapore Le Nouvel Ardmore
at Ardmore Park 43 units of condominium housing
Freehold 100 n/a 5,624 15,746 100
The Tembusu
at Tampines Road 337 units of condominium housing and 1 unit of shop
Freehold 57 2016 13,149 27,614 100
Malaysia Le Nouvel KLCC
at Section 43, Town of Kuala Lumpur
195 units of condominium housing
Freehold 61 2016 6,084 50,033 60.4
Nobleton Crest
at Section 89, Town of Kuala Lumpur
25 units of condominium housing
Freehold 100 n/a 4,047 8,640 60.4
Verticas
Residensi at Section 57, Town of Kuala Lumpur
423 units of condominium housing
Freehold Towers A, B, C, D
100 n/a 9,764 21,542 60.4
Sering Ukay
at Mukim of Ulu Klang, Gombak, Selangor
152 units of semi-detached houses and bungalows
Freehold Phase 3
- - 188,151 52,955 60.4
Taman Bukit
Minyak Utama at Mukim 14, Daerah Seberang Perai Tengah, Pulau Pinang
692 units of terrace and semi- detached houses and shop houses
Freehold Phases 1-3 Phase 4A Phase 4B Phase 5
100 87
100 -
n/a 2016
n/a -
51,642 40,579 60.4
Impiana
Boulevard and Impiana Gallery at Mukim 14, Daerah Seberang Perai Tengah, Pulau Pinang
81 units of shop houses and vacant land
Freehold 100 n/a 8,312 8,919 60.4

68 ———— WING TAI HOLDINGS LIMITED
NOTES TO THE FINANCIAL STATEMENTS For the Financial Year Ended 30 June 2015 14. DEVELOPMENT PROPERTIES (continued)
% of Gross Group's completion Expected Land floor interest in Type of at completion area area property Location development Tenure 30.06.2015 date (Sq m) (Sq m) (%)
Malaysia (continued) Jesselton Hills
at Mukim 15, Daerah Seberang Perai Tengah, Pulau Pinang
950 units of terrace and semi-detached houses and vacant land
Freehold Phase 1 Phase 2 Phase 3-5 Vacant land
100 98
- -
n/a 2015
- -
381,276 44,900 60.4
Mahkota Impian
at Mukim 15, Daerah Seberang Perai Tengah, Pulau Pinang
386 units of shophouses and service apartments
Freehold 15 2017 29,793 69,072 60.4
Vacant land
at Pekan Penaga, District of Petaling, Selangor
- 99-year lease expiring 2093
- - 38,155 n/a 60.4
Vacant land
at Section 89A, Town of Kuala Lumpur
- Freehold - - 8,645 n/a 60.4
Vacant land
at Mukim 14-16, Daerah Seberang Perai Tengah, Pulau Pinang
- Freehold - - 476,390 n/a 60.4
The People’s Republic of China The Lakeview
at No. 63 Xinggang Street, Suzhou Industrial Park
193 units of apartments and shops
70-year lease expiring 2066
Phase 3 100 n/a 9,740 41,337 75
The Lakeside
at No. 1 Xingzhou Street, Suzhou Industrial Park
- 70-year lease expiring 2066
Phase 2 - - 19,518 n/a 75
Vacant land
at 17/2 Huai Hai Middle Road, Precinct No. 45, Huangpu District, Shanghai
- 40 and 50-year leases expiring 2054 and 2064 respectively
- - 8,594 n/a 100
n/a: not applicable
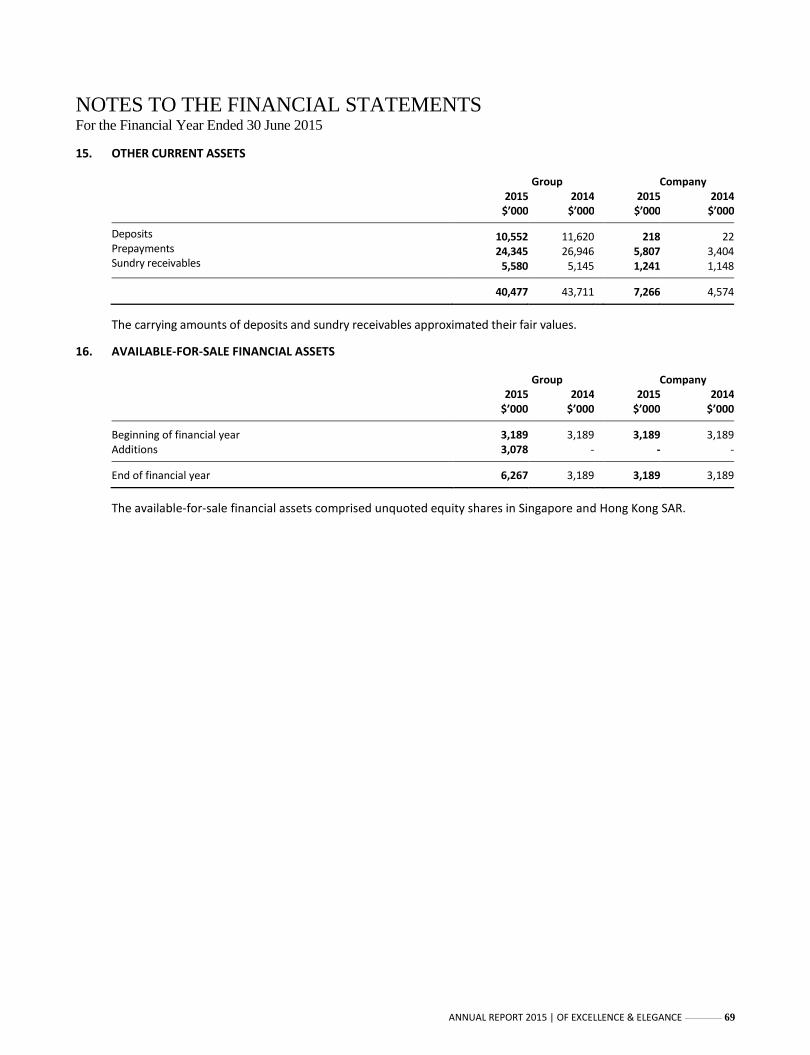
ANNUAL REPORT 2015 | OF EXCELLENCE & ELEGANCE ———— 69
NOTES TO THE FINANCIAL STATEMENTS For the Financial Year Ended 30 June 2015 15. OTHER CURRENT ASSETS
Group Company 2015 2014 2015 2014 $’000 $’000 $’000 $’000
Deposits 10,552 11,620 218 22 Prepayments 24,345 26,946 5,807 3,404 Sundry receivables 5,580 5,145 1,241 1,148
40,477 43,711 7,266 4,574
The carrying amounts of deposits and sundry receivables approximated their fair values.
16. AVAILABLE-FOR-SALE FINANCIAL ASSETS
Group Company 2015 2014 2015 2014 $’000 $’000 $’000 $’000
Beginning of financial year 3,189 3,189 3,189 3,189 Additions 3,078 - - -
End of financial year 6,267 3,189 3,189 3,189
The available-for-sale financial assets comprised unquoted equity shares in Singapore and Hong Kong SAR.

70 ———— WING TAI HOLDINGS LIMITED
NOTES TO THE FINANCIAL STATEMENTS For the Financial Year Ended 30 June 2015 17. TRADE AND OTHER RECEIVABLES – NON-CURRENT
Group Company 2015 2014 2015 2014 $’000 $’000 $’000 $’000
Loans to subsidiary companies [Note 17(i)] - - 1,060,578 934,635 Allowance for impairment of receivables - - - (13,905)
- - 1,060,578 920,730
Loans to joint venture companies [Note 17(ii)] 383,103 369,347 - - Allowance for impairment of receivables (199) (186) - -
382,904 369,161 - -
Loans to non-controlling interests [Note 17(iii)] 17,207 12,907 - -
Total non-current receivables 400,111 382,068 1,060,578 920,730
(i) Loans to subsidiary companies are unsecured, have no fixed terms of repayment and are not expected to
be repayable within the next 12 months. Included in the loans to subsidiary companies are fixed-interest loan receivables of $364.3 million (2014: $350.0 million) and floating-interest loan receivables of Nil (2014: $11.9 million).
The interest-free loans to subsidiary companies are intended to be a long-term source of additional capital for the subsidiary companies. As a result, management considers such loans to be in substance part of the Company’s net investment in these subsidiary companies and has accounted for these loans in accordance with Note 2.5.
(ii) Loans to joint venture companies are unsecured, have no fixed terms of repayment and are not expected to be repayable within the next 12 months. Included in the loans to joint venture companies are fixed-interest loan receivables of $317.0 million (2014: $311.6 million), which are subordinated to banking facilities of $967.8 million (2014: $967.8 million) granted by banks to the said joint venture companies.
(iii) Loans by a certain subsidiary company to non-controlling interests are made proportionate to the shareholders’ equity stake in the subsidiary company on a pari passu basis. The loans are unsecured, interest-free, have no fixed terms of repayment and are not expected to be repayable within the next 12 months.
The carrying amounts of non-current trade and other receivables approximated their fair values and are categorised under Level 3 of the fair value measurement hierarchy (Note 32).
18. INVESTMENT IN AN ASSOCIATED COMPANY Group
2015 2014 $’000 $’000
Carrying amount of quoted investment in an associated company 1,353,952 1,162,428
Details of the Group's associated company are listed in Note 35 to the financial statements.

ANNUAL REPORT 2015 | OF EXCELLENCE & ELEGANCE ———— 71
NOTES TO THE FINANCIAL STATEMENTS For the Financial Year Ended 30 June 2015 18. INVESTMENT IN AN ASSOCIATED COMPANY (continued)
The summarised financial information of an associated company, not adjusted for the proportionate ownership interest held by the Group, is as follows:
Wing Tai Properties
Limited 2015 2014 $’000 $’000
Summarised statement of financial position Current assets 670,677 697,719
Non-current assets 4,095,476 3,540,464 Current liabilities (107,577) (344,537)
Non-current liabilities (737,297) (530,887)
Net assets 3,921,279 3,362,759
Net assets attributable to: – Non-controlling interests 191 226 – Associated company’s equity holders 3,921,088 3,362,533
Summarised statement of comprehensive income Revenue 310,817 337,135 Total profit 332,010 432,971
Other comprehensive (expense)/income (4,811) 4,585
Total comprehensive income 327,199 437,556
Total comprehensive income attributable to: – Non-controlling interests (51) (17) – Associated company’s equity holders 327,250 437,573 Dividends received from an associated company 10,508 10,158
Reconciliation of summarised financial information Net assets Beginning of financial year 3,362,533 3,012,683 Dividends paid (30,427) (29,366) Profit for the year 332,010 432,955 Other comprehensive (expense)/income (4,760) 4,618
Currency translation differences 261,732 (58,357)
End of financial year 3,921,088 3,362,533
Carrying value of Group’s interest in an associated company 1,353,952 1,162,428
Group
2015 2014 $’000 $’000
Share of an associated company’s contingent liabilities and financial guarantees incurred jointly
with other investors 171,099 159,756 Market value of quoted equity shares 404,987 354,347
As at 30 June 2015, the carrying value of quoted equity shares is higher than the market value. The directors consider the carrying value of the investment in an associated company appropriate, after having evaluated various qualitative and quantitative factors including the historical financial performance of the associated company.
The fair value of the investment in an associated company is determined by reference to the published market bid price at the end of the reporting period and is categorised under Level 1 of the fair value measurement hierarchy (Note 32).

72 ———— WING TAI HOLDINGS LIMITED
NOTES TO THE FINANCIAL STATEMENTS For the Financial Year Ended 30 June 2015 19. INVESTMENTS IN JOINT VENTURE COMPANIES
Details of the Group’s joint venture companies are listed in Note 35 to the financial statements. The summarised financial information of the joint venture companies, not adjusted for the proportionate ownership interest held by the Group, is as follows:
Optima Uniqlo Uniqlo Investment & G2000 (Singapore) (Malaysia) Development Apparel (S) Pte. Ltd. Sdn. Bhd. Pte. Ltd. Pte. Ltd. Total $’000 $’000 $’000 $’000 $’000
2015
Summarised statement of financial position Current assets 99,308 41,859 215,101 22,270 378,538 Non-current assets 18,332 25,677 53,591 1,612 99,212 Current liabilities (44,866) (30,898) (32,862) (5,505) (114,131)
Non-current liabilities - (543) (19,485) (121) (20,149)
Net assets 72,774 36,095 216,345 18,256 343,470
Included in net assets are: – Cash and cash equivalents 56,961 5,996 15,479 13,671 92,107
– Financial liabilities (excluding trade and other
payables and provisions)
– Current - (2,857) (92) (198) (3,147)
– Non-current - - (19,485) - (19,485)
Summarised statement of comprehensive income Revenue 205,620 146,785 - 49,331 401,736
Expenses (191,525) (134,304) (2,552) (47,087) (375,468)
Profit/(loss) before income tax 14,095 12,481 (2,552) 2,244 26,268
Income tax (expense)/credit (2,525) (3,996) - 250 (6,271)
Total profit/(loss) 11,570 8,485 (2,552) 2,494 19,997
Other comprehensive income - - 8,837 - 8,837
Total comprehensive income 11,570 8,485 6,285 2,494 28,834
Included in total comprehensive income are: – Interest income 191 155 337 19 702 – Depreciation (6,123) (7,240) (69) (1,535) (14,967) – Interest expense - (247) - - (247)
Dividends received from joint venture companies - - - 2,250 2,250
Reconciliation of summarised financial information
Net assets
Beginning of financial year 61,204 30,606 165,310 20,762 277,882 Additions - - 44,750 - 44,750 Dividends paid - - - (5,000) (5,000) Profit/(loss) for the year 11,570 8,485 (2,552) 2,494 19,997 Other comprehensive income - - 8,837 - 8,837
Currency translation differences - (2,996) - - (2,996)
End of financial year 72,774 36,095 216,345 18,256 343,470
Carrying value 35,659 16,243 86,538 8,215 146,655 Add: Carrying value of individually immaterial joint venture companies 29,644
Carrying value of Group’s interests in
joint venture companies
176,299

ANNUAL REPORT 2015 | OF EXCELLENCE & ELEGANCE ———— 73
NOTES TO THE FINANCIAL STATEMENTS For the Financial Year Ended 30 June 2015 19. INVESTMENTS IN JOINT VENTURE COMPANIES (continued)
Optima Uniqlo Uniqlo Investment & G2000 (Singapore) (Malaysia) Development Apparel (S) Pte. Ltd. Sdn. Bhd. Pte. Ltd. Pte. Ltd. Total
$’000 $’000 $’000 $’000 $’000
2014 Summarised statement of financial position Current assets 79,957 30,035 162,182 25,049 297,223 Non-current assets 17,876 25,626 35,738 3,204 82,444 Current liabilities (35,911) (24,757) (21,572) (7,370) (89,610)
Non-current liabilities (718) (298) (11,038) (121) (12,175)
Net assets 61,204 30,606 165,310 20,762 277,882
Included in net assets are: – Cash and cash equivalents 41,144 5,009 20,762 14,414 81,329
– Financial liabilities (excluding trade and other
payables and provisions)
– Current (476) (3,881) (40) (83) (4,480)
– Non-current - - (11,038) - (11,038)
Summarised statement of comprehensive income Revenue 177,755 111,079 - 55,136 343,970
Expenses (162,020) (97,338) (2,117) (58,155) (319,630)
Profit/(loss) before income tax 15,735 13,741 (2,117) (3,019) 24,340
Income tax expense (2,527) (4,091) - - (6,618)
Total profit/(loss) 13,208 9,650 (2,117) (3,019) 17,722
Other comprehensive expense - - (2,582) - (2,582)
Total comprehensive income/(expense) 13,208 9,650 (4,699) (3,019) 15,140
Included in total comprehensive income/(expense) are: – Interest income 75 66 211 18 370 – Depreciation (5,236) (4,625) (57) (1,734) (11,652)
– Interest expense - (14) - - (14)
Reconciliation of summarised financial information
Net assets Beginning of financial year 47,996 21,531 108,085 23,781 201,393 Additions - - 61,924 - 61,924 Profit/(loss) for the year 13,208 9,650 (2,117) (3,019) 17,722 Other comprehensive expense - - (2,582) - (2,582)
Currency translation differences - (575) - - (575)
End of financial year 61,204 30,606 165,310 20,762 277,882
Carrying value 29,990 13,773 66,124 9,343 119,230 Add: Carrying value of individually immaterial joint venture companies 31,855
Carrying value of Group’s interests in
joint venture companies
151,085

74 ———— WING TAI HOLDINGS LIMITED
NOTES TO THE FINANCIAL STATEMENTS For the Financial Year Ended 30 June 2015
19. INVESTMENTS IN JOINT VENTURE COMPANIES (continued)
Group
2015 2014 $’000 $’000
Capital commitments in relation to interest in a joint venture company 16,603 19,209 Share of joint venture companies’ capital commitments 70,440 78,444
20. INVESTMENTS IN SUBSIDIARY COMPANIES
Company 2015 2014 $’000 $’000
Beginning and end of financial year 252,392 252,392
Details of the Group’s subsidiary companies are listed in Note 35 to the financial statements. The following subsidiary companies of the Group have material non-controlling interests:
Effective interest held by non-controlling
interests 2015 2014 Name of company % %
Wing Tai Malaysia Berhad 39.6 39.2 Suzhou Property Development Pte Ltd 25 25
There were no significant transactions with non-controlling interests for the financial years ended 30 June 2015 and 2014.

ANNUAL REPORT 2015 | OF EXCELLENCE & ELEGANCE ———— 75
NOTES TO THE FINANCIAL STATEMENTS For the Financial Year Ended 30 June 2015 20. INVESTMENTS IN SUBSIDIARY COMPANIES (continued)
The following table summarises the financial information of each of the Group’s subsidiary companies with
material non-controlling interests, based on their respective consolidated financial statements prepared in accordance with FRS, modified for fair value adjustments on acquisition and differences in the Group’s accounting policies. The information is before inter-company eliminations with other companies in the Group.
Suzhou Property Wing Tai Development Malaysia Berhad Pte. Ltd. Total $’000 $’000 $’000
2015 Summarised statement of financial position Current assets 465,565 124,693 590,258 Non-current assets 113,983 22,094 136,077 Current liabilities (77,112) (13,606) (90,718)
Non-current liabilities (129,596) (54,994) (184,590)
Net assets 372,840 78,187 451,027
Net assets attributable to non-controlling interests 147,496 19,547 167,043
Add: Carrying value of individually immaterial non-controlling interests of
other subsidiary companies
21,989
Carrying value of non-controlling interests 189,032
Summarised statement of comprehensive income Revenue 103,624 49,630 153,254 Total profit 20,356 13,471 33,827
Other comprehensive (expense)/income (623) 5,376 4,753
Total comprehensive income 19,733 18,847 38,580
Total comprehensive income attributable to non-controlling interests 7,806 4,712 12,518
Dividends paid to non-controlling interests 3,345 - 3,345
Summarised cash flows Cash flows from: – Operating activities (26,389) 30,226 3,837 – Investing activities 6,960 1,561 8,521
– Financing activities (11,127) - (11,127)
Net (decrease)/increase in cash and cash equivalents (30,556) 31,787 1,231
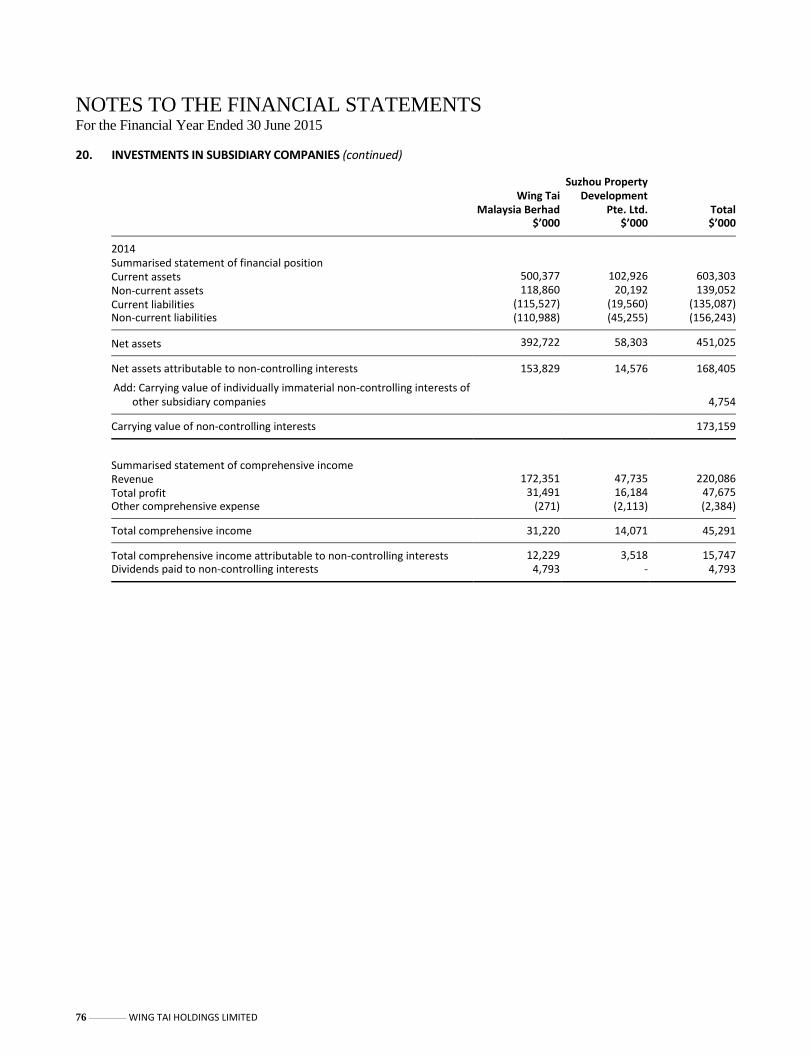
76 ———— WING TAI HOLDINGS LIMITED
NOTES TO THE FINANCIAL STATEMENTS For the Financial Year Ended 30 June 2015 20. INVESTMENTS IN SUBSIDIARY COMPANIES (continued) Suzhou Property Wing Tai Development Malaysia Berhad Pte. Ltd. Total $’000 $’000 $’000
2014 Summarised statement of financial position Current assets 500,377 102,926 603,303 Non-current assets 118,860 20,192 139,052 Current liabilities (115,527) (19,560) (135,087)
Non-current liabilities (110,988) (45,255) (156,243)
Net assets 392,722 58,303 451,025
Net assets attributable to non-controlling interests 153,829 14,576 168,405
Add: Carrying value of individually immaterial non-controlling interests of
other subsidiary companies
4,754
Carrying value of non-controlling interests 173,159
Summarised statement of comprehensive income Revenue 172,351 47,735 220,086 Total profit 31,491 16,184 47,675
Other comprehensive expense (271) (2,113) (2,384)
Total comprehensive income 31,220 14,071 45,291
Total comprehensive income attributable to non-controlling interests 12,229 3,518 15,747
Dividends paid to non-controlling interests 4,793 - 4,793

ANNUAL REPORT 2015 | OF EXCELLENCE & ELEGANCE ———— 77
NOTES TO THE FINANCIAL STATEMENTS For the Financial Year Ended 30 June 2015 21. INVESTMENT PROPERTIES
Group 2015 2014 $’000 $’000
Beginning of financial year 575,263 562,153 Fair value gains recognised in income statement 12,522 11,054 Transfer from property, plant and equipment - 4,032 Additions 649 - Currency translation differences (2,907) (1,976)
End of financial year 585,527 575,263
The following amounts are recognised in the income statement:
Group 2015 2014
$’000 $’000
Rental income 30,928 30,032 Direct operating expenses arising from investment properties
that generated rental income (10,542) (10,437)
The major investment properties are as follows:
Group’s Lettable interest in Name of building/
location Description
Tenure of land
area (Sq m)
property (%)
Singapore Winsland House I
at 3 Killiney Road 10-storey commercial building
99-year lease expiring 2082
13,405 100
(1st
to 9th
floor) Winsland House II
at 163 Penang Road 8-storey commercial building
99-year lease expiring 2093
7,311 100
Winsland House II
at 165 Penang Road Conservation house
99-year lease expiring 2093
584 100
Lanson Place
Winsland Serviced Residences at 167 Penang Road
67 units of serviced apartments in a 9-storey building
99-year lease expiring 2093
6,030 100
Malaysia Kondominium No. 8
at Section 89A, Town of Kuala Lumpur
132 units of condominium housing
Freehold 22,702 60.4
Sering Ukay
at Jalan SU1E, Ampang, Selangor
10 units of shop offices
Freehold 2,872 60.4
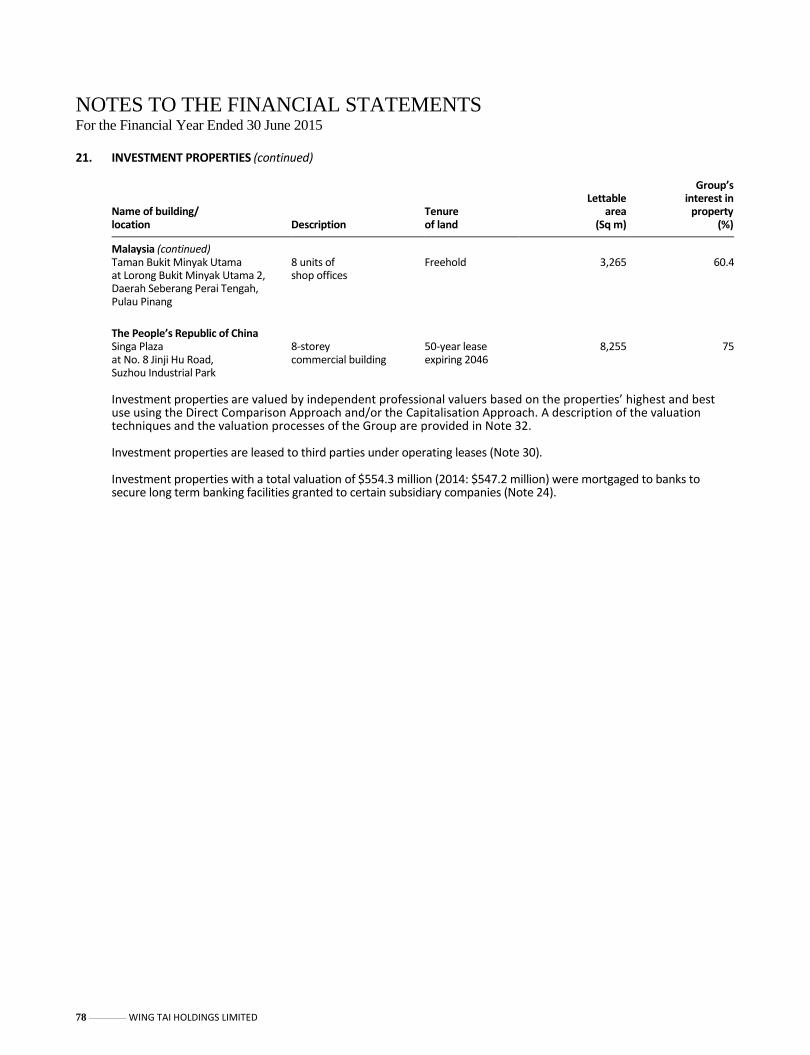
78 ———— WING TAI HOLDINGS LIMITED
NOTES TO THE FINANCIAL STATEMENTS For the Financial Year Ended 30 June 2015 21. INVESTMENT PROPERTIES (continued)
Group’s Lettable interest in Name of building/
location Description Tenure of land
area (Sq m)
property (%)
Malaysia (continued) Taman Bukit Minyak Utama
at Lorong Bukit Minyak Utama 2, Daerah Seberang Perai Tengah, Pulau Pinang
8 units of shop offices
Freehold 3,265 60.4
The People’s Republic of China Singa Plaza
at No. 8 Jinji Hu Road, Suzhou Industrial Park
8-storey commercial building
50-year lease expiring 2046
8,255 75
Investment properties are valued by independent professional valuers based on the properties’ highest and best use using the Direct Comparison Approach and/or the Capitalisation Approach. A description of the valuation techniques and the valuation processes of the Group are provided in Note 32. Investment properties are leased to third parties under operating leases (Note 30).
Investment properties with a total valuation of $554.3 million (2014: $547.2 million) were mortgaged to banks to secure long term banking facilities granted to certain subsidiary companies (Note 24).

ANNUAL REPORT 2015 | OF EXCELLENCE & ELEGANCE ———— 79
NOTES TO THE FINANCIAL STATEMENTS For the Financial Year Ended 30 June 2015 22. PROPERTY, PLANT AND EQUIPMENT
Freehold land and buildings
Leasehold land and buildings
Motor
vehicles
Office
equipment Furniture
and fittings
Total $’000 $’000 $’000 $’000 $’000 $’000
Group 2015 Cost or valuation Beginning of financial year Cost - - 6,314 24,941 64,573 95,828 Valuation 36,616 56,632 - - - 93,248
36,616 56,632 6,314 24,941 64,573 189,076 Additions - 27 568 2,525 3,860 6,980 Disposals - - (347) (147) (28) (522) Write-off - - - (276) (2,132) (2,408) Revaluation gains - 2,143 - - - 2,143 Currency translation differences (2,924) (625) (220) (834) (1,925) (6,528)
End of financial year 33,692 58,177 6,315 26,209 64,348 188,741
Representing: Cost - - 6,315 26,209 64,348 96,872 Valuation 33,692 58,177 - - - 91,869
33,692 58,177 6,315 26,209 64,348 188,741
Accumulated depreciation and impairment losses Beginning of financial year 898 724 4,662 12,960 38,341 57,585 Depreciation charge 324 1,163 763 2,325 9,815 14,390 Disposals - - (278) (135) (25) (438)
Write-off - - - (247) (1,899) (2,146) Impairment loss - - - 277 3,305 3,582 Revaluation adjustments - (966) - - - (966) Currency translation differences (92) (70) (165) (728) (1,521) (2,576)
End of financial year 1,130 851 4,982 14,452 48,016 69,431
Net book value End of financial year 32,562 57,326 1,333 11,757 16,332 119,310
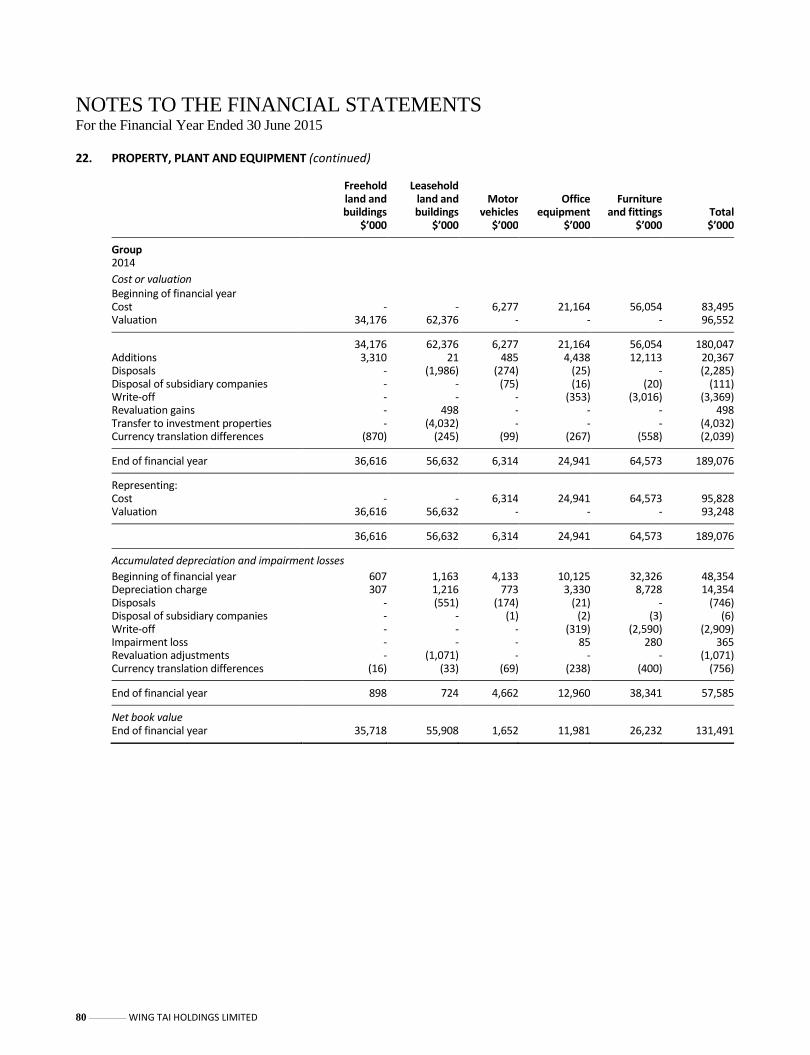
80 ———— WING TAI HOLDINGS LIMITED
NOTES TO THE FINANCIAL STATEMENTS For the Financial Year Ended 30 June 2015 22. PROPERTY, PLANT AND EQUIPMENT (continued)
Freehold land and buildings
Leasehold land and buildings
Motor
vehicles
Office
equipment Furniture
and fittings
Total $’000 $’000 $’000 $’000 $’000 $’000
Group 2014
Cost or valuation Beginning of financial year Cost - - 6,277 21,164 56,054 83,495 Valuation 34,176 62,376 - - - 96,552
34,176 62,376 6,277 21,164 56,054 180,047 Additions 3,310 21 485 4,438 12,113 20,367 Disposals - (1,986) (274) (25) - (2,285) Disposal of subsidiary companies - - (75) (16) (20) (111) Write-off - - - (353) (3,016) (3,369) Revaluation gains - 498 - - - 498 Transfer to investment properties - (4,032) - - - (4,032) Currency translation differences (870) (245) (99) (267) (558) (2,039)
End of financial year 36,616 56,632 6,314 24,941 64,573 189,076
Representing: Cost - - 6,314 24,941 64,573 95,828 Valuation 36,616 56,632 - - - 93,248
36,616 56,632 6,314 24,941 64,573 189,076
Accumulated depreciation and impairment losses
Beginning of financial year 607 1,163 4,133 10,125 32,326 48,354 Depreciation charge 307 1,216 773 3,330 8,728 14,354 Disposals - (551) (174) (21) - (746)
Disposal of subsidiary companies - - (1) (2) (3) (6) Write-off - - - (319) (2,590) (2,909) Impairment loss - - - 85 280 365 Revaluation adjustments - (1,071) - - - (1,071) Currency translation differences (16) (33) (69) (238) (400) (756)
End of financial year 898 724 4,662 12,960 38,341 57,585
Net book value End of financial year 35,718 55,908 1,652 11,981 26,232 131,491

ANNUAL REPORT 2015 | OF EXCELLENCE & ELEGANCE ———— 81
NOTES TO THE FINANCIAL STATEMENTS For the Financial Year Ended 30 June 2015 22. PROPERTY, PLANT AND EQUIPMENT (continued)
Motor
vehicles
Office
equipment Furniture
and fittings
Total $’000 $’000 $’000 $’000
Company 2015 Cost Beginning of financial year 1,841 8,622 2,491 12,954 Additions - 1,691 12 1,703 Disposals (97) (104) (4) (205) Write-off - - (11) (11)
End of financial year 1,744 10,209 2,488 14,441
Accumulated depreciation Beginning of financial year 1,615 1,083 1,469 4,167 Depreciation charge 151 433 319 903 Disposals (97) (97) (1) (195) Write-off - - (10) (10)
End of financial year 1,669 1,419 1,777 4,865
Net book value End of financial year 75 8,790 711 9,576
2014 Cost Beginning of financial year 2,014 7,289 2,348 11,651 Additions - 1,333 153 1,486 Disposals (173) - - (173) Write-off - - (10) (10)
End of financial year 1,841 8,622 2,491 12,954
Accumulated depreciation Beginning of financial year 1,622 848 1,161 3,631 Depreciation charge 166 235 314 715 Disposals (173) - - (173) Write-off - - (6) (6)
End of financial year 1,615 1,083 1,469 4,167
Net book value End of financial year 226 7,539 1,022 8,787

82 ———— WING TAI HOLDINGS LIMITED
NOTES TO THE FINANCIAL STATEMENTS For the Financial Year Ended 30 June 2015 22. PROPERTY, PLANT AND EQUIPMENT (continued)
The freehold and leasehold land and buildings are valued by independent professional valuers based on the properties’ highest and best use using the Direct Comparison Approach and/or the Capitalisation Approach. A description of the valuation techniques and the valuation processes of the Group are provided in Note 32.
If the freehold and leasehold land and buildings stated at valuation were included in the financial statements at cost
less accumulated depreciation, their net book values would be as follows: Group
2015 2014
$’000 $’000
Freehold land and buildings 28,385 31,262
Leasehold land and buildings 39,025 40,251
The major properties included in freehold and leasehold land and buildings are as follows:
Lettable
Name of building/ area location Description Tenure of land (Sq m)
Singapore Winsland House I at 3 Killiney Road (Basement 1 and 10
th floor)
10-storey commercial building
99-year lease expiring 2082
2,668
Malaysia 166-A, Rifle Range Road, Pulau Pinang
5-storey commercial building
99-year lease expiring 2109
11,136
Ambassador Row Serviced Suites at 1 Jalan Ampang Hilir, Kuala Lumpur
221 units of serviced apartments in a 20-storey building
Freehold 17,452
Property, plant and equipment with net book values amounting to $83.0 million (2014: $84.3 million) were mortgaged to banks to secure long term banking facilities granted to subsidiary companies (Note 24).

ANNUAL REPORT 2015 | OF EXCELLENCE & ELEGANCE ———— 83
NOTES TO THE FINANCIAL STATEMENTS For the Financial Year Ended 30 June 2015 23. TRADE AND OTHER PAYABLES
Group Company 2015 2014 2015 2014 $’000 $’000 $’000 $’000
Due to subsidiary companies – non-trade [Note 23(i)] - - 83,333 133,860
Due to associated and joint venture companies – non-trade [Note 23(ii)] 15,709 14,774 - -
Due to non-controlling interests – non-trade [Note 23(iii)] 23,262 23,262 - -
Accrued project costs 75,263 113,285 - - Accrued operating expenses 26,663 45,762 9,029 12,075 Trade creditors 20,232 27,498 - - Other creditors 13,099 32,510 1,747 1,656 Tenancy deposits 2,650 3,278 - -
137,907 222,333 10,776 13,731
Total trade and other payables 176,878 260,369 94,109 147,591
(i) Non-trade amounts due to subsidiary companies are unsecured and repayable on demand. Included in the
amounts due to subsidiary companies are fixed-interest payables of Nil (2014: $17.7 million) and floating-interest payables of $40.7 million (2014: $23.0 million).
(ii) Non-trade amounts due to associated and joint venture companies are unsecured, interest-free and
repayable on demand.
(iii) Non-trade amounts due to non-controlling interests are unsecured, interest-free and repayable on demand.
The carrying amounts of trade and other payables approximated their fair values.

84 ———— WING TAI HOLDINGS LIMITED
NOTES TO THE FINANCIAL STATEMENTS For the Financial Year Ended 30 June 2015 24. BORROWINGS
Group Company 2015 2014 2015 2014 $’000 $’000 $’000 $’000
Current – Secured term loans 30,628 55,886 - - – Unsecured term loans 5,356 10,479 - - – Unsecured medium term notes due in 2015 - 120,000 - 120,000
35,984 186,365 - 120,000
Non-current – Secured bank loans 315,951 372,449 - - – Unsecured bank loans 359,424 318,409 257,796 125,000 – Unsecured medium term notes due in 2016 - 65,000 - 65,000 – Unsecured medium term notes due in 2018 60,000 60,000 60,000 60,000 – Unsecured medium term notes due in 2021 120,000 - 120,000 - – Unsecured medium term notes due in 2022 100,000 100,000 100,000 100,000 – Unsecured medium term notes due in 2023 100,000 100,000 100,000 100,000 – Unsecured medium term notes due in 2024 100,000 100,000 100,000 100,000
1,155,375 1,115,858 737,796 550,000
Total borrowings 1,191,359 1,302,223 737,796 670,000
The carrying amounts of borrowings approximated their fair values and are categorised under Level 3 of the fair value measurement hierarchy (Note 32).
(a) Interest rate risks
The exposure of the borrowings of the Group and of the Company to interest rate changes and the contractual repricing dates at the end of the reporting period are as follows:
Group Company 2015 2014 2015 2014 $’000 $’000 $’000 $’000
Less than one year 558,386 877,223 125,000 245,000 Between two and five years 212,973 125,000 192,796 125,000 Over five years 420,000 300,000 420,000 300,000
1,191,359 1,302,223 737,796 670,000
(b) Security granted
The Group’s secured borrowings are generally secured by mortgages on certain development properties (Note 14), investment properties (Note 21) and property, plant and equipment (Note 22) and assignment of all rights, titles and benefits with respect to the properties.

ANNUAL REPORT 2015 | OF EXCELLENCE & ELEGANCE ———— 85
NOTES TO THE FINANCIAL STATEMENTS For the Financial Year Ended 30 June 2015 25. DIVIDENDS
Group and Company
2015 2014 $’000 $’000
Dividends paid in respect of the preceding financial year First and final dividend of 3 cents per share (2014: 3 cents per share) 23,634 23,582 Special dividend of 3 cents per share (2014: 9 cents per share) 23,633 70,746
47,267 94,328
The directors have recommended a first and final dividend in respect of the financial year ended 30 June 2015 of 3 cents per share. These financial statements do not reflect these proposed dividends, which will be accounted for in the shareholders’ equity as an appropriation of retained earnings in the financial year ending 30 June 2016.
The proposed first and final dividend and special dividend in respect of the financial year ended 30 June 2014 have been accounted for in the shareholders’ equity as an appropriation of retained earnings in the current financial year.
26. OTHER NON-CURRENT LIABILITIES
Group
2015 2014 $’000 $’000
Tenancy deposits 5,572 4,376 Loans from non-controlling interests 7,894 8,912 Retention payable 25,345 23,202 Others 3,079 3,054
41,890 39,544
Loans from non-controlling interests are unsecured, interest-free, have no fixed terms of repayment and are not expected to be repayable within the next 12 months.
The carrying amounts of other non-current liabilities approximated their fair values and are categorised under Level 3 of the fair value measurement hierarchy (Note 32).
27. SHARE CAPITAL
Group and Company Issued share capital
Number of ordinary shares
Amount
’000 $’000
2015 Beginning and end of financial year 793,927 838,250
2014 Beginning and end of financial year 793,927 838,250
All issued ordinary shares are fully paid. There is no par value for these ordinary shares.

86 ———— WING TAI HOLDINGS LIMITED
NOTES TO THE FINANCIAL STATEMENTS For the Financial Year Ended 30 June 2015 27. SHARE CAPITAL (continued)
(a) The Wing Tai Holdings Limited (2001) Share Option Scheme (the “Scheme”) The Scheme was approved and adopted by the members of the Company at an Extraordinary General Meeting (“EGM”) held on 31 August 2001. The Scheme was terminated by the members of the Company at an EGM held on 30 October 2008 (without prejudice to the rights of holders of options thereunder in respect of options which have been granted).
Details of the movement in the options granted under the Scheme on the unissued ordinary shares of the Company during the year were as follows:
Date of grant Beginning of
financial year
Number of options exercised
Number of options
forfeited End of
financial year Exercise price ($) Expiry date
2015 19.11.2004 103,400 103,400 - - 0.849 18.11.2014 30.09.2005 315,800 48,400 37,400 230,000 1.300 29.09.2015 05.09.2006 825,400 46,200 77,000 702,200 1.645 04.09.2016 06.09.2007 1,688,500 - 159,500 1,529,000 3.136 05.09.2017
Total 2,933,100 198,000 273,900 2,461,200
2014 19.11.2004 234,300 130,900 - 103,400 0.849 18.11.2014 30.09.2005 524,800 198,000 11,000 315,800 1.300 29.09.2015 05.09.2006 911,200 52,800 33,000 825,400 1.645 04.09.2016 06.09.2007 1,826,000 - 137,500 1,688,500 3.136 05.09.2017
Total 3,496,300 381,700 181,500 2,933,100
All the outstanding share options are exercisable. The Company reissued 222,200 (2014: 357,500) treasury shares at an average price of $1.19 (2014: $1.17) per share during the financial year for the fulfilment of share options. Of the 222,200 treasury shares reissued, 198,000 treasury shares were reissued for the fulfilment of share options exercised during the financial year. The weighted average share price at the time of exercise was $1.89 (2014: $2.16) per share.

ANNUAL REPORT 2015 | OF EXCELLENCE & ELEGANCE ———— 87
NOTES TO THE FINANCIAL STATEMENTS For the Financial Year Ended 30 June 2015 27. SHARE CAPITAL (continued)
(b) Share Plans
The Wing Tai Performance Share Plan (“Wing Tai PSP”) and the Wing Tai Restricted Share Plan (“Wing Tai RSP”) (collectively referred to as the “Share Plans”) were adopted by the members of the Company at an EGM held on 30 October 2008.
Wing Tai PSP On 26 September 2014, awards were granted by the Company to qualifying employees pursuant to the Wing Tai PSP in respect of 210,000 shares of the Company. Under the Wing Tai PSP, performance conditions are set over a three-year performance period. A specified number of shares will be released by the Committee to the participants at the end of the performance period, provided the threshold targets are achieved. The total number of shares released varies depending on the achievement of pre-set performance targets over the performance period. The achievement factor ranges from 0% to 200%.
Details of the movement in the awards of the Company during the year were as follows:
Date of grant
Beginning of financial
year Number of
shares granted
Additional shares awarded
arising from targets achieved
Number of
shares released
End of financial
year
2015 08.09.2011 183,000 - 11,200 194,200 - 19.09.2012 147,000 - - - 147,000 25.09.2013 115,000 - - - 115,000 26.09.2014 - 210,000 - - 210,000
Total 445,000 210,000 11,200 194,200 472,000
2014 01.09.2010 121,000 - 82,100 203,100 - 08.09.2011 183,000 - - - 183,000 19.09.2012 147,000 - - - 147,000 25.09.2013 - 115,000 - - 115,000
Total 451,000 115,000 82,100 203,100 445,000
Wing Tai RSP On 26 September 2014, awards were granted by the Company to qualifying employees pursuant to the Wing Tai RSP in respect of 1,089,000 shares of the Company. Under the Wing Tai RSP, performance conditions are set over a one-year performance period. A specified number of shares will be awarded to eligible participants at the end of the performance period depending on the extent of achievement of the performance conditions established. The shares have a vesting schedule of three years. The participant will receive fully paid shares, without any cash consideration payable by the participant.

88 ———— WING TAI HOLDINGS LIMITED
NOTES TO THE FINANCIAL STATEMENTS For the Financial Year Ended 30 June 2015 27. SHARE CAPITAL (continued)
(b) Share Plans (continued)
Wing Tai RSP (continued) Details of the movement in the awards of the Company during the year were as follows:
Date of grant
Beginning of financial
year Number of
shares granted Number of
shares released Number of
shares forfeited
End of financial
year
2015 08.09.2011 744,800 - 738,000 6,800 - 19.09.2012 1,139,500 - 523,600 21,500 594,400 25.09.2013 1,336,500 - 420,000 28,900 887,600 26.09.2014 - 1,089,000 - 26,000 1,063,000
Total 3,220,800 1,089,000 1,681,600 83,200 2,545,000
2014 01.09.2010 751,200 - 751,200 - - 08.09.2011 1,329,300 - 569,700 14,800 744,800 19.09.2012 1,809,000 - 542,700 126,800 1,139,500 25.09.2013 - 1,546,000 - 209,500 1,336,500
Total 3,889,500 1,546,000 1,863,600 351,100 3,220,800
The fair values of the awards granted pursuant to the Wing Tai PSP and the Wing Tai RSP on 26 September 2014 (2014: 25 September 2013) determined using the Monte Carlo simulation model was $0.2 million (2014: $0.2 million) and $1.9 million (2014: $3.1 million) respectively. The significant inputs into the model were share price at grant date of $1.77 (2014: $2.09) per share, standard deviation of expected share price returns of 28.4% (2014: 28.0%), dividend yield of 1.5% (2014: 2.4%) and annual risk-free one-year, two-year and three-year interest rates of 0.4%, 0.6% and 0.9% respectively (2014: 0.3% each). The volatility measured at the standard deviation of expected share price returns is based on the statistical analysis of monthly share prices over the past three years.
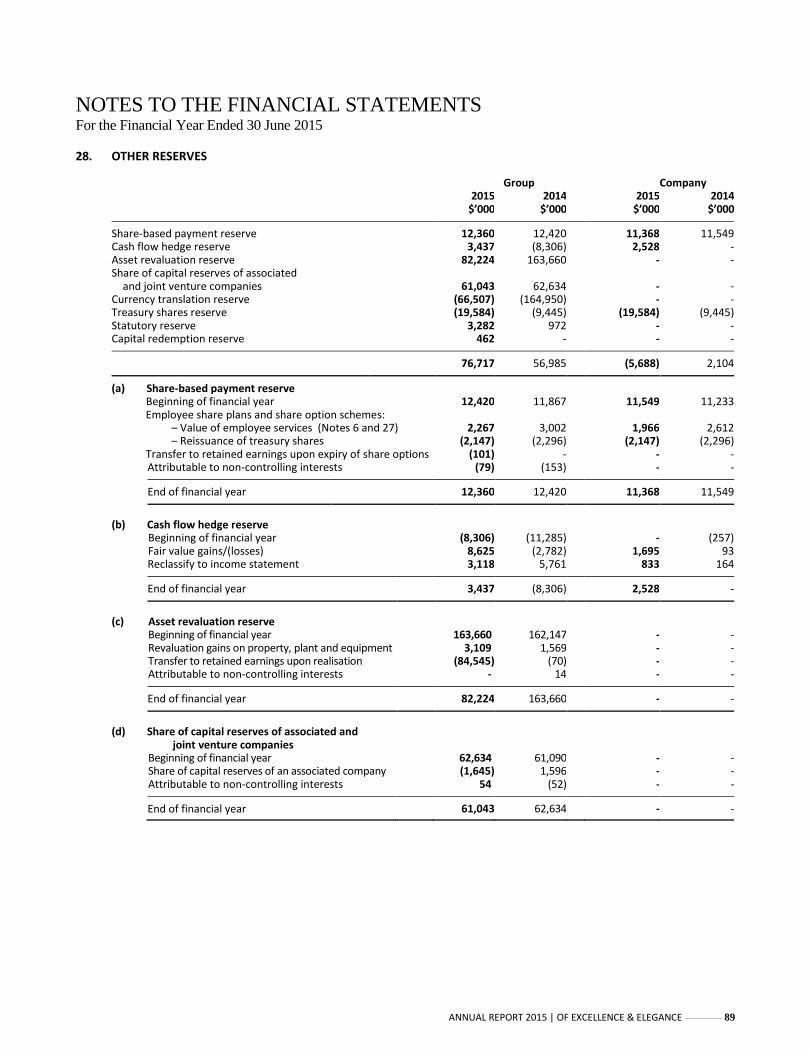
ANNUAL REPORT 2015 | OF EXCELLENCE & ELEGANCE ———— 89
NOTES TO THE FINANCIAL STATEMENTS For the Financial Year Ended 30 June 2015 28. OTHER RESERVES
Group Company 2015 2014 2015 2014 $’000 $’000 $’000 $’000
Share-based payment reserve 12,360 12,420 11,368 11,549 Cash flow hedge reserve 3,437 (8,306) 2,528 - Asset revaluation reserve 82,224 163,660 - -
Share of capital reserves of associated
and joint venture companies 61,043 62,634 - - Currency translation reserve (66,507) (164,950) - - Treasury shares reserve (19,584) (9,445) (19,584) (9,445) Statutory reserve 3,282 972 - - Capital redemption reserve 462 - - -
76,717 56,985 (5,688) 2,104
(a) Share-based payment reserve Beginning of financial year 12,420 11,867 11,549 11,233 Employee share plans and share option schemes: – Value of employee services (Notes 6 and 27) 2,267 3,002 1,966 2,612 – Reissuance of treasury shares (2,147) (2,296) (2,147) (2,296) Transfer to retained earnings upon expiry of share options (101) - - - Attributable to non-controlling interests (79) (153) - -
End of financial year 12,360 12,420 11,368 11,549
(b) Cash flow hedge reserve Beginning of financial year (8,306) (11,285) - (257) Fair value gains/(losses) 8,625 (2,782) 1,695 93 Reclassify to income statement 3,118 5,761 833 164
End of financial year 3,437 (8,306) 2,528 -
(c) Asset revaluation reserve Beginning of financial year 163,660 162,147 - - Revaluation gains on property, plant and equipment 3,109 1,569 - - Transfer to retained earnings upon realisation (84,545) (70) - - Attributable to non-controlling interests - 14 - -
End of financial year 82,224 163,660 - -
(d) Share of capital reserves of associated and
joint venture companies Beginning of financial year 62,634 61,090 - - Share of capital reserves of an associated company (1,645) 1,596 - - Attributable to non-controlling interests 54 (52) - -
End of financial year 61,043 62,634 - -

90 ———— WING TAI HOLDINGS LIMITED
NOTES TO THE FINANCIAL STATEMENTS For the Financial Year Ended 30 June 2015 28. OTHER RESERVES (continued)
Group Company 2015 2014 2015 2014
$’000 $’000 $’000 $’000
(e) Currency translation reserve Beginning of financial year (164,950) (125,406) - -
Translation of financial statements of foreign
subsidiary, associated and joint venture companies 76,358 (40,711) - -
Translation of foreign currency denominated loans which form part of net investment in subsidiary companies 10,176 (2,497) - -
Disposal of subsidiary companies 3,229 (1,288) - - Attributable to non-controlling interests 8,680 4,952 - -
End of financial year (66,507) (164,950) - -
(f) Treasury shares reserve Beginning of financial year (9,445) (11,466) (9,445) (11,466) Purchase of treasury shares (12,550) (693) (12,550) (693) Reissuance of treasury shares 2,411 2,714 2,411 2,714
End of financial year (19,584) (9,445) (19,584) (9,445)
(g) Statutory reserve Beginning of financial year 972 972 - - Transfer to revenue reserves 3,080 - - - Attributable to non-controlling interests (770) - - -
End of financial year 3,282 972 - -
(h) Capital redemption reserve Beginning of financial year - - - - Redemption of preference shares by a subsidiary company 764 - - - Attributable to non-controlling interests (302) - - -
End of financial year 462 - - -
Total 76,717 56,985 (5,688) 2,104
Capital reserves of associated and joint venture companies arise from currency translation and other reserves which are not distributable.
The total number of treasury shares held by the Company as at 30 June 2015 was 13,379,900 (2014: 8,218,500). The Company reissued 2,098,000 (2014: 2,424,200) treasury shares during the financial year pursuant to the Wing Tai PSP, Wing Tai RSP and share options. The purchase cost of the treasury shares reissued amounted to $2.4 million (2014: $2.7 million). The total consideration for the treasury shares reissued which comprised the value of employee services amounted to $2.1 million (2014: $2.3 million).
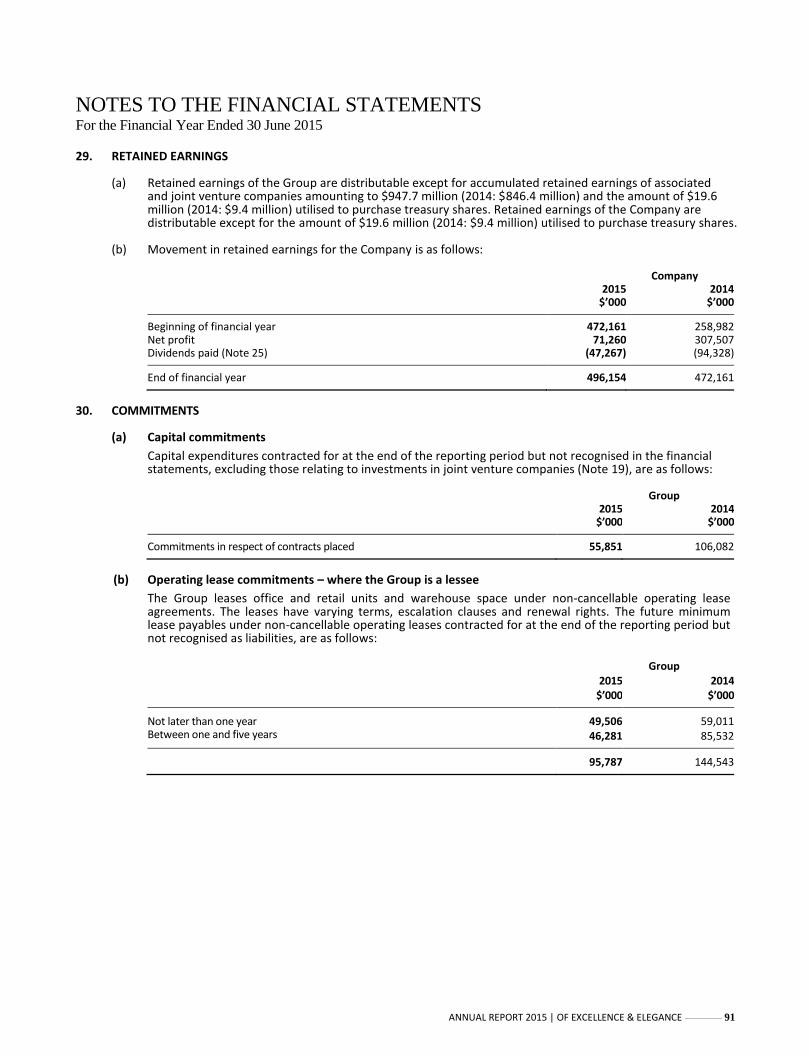
ANNUAL REPORT 2015 | OF EXCELLENCE & ELEGANCE ———— 91
NOTES TO THE FINANCIAL STATEMENTS For the Financial Year Ended 30 June 2015 29. RETAINED EARNINGS
(a) Retained earnings of the Group are distributable except for accumulated retained earnings of associated and joint venture companies amounting to $947.7 million (2014: $846.4 million) and the amount of $19.6 million (2014: $9.4 million) utilised to purchase treasury shares. Retained earnings of the Company are distributable except for the amount of $19.6 million (2014: $9.4 million) utilised to purchase treasury shares.
(b) Movement in retained earnings for the Company is as follows:
Company 2015 2014 $’000 $’000
Beginning of financial year 472,161 258,982 Net profit 71,260 307,507 Dividends paid (Note 25) (47,267) (94,328)
End of financial year 496,154 472,161
30. COMMITMENTS
(a) Capital commitments
Capital expenditures contracted for at the end of the reporting period but not recognised in the financial statements, excluding those relating to investments in joint venture companies (Note 19), are as follows:
Group 2015 2014 $’000 $’000
Commitments in respect of contracts placed 55,851 106,082
(b) Operating lease commitments – where the Group is a lessee
The Group leases office and retail units and warehouse space under non-cancellable operating lease agreements. The leases have varying terms, escalation clauses and renewal rights. The future minimum lease payables under non-cancellable operating leases contracted for at the end of the reporting period but not recognised as liabilities, are as follows:
Group 2015 2014 $’000 $’000
Not later than one year 49,506 59,011 Between one and five years 46,281 85,532
95,787 144,543

92 ———— WING TAI HOLDINGS LIMITED
NOTES TO THE FINANCIAL STATEMENTS For the Financial Year Ended 30 June 2015 30. COMMITMENTS (continued)
(c) Operating lease commitments – where the Group is a lessor
The Group leases out office and retail units and serviced apartments under non-cancellable operating lease agreements. The leases have varying terms, escalation clauses and renewal rights. The future minimum lease receivables under non-cancellable operating leases contracted for at the end of the reporting period but not recognised as receivables, are as follows:
Group 2015 2014 $’000 $’000
Not later than one year 22,398 20,871 Between one and five years 23,889 19,701 Later than five years 88 -
46,375 40,572
31. CONTINGENT LIABILITIES AND FINANCIAL GUARANTEES
The details and estimates of the maximum amounts of contingent liabilities and financial guarantees, excluding those relating to investment in an associated company (Note 18), are as follows:
Group Company
2015 2014 2015 2014 $’000 $’000 $’000 $’000
Financial guarantees issued to banks for credit facilities granted to: – subsidiary companies - - 109,228 201,010 – joint venture companies 19,935 21,028 8,280 8,280
19,935 21,028 O/s 117,508 209,290
The Company has given financial guarantees for all liabilities incurred under a tender bond facility of a subsidiary company amounting to $15.0 million (2014: $15.0 million) granted by a bank to the subsidiary company.
32. FINANCIAL RISK MANAGEMENT
Financial risk factors The Group’s activities expose it to market risk (including currency risk and interest rate risk), credit risk and liquidity risk. The Group’s overall risk management strategy seeks to minimise any adverse effects from the unpredictability of financial markets on the Group’s financial performance. After identifying and evaluating its exposure to the financial risks, the Group establishes policies to monitor and manage these risks in accordance with its risk management philosophy. The Group uses financial instruments such as currency forwards, cross currency swaps, interest rate swaps and foreign currency borrowings to hedge certain financial risk exposures.

ANNUAL REPORT 2015 | OF EXCELLENCE & ELEGANCE ———— 93
NOTES TO THE FINANCIAL STATEMENTS For the Financial Year Ended 30 June 2015 32. FINANCIAL RISK MANAGEMENT (continued)
(a) Market risk
(i) Currency risk
The Group operates in Asia with dominant operations in Singapore, Malaysia, the People’s Republic of China and Hong Kong SAR. Entities in the Group may transact in currencies other than their respective functional currencies. Currency risk arises within entities in the Group when transactions are denominated in foreign currencies. To manage the currency exposure, the Group enters into currency forwards with banks. The Group also holds long-term overseas investments and its net assets are exposed to currency translation risk. The Group uses natural hedging opportunities, like borrowing in the currency of the country in which these investments are located whenever practicable. The exchange differences arising from such translations are captured under the currency translation reserve. These currency translation differences are reviewed and monitored on a regular basis.
The Group’s and the Company’s currency exposure is as follows:
SGD RM USD HKD Other Total $’000 $’000 $’000 $’000 $’000 $’000
Group 2015 Financial assets Cash and cash equivalents 667,566 92,362 13,714 8,042 98,927 880,611 Available-for-sale
financial assets 3,189 - 3,078 - - 6,267 Trade and other receivables
(current and non-current) 389,552 21,064 636 17,211 285 428,748 Other financial assets 11,257 2,976 194 4 1,701 16,132
1,071,564 116,402 17,622 25,257 100,913 1,331,758
Financial liabilities Trade and other payables (124,196) (39,238) (1,657) (459) (11,328) (176,878) Borrowings (990,000) (152,935) (48,424) - - (1,191,359) Other financial liabilities (26,579) (12,016) (3,295) - - (41,890)
(1,140,775) (204,189) (53,376) (459) (11,328) (1,410,127)
Net financial (liabilities)/ assets (69,211) (87,787) (35,754) 24,798 89,585 (78,369)
Net financial liabilities/(assets) denominated in the respective entities’ functional currencies 1,487 128,602 30,583 (17,261) (91,957) 51,454
Firm commitments and highly probable forecast transactions in foreign currencies - - (2,817) (155) (6,477) (9,449)
Currency forwards and cross currency swaps (19,138) - 17,714 - 7,871 6,447
Currency exposure (86,862) 40,815 9,726 7,382 (978) (29,917)

94 ———— WING TAI HOLDINGS LIMITED
NOTES TO THE FINANCIAL STATEMENTS For the Financial Year Ended 30 June 2015 32. FINANCIAL RISK MANAGEMENT (continued)
(a) Market risk (continued)
(i) Currency risk (continued) SGD RM USD HKD Other Total $’000 $’000 $’000 $’000 $’000 $’000
Group 2014 Financial assets Cash and cash equivalents 645,913 107,071 16,506 5,148 60,124 834,762 Available-for-sale
financial assets 3,189
-
-
-
- 3,189 Trade and other receivables
(current and non-current) 405,726 42,662 725 12,911 16 462,040 Other financial assets 11,271 3,403 1 18 2,072 16,765
1,066,099 153,136 17,232 18,077 62,212 1,316,756
Financial liabilities Trade and other payables (190,261) (46,692) (2,143) (1,077) (20,196) (260,369) Borrowings (1,035,871) (161,943) (43,760) (60,649) - (1,302,223) Other financial liabilities (18,112) (14,064) (4,314) - - (36,490)
(1,244,244) (222,699) (50,217) (61,726) (20,196) (1,599,082)
Net financial (liabilities)/ assets (178,145) (69,563) (32,985) (43,649) 42,016 (282,326)
Net financial liabilities/(assets) denominated in the respective entities’ functional currencies 89,045 88,842 45,420 (12,957) (46,948) 163,402
Firm commitments and highly probable forecast transactions in foreign currencies - - (2,422) (1,522) (3,271) (7,215)
Currency forwards and cross currency swaps (68,344) - 3,829 62,576 7,189 5,250
Currency exposure (157,444) 19,279 13,842 4,448 (1,014) (120,889)
The Group does not have significant currency exposure arising from inter-company balances.

ANNUAL REPORT 2015 | OF EXCELLENCE & ELEGANCE ———— 95
NOTES TO THE FINANCIAL STATEMENTS For the Financial Year Ended 30 June 2015 32. FINANCIAL RISK MANAGEMENT (continued)
(a) Market risk (continued) (i) Currency risk (continued)
SGD RM HKD Other Total $’000 $’000 $’000 $’000 $’000
Company 2015 Financial assets Cash and cash equivalents 414,483 40,798 7,771 26 463,078 Available-for-sale financial assets 3,189 - - - 3,189 Trade and other receivables
(current and non-current) 618,031 - 108,239 - 726,270 Other financial assets 1,263 - - 196 1,459
1,036,966 40,798 116,010 222 1,193,996
Financial liabilities Trade and other payables (92,866) - (760) (483) (94,109) Borrowings (723,000) - - (14,796) (737,796)
(815,866) - (760) (15,279) (831,905)
Net financial assets/(liabilities) 221,100 40,798 115,250 (15,057) 362,091 Net financial assets denominated in
the Company’s functional currency (221,100) - - - (221,100)
Cross currency swap - - - 14,836 14,836
Currency exposure - 40,798 115,250 (221) 155,827
2014 Financial assets Cash and cash equivalents 383,305 19,316 4,861 138 407,620 Available-for-sale financial assets 3,189 - - - 3,189 Trade and other receivables
(current and non-current) 841,344 - 41,346 3,097 885,787 Other financial assets 1,164 - 5 1 1,170
1,229,002 19,316 46,212 3,236 1,297,766
Financial liabilities Trade and other payables (144,207) - (706) (2,678) (147,591) Borrowings (670,000) - - - (670,000)
(814,207) - (706) (2,678) (817,591)
Net financial assets 414,795 19,316 45,506 558 480,175 Net financial assets denominated in
the Company’s functional currency (414,795) - - - (414,795)
Currency exposure - 19,316 45,506 558 65,380
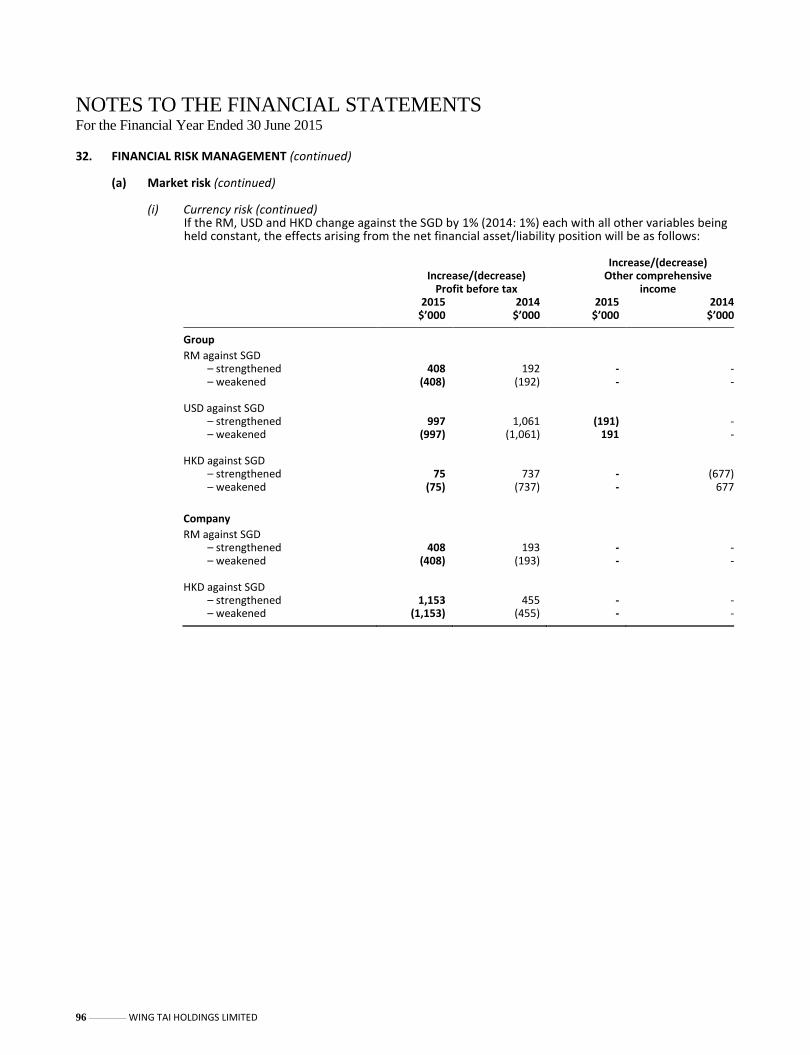
96 ———— WING TAI HOLDINGS LIMITED
NOTES TO THE FINANCIAL STATEMENTS For the Financial Year Ended 30 June 2015 32. FINANCIAL RISK MANAGEMENT (continued)
(a) Market risk (continued)
(i) Currency risk (continued) If the RM, USD and HKD change against the SGD by 1% (2014: 1%) each with all other variables being held constant, the effects arising from the net financial asset/liability position will be as follows:
Increase/(decrease) Profit before tax
Increase/(decrease) Other comprehensive
income 2015
$’000 2014
$’000 2015
$’000 2014
$’000
Group
RM against SGD – strengthened 408 192 - - – weakened (408) (192) - -
USD against SGD
– strengthened 997 1,061 (191) - – weakened (997) (1,061) 191 -
HKD against SGD
– strengthened 75 737 - (677) – weakened (75) (737) - 677
Company
RM against SGD – strengthened 408 193 - - – weakened (408) (193) - -
HKD against SGD
– strengthened 1,153 455 - - – weakened (1,153) (455) - -

ANNUAL REPORT 2015 | OF EXCELLENCE & ELEGANCE ———— 97
NOTES TO THE FINANCIAL STATEMENTS For the Financial Year Ended 30 June 2015
32. FINANCIAL RISK MANAGEMENT (continued)
(a) Market risk (continued) (ii) Cash flow and fair value interest rate risks
Cash flow interest rate risk is the risk that the future cash flows of a financial instrument will fluctuate because of changes in market interest rates. Fair value interest rate risk is the risk that the fair value of a financial instrument will fluctuate due to changes in market interest rates. The Group’s and the Company’s exposure to cash flow interest rate risks arises mainly from floating rate borrowings. The Group manages these cash flow interest rate risks by maintaining a prudent mix of fixed and floating rate borrowings and using floating-to-fixed interest rate swaps.
The Group’s borrowings at floating rates on which effective hedges have not been entered into are denominated mainly in SGD, RM and USD. If the SGD, RM and USD interest rates increase/decrease by 1% (2014: 1%) with all other variables being held constant, the profit before tax would have been lower/higher by $5.5 million (2014: $5.0 million) as a result of higher/lower interest expense on these borrowings. Other comprehensive income would have been higher/lower by $6.2 million (2014: $0.2 million) as a result of higher/lower fair value of interest rate swaps designated as cash flow hedges of floating rate borrowings.
The Company’s borrowings at floating rates on which effective hedges have not been entered into are denominated in SGD. If the SGD interest rates increase/decrease by 1% (2014: 1%) with all other variables being held constant, the profit before tax would have been lower/higher by $1.3 million (2014: $1.2 million) as a result of higher/lower interest expense on these borrowings. Other comprehensive income would have been higher/lower by $5.3 million (2014: Nil) as a result of higher/lower fair value of interest rate swaps designated as cash flow hedges of floating rate borrowings.
(b) Credit risk
Credit risk refers to the risk that a counterparty will default on its contractual obligations resulting in financial loss to the Group. The major classes of financial assets of the Group and of the Company are bank deposits and trade and other receivables. The Group has no significant concentration of credit risk with any single entity. The Group has policies in place to ensure that the sale of goods and the rendering of services are to customers with acceptable credit standing. Derivative counterparties and cash transactions are limited to high credit quality financial institutions. The Group has policies that limit the amount of credit exposure to any financial institution.
As the Group and the Company do not hold any collateral, the maximum exposure to credit risk for each class of financial instruments is the carrying amount of that class of financial instruments presented on the statements of financial position and disclosed in Note 31. The credit risk for trade receivables is as follows:
Group
2015 2014 $’000 $’000
By business segments Development properties 12,739 62,096 Investment properties 718 837 Retail 2,234 3,435 Others 1,507 1,294
17,198 67,662

98 ———— WING TAI HOLDINGS LIMITED
NOTES TO THE FINANCIAL STATEMENTS For the Financial Year Ended 30 June 2015 32. FINANCIAL RISK MANAGEMENT (continued)
(b) Credit risk (continued) (i) Financial assets that are neither past due nor impaired
Bank deposits that are neither past due nor impaired are mainly deposits with banks with high credit-ratings assigned by international credit-rating agencies. Trade and other receivables that are neither past due nor impaired are substantially companies with a good collection track record with the Group.
(ii) Financial assets that are past due and/or impaired
There is no other class of financial assets that is past due and/or impaired except for trade and other receivables.
The age analysis of trade receivables past due but not impaired is as follows:
Group
2015 2014 $’000 $’000
Past due less than 3 months 2,026 3,040 Past due 3 to 6 months 257 80 Past due over 6 months 551 808
2,834 3,928
The carrying amount of trade and other receivables individually determined to be impaired and the movement in the related allowance for impairment are as follows:
Group Company
2015 2014 2015 2014 $’000 $’000 $’000 $’000
Gross amount 321 410 467,343 449,941 Less: Allowance for impairment (321) (410) (244,207) (229,219)
- - 223,136 220,722
Beginning of financial year 410 391 229,219 205,601 Allowance made 23 79 28,893 23,618 Allowance utilised (84) (50) (13,905) - Currency translation differences (28) (10) - -
End of financial year 321 410 244,207 229,219
The impaired trade and other receivables arose mainly from loans to subsidiary companies for which recoverability is uncertain.
(c) Liquidity risk The Group actively manages its debt maturity profile, operating cash flows and the availability of funding so as to ensure that all refinancing, repayment and funding needs are met. The Group adopts prudent liquidity risk management by maintaining sufficient cash and the availability of funding through an adequate amount of committed credit facilities. The Group raises committed funding from both capital markets and financial institutions and prudently balances its portfolio with short term funding so as to achieve overall cost effectiveness.

ANNUAL REPORT 2015 | OF EXCELLENCE & ELEGANCE ———— 99
NOTES TO THE FINANCIAL STATEMENTS For the Financial Year Ended 30 June 2015 32. FINANCIAL RISK MANAGEMENT (continued)
(c) Liquidity risk (continued) The table below analyses the maturity profile of the Group’s and the Company’s financial liabilities (including derivative financial liabilities) based on contractual undiscounted cash flows. Balances due within 12 months equal their carrying amounts as the impact of discounting is not significant.
Less than 1 year
Between 1 and 2
years
Between 2 and 5
years
Over
5 years $’000 $’000 $’000 $’000
Group 2015 Net-settled interest rate swaps 658 656 1,546 - Gross-settled cross currency swaps
– Receipts (631) (629) (36,455) - – Payments 1,073 1,070 35,541 -
Gross-settled currency forwards – Receipts (10,749) - - - – Payments 10,684 - - -
Trade and other payables 176,878 - - - Borrowings 78,344 264,901 520,638 535,914 Other financial liabilities - 37,791 3,835 264
256,257 303,789 525,105 536,178
2014 Net-settled interest rate swaps 408 - - - Gross-settled cross currency swaps
– Receipts (61,284) - - - – Payments 68,873 - - -
Gross-settled currency forwards – Receipts (12,309) - - - – Payments 12,289 - - -
Trade and other payables 260,369 - - - Borrowings 226,926 184,909 555,180 538,727 Other financial liabilities - 34,487 1,980 23
495,272 219,396 557,160 538,750
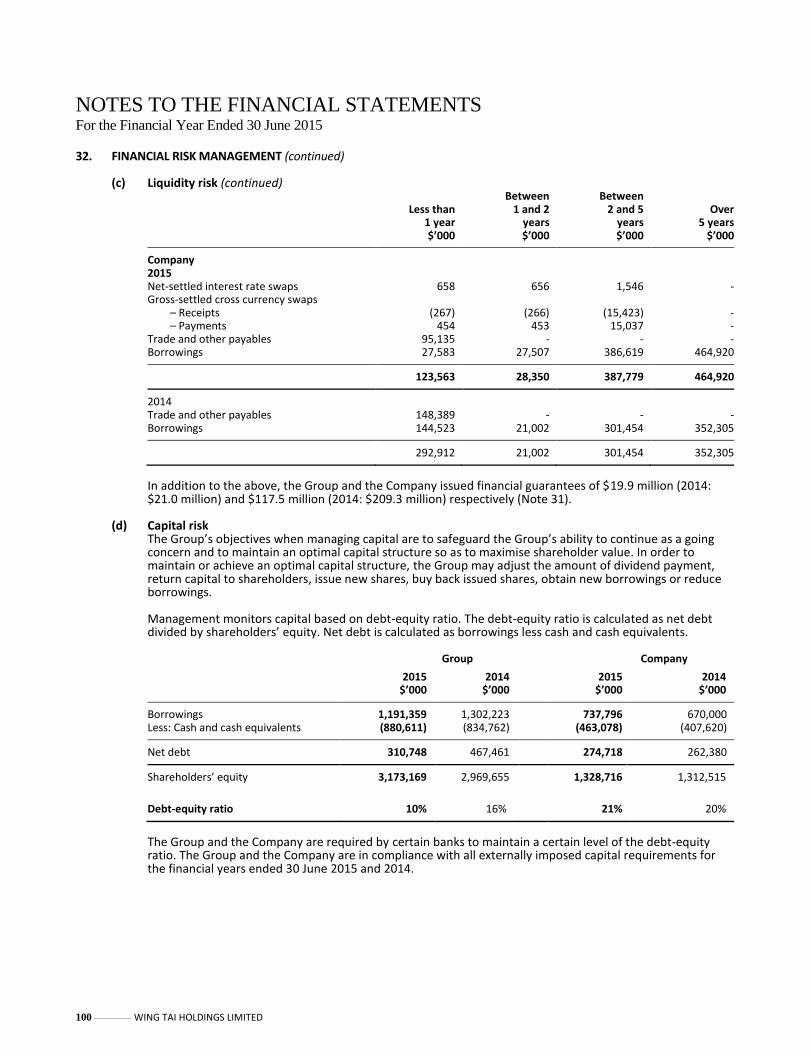
100 ———— WING TAI HOLDINGS LIMITED
NOTES TO THE FINANCIAL STATEMENTS For the Financial Year Ended 30 June 2015 32. FINANCIAL RISK MANAGEMENT (continued)
(c) Liquidity risk (continued)
Less than 1 year
Between 1 and 2
years
Between 2 and 5
years
Over
5 years $’000 $’000 $’000 $’000
Company 2015 Net-settled interest rate swaps 658 656 1,546 - Gross-settled cross currency swaps
– Receipts (267) (266) (15,423) - – Payments 454 453 15,037 -
Trade and other payables 95,135 - - - Borrowings 27,583 27,507 386,619 464,920
123,563 28,350 387,779 464,920
2014 Trade and other payables 148,389 - - - Borrowings 144,523 21,002 301,454 352,305
292,912 21,002 301,454 352,305
In addition to the above, the Group and the Company issued financial guarantees of $19.9 million (2014: $21.0 million) and $117.5 million (2014: $209.3 million) respectively (Note 31).
(d) Capital risk The Group’s objectives when managing capital are to safeguard the Group’s ability to continue as a going concern and to maintain an optimal capital structure so as to maximise shareholder value. In order to maintain or achieve an optimal capital structure, the Group may adjust the amount of dividend payment, return capital to shareholders, issue new shares, buy back issued shares, obtain new borrowings or reduce borrowings.
Management monitors capital based on debt-equity ratio. The debt-equity ratio is calculated as net debt divided by shareholders’ equity. Net debt is calculated as borrowings less cash and cash equivalents.
Group Company
2015 2014 2015 2014 $’000 $’000 $’000 $’000
Borrowings 1,191,359 1,302,223 737,796 670,000 Less: Cash and cash equivalents (880,611) (834,762) (463,078) (407,620)
Net debt 310,748 467,461 274,718 262,380
Shareholders’ equity 3,173,169 2,969,655 1,328,716 1,312,515
Debt-equity ratio 10% 16% 21% 20%
The Group and the Company are required by certain banks to maintain a certain level of the debt-equity ratio. The Group and the Company are in compliance with all externally imposed capital requirements for the financial years ended 30 June 2015 and 2014.
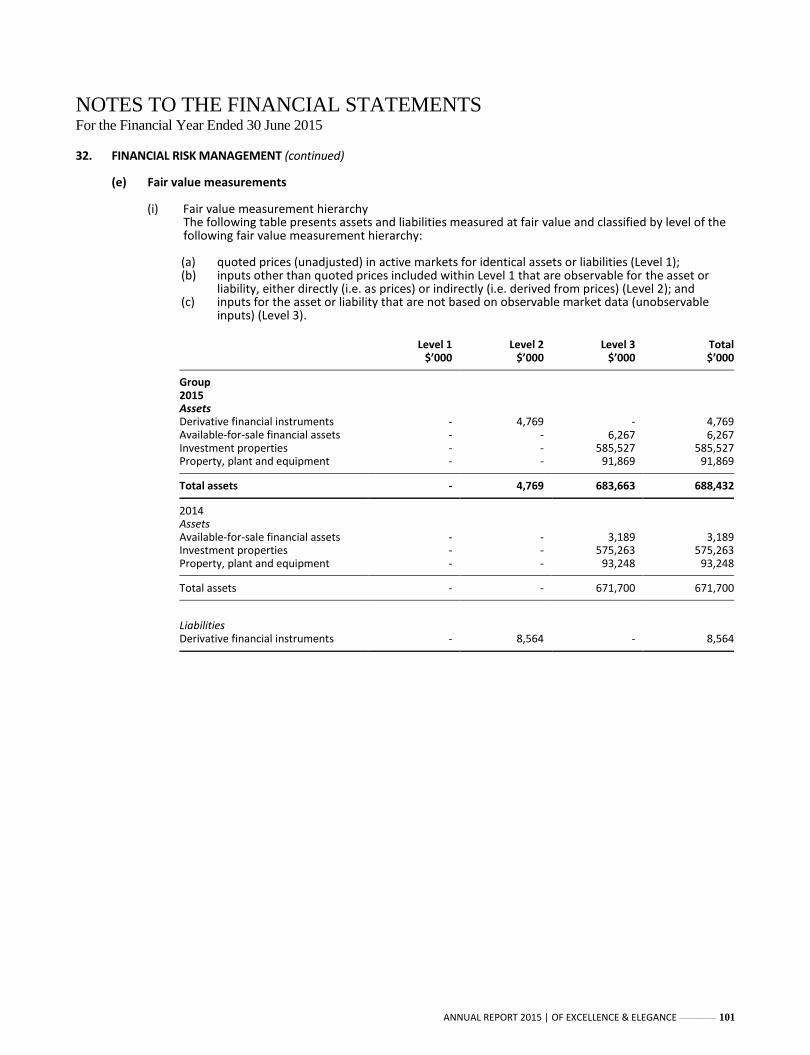
ANNUAL REPORT 2015 | OF EXCELLENCE & ELEGANCE ———— 101
NOTES TO THE FINANCIAL STATEMENTS For the Financial Year Ended 30 June 2015 32. FINANCIAL RISK MANAGEMENT (continued)
(e) Fair value measurements
(i) Fair value measurement hierarchy The following table presents assets and liabilities measured at fair value and classified by level of the following fair value measurement hierarchy:
(a) quoted prices (unadjusted) in active markets for identical assets or liabilities (Level 1); (b) inputs other than quoted prices included within Level 1 that are observable for the asset or
liability, either directly (i.e. as prices) or indirectly (i.e. derived from prices) (Level 2); and (c) inputs for the asset or liability that are not based on observable market data (unobservable
inputs) (Level 3).
Level 1 Level 2 Level 3 Total $’000 $’000 $’000 $’000
Group 2015 Assets Derivative financial instruments - 4,769 - 4,769 Available-for-sale financial assets - - 6,267 6,267 Investment properties - - 585,527 585,527 Property, plant and equipment - - 91,869 91,869
Total assets - 4,769 683,663 688,432
2014 Assets Available-for-sale financial assets - - 3,189 3,189 Investment properties - - 575,263 575,263 Property, plant and equipment - - 93,248 93,248
Total assets - - 671,700 671,700
Liabilities Derivative financial instruments - 8,564 - 8,564

102 ———— WING TAI HOLDINGS LIMITED
NOTES TO THE FINANCIAL STATEMENTS For the Financial Year Ended 30 June 2015 32. FINANCIAL RISK MANAGEMENT (continued)
(e) Fair value measurements (continued) (i) Fair value measurement hierarchy (continued)
Level 1 Level 2 Level 3 Total $’000 $’000 $’000 $’000
Company 2015 Assets Derivative financial instruments - 3,231 - 3,231 Available-for-sale financial assets - - 3,189 3,189
Total assets - 3,231 3,189 6,420
2014 Assets Available-for-sale financial assets - - 3,189 3,189
(ii) Level 2 fair value measurements The fair value of interest rate and cross currency swaps is calculated as the present value of the estimated future cash flows discounted at actively quoted interest and forward exchange rates. The fair value of currency forwards is determined using actively quoted forward exchange rates at the end of the reporting period. These instruments are classified as Level 2 and comprise derivative financial instruments.
(iii) Level 3 fair value measurements (a) Valuation techniques and inputs used in Level 3 fair value measurements
The following table presents the valuation techniques and key inputs used to determine the fair values of investment properties and freehold and leasehold land and buildings classified as property, plant and equipment that are categorised under Level 3 of the fair value measurement hierarchy which involves significant unobservable inputs.
Relationship of Range of significant Significant significant unobservable Valuation unobservable unobservable inputs to Type Techniques inputs inputs fair value
Commercial buildings, serviced apartments, condominium housing and shop offices in Singapore, Malaysia and the People’s Republic of China
Direct Comparison Approach
Market value per square
metre
$353 - $20,778 per square metre
The higher the adjusted valuation per square
metre, the higher the fair value
Capitalisation Approach
Estimated rental rate
$94 - $105 per square metre per
month
The higher the rental value per square metre, the higher the fair value
Capitalisation rate
4.25% - 4.35% The higher the capitalisation rate, the
lower the fair value

ANNUAL REPORT 2015 | OF EXCELLENCE & ELEGANCE ———— 103
NOTES TO THE FINANCIAL STATEMENTS For the Financial Year Ended 30 June 2015
32. FINANCIAL RISK MANAGEMENT (continued)
(e) Fair value measurements (continued)
(iii) Level 3 fair value measurements (continued) (a) Valuation techniques and inputs used in Level 3 fair value measurements (continued)
There were no significant inter-relationships between the significant unobservable inputs.
The valuation technique for available-for-sale financial assets is based on unobservable inputs, as such, these assets are classified as Level 3. Any changes to these unobservable inputs will not have a material impact on the fair value of the available-for-sale financial assets.
(b) Valuation processes of the Group
The Group engages external, independent and qualified valuers to determine the fair values of the Group’s investment properties and freehold and leasehold land and buildings classified as property, plant and equipment based on the properties’ highest and best use using the Direct Comparison Approach and/or the Capitalisation Approach. The Direct Comparison Approach involves the analysis of comparable sales of similar properties and adjusting the sale prices to that reflective of the properties. The Capitalisation Approach capitalises an income stream into a present value using revenue multipliers or single-year capitalisation rates.
(f) Financial instruments by category
The carrying amount of the different categories of financial instruments is as disclosed on the face of the statements of financial position and in Notes 11 and 16 to the financial statements, except for the following:
Group Company
2015 2014 2015 2014 $’000 $’000 $’000 $’000
Loans and receivables 1,543,282 1,669,365 1,190,806 1,294,577 Financial liabilities at amortised cost 1,410,127 1,599,082 831,905 817,591
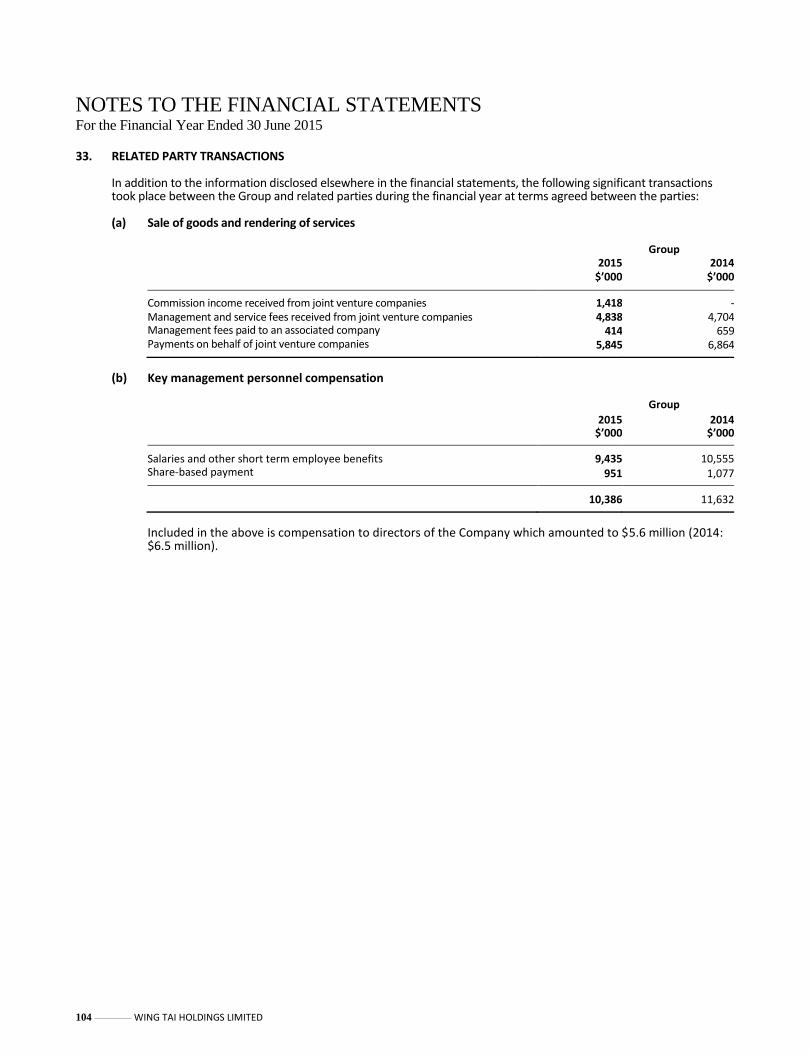
104 ———— WING TAI HOLDINGS LIMITED
NOTES TO THE FINANCIAL STATEMENTS For the Financial Year Ended 30 June 2015 33. RELATED PARTY TRANSACTIONS
In addition to the information disclosed elsewhere in the financial statements, the following significant transactions took place between the Group and related parties during the financial year at terms agreed between the parties:
(a) Sale of goods and rendering of services
Group 2015
$’000 2014
$’000
Commission income received from joint venture companies 1,418 - Management and service fees received from joint venture companies 4,838 4,704 Management fees paid to an associated company 414 659 Payments on behalf of joint venture companies 5,845 6,864
(b) Key management personnel compensation
Group
2015 2014 $’000 $’000
Salaries and other short term employee benefits 9,435 10,555 Share-based payment 951 1,077
10,386 11,632
Included in the above is compensation to directors of the Company which amounted to $5.6 million (2014: $6.5 million).

ANNUAL REPORT 2015 | OF EXCELLENCE & ELEGANCE ———— 105
NOTES TO THE FINANCIAL STATEMENTS For the Financial Year Ended 30 June 2015 34. SEGMENT INFORMATION
The Group is organised into three main business segments - development properties, investment properties and retail. Other operations of the Group comprise mainly garment manufacturing and investment holding, neither of which constitutes a separately reportable segment. The segment information for the reportable segments is as follows:
Development
properties Investment properties
Retail Others Group
2015 $’000 $’000 $’000 $’000 $’000
Revenue 430,191 37,529 199,012 9,983 676,715
EBIT 92,356 34,210 (8,809) (21,971) 95,786 Interest income 7,561
Operating profit 103,347 Finance costs (47,335) Share of profits/(losses) of associated
and joint venture companies 4,036 111,566 10,610 (6,929) 119,283
Profit before income tax 175,295 Income tax expense (9,352)
Total profit 165,943
Segment assets 2,134,168 666,092 68,872 87,352 2,956,484 Investment in an
associated company 208,359 1,206,278 - (60,685) 1,353,952
Investments in joint venture companies 95,862 - 60,117 20,320 176,299
Due from associated and joint venture companies 384,071 9,087 568 617 394,343
2,822,460 1,881,457 129,557 47,604 4,881,078
Tax recoverable 6,482
Consolidated total assets 4,887,560
Segment liabilities 131,512 11,320 17,819 58,117 218,768 Borrowings 138,142 213,793 - 839,424 1,191,359
269,654 225,113 17,819 897,541 1,410,127
Current income tax liabilities 51,222 Deferred income tax liabilities 64,010
Consolidated total liabilities 1,525,359
Capital expenditure 208 1,147 3,785 2,489 7,629 Depreciation 289 1,566 8,974 3,561 14,390

106 ———— WING TAI HOLDINGS LIMITED
NOTES TO THE FINANCIAL STATEMENTS For the Financial Year Ended 30 June 2015 34. SEGMENT INFORMATION (continued)
Development
properties Investment properties
Retail Others Group
2014 $’000 $’000 $’000 $’000 $’000
Revenue 545,563 35,934 213,519 8,377 803,393
EBIT 170,712 31,462 (2,567) (14,718) 184,889 Interest income 12,705
Operating profit 197,594 Finance costs (39,897) Share of profits/(losses) of associated
and joint venture companies 10,416 136,690 9,456 (1,788) 154,774
Profit before income tax 312,471 Income tax expense (36,129)
Total profit 276,342
Segment assets 2,320,269 671,384 86,926 101,319 3,179,898 Investment in an
associated company 200,892 999,072 - (37,536) 1,162,428
Investments in joint venture companies 71,044 - 53,105 26,936 151,085
Due from associated and joint venture companies 370,577 9,020 1,156 718 381,471
2,962,782 1,679,476 141,187 91,437 4,874,882
Tax recoverable 8,532
Consolidated total assets 4,883,414
Segment liabilities 185,195 11,806 27,624 83,852 308,477 Borrowings 218,574 220,240 - 863,409 1,302,223
403,769 232,046 27,624 947,261 1,610,700
Current income tax liabilities 57,206 Deferred income tax liabilities 72,694
Consolidated total liabilities 1,740,600
Capital expenditure 219 5,109 12,898 2,141 20,367 Depreciation 276 1,465 8,800 3,813 14,354

ANNUAL REPORT 2015 | OF EXCELLENCE & ELEGANCE ———— 107
NOTES TO THE FINANCIAL STATEMENTS For the Financial Year Ended 30 June 2015 34. SEGMENT INFORMATION (continued)
The Group’s three main business segments operate in four main geographical areas - Singapore, Malaysia, the People’s Republic of China (“PRC”) and Hong Kong SAR.
Revenue Non-current assets
2015 2014 2015 2014
$’000 $’000 $’000 $’000
Singapore 522,637 583,307 972,023 960,961 Malaysia 103,624 172,351 114,475 119,387 PRC 50,454 47,735 183,998 149,751 Hong Kong SAR - - 1,375,739 1,175,425
676,715 803,393 2,646,235 2,405,524

108 ———— WING TAI HOLDINGS LIMITED
NOTES TO THE FINANCIAL STATEMENTS For the Financial Year Ended 30 June 2015 35. COMPANIES IN THE GROUP
Information relating to the companies in the Group is given below, with the exception of inactive and dormant companies. Singapore-incorporated subsidiary and joint venture companies are audited by PricewaterhouseCoopers LLP, Singapore unless otherwise indicated.
Effective interest
held by the Country of Group
incorporation/ 2015 2014 Name of company place of business Principal activities % %
(a) Wing Tai Holdings Limited Singapore-Quoted Investment holding n/a n/a
on Singapore
Exchange Securities Trading Limited
(b) Subsidiary companies
Wing Tai Malaysia Berhad ! Malaysia-Quoted Investment holding 60.4 60.8 on Bursa Malaysia
Securities Berhad
Angel Wing (M) Sdn. Bhd. *, ! Malaysia Property development 60.4 60.8
Angkasa Indah Sdn. Bhd. *, ! Malaysia Property development 60.4 60.8
Bergendale Investments Limited
*,# British Virgin Islands (“BVI”)
Investment holding 100 100
Brave Dragon Ltd *, # BVI/Hong Kong SAR Investment holding 89.4 89.4
Chanlai Sdn. Bhd. *, ! Malaysia Property development 60.4 60.8
Crossbrook Group Ltd # BVI/Hong Kong SAR Investment holding 100 100
DNP Hartajaya Sdn. Bhd. *, ! Malaysia Property development 60.4 60.8
DNP Jaya Sdn. Bhd. *, ! Malaysia Property investment 60.4 60.8
DNP Land Sdn. Bhd. *, ! Malaysia Property development 60.4 60.8
DNP Property Management *, ! Malaysia Project management and 60.4 60.8 Sdn. Bhd. maintenance of properties D & P-Ejenawa Sdn. Bhd. *, ! Malaysia Property development 60.4 60.8 Grand Eastern Realty & *, ! Malaysia Property development 60.4 60.8 Development Sdn. Bhd. n/a: not applicable

ANNUAL REPORT 2015 | OF EXCELLENCE & ELEGANCE ———— 109
NOTES TO THE FINANCIAL STATEMENTS For the Financial Year Ended 30 June 2015 35. COMPANIES IN THE GROUP (continued)
Effective interest
held by the Country of Group
incorporation/ 2015 2014 Name of company place of business Principal activities % %
(b) Subsidiary companies (continued)
Harta-Aman Sdn. Bhd. *, ! Malaysia Property development 60.4 60.8 Hartamaju Sdn. Bhd. *, ! Malaysia Property development 60.4 60.8 Jiaxin (Suzhou) Property
Development Co., Ltd *, > The People’s
Republic of China (“PRC”)
Property development, investment and management
75 75
Quality Frontier Sdn. Bhd. *, ! Malaysia Property development 60.4 60.8 Seniharta Sdn. Bhd. *, ! Malaysia Property investment 60.4 60.8 Sri Rampaian Sdn. Bhd. *, ! Malaysia Manufacture of
textile garments 60.4 60.8
Starpuri Development *, ! Malaysia Property development 60.4 60.8 Sdn. Bhd. Suzhou Property * Singapore Property development 75 75 Development Pte Ltd and investment holding Wincheer Investment Pte Ltd * Singapore Property investment 100 100 and development Wingold Investment Pte Ltd * Singapore Investment holding 100 100 Wingstar Investment Pte. Ltd. * Singapore Investment holding 100 100 Winmax Investment Pte Ltd * Singapore Property investment 100 100 Winnervest Investment Pte Ltd * Singapore Property investment 100 100 and development Winnorth Investment Pte Ltd * Singapore Property investment 100 100 and development Winquest Investment Pte Ltd * Singapore Property investment
and development 60 60
Winrose Investment Pte Ltd * Singapore Property investment 100 100 and development Winshine Investment Pte Ltd * Singapore Property investment 100 100 Winsland Investment Pte Ltd * Singapore Property investment 100 100 Winsmart Investment Pte Ltd * Singapore Property investment 100 100 and development

110 ———— WING TAI HOLDINGS LIMITED
NOTES TO THE FINANCIAL STATEMENTS For the Financial Year Ended 30 June 2015 35. COMPANIES IN THE GROUP (continued)
Effective interest
held by the Country of Group
incorporation/ 2015 2014 Name of company place of business Principal activities % %
(b) Subsidiary companies (continued)
Wing Mei (M) Sdn. Bhd. *, ! Malaysia Property investment 60.4 60.8 Wing Tai China Pte. Ltd. * Singapore Investment holding 100 100 Wing Tai (China) * Singapore Investment holding 100 100 Investment Pte. Ltd. Wing Tai Clothing Pte Ltd * Singapore Retailing of garments 100 100 Wing Tai Clothing Sdn. Bhd. *, ! Malaysia Retailing of garments 60.4 60.8 Wing Tai Fashion Apparel Pte. Ltd. * Singapore Retailing of garments 100 100 Wing Tai Fashion Sdn. Bhd. *, ! Malaysia Retailing of garments 60.4 60.8 Wing Tai Investment Singapore Investment holding 100 100 & Development Pte Ltd Wing Tai Investment * Singapore Management of 100 100 Management Pte Ltd investment properties Wing Tai Land Pte Ltd Singapore Investment holding 100 100 Wing Tai Property * Singapore Project management 100 100 Management Pte Ltd and maintenance
of properties
Wing Tai Retail Pte Ltd Singapore Investment holding 100 100 Wing Tai Retail * Singapore Management of retail 100 100 Management Pte. Ltd. operations Wing Tai (Shanghai) Management
Co., Ltd *, @ PRC Provision of
consultancy and advisory services
100 -
Yong Yue (Shanghai) Property
Development Co., Ltd *, @ PRC Property development 100 100
Yoshinoya (S) Pte Ltd * Singapore Restaurant operator 100 100
(c) Associated company
Wing Tai Properties Limited *, % Bermuda-Quoted on The Stock Exchange of Hong Kong Limited/ Hong Kong SAR
Property development, property investment and management and hospitality investment and management
33.4 33.5

ANNUAL REPORT 2015 | OF EXCELLENCE & ELEGANCE ———— 111
NOTES TO THE FINANCIAL STATEMENTS For the Financial Year Ended 30 June 2015
35. COMPANIES IN THE GROUP (continued)
Effective interest held by the
Country of Group incorporation/ 2015 2014 Name of company place of business Principal activities % %
(d) Joint venture companies
G2000 Apparel (S) Pte Ltd * Singapore Retailing of garments 45 45 Kualiti Gold Sdn. Bhd. *, ! Malaysia Property investment 30.2 30.4 Optima Investment
& Development Pte. Ltd. *, & Singapore/PRC Property development
and investment holding 40 40
Summervale Properties Pte Ltd *, & Singapore Property investment and
development 50 50
Uniqlo (Malaysia) Sdn. Bhd. *, ! Malaysia Retailing of garments 27.2 27.4 Uniqlo (Singapore) Pte. Ltd. *, ~ Singapore Retailing of garments 49 49 Wingcrown Investment
Pte. Ltd. * Singapore Property investment and
development 40 40
Winnoma Investment Pte. Ltd. * Singapore/PRC Property investment and
development and investment holding
50 50
* Held by Group companies.
! Audited by Ernst and Young, Malaysia.
# These companies are not required to be audited by law in the country of incorporation.
% Audited by PricewaterhouseCoopers, Hong Kong SAR. & Audited by KPMG LLP, Singapore.
~ Audited by Ernst and Young LLP, Singapore.
> Audited by RSM, PRC. @ Audited by PricewaterhouseCoopers, PRC.
In accordance to Rule 716 of the Singapore Exchange Securities Trading Limited - Listing Rules, the Audit and Risk Committee and the Board of Directors of the Company confirmed that they are satisfied that the appointment of different auditors for its significant subsidiary and associated companies would not compromise the standard and effectiveness of the audit of the Company.

112 ———— WING TAI HOLDINGS LIMITED
NOTES TO THE FINANCIAL STATEMENTS For the Financial Year Ended 30 June 2015 36. SUBSEQUENT EVENTS
On 3 September 2015, the Company and its wholly-owned subsidiary, Wing Tai Investment & Development Pte Ltd, in aggregate subscribed for 123.1 million ordinary shares pursuant to a 1 for 2 rights issue in Wing Tai Malaysia Berhad (“WTM”), a subsidiary company listed on the Bursa Malaysia Securities Berhad, at RM1.15 per share for a total consideration of RM141.6 million. Following the allotment of shares under the rights issue, the Group’s shareholding in WTM has increased to 66.23%.
37. NEW OR REVISED ACCOUNTING STANDARDS AND INTERPRETATIONS
Below are the mandatory standards, amendments and interpretations to existing standards that have been published, and are relevant for the Group’s accounting periods beginning on or after 1 July 2015 or later periods and which the Group has not early adopted:
(a) FRS 1 Presentation of Financial Statements (effective for annual periods beginning on or after 1 January
2016) This amendment clarifies guidance in FRS 1 on materiality and aggregation, the presentation of subtotals, the structure of financial statements and the disclosure of accounting policies. This amendment is not expected to have any significant impact on the financial statements of the Group.
(b) FRS 115 Revenue from Contracts with Customers (effective for annual periods beginning on or after 1
January 2017) This is the converged standard on revenue recognition. It replaces FRS 11 Construction Contracts, FRS 18 Revenue, and related interpretations. Revenue is recognised when a customer obtains control of a good or service. A customer obtains control when it has the ability to direct the use of and obtain the benefits from the good or service. The core principle of FRS 115 is that an entity recognises revenue to depict the transfer of promised goods or services to customers in an amount that reflects the consideration to which the entity expects to be entitled in exchange for those goods or services. FRS 115 also includes a cohesive set of disclosure requirements that will result in an entity providing users of financial statements with comprehensive information about the nature, amount, timing and uncertainty of revenue and cash flows arising from the entity’s contracts with customers. The Group is in the process of assessing the potential impact of FRS 115 on the financial statements.
(c) FRS 109 Financial Instruments (effective for annual periods beginning on or after 1 January 2018) The complete version of FRS 109 replaces most of the guidance in FRS 39 Financial Instruments: Recognition and Measurement. FRS 109 retains but simplifies the mixed measurement model and establishes three primary measurement categories for financial assets: amortised cost, fair value through other comprehensive income (“OCI”) and fair value through profit or loss. The basis of classification depends on the entity’s business model and the contractual cash flow characteristics of the financial asset. Investments in equity instruments are required to be measured at fair value through profit or loss with the irrevocable option at inception to present changes in fair value in OCI. There is now a new expected credit losses model that replaces the incurred loss impairment model used in FRS 39. For financial liabilities, there were no changes to classification and measurement except for the recognition of changes in own credit risk in OCI and for liabilities designated at fair value through profit or loss. FRS 109 relaxes the requirements for hedge effectiveness by replacing the bright line hedge effectiveness tests. It requires an economic relationship between the hedged item and the hedging instrument and for the ‘hedged ratio’ to be the same as the one management actually uses for risk management purposes. Contemporaneous documentation is still required but is different to that currently prepared under FRS 39. The Group is in the process of assessing the potential impact of FRS 109 on the financial statements.
38. AUTHORISATION OF FINANCIAL STATEMENTS
These financial statements have been authorised for issue in accordance with a resolution of the Board of Directors on 16 September 2015.

ANNUAL REPORT 2015 | OF EXCELLENCE & ELEGANCE
SHARE CAPITAL
No. of Issued Shares: No. of Issued Shares (excluding Treasury Shares): No./percentage of Treasury Shares: Class of Shares: Voting Rights (excluding Treasury Shares):
793,927,260 780,588,860 13,338,400 (1.71%) Ordinary Shares 1 vote per share
DISTRIBUTION OF SHAREHOLDERS
Size of Shareholdings No. of Shareholders % No. of Shares %
1 to 99 143 1.12 2,996 0.00
100 to 1,000 1,515 11.84 1,224,896 0.16
1,001 to 10,000 8,603 67.21 39,619,833 5.08
10,001 to 1,000,000 2,507 19.59 95,733,640 12.26
1,000,001 and above 31 0.24 644,007,495 82.50
Total 12,799 100.00 780,588,860 100.00
TWENTY LARGEST SHAREHOLDERS Name No. of Shares %
1 Wing Sun Development Private Limited 222,235,490 28.47
2 DBS Vickers Securities (S) Pte Ltd 73,797,575 9.45
3 Winlyn Investment Pte Ltd 72,717,436 9.32
4 Citibank Nominees Singapore Pte Ltd 61,049,308 7.82
5 DBS Nominees Pte Ltd 41,606,100 5.33
6 HSBC (Singapore) Nominees Pte Ltd 38,941,045 4.99
7 UOB Kay Hian Pte Ltd 31,073,309 3.98
8 Empire Gate Holdings Limited 19,539,572 2.50
9 Raffles Nominees (Pte) Ltd 18,336,009 2.35
10 United Overseas Bank Nominees Pte Ltd 14,192,082 1.82
11 DBSN Services Pte Ltd 6,747,271 0.86
12 OCBC Nominees Singapore Pte Ltd 4,709,470 0.60
13 DB Nominees (S) Pte Ltd 4,534,917 0.58
14 Bank of Singapore Nominees Pte Ltd 3,593,950 0.46
15 Winway Investment Pte Ltd 3,529,166 0.45
16 OCBC Securities Private Ltd 2,984,269 0.38
17 Philip Securities Pte Ltd 2,631,063 0.34
18 Maybank Kim Eng Securities Pte Ltd 2,099,120 0.27
19 Liu Hing Yuen Patricia @ Liu Pui Yuk 2,072,409 0.27
20 Societe Generale Singapore Branch 1,922,900 0.25
Total 628,312,461 80.49
PERCENTAGE OF SHAREHOLDING HELD IN THE HANDS OF PUBLIC As at 14 September 2015, approximately 48.86% of the issued ordinary shares of the Company are held by the public.
Rule 723 of the Listing Manual of the Singapore Exchange Securities Trading Limited has accordingly been complied with.
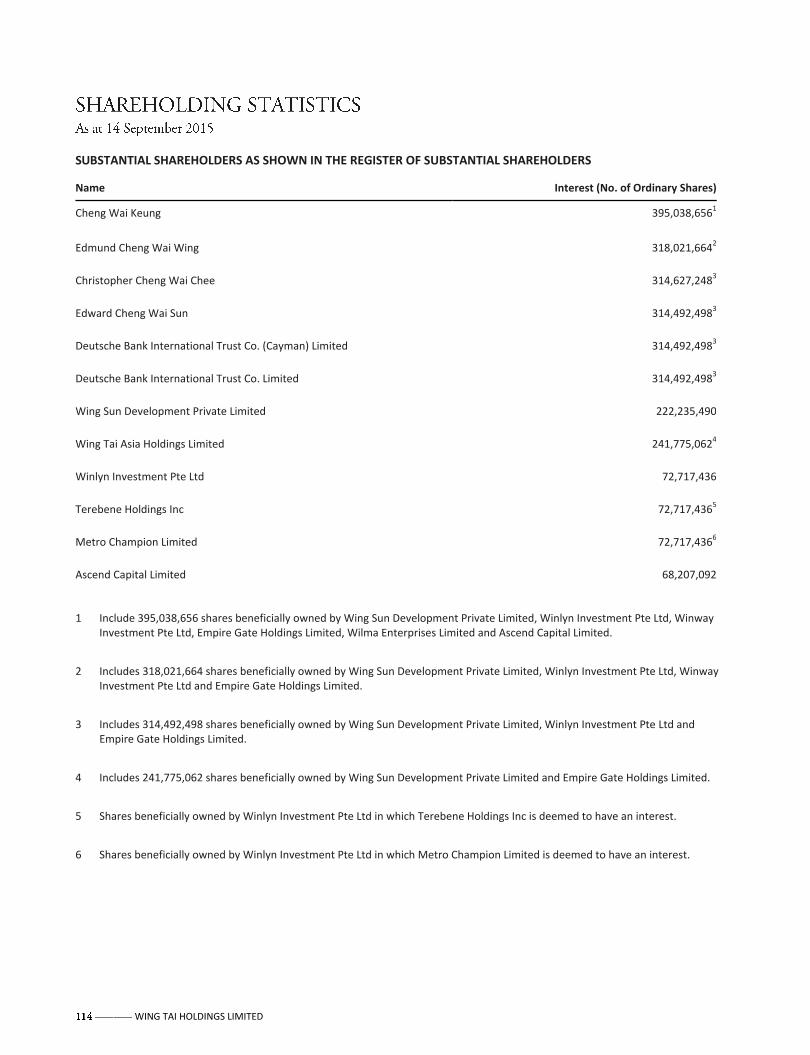
WING TAI HOLDINGS LIMITED
SUBSTANTIAL SHAREHOLDERS AS SHOWN IN THE REGISTER OF SUBSTANTIAL SHAREHOLDERS Name Interest (No. of Ordinary Shares)
Cheng Wai Keung 395,038,6561
Edmund Cheng Wai Wing 318,021,6642
Christopher Cheng Wai Chee 314,627,2483
Edward Cheng Wai Sun 314,492,4983
Deutsche Bank International Trust Co. (Cayman) Limited 314,492,4983
Deutsche Bank International Trust Co. Limited 314,492,4983
Wing Sun Development Private Limited 222,235,490
Wing Tai Asia Holdings Limited 241,775,0624
Winlyn Investment Pte Ltd 72,717,436
Terebene Holdings Inc 72,717,4365
Metro Champion Limited 72,717,4366
Ascend Capital Limited 68,207,092
1 Include 395,038,656 shares beneficially owned by Wing Sun Development Private Limited, Winlyn Investment Pte Ltd, Winway Investment Pte Ltd, Empire Gate Holdings Limited, Wilma Enterprises Limited and Ascend Capital Limited.
2 Includes 318,021,664 shares beneficially owned by Wing Sun Development Private Limited, Winlyn Investment Pte Ltd, Winway Investment Pte Ltd and Empire Gate Holdings Limited.
3 Includes 314,492,498 shares beneficially owned by Wing Sun Development Private Limited, Winlyn Investment Pte Ltd and Empire Gate Holdings Limited.
4 Includes 241,775,062 shares beneficially owned by Wing Sun Development Private Limited and Empire Gate Holdings Limited.
5 Shares beneficially owned by Winlyn Investment Pte Ltd in which Terebene Holdings Inc is deemed to have an interest.
6 Shares beneficially owned by Winlyn Investment Pte Ltd in which Metro Champion Limited is deemed to have an interest.

ANNUAL REPORT 2015 | OF EXCELLENCE & ELEGANCE ———— 115
This page has been intentionally left blank.

116 ———— WING TAI HOLDINGS LIMITED
This page has been intentionally left blank.

Elegant Architecture weaved into Nature’s Excellence.
Jean Nouvel, the bold, enigmatic Pritzker Architecture Prize laureate has teamed with wing Tai Asia to design the Nouvel collection which comprises the Le Nouvel Ardmore and Nouvel 18 in singapore, and the Le Nouvel KLCC in Kuala Lumpur, malaysia.
The exclusive Le Nouvel Ardmore is Jean Nouvel’s debut residential development in singapore and in Asia. By his expert interpretation of contextual specificity, textures and transparencies, Jean Nouvel masterfully blends the virtuous elements of air, wind and light with nature’s greenery, to infuse energy into the purity of the architecture. As the white towering form soars into the sky, in harmony with its surrounding sophistication, residents embrace life at its finest.
with its unrivalled architectural majesty, the Nouvel collection offers discerning buyers a rare opportunity to own real estate investments of unsurpassed value.
Winning Partnerships:
Jean Nouvel, on site at the Le Nouvel Ardmore. He devotes himself to creating architecture that residents can easily enjoy. An architecture that generates joy. One that celebrates life.
