nzs-4409 - enterprise java monitoring on zos discover, alert, optimize
TRANSCRIPT
Enterprise Java Monitoring on z/OS: Discover, Alert, OptimizeChris Walker – IBM
Please Note:
1
• IBM’s statements regarding its plans, directions, and intent are subject to change or withdrawal without notice at IBM’s solediscretion.
• Information regarding potential future products is intended to outline our general product direction and it should not be relied on in making a purchasing decision.
• The information mentioned regarding potential future products is not a commitment, promise, or legal obligation to deliver any material, code or functionality. Information about potential future products may not be incorporated into any contract.
• The development, release, and timing of any future features or functionality described for our products remains at our sole discretion.
• Performance is based on measurements and projections using standard IBM benchmarks in a controlled environment. The actual throughput or performance that any user will experience will vary depending upon many factors, including considerations such as the amount of multiprogramming in the user’s job stream, the I/O configuration, the storage configuration, and the workload processed. Therefore, no assurance can be given that an individual user will achieve results similar to those stated here.

Abstract
2
With the number of Java deployments increasing on z/OS, it is even more important today to understand across your z environment which JVMs you currently have executing and which ones are in need of attention, and understand whether there are any issues within the context of your z/OS sub-systems.
In this session you will learn how IBM's z/OS Monitoring solutions can give you greater insight into your JVM deployment, and hear how customers are leveraging the latest technology to get better resilience across their enterprises.

Background: Java on z/OS
3
z/OS is rapidly becoming
one of the optimal places to
run Java workloads
Virtually all major z/OS subsystems now
have some Java component
IBM Java 8 implementation working
with z13 hardware provides significant
performance throughput improvements
Vast majority of the
world’s corporate
data in systems of
record reside or
originated on
mainframe systems
Ability to optimize performance and
manage subsystem performance is key
to z/OS success…Java is part of this

Growth Factors
4
SkillsApplication Development on z/OS is growing.
New generation of developers comfortable
with Java as primary language
Creation of new workloads (for example,
Liberty in CICS)
IntegrationIntegration of new Java applications with
existing applications are a cost-effective
means of modernizing.
z/OS Connect providing new access to
systems of record from mobile workloads
PerformanceAccess from Java applications to Systems of
Record can be optimized. Control flow can
be managed better. Reduction in network
traffic and effects.
CostJava workloads eligible for specialty
processor offloading. Deployment of Java
based servers on z/OS maximize this benefit.

Challenges to monitor Java on z/OS
5
The JVM is a black-box“Do we know why performance is an issue?”
If there is a problem, do you just recycle and
start again?
Java is Everywhere“Are we clear on what is running?”
Can you be certain you are making efficient
use of resources?
Complexity of Existing SolutionsLots of point products (monitor a single JVM)
Designed for distributed platforms – not z/OS aware?
May rely on JMX and TCP/IP connections – do they scale?
Could use Byte Code Injection to track data – what is the cost?

Development Hills
6
“As an SME responsible for the performance and availability of JVMs on z/OS I expect to be able to view all
active JVMs within an LPAR, whether instrumented or not, such that I am aware of any active JVM within
1 minute of it being started so that further investigation can take place.”
“As an SME responsible for the performance and availability of JVMs on z/OS I need to be able to see
garbage collection related statistics for any active JVM in my system which will allow me to identify issues
where garbage collection is performing sub-optimally in less than 5 seconds.”
“As an SME responsible for the performance and availability of JVMs on z/OS I need to be able to see critical
statistics related to thread locks for any JVM in my system which will allow me to detect issues that are
related to thread locks in less than 5 seconds, leading to faster problem resolution of thread lock related
issues.”

Introducing OMEGAMON Monitoring for JVM
7
• Brand new OMEGAMON monitoring agent focused on assisting z/OS system administrators, operators and SMEs identify problems, resolve quicker and optimize performance
• Lightweight overhead compared to other offerings.
– 90% of data collected is through Health Center API
• Ability to view all JVMs side-by-side. No disconnect when switching between JVMs
• Collects data on any online JVM on z/OS
– Subsystems: CICS, IMS DB2, WAS, z/OS Connect, ODM
– Standalone Batch USS Java applications
– Can identify and distinguish Liberty JVM servers
• Data presented on both OMEGAMON enhanced 3270 UI and Tivoli Enterprise Portal
• Reports on Garbage Collection, Active Threads, Lock Utilization, JVM Environment, CPU Utilization
• Provides the standard OMEGAMON features:
– Look back in time with historical data collection
– Be alerted to abnormal conditions through defined event generation (Situations)
– Easy to configure and deploy using PARMGEN

Clear Summary of JVM Data – e3270UI
8
Each column represents the highest/worst current status for a given attribute (GC
Rate, Thread Blocked etc.). Each value is ‘zoomable’, that is, click or hit enter on
the cell value that interests or concerns you and you will be automatically
navigated to detailed information for the JVM that produced that value.
This is the initial workspace for JVM monitoring. Each row represents data collected
by a JVM monitoring agent. Typically, we would expect a user to deploy one agent
per LPAR and instrument all JVMs to report data back to that agent.

Clear Summary of JVM Data – TEP
9
Equivalent workspaces are developed for the TEP
interface. The JVM Monitor appears in the physical
navigator tree with an entry for each agent.
Multiple JVMs can send data to each agent.

Drilling down to important information
10
Highest JVM Statistics
JVM Health Summary CPU StatisticsGarbage Collection
StatisticsThread DetailsLock Details
JVM Environment
JVM Command Line
System Variables
Env Variables
JVM Parameters
Classpath
Boot Classpath
GET Count
Average Hold Time
Slow Gets
Recursive Acquires
Lock Utilization %
Thread State
Contending Object
Stack Trace
Nursery GC Details
Global GC Details
% Time Paused
Heap Allocation
General CPU
IFA CPU
IFA Work on
General CPU

Scenario: Visibility of all JVMs
11
• “We need to be able to see all JVMs that are currently online”
• As noted, JVMs can be found all over the environment. Can you be clear what is online, are there
JVMs online that are unplanned?
• Starting the JVM Monitor will seek out and find all JVMs on an LPAR regardless of subsystem type
whether they have been configured for full monitoring or not.
• The agent will capture the jobname, ASID, subsystem type and basic details of the JVM.
CICS TS
JVM
WAS
JVM
DB2
JVM
IMS
JVM
OMEGAMON
JVM
Agent

Scenario: Visibility of all JVMs
12
For a JVM to be fully monitored, it must be
instrumented to allow OMEGAMON to collect
data. If not, we can still determine online JVMs
and their subsystem type. These are reported
on the second subpanel here. A user can then
determine if they want to instrument that JVM
for full monitoring.

Scenario: Visibility of all JVMs
13
Equivalent Tivoli Enterprise Portal screen
showing JVMs currently being fully
monitored and those detected as being
online but not monitored by JVM agent
Scenario: Visibility of all JVMs
14
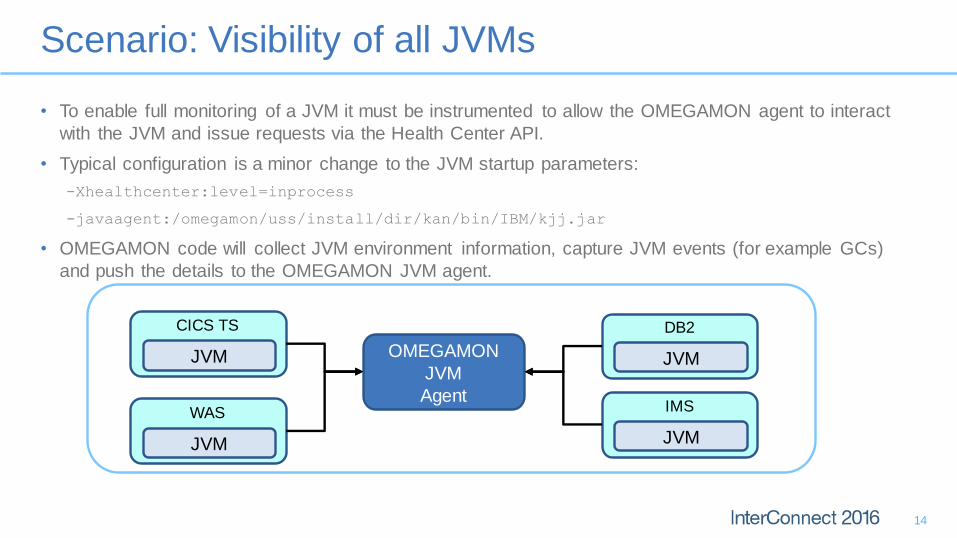
• To enable full monitoring of a JVM it must be instrumented to allow the OMEGAMON agent to interact
with the JVM and issue requests via the Health Center API.
• Typical configuration is a minor change to the JVM startup parameters:
-Xhealthcenter:level=inprocess
-javaagent:/omegamon/uss/install/dir/kan/bin/IBM/kjj.jar
• OMEGAMON code will collect JVM environment information, capture JVM events (for example GCs)
and push the details to the OMEGAMON JVM agent.
CICS TS
JVM
WAS
JVM
DB2
JVM
IMS
JVM
OMEGAMON
JVM
Agent

Scenario: Optimizing Garbage Collection
15
• “Performance of JVM is poor. Could Garbage Collection be a cause?”
• Performance of the Garbage Collector has improved significantly in recent releases of Java however
poor performance can still occur due to:
• Insufficient heap allocation
• Poorly written applications
• The symptoms of such problems might be:
• Excessive number GC events occurring within a given period of time
• High heap occupancy even after a GC
• Long pause times when GC event is occurring
• System GC events occurring
• The Garbage Collection Details workspaces provide insight into the performance of the JVM GC
allowing the operator to confirm (or dismiss) the JVM as a bottleneck in the performance throughput.

Scenario: Optimizing Garbage Collection
16
The Highest JVM Statistics subpanel shows the
poorest performing statistics in key GC metrics
If a threshold is exceeded (example GC Rate per
Minute), zoom into the JVM that potentially has
an issue.

Scenario: Optimizing Garbage Collection
17
GC Details can point out key values that may
indicate a problem. A rolling 5 minute interval is
used to scale values.
Does the Occupancy look OK? Average Heap
size fine?
Historical Data Collection
18
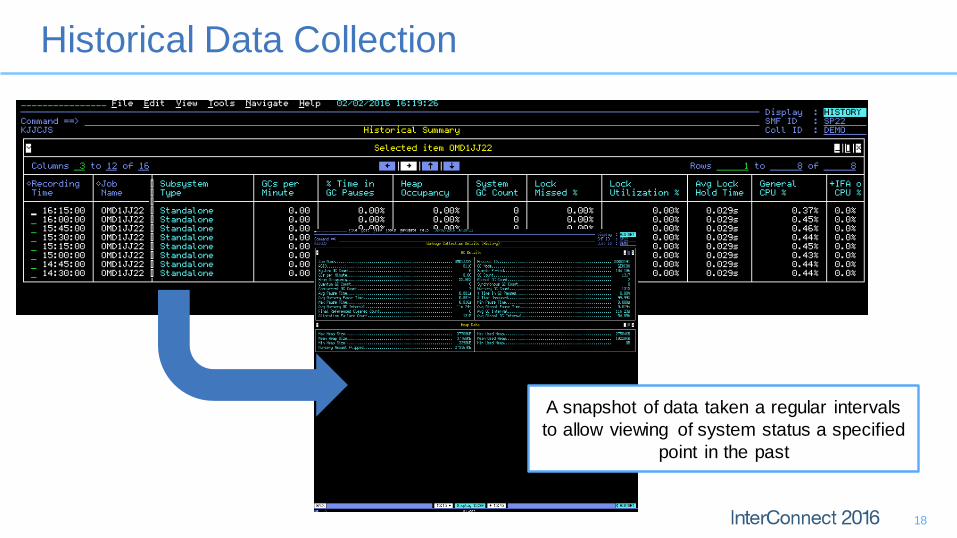
A snapshot of data taken a regular intervals
to allow viewing of system status a specified
point in the past

Scenario: Identifying Locks and Thread Blocks
19
• “Our applications are performing poorly. Can we see what might be causing this?”
• If not GC issues, perhaps threads are being blocked for an excessive period of time or locks within the
JVM are being held for long periods causing application to wait for the monitor to yield.
• If high values found here, the application owner (if applicable) can be alerted or adjustments to the
JVM environment could be made.

Scenario: Identifying Locks and Thread Blocks
20
Thread Statistics drills-down to all active threads
making BLOCKED threads easy to spot

Scenario: Identifying Locks and Thread Blocks
21
The Lock Statistics shows which monitor objects
were used as lock most often an how long they
were held for.

Scenario: Identify Environment Issues
22
• “We need to ensure that the Java levels being used are up to date”
• We are able to deep-dive into JVM environment details to view information like the classpath, system
properties and the version of Java being used.
• We can also define a situation to check setting and alert us to a problem. In this case, if a ‘bad’ Java
version is being used

Scenario: Identify Environment Issues
23
In the TEP Situation Editor we create a new
Situation to check against the JVMs
Version attribute. If this condition is ever
met, a Warning alert will be raised.

Scenario: Identify Environment Issues
24
Once the situation is tripped, you can
analyze the current conditions, identify
the offending job and take appropriate
action

Scenario: Identify Environment Issues
25
The Situation Status Tree in enhanced
3270 UI will if there is a JVM online with the
offending Java level. A user could then take
appropriate action
Product Packaging
26
OMEGAMON Monitoring Feature for JVM is provided as a priced feature of OMEGAMON XE on z/OS
Will be available also as part of all suite offerings:
Service Management Suite
OMEGAMON Performance Management Suite
OMEGAMON z/OS Management Suite
There is no technical dependency between OM on z/OS and OMEGAMON Monitoring Feature for JVM
Can deploy JVM agent without deployment of OM for z/OS agent, remote TEMS etc
Agent cuts across all subsystems and applicable to users of Java regardless of whether they have the subsystem
Suite Offerings
27
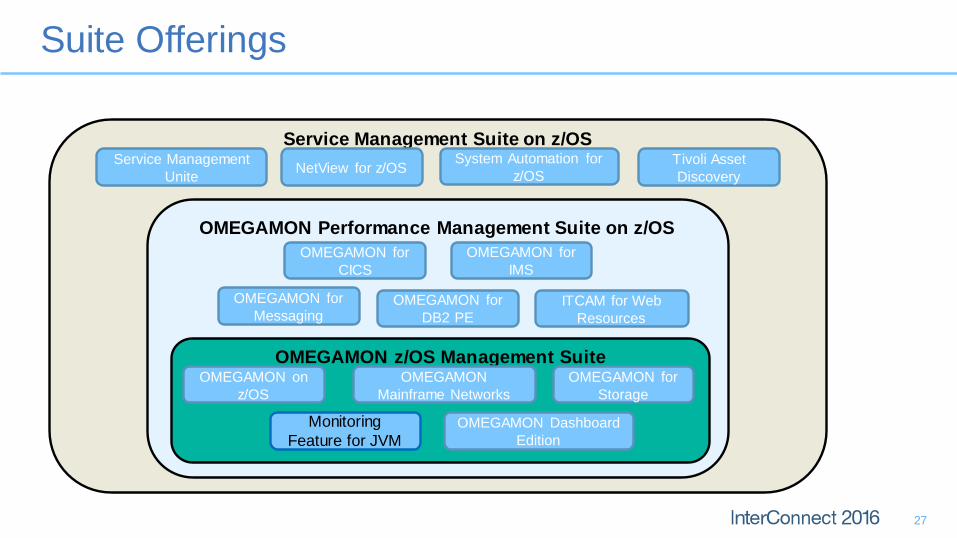
Service Management Suite on z/OS
OMEGAMON Performance Management Suite on z/OS
OMEGAMON z/OS Management SuiteOMEGAMON on
z/OS
Monitoring
Feature for JVM
OMEGAMON
Mainframe Networks
OMEGAMON for
Storage
OMEGAMON Dashboard
Edition
OMEGAMON for
CICS
OMEGAMON for
DB2 PE
OMEGAMON for
IMS
OMEGAMON for
MessagingITCAM for Web
Resources
Service Management
UniteNetView for z/OS
System Automation for
z/OS
Tivoli Asset
Discovery

Suite Offerings
28
Enable resource
monitoring of JVMs on
z/OS with the new
Tivoli OMEGAMON XE
on z/OS Monitoring
Feature for JVM.
It‘s a new priced
feature.
The new release
provides new function
to enable resource
monitoring of JVMs on
z/OS with the new
Monitoring Feature for
JVM as an integral
part of the suite.
The new release
provides new function
to enable resource
monitoring of JVMs on
z/OS with the new
Monitoring Feature for
JVM as an integral
part of the suite.
The new release
delivers valuable
Service Management
Unite dashboard
enhancements and
JVM Monitoring
Tivoli OMEGAMON XE on
z/OS, V5.3.0 (Monitoring
Feature for JVM)
Tivoli OMEGAMON for
z/OS Management Suite
V5.4.0
Tivoli OMEGAMON
Performance Management
Suite for z/OS V5.4.0
Service Management Suite
for z/OS V1.4.0
Helps manage
performance and
availability of IBM z/OS
operating system,
middleware, mainframe
networks, and z/OS
storage.
Provides detailed
monitoring and problem
management for IBM z
Systems.
Provides real-time and
historical performance,
and availability
management capabilities
for z/OS operating
systems, networks, and
storage.
Automation, network
mgmt., high availability,
asset discovery for critical
z business workloads.
Integration of systems
management and
analytics.
More Information/References
29
OMEGAMON Product Home
Overview and product information for all OMEGAMON products
http://www.ibm.com/OMEGAMON
Service Management Connect
Blogs, forums, articles, best practices videos for IBM z Systems monitoring
http://www.ibm.com/developerworks/servicemanagement/z
IBM Servers and Systems Software RFE Community
Process to raise requests for enhancements to OMEGAMON products
https://www.ibm.com/developerworks/rfe/?BRAND_ID=352

OMEGAMON at InterConnect 2016
30
NZS-3272 : OMEGAMON Family Update: See What’s New in Monitoring
NZS-3645 : Increase Your Business Agility with the Latest Release of OMEGAMON
NZS-4409 : Enterprise Java Monitoring on z/OS: Discover, Alert and Optimize
NZS-1531 : Panel Discussion in IBM Service Management on z Systems
NZS-6326 : z Software Monitoring/Automation Futures
NZS-2879 : z/OS Monitoring and Automation to Enable Predictive Analysis for Critical Applications at BPM
NZS-6763 : The Orange Code of OMEGAMON at ING
NZS-5044 : OMEGAMON on z/VM and Linux at Bank of Brazil

Notices and Disclaimers
31
Copyright © 2016 by International Business Machines Corporation (IBM). No part of this document may be reproduced or transmitted in any form without written permission
from IBM.
U.S. Government Users Restricted Rights - Use, duplication or disclosure restricted by GSA ADP Schedule Contract with IBM.
Information in these presentations (including information relating to products that have not yet been announced by IBM) has been reviewed for accuracy as of the date of
initial publication and could include unintentional technical or typographical errors. IBM shall have no responsibility to update this information. THIS DOCUMENT IS
DISTRIBUTED "AS IS" WITHOUT ANY WARRANTY, EITHER EXPRESS OR IMPLIED. IN NO EVENT SHALL IBM BE LIABLE FOR ANY DAMAGE ARISING FROM THE
USE OF THIS INFORMATION, INCLUDING BUT NOT LIMITED TO, LOSS OF DATA, BUSINESS INTERRUPTION, LOSS OF PROFIT OR LOSS OF OPPORTUNITY.
IBM products and services are warranted according to the terms and conditions of the agreements under which they are provided.
Any statements regarding IBM's future direction, intent or product plans are subject to change or withdrawal without notice.
Performance data contained herein was generally obtained in a controlled, isolated environments. Customer examples are presented as illustrations of how those customers
have used IBM products and the results they may have achieved. Actual performance, cost, savings or other results in other operating environments may vary.
References in this document to IBM products, programs, or services does not imply that IBM intends to make such products, programs or services available in all countries in
which IBM operates or does business.
Workshops, sessions and associated materials may have been prepared by independent session speakers, and do not necessarily reflect the views of IBM. All materials
and discussions are provided for informational purposes only, and are neither intended to, nor shall constitute legal or other guidance or advice to any individual participant or
their specific situation.
It is the customer’s responsibility to insure its own compliance with legal requirements and to obtain advice of competent legal counsel as to the identification and
interpretation of any relevant laws and regulatory requirements that may affect the customer’s business and any actions the customer may need to take to comply with such
laws. IBM does not provide legal advice or represent or warrant that its services or products will ensure that the customer is in compliance with any law

Notices and Disclaimers Con’t.
32
Information concerning non-IBM products was obtained from the suppliers of those products, their published announcements or other publicly available sources. IBM has not
tested those products in connection with this publication and cannot confirm the accuracy of performance, compatibility or any other claims related to non-IBM products.
Questions on the capabilities of non-IBM products should be addressed to the suppliers of those products. IBM does not warrant the quality of any third-party products, or the
ability of any such third-party products to interoperate with IBM’s products. IBM EXPRESSLY DISCLAIMS ALL WARRANTIES, EXPRESSED OR IMPLIED, INCLUDING BUT
NOT LIMITED TO, THE IMPLIED WARRANTIES OF MERCHANTABILITY AND FITNESS FOR A PARTICULAR PURPOSE.
The provision of the information contained h erein is not intended to, and does not, grant any right or license under any IBM patents, copyrights, trademarks or other intellectual
property right.
IBM, the IBM logo, ibm.com, Aspera®, Bluemix, Blueworks Live, CICS, Clearcase, Cognos®, DOORS®, Emptoris®, Enterprise Document Management System™, FASP®,
FileNet®, Global Business Services ®, Global Technology Services ®, IBM ExperienceOne™, IBM SmartCloud®, IBM Social Business®, Information on Demand, ILOG,
Maximo®, MQIntegrator®, MQSeries®, Netcool®, OMEGAMON, OpenPower, PureAnalytics™, PureApplication®, pureCluster™, PureCoverage®, PureData®,
PureExperience®, PureFlex®, pureQuery®, pureScale®, PureSystems®, QRadar®, Rational®, Rhapsody®, Smarter Commerce®, SoDA, SPSS, Sterling Commerce®,
StoredIQ, Tealeaf®, Tivoli®, Trusteer®, Unica®, urban{code}®, Watson, WebSphere®, Worklight®, X-Force® and System z® Z/OS, are trademarks of International Business
Machines Corporation, registered in many jurisdictions worldwide. Other product and service names might be trademarks of IBM or other companies. A current list of IBM
trademarks is available on the Web at "Copyright and trademark information" at: www.ibm.com/legal/copytrade.shtml.

Thank YouYour Feedback is Important!
Access the InterConnect 2016 Conference Attendee
Portal to complete your session surveys from your
smartphone,
laptop or conference kiosk.