nyserdaresidential baseline study
TRANSCRIPT

NYSERDA Residential Statewide Baseline Study
Volume 3: HVAC Market Assessment
Final Report
July 2015 Report Number 15-07

NYSERDA’s Promise to New Yorkers: NYSERDA provides resources, expertise, and objective information so New Yorkers can make confident, informed energy decisions.
Mission Statement:Advance innovative energy solutions in ways that improve New York’s economy and environment.
Vision Statement:Serve as a catalyst – advancing energy innovation, technology, and investment; transforming
New York’s economy; and empowering people to choose clean and efficient energy as part
of their everyday lives.

NYSERDA Residential Statewide Baseline Study
Volume 3: HVAC Market Assessment Final Report
Prepared for:
New York State Energy Research and Development Authority
Albany, NY
Carley Murray Associate Project Manager
Jonathon Steiner Assistant Project Manager
Prepared by:
Tetra Tech
Carol Sabo, Pam Rathbun, Mandy Pom, and Lisa Stefanik
GDS Associates
Scott Albert
PSD
Susan Mann
NYSERDA Report 15-07 NYSERDA Contract 27031 July 2015
NYSERDA Residential Statewide Baseline Study Volume 3: HVAC Market Assessment

Notice This report was prepared by Tetra Tech in the course of performing work contracted for and sponsored by
the New York State Energy Research and Development Authority (hereafter “NYSERDA”). The opinions
expressed in this report do not necessarily reflect those of NYSERDA or the State of New York, and
reference to any specific product, service, process, or method does not constitute an implied or expressed
recommendation or endorsement of it. Further, NYSERDA, the State of New York, and the contractor
make no warranties or representations, expressed or implied, as to the fitness for particular purpose or
merchantability of any product, apparatus, or service, or the usefulness, completeness, or accuracy of any
processes, methods, or other information contained, described, disclosed, or referred to in this report.
NYSERDA, the State of New York, and the contractor make no representation that the use of any
product, apparatus, process, method, or other information will not infringe privately owned rights and will
assume no liability for any loss, injury, or damage resulting from, or occurring in connection with, the use
of information contained, described, disclosed, or referred to in this report.
NYSERDA makes every effort to provide accurate information about copyright owners and related
matters in the reports we publish. Contractors are responsible for determining and satisfying copyright or
other use restrictions regarding the content of reports that they write, in compliance with NYSERDA’s
policies and federal law. If you are the copyright owner and believe a NYSERDA report has not properly
attributed your work to you or has used it without permission, please email [email protected].
ii NYSERDA Residential Statewide Baseline Study Volume 3: HVAC Market Assessment

Abstract for Volume 3 This volume presents the findings from the heating, ventilating, and air conditioning (HVAC) Market
Assessment. The HVAC Market Assessment is a key component of the statewide residential baseline
study. The purpose of the HVAC Market Assessment is to identify the baseline conditions for residential
non-electric heating and water heating equipment, central air conditioning, and heat pumps in New York
State. The study focused on units installed in single-family homes with one to four dwelling units,
multifamily buildings, or in townhouse-style configurations where individual units have their own heating
systems. The market characterization describes where the market is now (based on equipment
sold/installed in 2012 and after) and what percent of the equipment currently being sold is high efficiency.
This information will be used to establish more accurate baselines for calculating program energy
savings, to estimate the influence of NYSERDA’s and other New York State program administrators’
activities on the market, and to support program planning in New York State. The market assessment uses
data from a variety of primary and secondary sources that are specific to the New York State residential
space heating and cooling, and water heating markets. A primary source of data is 47 telephone surveys
of HVAC contractors to collect data on 2013 sales of HVAC equipment by efficiency levels. The data
was confirmed, whenever possible, by comparisons to D&R International (D&R) which reported New
York State-specific Heating, Air-conditioning and Refrigeration Distributors International (HARDI) sales
data for 2013. In addition, Tetra Tech made comparisons to data on HVAC equipment installed in the past
two years from on-site inspections of 179 new construction homes. Data were also included from the on-
site inspections of the existing homes that had installed new HVAC equipment in the past two years that
included 57 heating systems, 62 cooling systems, and 78 water heaters. Other sources of estimated annual
sales data included U.S. Census data for New York State and over 3,000 telephone or Web surveys
completed for the residential baseline study with statewide data on type of systems and primary fuels. The
results of the residential baseline study are presented in five volumes of reports. HVAV Market
Assessment is the third volume of the five.
Keywords Energy efficiency, single-family homes, market characterization, market assessment, heating and cooling
equipment
iii NYSERDA Residential Statewide Baseline Study Volume 3: HVAC Market Assessment

Acknowledgements The Tetra Tech evaluation team thanks Carley Murray, Jonathon Steiner, and Jennifer Meissner of
NYSERDA for the leadership, guidance, critical review, and assistance they provided throughout the
HVAC Market Assessment component of the residential baseline study. The team would also like to
thank the Performance Systems Development (PSD) team (led by Susan Mann) for the development,
oversight, and implementation of the robust on-site data collection at single-family homes throughout
New York State that included HVAC data used in the HVAC Market Assessment. Finally, this
collaborative effort involved many parties providing advice and review throughout the process, including
Bill Saxonis from the New York State Department of Public Service, E2 Working Group, NYSERDA
program staff, and evaluation consultants.
iv NYSERDA Residential Statewide Baseline Study Volume 3: HVAC Market Assessment

Table of Contents Notice ........................................................................................................................................ ii
Abstract for Volume 3 ..............................................................................................................iii
Keywords ..................................................................................................................................iii
Acknowledgements .................................................................................................................iv
List of Figures ..........................................................................................................................vi
List of Tables ...........................................................................................................................vii
1 Introduction ....................................................................................................................... 1
1.1 Background and Study Objectives ................................................................................................ 1 1.2 Methodology .................................................................................................................................. 3 1.3 New York State Statistics .............................................................................................................. 6 1.4 Summary of Key Findings ............................................................................................................. 7
1.4.1 Natural Gas and Oil Furnaces and Boilers ........................................................................... 8 1.4.2 Central Air Conditioners and Heat Pumps ............................................................................ 9 1.4.3 Water Heating ..................................................................................................................... 10
2 Key Findings ....................................................................................................................11
2.1 HVAC Market Profiles ................................................................................................................. 11 2.2 Residential Natural Gas and Oil-Fired Furnaces and Boilers ..................................................... 13
2.2.1 Sales and Efficiency Data ................................................................................................... 13 2.2.2 Efficiency Levels (Tiers) Recommended by Contractors .................................................... 19 2.2.3 Stocking Practices ............................................................................................................... 20 2.2.4 Oil to Natural Gas Conversions, Annual Servicing, and Efficiency Trends......................... 21
2.3 Residential Central Air Conditioners and Heat Pumps ............................................................... 23 2.3.1 Sales and Efficiency Data ................................................................................................... 23 2.3.2 Efficiency Levels (Tiers) Recommended by Contractors .................................................... 28 2.3.3 Stocking Practices for Central Cooling Equipment ............................................................. 30 2.3.4 Early Retirement, Annual Service Rate, and Other Efficiency Trends ................................ 30
2.4 Residential Water Heaters .......................................................................................................... 31 2.4.1 Sales and Efficiency Data ................................................................................................... 31 2.4.2 Efficiency Levels (Tiers) Recommended by Contractors .................................................... 37 2.4.3 Stocking Practices ............................................................................................................... 38 2.4.4 Oil to Natural Gas Conversions and Efficiency Trends ....................................................... 38
2.5 Quality Design, Installation, and Maintenance ............................................................................ 39 2.5.1 Training and Certification .................................................................................................... 39
v NYSERDA Residential Statewide Baseline Study Volume 3: HVAC Market Assessment

2.5.2 Installation and Servicing Practices .................................................................................... 42 2.6 Impacts of Efficiency Programs and Standards .......................................................................... 43
2.6.1 Familiarity and Use of Energy Efficiency Programs in New York State .............................. 43 2.6.2 Standards and Other Factors Influencing High Efficiency Equipment Sales ...................... 44
Appendix A: Detailed Methodology ..................................................................................... A-1
Appendix B: HVAC Contractors Instrument........................................................................ B-1
Appendix C. Letter to HVAC Contractors ............................................................................ C-1
List of Figures Figure 1. New York State Climate Zone Map ............................................................................. 3 Figure 2. Type of New Heating Equipment (2012 and after) in Existing Homes.........................14 Figure 3. Type of Heating Equipment in New Homes (Built 2012 or later) .................................15 Figure 4. Which Efficiency Levels (Tiers) Do HVAC Contractors Typically Recommend to
Customers for Furnaces ................................................................................................19 Figure 5. Which Efficiency Levels (Tiers) Do HVAC Contractors Typically Recommend to
Customers for Boilers ....................................................................................................20 Figure 6. Type of Cooling Equipment in New Homes (Built 2012 or after) .................................24 Figure 7. Type of New Cooling Equipment (2012 and After) in Existing Homes ........................24 Figure 8. Efficiency Levels (Tiers) that HVAC Contractors Typically Recommend to
Customers for Central Air Conditioners .........................................................................29 Figure 9. Efficiency Levels (Tiers) that HVAC Contractors Typically Recommend to
Customers for Heat Pumps ...........................................................................................29 Figure 10. Type of Water Heaters in New Homes (Built 2012 and Later) ..................................32 Figure 11. Water Heater Fuel in New Homes (Built 2012 and Later) .........................................32 Figure 12. Type of New Water Heaters (2012 and Later) in Existing Homes .............................33 Figure 13. Fuel for New Water Heaters (2012 and Later) in Existing Homes .............................33 Figure 14. Efficiency Levels (Tiers) of Residential Water Heaters HVAC Contractors
Typically Recommend to Customers .............................................................................37
vi NYSERDA Residential Statewide Baseline Study Volume 3: HVAC Market Assessment

List of Tables Table 1. New York State Climate Zone by County ..................................................................... 4 Table 2. NYS Data Collection Activities for Task 7 HVAC Market Assessment .......................... 5 Table 3. 2013 Market Size Estimates for Heating and Cooling Equipment in New York State .... 6 Table 4. Population of HVAC Contractors in New York State ....................................................12 Table 5. HVAC Contractor Survey Respondent Business Profile ..............................................13 Table 6. Residential Natural Gas Furnaces (<225,000 Btu/h) Units Sold in 2013 ......................16 Table 7. Residential Oil-Fired Furnaces (<225,000 Btu/h) Units Sold in 2013 ...........................17 Table 8. Residential Natural Gas Boilers (<300,000 Btu/h) Units Sold in 2013 ..........................18 Table 9. Residential Oil-Fired Boilers (<225,000 Btu/h) Units Sold in 2013 ...............................18 Table 10. Number of Contractors Mentioning Each Stocking Practice for Natural Gas
and Oil-Fired Furnaces ..................................................................................................21 Table 11. Oil to Natural Gas Conversions .................................................................................21 Table 12. Wi-Fi Communicating Thermostats and Boiler Reset Controls Sales and Installs ......22 Table 13. Residential Central Air Conditioner Units—Split Systems Sold in 2013 .....................25 Table 14. Residential Central Air Conditioner Units—Packaged Sold in 2013 ...........................26 Table 15. Residential Heat Pumps Units—Split Systems Sold in 2013 .....................................27 Table 16. Residential Heat Pump Units—Packaged Sold in 2013 .............................................27 Table 17. Residential Ductless Mini-Split Heat Pumps Sold in 2013 .........................................28 Table 18. Number Mentioning Each Stocking Practice for Central Air Conditioners ..................30 Table 19. Number Mentioning Each Stocking Practice for Heat Pumps ....................................30 Table 20. Amended Energy Conservation Standards for Residential Water Heaters ................34 Table 21. Residential Natural Gas Storage Water Heaters Sold in 2013 ...................................35 Table 22. Residential Oil Storage Water Heaters Sold in 2013 .................................................35 Table 23. Residential Natural Gas Water Heaters Tankless Sold in 2013 .................................36 Table 24. Residential Natural Gas Water Heaters-Condensing Sold in 2013 ............................37 Table 25. Number of HVAC Contractors Mentioning Each Stocking Practice for
Residential Water Heaters .............................................................................................38 Table 26. Recent Trends in Water Heater Sales .......................................................................38 Table 27. Primary Sources Used as References to Ensure Quality Installations .......................39 Table 28. Types of Training Required and Organization ...........................................................40 Table 29. Types of Certification Required and Organization......................................................41 Table 30. Rating of Proficiency in Quality Design Elements by HVAC Contractors ...................41 Table 31. Rating of Frequency of Performing Various Tests During Installation/Servicing
of Equipment .................................................................................................................42 Table 32. Familiarity with Energy Efficiency Programs in New York State .................................43 Table 33. HVAC Contractors That Expect the Portion of Energy Efficient Equipment to
Increase ........................................................................................................................44 Table 34. Reasons Given Most Often for Greater Portion of Energy Efficiency Sales
in the Future ..................................................................................................................45
vii NYSERDA Residential Statewide Baseline Study Volume 3: HVAC Market Assessment
1 Introduction
1.1 Background and Study Objectives
In 2011 through 2014, NYSERDA, in collaboration with the E2 Working Group1 Statewide Study
Subcommittee led by the New York State Department of Public Service (DPS), conducted a residential
statewide baseline study. The NYSERDA evaluation group, in coordination with the lead contractor of
this study, Tetra Tech MA, Inc. (Tetra Tech), and its subcontractors, Performance Systems Development
(PSD), and GDS Associates, Inc. (GDS), developed and implemented a detailed work plan to complete
this study.
The study included single-family and multifamily residential housing segments and a broad range of
energy uses and efficiency measures. The overall objective of the study was to understand the residential
building stock and associated energy use, including the saturations of energy-consuming equipment
(electric, natural gas, and other fuels) and the penetrations of energy efficient equipment, building
characteristics, and energy management practices. The study also collected customer household and
demographic information that can be correlated with energy usage features.
The heating, ventilating, and air conditioning (HVAC) Market Assessment is a key component of the
statewide residential baseline study. The purpose of the HVAC Market Assessment is to identify the
baseline conditions for residential non-electric heating and water heating equipment, central air
conditioning, and heat pumps in New York State. The market assessment describes where the market is
now (based on equipment sold or installed in 2012 and after) and what percent of the equipment currently
being sold is high efficiency. This information will be used to establish more accurate baselines for
calculating program energy savings, to estimate the influence of NYSERDA’s and other New York State
program administrators’ activities on the market, and to support program planning in New York State.
Data to support the market assessment were collected in single-family home surveys and on-site
inspections, contractor interviews, and distributor sales reports. The compilation of sources was used to
determine the baseline efficiency of specific types of residential heating and cooling equipment installed
in New York. Market channels and specification practices for these technologies were also characterized.
1 Prior to the creation of the E2 Working Group, the former Evaluation Advisory Group held a similar role on this study.
1 NYSERDA Residential Statewide Baseline Study Volume 3: HVAC Market Assessment

This investigation looks at the market differences throughout the State for major heating, water heating,
and central air conditioning systems. Data and discussion are provided wherever the sample sizes are not
sufficiently large to consider that data representative of the strata.
The study focused on units installed in single-family homes and multifamily buildings that include one to
four dwelling units, or in townhouse-type configurations where individual units have their own heating
systems. Multifamily units with five or more units typically have central systems served by the
commercial programs, and were not part of this assessment. According to the property manager/owner
survey responses, almost three-fourths (73 percent) of multifamily buildings with five or more units have
central heating systems.
The information gleaned from this study will be used by NYSERDA, the DPS, New York program
administrators, and other stakeholders to set more accurate baselines for evaluation purposes and help
inform program planning.
The project has three main components:
• Residential Baseline Study. The evaluation team conducted a comprehensive statewide baseline study of the residential market across a broad range of customer segments and energy measures, including (1) new and existing single-family buildings (one to four units), and (2) new and existing multifamily buildings (five units or more), including dwelling units, common areas, and whole buildings. Data were first collected through a combination of Web and telephone surveys. On-site inspections and data collection was then completed for a sample of the Web and telephone survey respondents along with residential contact sample lists from other sources as described in the methodology volume.
• HVAC Market Assessment. Data were collected in baseline study surveys and on-site inspections, contractor interviews, and distributor sales reports to assess the market for non-electric heating, air conditioning, and water heating equipment. Data on the baseline efficiency of new equipment installed in New York State were gathered during HVAC contactor interviews and from D&R International (D&R) which reported New York State-specific Heating, Air-conditioning and Refrigeration Distributors International (HARDI) sales data for 2013. This information will be used to set more accurate baselines for calculating program energy savings.
• Residential Potential Study. The data for the baseline analysis and the HVAC market assessment were then used for the potential analysis. The analysis identified the technical, economical, and achievable residential energy efficiency opportunities in New York over the next three and five years (2016 and 2018, respectively) relative to base year 2013.
2 NYSERDA Residential Statewide Baseline Study Volume 3: HVAC Market Assessment
This Volume 3 provides the highlights of the HVAC market assessment. Other volumes describe the
residential baseline study for the single-family home segment (Volume 1), multifamily baseline results
(Volume 2), potential analysis (Volume 4), and Volume 5 is the methodology and data tables.
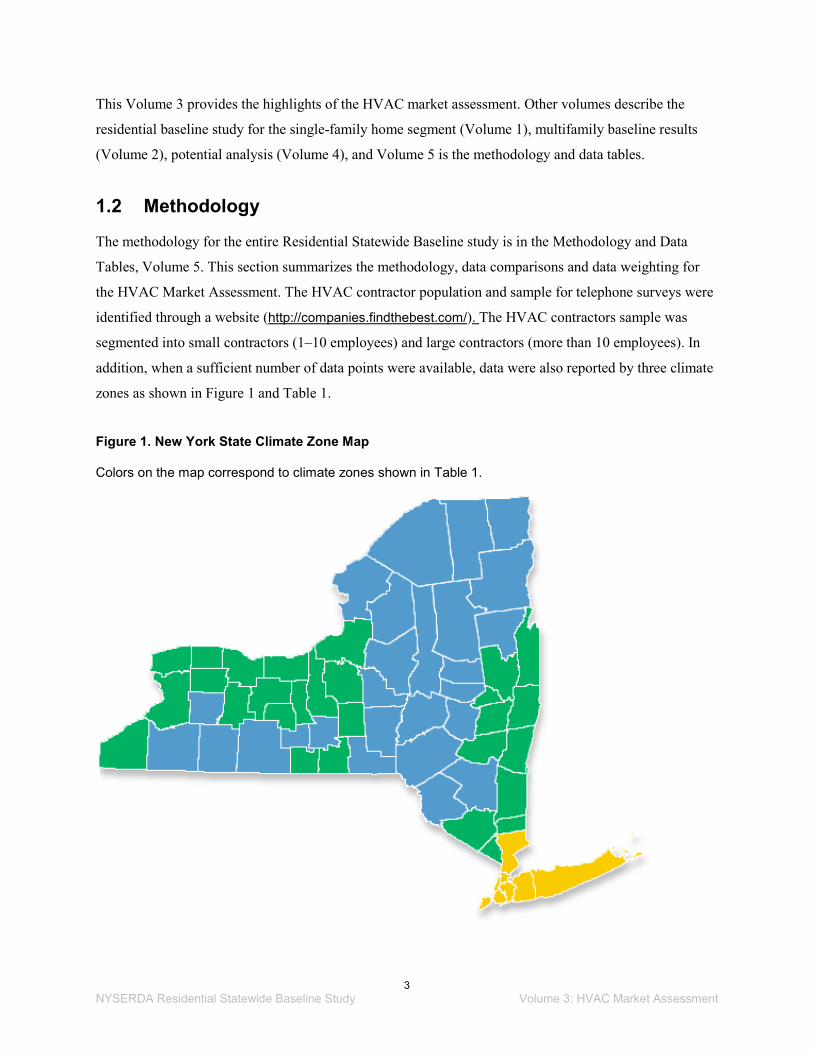
1.2 Methodology
The methodology for the entire Residential Statewide Baseline study is in the Methodology and Data
Tables, Volume 5. This section summarizes the methodology, data comparisons and data weighting for
the HVAC Market Assessment. The HVAC contractor population and sample for telephone surveys were
identified through a website (http://companies.findthebest.com/). The HVAC contractors sample was
segmented into small contractors (1–10 employees) and large contractors (more than 10 employees). In
addition, when a sufficient number of data points were available, data were also reported by three climate
zones as shown in Figure 1 and Table 1.
Figure 1. New York State Climate Zone Map
Colors on the map correspond to climate zones shown in Table 1.
3 NYSERDA Residential Statewide Baseline Study Volume 3: HVAC Market Assessment

Table 1. New York State Climate Zone by County
Source: http://energycode.pnl.gov/EnergyCodeReqs/?state=New%20York)
Data collection focused on surveying the general population of HVAC contractors doing business in
New York State. Due to lower than expected response rates, 47 telephone surveys of the targeted number
of 60 surveys were completed with HVAC contractors throughout New York State. One distributor
appeared in the HVAC contractor sample list and was interviewed, but this case was excluded from the
HVAC contractor responses.
In addition, to ensure a 90/10 confidence/precision statewide, other primary data collected for this study
was included in the analysis. In particular, this market assessment used the data collected during the on-
site inspection in new and existing homes for the baseline study. The on-site inspection data included
information on types of heating and cooling systems, primary fuels, equipment age, efficiency levels, and
frequency of servicing. As a result, the evaluation team was able to triangulate the data from self-reports
of HVAC contractors on-site observations of the equipment types included in the HVAC market
assessment.
Climate Zone 4
Bronx Nassau Queens Suffolk
Kings New York Richmond Westchester Climate Zone 5
Albany Erie Ontario Saratoga
Cayuga Genesee Orange Schenectady
Chautauqua Greene Orleans Seneca
Chemung Livingston Oswego Tioga
Columbia Monroe Putnam Washington
Cortland Niagara Rensselaer Wayne
Dutchess Onondaga Rockland Yates Climate Zone 6
Allegany Franklin Montgomery Sullivan
Broome Fulton Oneida Tompkins
Cattaraugus Hamilton Otsego Ulster
Chenango Herkimer Schoharie Warren
Clinton Jefferson Schuyler Wyoming
Delaware Lewis St. Lawrence
Essex Madison Steuben
4 NYSERDA Residential Statewide Baseline Study Volume 3: HVAC Market Assessment

On-site inspection data collection was completed with 179 new homes (built 2012 and after) and
521 existing homes (built before 2012). Data from the 521 on-site inspections of existing homes included
57 heating systems, 62 cooling systems, and 78 water heaters that had been installed in the past two years
for this analysis of new equipment. Together, these sources yield an excellent data on HVAC equipment
installed in the past two years in New York State. The sales of equipment by efficiency level for heating
and cooling equipment reported for 2013 in the HVAC Contractor Surveys were also compared to New
York State HARDI data provided to NYSERDA by D&R International.
Table 2 summarizes the primary and secondary data sources with relevant information specific to New
York State (NYS) used for the HVAC market assessment.
Table 2. NYS Data Collection Activities for Task 7 HVAC Market Assessment2
Source Data Format Types of Data for Heating, Cooling,
and Water Heating Equipment
Number of Completes/
Sample Points
HVAC Market Assessment Task 7: Contractors from the General Population
Telephone Surveys
Sales data by efficiency type, stocking practices, quality design, quality installation & maintenance practices, training/certification
(463) 35 with sales data plus 12 without sales data
Baseline Study Task 6A: Residential Home On-site Inspections
On-site Inspection Data Collection
Age and type of equipment, efficiency, servicing
521 Existing (57-78 new HVAC equipment) & 179 New Construction
D&R Heating, Air-conditioning and Refrigeration Distributors International (HARDI)
2013 Sales Data Collection
Market size estimates, efficiency and product characteristics (does not include water heating)
31% of HARDI Members in NYS
2 Tetra Tech also reviewed the results of the New York Statewide Residential Gas High-Efficiency Heating Equipment Programs Evaluation of 2009-2011 Programs report dated August 5, 2014. The study included surveys of HVAC distributors and participating contractors. The distributors surveyed did not provide annual sales data. Given the difference in timeframe and sample group of contractors (participants instead of general population), the results could not be directly compared.
3 This count of completes excludes the self-identified distributor interviewed as part of our data collection effort. The distributor is excluded from the analysis for the report remainder.
5 NYSERDA Residential Statewide Baseline Study Volume 3: HVAC Market Assessment

1.3 New York State Statistics
The 2013 annual market size estimates were based on a stock-replacement model, developed by D&R
International (D&R) using existing HVAC equipment stock data from the Energy Information
Administration’s 2009 Residential Energy Consumption Survey. D&R estimated 2013 equipment sales
by dividing the total stock by an average lifetime of the equipment to determine the number of probable
replacements in a given year. HVAC equipment in new housing was estimated from U.S. Census data and
added to annual sales. D&R also developed a heat pump adjustment factor to account for heat pumps
replacing some air conditioners, particularly in the cooling dominated regions. Table 3 includes the D&R
equipment sales estimates for New York State in 2013.
Table 3. 2013 Market Size Estimates for Heating and Cooling Equipment in New York State
Source: D&R International Sales Data Estimates for NYSERDA
Market Size Estimates
Estimated 2013 Central AC Sales in NYS 96,760 Estimated 2013 Central Heat Pump Sales in NYS 22,960 Estimated 2013 Furnace Sales in NYS 104,960
Natural Gas 95,940
Fuel Oil 9,020
Estimated 2013 Boiler Sales in NYS 100,860
Natural Gas 59,860
Fuel Oil 41,000
To confirm the estimates provided by D&R, Tetra Tech used a combination of U.S. Census, Residential
Statewide Baseline Study telephone and Web survey and on-site inspection data, and equipment life to
develop annual sales estimates for the 2013 timeframe, as follows:
• Natural gas and oil furnaces and boilers annual sales: total annual new equipment installs and replacements were estimated by the evaluation team using 2009 Residential Energy Consumption Survey New York State statistics (RECS),4 and survey and on-site inspection data for the Residential Baseline Study. The evaluation team estimates were within 7 percent of the sales reported by D&R with 221,000 and 206,000, respectively.
4 The U. S. Energy Information Administration (EIA) administers the Residential Energy Consumption Survey (RECS) to a nationally representative sample of housing units. Specially trained interviewers collect energy characteristics on the housing unit, usage patterns, and household demographics.
6 NYSERDA Residential Statewide Baseline Study Volume 3: HVAC Market Assessment

• Central air conditioner annual sales: The 2009 Residential Energy Consumption Survey5 (RECS) data for New York State indicated that the number of central air conditioners (including heat pumps) less than two years old was about 200,000 or about 100,000 were less than a year old. This result compares to 119,720 units for annual sales estimated by D&R. The telephone and Web survey responses indicated that 12.6 percent of the central air conditioners and heat pumps in single-family homes were less than two years old. This percentage compares closely to 13.3 percent in the 2009 RECS data for central air conditioning in New York State homes.
• Water heater annual sales: The 2009 RECS data for New York State estimated that 900,000 main water heaters (about 12.7 percent) in all New York State residential homes (single-family and multifamily dwelling units) are less than two years old, or about 450,000 water heaters were less than a year old. The Single-Family Survey responses show that 13.7 percent of all primary water heaters are less than two years old, which compares closely to the 2009 RECS data.
Despite differences in the timeframe for the RECS data, those results along with the surveys and the on-
site inspection data for the residential baseline study generally confirm that the D&R annual HARDI sales
estimates for 2013 are reasonable.
1.4 Summary of Key Findings
The small contractor group is the largest opportunity for influencing the market for high efficiency
HVAC equipment. The vast majority of HVAC contractors who supply heating, cooling, and water
heating equipment to residential customers in New York State are small contractors (1 to 10 employees).
These small contractors represent about 90 percent of the businesses that install HVAC equipment in the
State. On average, a large contractor (with more than 10 employees) will install about four times as many
heating systems annually as a small contractor. At the same time, due to the large number of small
contractors, the small contractor group still account for an estimated two-thirds of the total annual sales of
heating systems in New York State.
Among the large contractors, over 90 percent, or twice as many as the small contractors, said they receive
some training. Small contractors reported in the HVAC Market Assessment Survey that they are less
likely to attend training and become certified in equipment installation practices. It is important to reach
these small contractors in order to transform the market for more efficient HVAC equipment.
5 http://www.eia.gov/consumption/residential/data/2009/
7 NYSERDA Residential Statewide Baseline Study Volume 3: HVAC Market Assessment
Both large and small contractors feel that they are very proficient in all key quality design and installation
practices including proper sizing. At the same time, HVAC Contractor Survey responses indicate both
large and small contractors can improve on the amount of testing done to ensure heating and cooling
systems are operating most efficiently at time of installation and servicing. Small contractors were less
likely to perform tests that include building ventilation calculations, duct leakage tests, and duct
pressurization tests. Large contractors were also less likely to conduct duct leakage and duct
pressurization tests, and measure water flows.
General awareness of federal standards for energy efficiency equipment was low among surveyed HVAC
contractors. Most of the large and small contractors said they were NOT aware of new federal standards
that may affect the manufacturing of energy efficient non-electric heating and water heating equipment.
1.4.1 Natural Gas and Oil Furnaces and Boilers
The types of non-electric heating equipment being installed vary for new construction and new equipment
(likely replacements) in existing homes. Ducted furnaces are more prevalent in new construction while
new equipment installed in older homes is more often boilers than furnaces. Over half of the new ducted
furnaces installed are high efficiency at Tier 3: 94% AFUE (Annual Fuel Utilization Efficiency) and
above, based on secondary and primary sources of New York State data used for this assessment. At the
same time, natural gas boilers are less likely to be high efficiency. Small contractors reported that half of
their installations of natural gas boilers were less than Tier 1: 85–89% AFUE efficiency.
Large contractors also reported on average that about one out of five natural gas furnaces were
conversions from oil-fired furnaces. About one-quarter of the contractors reported they are now observing
an increase in the number of furnaces and boilers being replaced early. Although the estimates for the
percentage of increase had a very wide range, a little over half reported increases in the 5 to 25 percent
range for both furnaces and boilers.
New technologies to control heating and cooling are showing a significant market share. At the same
time, a few contractors reported potential market barriers for two new technologies that should be
researched by program administrators if included in their programs. Two or more contractors reported
reducing sales of Wi-Fi communicating thermostats due to considerable training needs for customers on
their operation. At least one contractor noted during the survey that all new boilers come with reset
8 NYSERDA Residential Statewide Baseline Study Volume 3: HVAC Market Assessment

controls. If the existing unit does not have reset controls, the contractor explained that it is safer to simply
replace the entire boiler unit. At least one contractor raised issues that adding the controls to old systems
could void the warranty while new systems typically included these controls with the equipment. Boiler
reset controls should be reviewed by program administrators for future programs.
Promotion and education to increase the number of annual tune-ups could also provide additional energy
savings. Based on the single-family on-site inspections, about 58 percent of homes that had furnaces and
boilers indicated during the on-site inspection that the equipment had been serviced in 2013 and 2014.
Homes with steam or water boilers were more likely (65%) than those with a furnace (50%) to have had
their equipment serviced in 2013 or 2014.
1.4.2 Central Air Conditioners and Heat Pumps
Central air conditioning is the most prevalent primary cooling system type in new construction homes
representing about 75 percent of the cooling equipment types. For existing homes with new air
conditioning equipment, central air conditioning represents about one-third (32 percent) of the units, and
room air conditioning is close at 28 percent of the new cooling equipment installed in the past two years.
Existing homes replacing or installing new systems are typically limited by availability of ductwork in the
home, which may account for the greater number of mini-split systems present. Mini-split systems
represent 12 percent of new cooling systems in existing homes versus less than one percent of new
construction cooling equipment.
There appears to be considerable energy efficiency potential in the central air conditioning market. Data
from multiple sources consistently reported that more than 80 percent of the central air conditioning
systems statewide were not high efficiency (less than 14.5 SEER [Seasonal Energy Efficiency Rating6]),
which did not meet Tier 1 efficiency. Less than 15 percent of the recent equipment sales is very high
efficiency Tier 3 (16 SEER and above). In addition, only two of the HVAC contractors surveyed felt that
there was an increase in the early retirement of systems, thus there are opportunities for savings from
programs that promote early retirement with efficient equipment.
6 Seasonal Energy Efficiency Rating (SEER) is the measure of equipment energy efficiency over the cooling season. It represents the total cooling of a central air conditioner or heat pump (in Btu) during the normal cooling season as compared to the total electric energy input (in watt-hours) consumed during the same period.
Energy Efficiency Rating (EER) is the Air-Conditioning and Refrigeration Institute standardized rating, which reports central air conditioning efficiency at 80 degrees F indoors and 95 degrees F outdoors. This rating measures steady-state efficiency -- that is, the efficiency of the air conditioner once it is up and running
9 NYSERDA Residential Statewide Baseline Study Volume 3: HVAC Market Assessment

Similar to heating equipment, there is an opportunity to achieve additional energy savings through the
promotion and education about annual tune-ups of cooling systems. Based on the single-family on-site
inspections, about 40 percent of homes with central air conditioners indicated during the on-site
inspection that the equipment had been serviced in 2013 or 2014. This number compares to 71 percent of
homes with an air source or ground source heat pump.
1.4.3 Water Heating
Storage type water heaters dominate the market with natural gas being the most prevalent fuel choice
followed by electricity and propane. Natural gas water heaters are also picking up market share from
oil-fired water heaters. Large contractors, in particular, indicated an average of nearly 20 percent of
natural gas water heaters sold in the past 12 months were oil-to-natural gas conversions. Small contractors
estimated a smaller (11 percent) oil-to-natural gas conversion sales rate in the past 12 months on average.
Only a small percent (2 percent or less) of new water heaters are heat pump water heaters.
New federal standards for water heaters take effect on April 16, 2015. The data reported by HVAC
contractors surveyed for this analysis indicates that the majority of tankless water heater units sold and/or
installed in 2013 appear to already meet the new federal standards. Similarly, the HVAC contractors
report efficiency levels for 2013 sales of natural gas storage water heaters that meet the new 2015 federal
standard although the on-site inspection data collection for units sold 2012 and after do not confirm those
results.
10 NYSERDA Residential Statewide Baseline Study Volume 3: HVAC Market Assessment

2 Key Findings
2.1 HVAC Market Profiles
The HVAC contractor population and sample for telephone surveys were identified through a website
(http://companies.findthebest.com/). Using the findthebest database, the evaluation team was able to identify
more than 18,000 contractors that meet the target group profile7 for the HVAC market assessment. In
addition, the database includes, and could be sorted by, the number of employees and annual sales
volume. Tetra Tech reviewed other HVAC contractor list sources, but a number of these other sources
were not comprehensive. For example, some sources limited their lists to HVAC businesses with North
American Technician Excellence (NATE) certification. The www.yellowpages.com was also fairly
comprehensive, but did not include data to indicate company size.
The sample of HVAC contractors surveyed was compared to the totals from the population source as
shown in Table 4 for New York State. Slightly more than 90 percent of the HVAC contractors listed in
the database are considered small businesses with one to 10 employees. There were 18 large contractors
and 28 small contractors who completed telephone surveys. If all 18 large contractors answered a
question, the confidence and precision would be 90/20, and for 28 small contractors the confidence and
precision would be 90/16.
Although http://companies.findthebest.com/ was an excellent source for the statewide group of HVAC
contractors, the company size (by number of employees) was not always accurate in the database. In
climate zone 5, for example, the interviewers had a difficult time in finding a sufficient number of HVAC
contractors considered small contractors (0-10 employees) to agree to a telephone survey although the
database showed many more small contractors than large contractors. As a result, once a contractor was
on the telephone, the interviewer completed the telephone survey even if they were identified in the
database as a small contractor but were determined during the telephone survey to be a large contractor
(with 10 or more employees). The interviewers found close to 20 percent of the contractors were not
correctly listed by number of employees, which also made it impossible to accurately weight the small
7 The target group included HVAC Contractors who sell, install, or service air conditioners, heat pumps, furnaces, boilers, or water heaters for single-family residential customers in the state of New York. The source was http://companies.findthebest.com/ and the location was set as New York State and the companies were filtered by flagging Specialty Trade Contractors > Building Equipment Contractors > Plumbing, Heating, and Air-Conditioning Contractors in the Construction category.
11 NYSERDA Residential Statewide Baseline Study Volume 3: HVAC Market Assessment
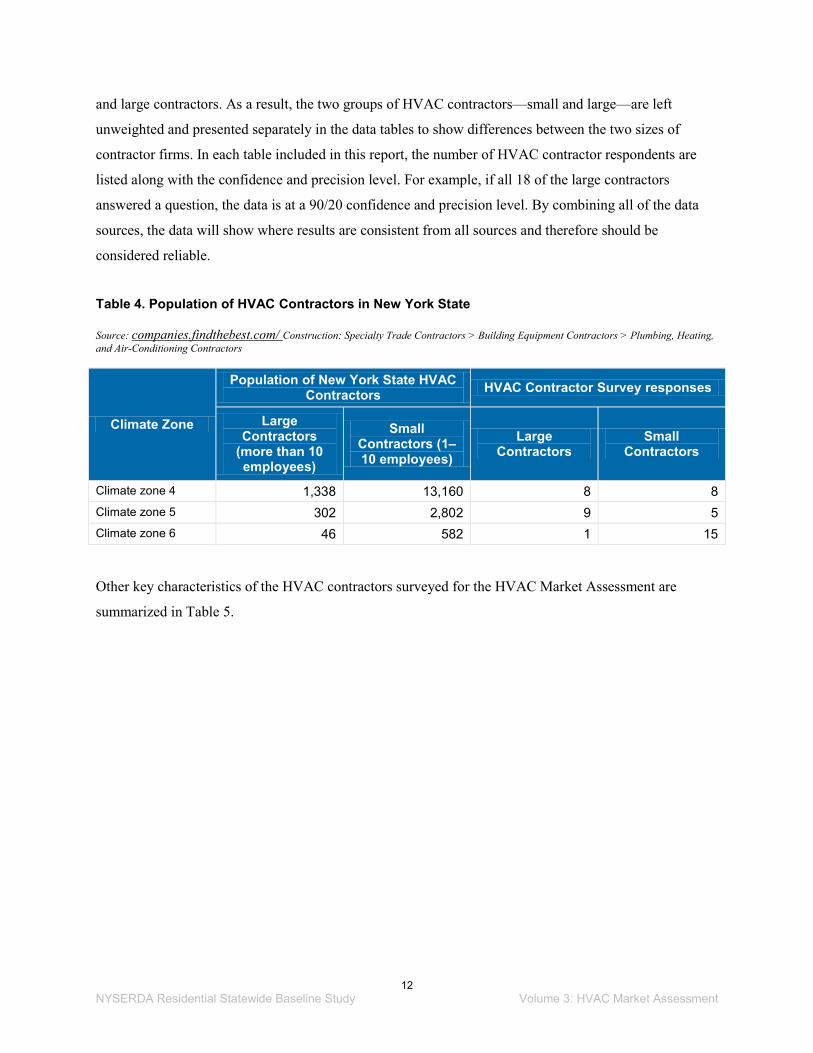
and large contractors. As a result, the two groups of HVAC contractors—small and large—are left
unweighted and presented separately in the data tables to show differences between the two sizes of
contractor firms. In each table included in this report, the number of HVAC contractor respondents are
listed along with the confidence and precision level. For example, if all 18 of the large contractors
answered a question, the data is at a 90/20 confidence and precision level. By combining all of the data
sources, the data will show where results are consistent from all sources and therefore should be
considered reliable.
Table 4. Population of HVAC Contractors in New York State
Source: companies.findthebest.com/ Construction: Specialty Trade Contractors > Building Equipment Contractors > Plumbing, Heating, and Air-Conditioning Contractors
Climate Zone
Population of New York State HVAC Contractors HVAC Contractor Survey responses
Large Contractors
(more than 10 employees)
Small Contractors (1–10 employees)
Large Contractors
Small Contractors
Climate zone 4 1,338 13,160 8 8 Climate zone 5 302 2,802 9 5 Climate zone 6 46 582 1 15
Other key characteristics of the HVAC contractors surveyed for the HVAC Market Assessment are
summarized in Table 5.
12 NYSERDA Residential Statewide Baseline Study Volume 3: HVAC Market Assessment
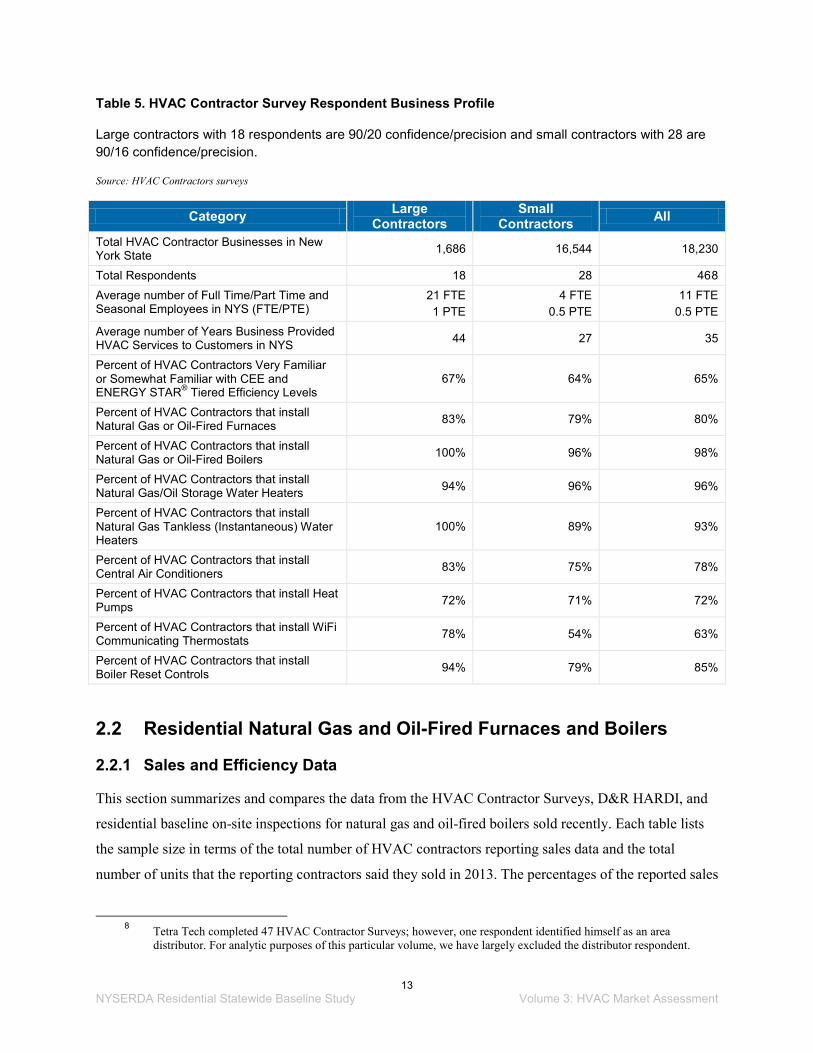
Table 5. HVAC Contractor Survey Respondent Business Profile
Large contractors with 18 respondents are 90/20 confidence/precision and small contractors with 28 are 90/16 confidence/precision.
Source: HVAC Contractors surveys
Category Large Contractors
Small Contractors All
Total HVAC Contractor Businesses in New York State 1,686 16,544 18,230
Total Respondents 18 28 468 Average number of Full Time/Part Time and Seasonal Employees in NYS (FTE/PTE)
21 FTE 1 PTE
4 FTE 0.5 PTE
11 FTE 0.5 PTE
Average number of Years Business Provided HVAC Services to Customers in NYS 44 27 35
Percent of HVAC Contractors Very Familiar or Somewhat Familiar with CEE and ENERGY STAR® Tiered Efficiency Levels
67% 64% 65%
Percent of HVAC Contractors that install Natural Gas or Oil-Fired Furnaces 83% 79% 80%
Percent of HVAC Contractors that install Natural Gas or Oil-Fired Boilers 100% 96% 98%
Percent of HVAC Contractors that install Natural Gas/Oil Storage Water Heaters 94% 96% 96%
Percent of HVAC Contractors that install Natural Gas Tankless (Instantaneous) Water Heaters
100% 89% 93%
Percent of HVAC Contractors that install Central Air Conditioners 83% 75% 78%
Percent of HVAC Contractors that install Heat Pumps 72% 71% 72%
Percent of HVAC Contractors that install WiFi Communicating Thermostats 78% 54% 63%
Percent of HVAC Contractors that install Boiler Reset Controls 94% 79% 85%
2.2 Residential Natural Gas and Oil-Fired Furnaces and Boilers
2.2.1 Sales and Efficiency Data
This section summarizes and compares the data from the HVAC Contractor Surveys, D&R HARDI, and
residential baseline on-site inspections for natural gas and oil-fired boilers sold recently. Each table lists
the sample size in terms of the total number of HVAC contractors reporting sales data and the total
number of units that the reporting contractors said they sold in 2013. The percentages of the reported sales
8 Tetra Tech completed 47 HVAC Contractor Surveys; however, one respondent identified himself as an area distributor. For analytic purposes of this particular volume, we have largely excluded the distributor respondent.
13 NYSERDA Residential Statewide Baseline Study Volume 3: HVAC Market Assessment

by efficiency levels (or tiers) are provided for each group of responding contractors—large and small. For
comparison purposes, where available, the D&R HARDI data is provided for this equipment showing
estimated total sales in New York State for 2013 and the percentages by efficiency levels that were
reported by the sample of HARDI data distributors for New York State. The results from on-site
inspections are also reported where there are a sufficient number of sample points for that heating
equipment type.
Based on the on-site inspection data collection in 658 new and existing single-family homes,
approximately 12.2 percent of primary heating equipment systems were installed in 2012 or later. This
number suggests that about 6.1 percent of the primary heating equipment is replaced each year. The type
of heating systems installed, based on the on-site inspection data, is primarily ducted furnaces and water
boilers (about 70 percent). For those two types of most common primary heating systems, new
construction is more likely to have furnaces that require ductwork (about 55 percent of heating
equipment) compared to existing homes with new heating systems (about 37 percent) (Figure 2 and
Figure 3).
Figure 2. Type of New Heating Equipment (2012 and after) in Existing Homes
Source: Single-family On-site Inspections Homes Built Before 2012
0%
10%
20%
30%
40%
50%
60%
70%
80%
90%
100%
Climate Zone 4 (n=14)
Climate Zone 5 (n=20)
Climate Zone 6 (n=23)
Total NYS (n=57)
Wood Stove
Other
Electric Baseboard
Ground Source Heat Pump
Boiler, Steam
Boiler, Water
Ducted Furnace
14 NYSERDA Residential Statewide Baseline Study Volume 3: HVAC Market Assessment

There are some very distinct differences by climate zone for heating equipment installed in new homes.
Climate zone 5 has a much higher percentage of ducted furnaces with twice as many as the other two
climate zones. At the same time, climate zone 4 has a much higher percentage of boilers—four times as
many as the other two climate zones.
Figure 3. Type of Heating Equipment in New Homes (Built 2012 or later)
Source: Single-family On-site Inspections New Construction
The data from multiple sources were compared to assess the level of efficiency for natural gas furnaces.
The sources included the HVAC Contractor Survey, single-family home on-site data collection for the
baseline study, and D&R HARDI data.
The minimum federal standards for non-weatherized gas furnaces manufactured after May 1, 2013 must
meet 90% AFUE9, while ENERGY STAR10 promotes higher efficiency than the federal standard at
95% AFUE and above. As shown in Table 6, the results from all sources were consistent in that over
50 percent of the recent equipment sales is Tier 3: 94% AFUE and above. The D&R HARDI data
9 Annual Fuel Utilization Efficiency (AFUE) is the percentage of the heat in the incoming fuel which is converted to space heat instead of being lost.
10 http://www.energystar.gov/index.cfm?c=furnaces.pr_crit_furnaces
0%
10%
20%
30%
40%
50%
60%
70%
80%
90%
100%
Climate Zone 4 (n=11)
Climate Zone 5 (n=124)
Climate Zone 6 (n=47)
Total NYS (n=182)
Wood Stove
Other
Ground Source Heat Pump
Elec Baseboard
Boiler, Steam
Boiler, Water
Ducted Furnace
15 NYSERDA Residential Statewide Baseline Study Volume 3: HVAC Market Assessment

indicated that more than one-third of the units sold statewide in New York State by the distributors who
participated in HARDI were less than 90% AFUE, although the HVAC Contractor Surveys and on-site
inspection observations showed that the percentage of equipment at that efficiency level may be much
lower at 5 to 6 percent.
Table 6. Residential Natural Gas Furnaces (<225,000 Btu/h) Units Sold in 2013
The sample sizes for contractors and on-site data collection in existing homes with new equipment would meet an 80/20 confidence/precision. At the same time, there is consistency in reports from all at Tier 3 and higher.
Source: HVAC Contractor Surveys (Vars: Type, SF1_1_Total thru SF1_1_t3), Single-family Home On-site Inspection Data Collection, and D&R HARDI Data
Data Source
Large Contractors (n=13)
Not High Tier 2: Total Sales Tier 1: Tier 3: Efficiency: 92.1-Reported by 90-92% 94% AFUE Less than 93% Respondents AFUE and above 90% AFUE AFUE
2,567 6% 8% 18% 69% Small Contractors (n=15) 742 5% 3% 9% 83% On-site Inspection Data Collection Existing Homes (Equipment 2012 and Later)
Based on 14 16.3% 7.3% 14.5% 61.9% Units
On-site Inspection Data Collection New Construction (2012 and Later)
Based on 86 1.1% 5.6% 20.9% 72.5% Units
Statewide (D&R) HARDI Data 95,940 34.5% 4.8% 92.1%-94.9% AFUE: on Total Annual Sales 8.8%
95% AFUE and above: 51.9%
The number of residential oil-fired furnaces installed in the past two years was much smaller statewide
than other types of primary heating equipment. According to D&R HARDI annual sales estimates, less
than 10 percent of all non-electric furnaces sold in 2013 were oil-fired compared to natural gas. And
overall, in new homes (2012 and after), the on-site inspection data collection found 5 percent were fueled
by oil for any type of heating system. With the small percentage of oil-fired systems being sold, only a
handful of new oil-fired furnaces (2012 and after) were observed while on-site for the inspection; this
sample size is too small to be used as a comparison to the HVAC Contractor Survey data.
16 NYSERDA Residential Statewide Baseline Study Volume 3: HVAC Market Assessment
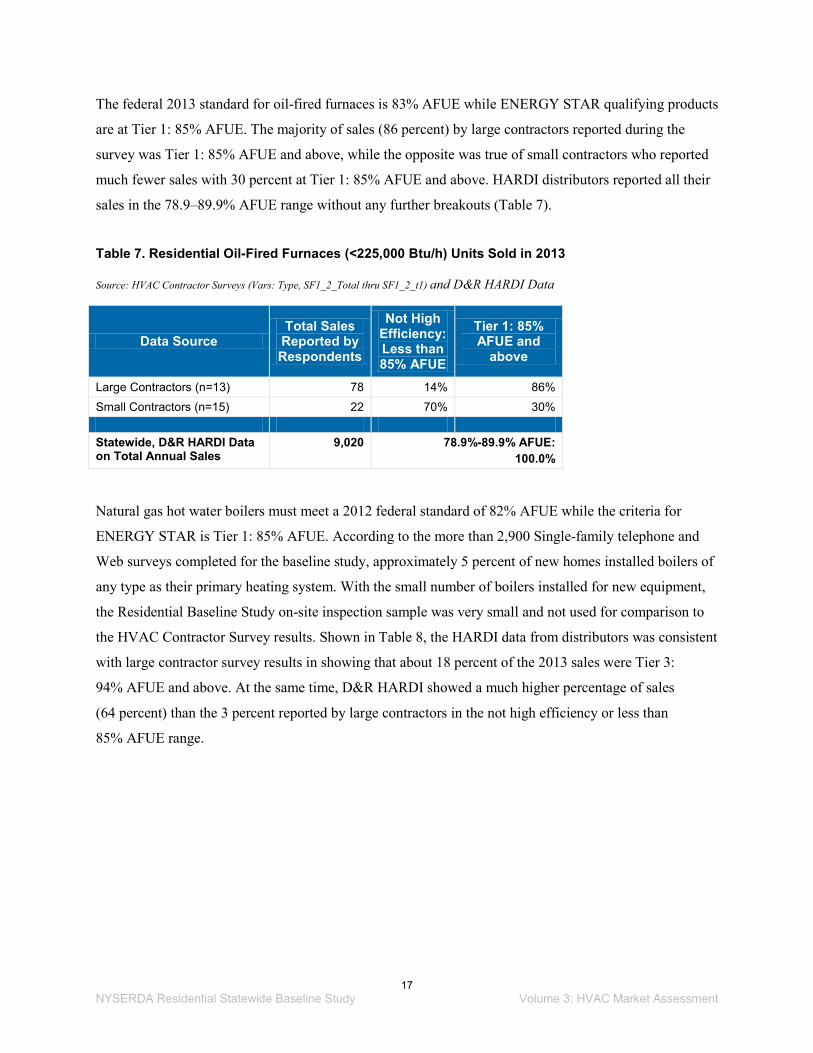
The federal 2013 standard for oil-fired furnaces is 83% AFUE while ENERGY STAR qualifying products
are at Tier 1: 85% AFUE. The majority of sales (86 percent) by large contractors reported during the
survey was Tier 1: 85% AFUE and above, while the opposite was true of small contractors who reported
much fewer sales with 30 percent at Tier 1: 85% AFUE and above. HARDI distributors reported all their
sales in the 78.9–89.9% AFUE range without any further breakouts (Table 7).
Table 7. Residential Oil-Fired Furnaces (<225,000 Btu/h) Units Sold in 2013
Source: HVAC Contractor Surveys (Vars: Type, SF1_2_Total thru SF1_2_t1) and D&R HARDI Data
Data Source
Large Contractors (n=13)
Not High Total Sales Tier 1: 85% Efficiency: Reported by AFUE and Less than Respondents above 85% AFUE 78 14% 86%
Small Contractors (n=15) 22 70% 30% Statewide, D&R HARDI Data 9,020 78.9%-89.9% AFUE: on Total Annual Sales 100.0%
Natural gas hot water boilers must meet a 2012 federal standard of 82% AFUE while the criteria for
ENERGY STAR is Tier 1: 85% AFUE. According to the more than 2,900 Single-family telephone and
Web surveys completed for the baseline study, approximately 5 percent of new homes installed boilers of
any type as their primary heating system. With the small number of boilers installed for new equipment,
the Residential Baseline Study on-site inspection sample was very small and not used for comparison to
the HVAC Contractor Survey results. Shown in Table 8, the HARDI data from distributors was consistent
with large contractor survey results in showing that about 18 percent of the 2013 sales were Tier 3:
94% AFUE and above. At the same time, D&R HARDI showed a much higher percentage of sales
(64 percent) than the 3 percent reported by large contractors in the not high efficiency or less than
85% AFUE range.
17 NYSERDA Residential Statewide Baseline Study Volume 3: HVAC Market Assessment

Table 8. Residential Natural Gas Boilers (<300,000 Btu/h) Units Sold in 2013
Note that large contractors meet 80/20 while small contractors meet 90/20 confidence/precision in this table.
Source: HVAC Contractor Surveys (Vars: Type, SB1_1_Total thru SB1_1_t3) and D&R HARDI Data
Data Source
Large Contractors (n=14)
Total Sales Reported by Respondents
2,722
Not High Efficiency: Less than 85% AFUE
3%
Tier 1: 85%-89%
AFUE
10%
Tier 3: Tier 2: 94% 90%- AFUE 93% and AFUE Above 69% 18%
Small Contractors (n=20) 469 51% 14% 31% 5% Statewide, D&R HARDI Data on Total Annual 59,860 64.2% 10.5% 7.3% 18.1% Sales
The 2012 federal standard for oil-fired boilers is 84% AFUE while ENERGY STAR is at the Tier 1:
85% AFUE level. Oil-fired boilers were less prevalent than natural gas boilers statewide. The D&R
HARDI distributors and the large contractors in the HVAC Contractor Survey reported most were
Tier 1: 85% AFUE and above. Once again, the small contractors, whose sales by individual contractors
are much smaller, reported the majority of their sales (72 percent) were not high efficiency at less than
85% AFUE for oil-fired boilers (Table 9).
Table 9. Residential Oil-Fired Boilers (<225,000 Btu/h) Units Sold in 2013
Note that large contractors meet 80/20 and small contractors meet 80/15 confidence/precision in this table.
Source: HVAC Contractor Surveys (Vars: Type, SB1_2_Total thru SB1_2_t1) and D&RHARDI Data
Data Source Total Sales Reported by Respondents
Not High Efficiency: Less than 85% AFUE
Tier 1: 85%
AFUE and
Above Large Contractors (n=14) 73 15% 85% Small Contractors (n=19) 27 72% 28% Statewide, D&R HARDI Data on Total Annual Sales 41,000 4.8% 95.2%
18 NYSERDA Residential Statewide Baseline Study Volume 3: HVAC Market Assessment
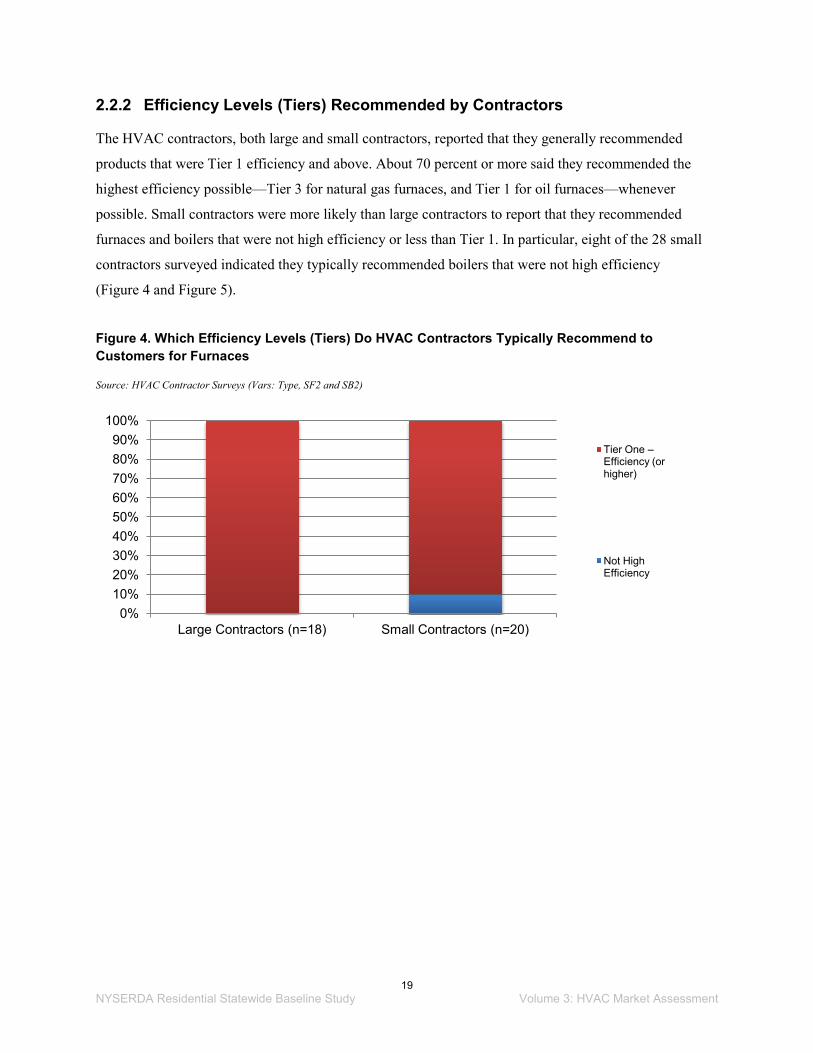
2.2.2 Efficiency Levels (Tiers) Recommended by Contractors
The HVAC contractors, both large and small contractors, reported that they generally recommended
products that were Tier 1 efficiency and above. About 70 percent or more said they recommended the
highest efficiency possible—Tier 3 for natural gas furnaces, and Tier 1 for oil furnaces—whenever
possible. Small contractors were more likely than large contractors to report that they recommended
furnaces and boilers that were not high efficiency or less than Tier 1. In particular, eight of the 28 small
contractors surveyed indicated they typically recommended boilers that were not high efficiency
(Figure 4 and Figure 5).
Figure 4. Which Efficiency Levels (Tiers) Do HVAC Contractors Typically Recommend to Customers for Furnaces
Source: HVAC Contractor Surveys (Vars: Type, SF2 and SB2)
0% 10% 20% 30% 40% 50% 60% 70% 80% 90%
100%
Large Contractors (n=18) Small Contractors (n=20)
Tier One –Efficiency (or higher)
Not High Efficiency
19 NYSERDA Residential Statewide Baseline Study Volume 3: HVAC Market Assessment

Figure 5. Which Efficiency Levels (Tiers) Do HVAC Contractors Typically Recommend to Customers for Boilers
Source: HVAC Contractor Surveys (Vars: Type, SF2 and SB2)
2.2.3 Stocking Practices
The majority of HVAC contractors—both large and small—are most likely to order furnaces from
distributors or manufacturers instead of maintaining a stock (Table 10). The results indicate that there is a
need to work with the distributors to promote high efficiency units. More small contractors, than large
contractors, reported that they maintain a stock of natural gas and oil-fired furnaces. More research would
be needed to determine why that would be true for small contractors. Small contractors may have
installed more less-efficient equipment such as boilers and oil-fired furnaces. Small contractors also
report less awareness of energy efficiency programs, which may be another factor in not installing as
much high efficiency equipment as large contractors.
0%
10%
20%
30%
40%
50%
60%
70%
80%
90%
100%
Large Contractors (n=14) Small Contractors (n=28)
Tier One –Efficiency (or higher)
Not High Efficiency
20 NYSERDA Residential Statewide Baseline Study Volume 3: HVAC Market Assessment

Table 10. Number of Contractors Mentioning Each Stocking Practice for Natural Gas and Oil-Fired Furnaces
Multiple responses were allowed for answer to survey question. Note that large contractors meet 80/20 while small contractors meet 80/15 confidence/precision in this table.
Source: HVAC Contractor Surveys, (Vars: Type, SF3_1 thru SF3_OTHER)
Data Source Number that Maintain a
Stock
Number that Purchase Directly
from Store
Number that Order from Distributor
Number that Order from
Manufacturer
Large Contractors (n=15) 2 1 10 3 Small Contractors (n=21) 6 1 16 2
2.2.4 Oil to Natural Gas Conversions, Annual Servicing, and Efficiency Trends
The HVAC contractors were asked what percentage of the natural gas furnaces and natural gas boilers
sold in the past 12 months in New York State were oil-to-natural gas conversions. Large contractors
reported higher percentages of oil-to-natural gas conversions—over 20 percent for natural gas furnaces.
Small contractors reported 14 percent for these same conversions (Table 11).
Table 11. Oil to Natural Gas Conversions
Source: HVAC Contractors Survey SF6 and SB6
Large Contractors
Average Percentage
of 2013 Units Sold
Small Contractors
Average Percentage
of 2013 Units Sold
Conversions from Oil to Natural Gas: Natural Gas furnaces (n=35) 22% 14%
Conversions from Oil to Natural Gas: Natural Gas boilers (n=42) 17% 13%
HVAC contractors were also asked if they had observed any increase in the number of units of equipment
that are now being retired early versus replaced on failure. About one-quarter of the HVAC contractors
(n=11) said they noticed an increase in furnace equipment retirement. A little over half reported increases
for early replacement of furnaces in the 5 to 25 percent increase range. The amount of increase for early
retirements of boilers also ranged widely among respondents (n=9). Again, a little more than half reported
increases in the 5 to 25 percent range for early retirement of boilers.
21 NYSERDA Residential Statewide Baseline Study Volume 3: HVAC Market Assessment

The large contractors sold an average of 19 Wi-Fi communicating thermostats and installed slightly fewer
with an average of 17 in the past 12 months. Small contractors sold and installed an average of seven to
eight Wi-Fi communicating thermostats in the past 12 months. Although anecdotal, at least two
contractors noted concerns about the Wi-Fi communicating thermostats in that customers face challenges
operating them. According to one contractor, training of customers on the new technology is a burden,
which may present an opportunity to provide training support to customers for the contractors. One
contractor has stopped selling them, while another contractor was mostly installing Wi-Fi thermostats in
commercial buildings, but has not done any installs in 2014 due to all the post-install issues. The same
contractor mentioned going back to the site to replace Wi-Fi communicating thermostats with a basic
thermostat unit.
As shown in Table 12, more of the large contractors sold boiler reset controls (24 boiler reset controls per
contractor, on average) in the past 12 months while much fewer of them (nine boiler reset controls per
contractor, on average) did the installation. The small contractors had one respondent who claimed to
have sold and installed over 600 boiler reset controls, which made the average at 39 sold and installed for
that group. Without the one outlier, the average is closer to 12 boiler reset controls sold on average in the
past 12 months by the small contractor group. At least one contractor noted during the survey that all new
boilers come with reset controls. If the existing unit does not have reset controls, the contractor explained
that it is safer to simply replace the entire boiler unit. To add a reset control to an existing unit could
possibly void the equipment warranty or pose a risk of the contractor being blamed if the old unit fails.
For those customers interested in energy efficiency, the new boiler with the reset control is an easy sell
according to the contractor.
Table 12. Wi-Fi Communicating Thermostats and Boiler Reset Controls Sales and Installs
Source: HVAC Contractor Surveys
Sales and Installs in the Past 12 Months Large Contractors (n=12)
Small Contractors (n=22)
Total Average Per Contractor
Total Average Per Contractor
Wi-Fi Communicating Thermostats Sold 223 19 164 7 Wi-Fi Communicating Thermostats Installed 200 17 168 8 Boiler Reset Controls Sold 289 24 865 39 Boiler Reset Controls Installed 109 9 865 39
22 NYSERDA Residential Statewide Baseline Study Volume 3: HVAC Market Assessment

Based on the single-family on-site inspections, about 58 percent of homeowners who had furnaces and
boilers indicated during the on-site inspection that the equipment had been serviced in 2013 and 2014.
Homeowners with steam or water boilers were more likely (65%) than those with a furnace (50%) to have
had their equipment serviced in 2013 or 2014.
2.3 Residential Central Air Conditioners and Heat Pumps
2.3.1 Sales and Efficiency Data
This section summarizes and compares the data from the HVAC Contractor Surveys, D&R HARDI, and
residential baseline on-site inspections for air conditioning and heat pumps that are two years old or less.
This section provides data on the sample size in terms of the total number of HVAC contractors reporting
sales data and the total number of units that the reporting contractors said they sold in 2013. The
percentages of the reported sales by efficiency levels (or tiers) are provided for each group of responding
contractors—large and small. For comparison purposes, where available, the D&R HARDI data is
provided for that equipment showing estimated total sales in New York State for 2013 and the
percentages by efficiency levels that were reported by the sample of HARDI data distributors for the
state. The results from on-site inspections are also reported where there are a sufficient number of sample
points for that cooling equipment type.
Based on the on-site inspection data for air conditioning equipment from 494 new and existing single-
family homes, and presented in Figure 6 and Figure 7, approximately 19.6 percent of primary cooling
equipment systems were installed in 2012 or later. That suggests that about 9.8 percent of the primary
cooling equipment is replaced each year. Central air conditioning is the most prevalent primary cooling
system type in new construction at about 75 percent of the cooling equipment types. For existing homes
with new air conditioning equipment, central air conditioning represents about one-third (32 percent), and
room air conditioning is close at 28 percent of the new equipment manufactured in the past two years.
Once again, existing homes are typically limited by availability of ductwork in the home, which may
account for the greater number of mini-split systems (12 percent in existing home new equipment versus
less than one percent in new construction). Climate zone 5 has a much higher percentage of central air
conditioning in new homes compared to the other climate zones. At the same time, the sample sizes for
climate zones 4 and 5 are much smaller and may not be representative.
23 NYSERDA Residential Statewide Baseline Study Volume 3: HVAC Market Assessment

Figure 6. Type of Cooling Equipment in New Homes (Built 2012 or after)
Note that climate zone 4 should not be considered representative due to the small number of sample points at 80/20 confidence/precision, climate zone 6 is close to 90/15 confidence/precision.
Source: Single-family On-site Inspection Data for New Homes
Figure 7. Type of New Cooling Equipment (2012 and After) in Existing Homes
Source: Single-family On-Site Inspection Data for Existing Homes Built Before 2012
0% 10% 20% 30% 40% 50% 60% 70% 80% 90%
100%
Climate Zone 4 (n=11)
Climate Zone 5 (n=112)
Climate Zone 6 (n=27)
Total NYS (n=150)
Room Free Standing AC
Room Window AC
Mini Split AC
Air Source Heat Pump
Ground Source Heat Pump
Central AC
0% 10% 20% 30% 40% 50% 60% 70% 80% 90%
100%
Climate Zone 4 (n=19)
Climate Zone 5 (n=28)
Climate Zone 6 (n=15)
Total NYS (n=62)
Room Sleeve AC
Room Free Standing AC
Room Window AC
Mini Split AC
Air Source Heat Pump
Ground Source Heat Pump
Central AC
24 NYSERDA Residential Statewide Baseline Study Volume 3: HVAC Market Assessment

The data from multiple sources were compared to assess the level of efficiency for central air
conditioning and heat pumps. The sources included the HVAC contractor survey, single-family home
on-site data collection for the baseline study, and D&R HARDI data.
The 2013 federal standard for central air conditioning (split systems and single packaged) is 13 SEER,
whereas the minimum ENERGY STAR qualifying criteria is Tier 1: 14.5 SEER. As of January 1, 2015,
the federal standard for packaged systems will increase to 14 SEER, which is still below the ENERGY
STAR qualifying minimum standard. The results from all sources were consistent in that more than
80 percent of the central air conditioning systems were not high efficiency (less than 14.5 SEER), and
less than 15 percent of the recent equipment sales is very high efficiency Tier 3: 16 SEER and above
(Table 13). The on-site inspection data and D&R HARDI data reported is for all central air conditioners,
regardless of type, but most of the sales reported by HVAC contractors are split systems so the other
sources likely represent primarily split systems.
Table 13. Residential Central Air Conditioner Units—Split Systems Sold in 2013
Note that all samples meet the 80/20 confidence/precision with at least 11 data points; 17 data points meet 90/20.
Source: HVAC Contractor Surveys (Vars: Type, AC1_1_Total thru AC1_1_t3) and D&R HARDI Data
Total Sales Reported by Respondents
Not High Efficiency: Less than
14.5 SEER/12 EER
Tier 1: 14.5-14.9
SEER/12.0-12.4 EER
Tier 2: 15.0-15.9
SEER/12.5-12.9 EER
Tier 3: 16 SEER/13 EER
and Above
Large Contractors (n=13) 1,662 68% 8% 9% 15% Small Contractors (n=26) 392 86% 1% 2% 10% On-site Inspection Data Collection Existing Homes (Equipment 2012 and later) All Central Air Conditioners
Based on 17 Units 81.9% 13.8% 0% 4.3%
On-site Inspection Data Collection New Construction (2012 and Later) All Central Air Conditioners
Based on 115 Units 87.4% 9.9% 0.7% 2.0%
Statewide, D&R HARDI Data on Annual Sales of Ducted Central Air Conditioners
87,374 13-13.99 SEER: 86% 14-14.99 SEER: 4.5% 0.1% 9.3%
25 NYSERDA Residential Statewide Baseline Study Volume 3: HVAC Market Assessment

Packaged systems for central air conditioners were mixed in terms of reported efficiency levels by large
contractors and small contractors as shown in Table 14. The numbers of units sold were quite small
compared to split system central air conditioners, which may account for the variability in the data.
Table 14. Residential Central Air Conditioner Units—Packaged Sold in 2013
Note that large contractors meet 80/20 while small contractors are close to 90/15, which would be n=31.
Source: HVAC Contractor Surveys (Vars: Type, AC1_2_Total thru AC1_2_t2)
Data Source Total Sales Reported by Respondents
Not High Efficiency: Less than 14 SEER/ 11 EER
Tier1: 14 SEER/ 11
EER
Tier 2: Above 14 SEER/11
EER
Large Contractors (n=13) 17 6% 24% 70% Small Contractors (n=26) 40 55% 11% 34%
The 2013 federal standard for split system and packaged heat pumps is 13 SEER and 7.7 HSPF.11
Tier 1: 14 SEER is the minimum qualifying efficiency level for ENERGY STAR for packaged heat
pumps, which will become the federal standard in January 2015 for both split system and packaged heat
pumps.
The number of heat pumps that were included in the on-site inspection data was less than 20 units and
was not useful for comparison by types of heat pumps. Efficiency levels of the split system heat pumps
reported by HVAC contractors compare well to the data for ducted heat pumps provided by D&R HARDI
with about one-third of the 2013 sales being in Tier 2 and above levels (Table 15).
11 Heating System Performance Factor (HSPF) is a heat pump's estimated seasonal heating output in Btu divided by the amount of energy that it consumes in watt-hours.
26 NYSERDA Residential Statewide Baseline Study Volume 3: HVAC Market Assessment
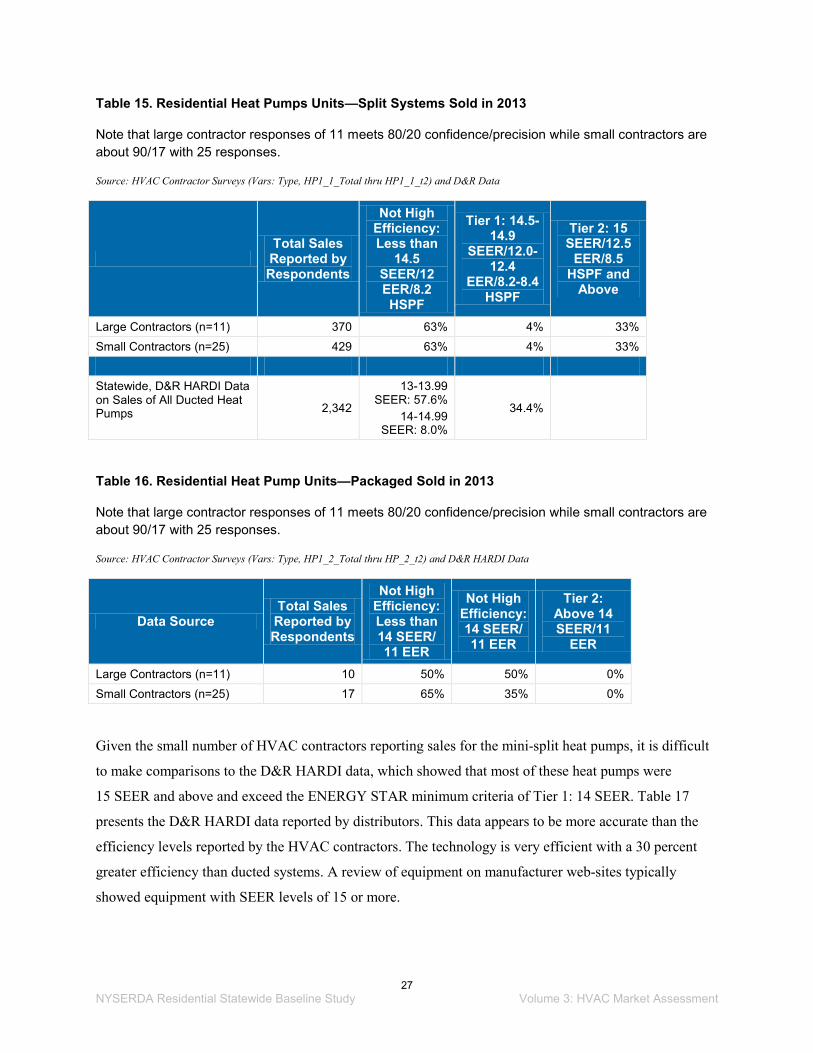
Table 15. Residential Heat Pumps Units—Split Systems Sold in 2013
Note that large contractor responses of 11 meets 80/20 confidence/precision while small contractors are about 90/17 with 25 responses.
Source: HVAC Contractor Surveys (Vars: Type, HP1_1_Total thru HP1_1_t2) and D&R Data
Total Sales Reported by Respondents
Not High Efficiency: Less than
14.5 SEER/12 EER/8.2 HSPF
Tier 1: 14.5-14.9
SEER/12.0-12.4
EER/8.2-8.4 HSPF
Tier 2: 15 SEER/12.5
EER/8.5 HSPF and
Above
Large Contractors (n=11) 370 63% 4% 33% Small Contractors (n=25) 429 63% 4% 33% Statewide, D&R HARDI Data on Sales of All Ducted Heat Pumps 2,342
13-13.99 SEER: 57.6%
14-14.99 SEER: 8.0%
34.4%
Table 16. Residential Heat Pump Units—Packaged Sold in 2013
Note that large contractor responses of 11 meets 80/20 confidence/precision while small contractors are about 90/17 with 25 responses.
Source: HVAC Contractor Surveys (Vars: Type, HP1_2_Total thru HP_2_t2) and D&R HARDI Data
Data Source Total Sales Reported by Respondents
Not High Efficiency: Less than 14 SEER/ 11 EER
Not High Efficiency: 14 SEER/ 11 EER
Tier 2: Above 14 SEER/11
EER
Large Contractors (n=11) 10 50% 50% 0% Small Contractors (n=25) 17 65% 35% 0%
Given the small number of HVAC contractors reporting sales for the mini-split heat pumps, it is difficult
to make comparisons to the D&R HARDI data, which showed that most of these heat pumps were
15 SEER and above and exceed the ENERGY STAR minimum criteria of Tier 1: 14 SEER. Table 17
presents the D&R HARDI data reported by distributors. This data appears to be more accurate than the
efficiency levels reported by the HVAC contractors. The technology is very efficient with a 30 percent
greater efficiency than ducted systems. A review of equipment on manufacturer web-sites typically
showed equipment with SEER levels of 15 or more.
27 NYSERDA Residential Statewide Baseline Study Volume 3: HVAC Market Assessment
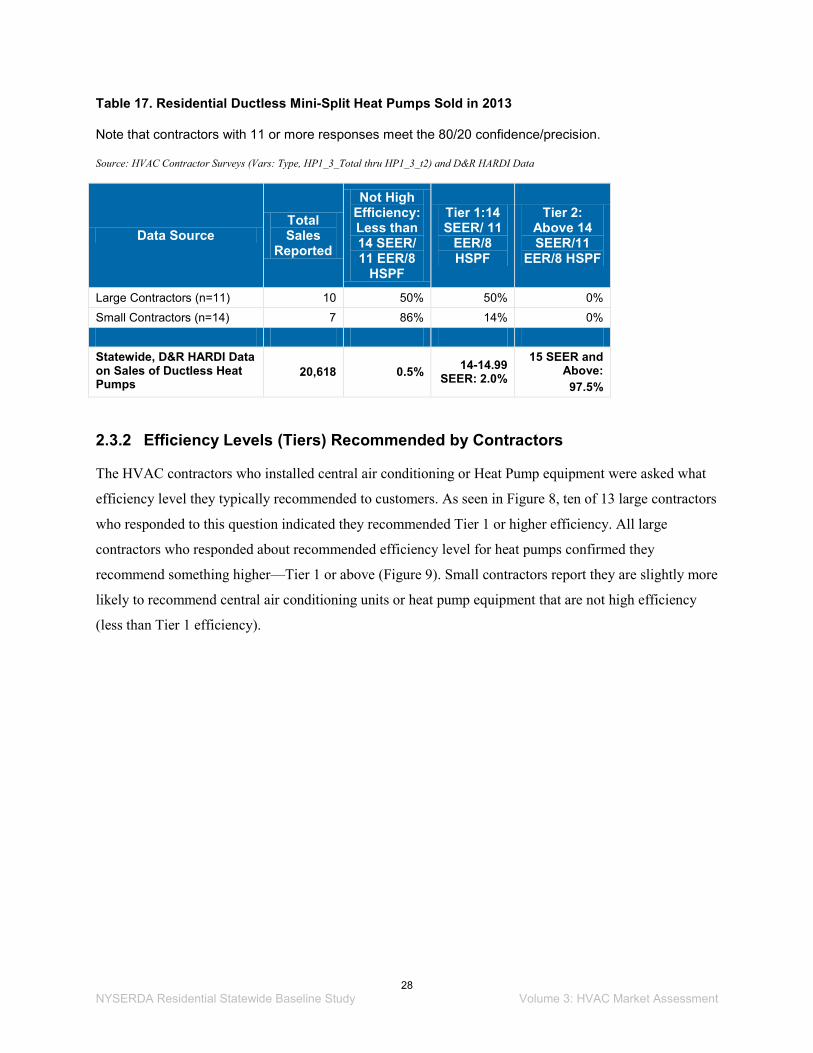
Table 17. Residential Ductless Mini-Split Heat Pumps Sold in 2013
Note that contractors with 11 or more responses meet the 80/20 confidence/precision.
Source: HVAC Contractor Surveys (Vars: Type, HP1_3_Total thru HP1_3_t2) and D&R HARDI Data
Data Source Total Sales
Reported
Not High Efficiency: Less than 14 SEER/ 11 EER/8
HSPF
Tier 1:14 SEER/ 11
EER/8 HSPF
Tier 2: Above 14 SEER/11
EER/8 HSPF
Large Contractors (n=11) 10 50% 50% 0% Small Contractors (n=14) 7 86% 14% 0% Statewide, D&R HARDI Data on Sales of Ductless Heat Pumps
20,618 0.5% 14-14.99 SEER: 2.0%
15 SEER and Above: 97.5%
2.3.2 Efficiency Levels (Tiers) Recommended by Contractors
The HVAC contractors who installed central air conditioning or Heat Pump equipment were asked what
efficiency level they typically recommended to customers. As seen in Figure 8, ten of 13 large contractors
who responded to this question indicated they recommended Tier 1 or higher efficiency. All large
contractors who responded about recommended efficiency level for heat pumps confirmed they
recommend something higher—Tier 1 or above (Figure 9). Small contractors report they are slightly more
likely to recommend central air conditioning units or heat pump equipment that are not high efficiency
(less than Tier 1 efficiency).
28 NYSERDA Residential Statewide Baseline Study Volume 3: HVAC Market Assessment
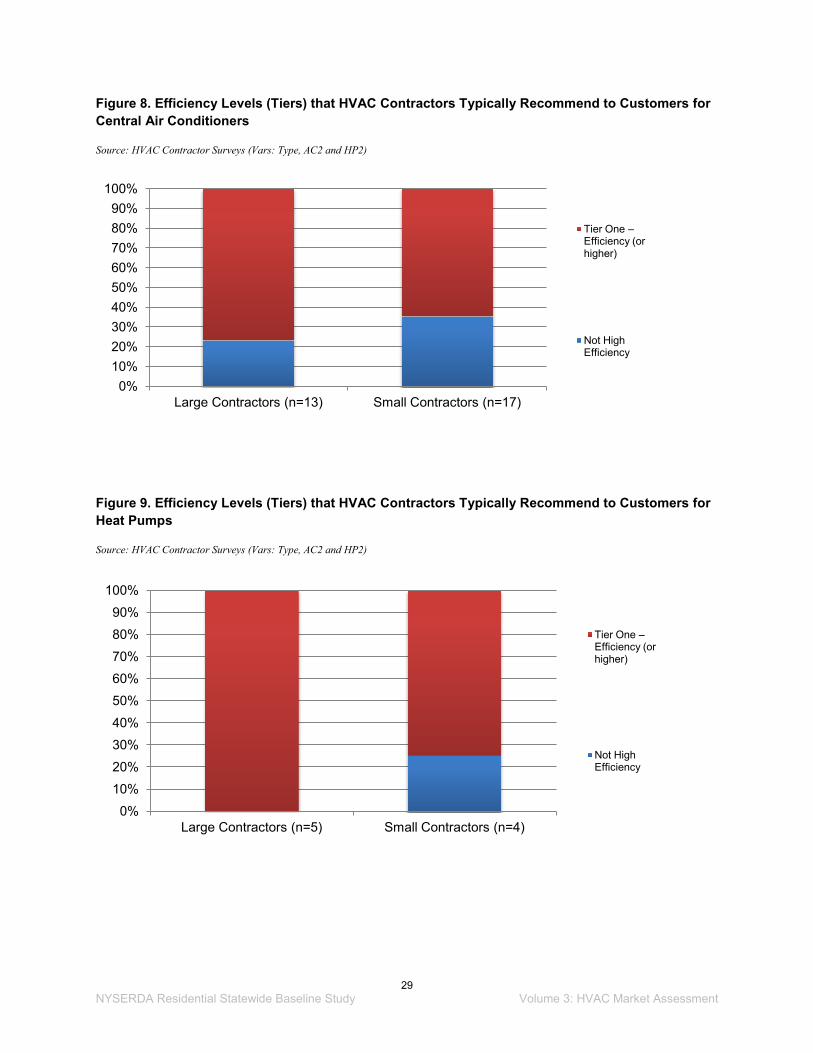
Figure 8. Efficiency Levels (Tiers) that HVAC Contractors Typically Recommend to Customers for Central Air Conditioners
Source: HVAC Contractor Surveys (Vars: Type, AC2 and HP2)
Figure 9. Efficiency Levels (Tiers) that HVAC Contractors Typically Recommend to Customers for Heat Pumps
Source: HVAC Contractor Surveys (Vars: Type, AC2 and HP2)
0% 10% 20% 30% 40% 50% 60% 70% 80% 90%
100%
Large Contractors (n=13) Small Contractors (n=17)
Tier One –Efficiency (or higher)
Not High Efficiency
0%
10%
20%
30%
40%
50%
60%
70%
80%
90%
100%
Large Contractors (n=5) Small Contractors (n=4)
Tier One –Efficiency (or higher)
Not High Efficiency
29 NYSERDA Residential Statewide Baseline Study Volume 3: HVAC Market Assessment

2.3.3 Stocking Practices for Central Cooling Equipment
As with heating equipment, only a few of the HVAC contractors maintain a stock of central air
conditioners (Table 18) and heat pumps (Table 19). As with central air conditioners, heat pumps are more
typically ordered from the distributor when needed. A few of the large contractors indicated they do
maintain a stock of this equipment.
Table 18. Number Mentioning Each Stocking Practice for Central Air Conditioners
Source: HVAC Contractor Surveys, (Vars: Type, AC3_1 thru AC3_OTHER)
Data Source Maintain a Stock
Purchase Directly
from Store Order from Distributor
Order from Manufacturer
Large Contractors (n=15) 3 0 11 2 Small Contractors (n=23) 3 0 13 3
Table 19. Number Mentioning Each Stocking Practice for Heat Pumps
Source: HVAC Contractor Surveys, (Vars: Type, HP3_1 thru HP3_OTHER)
Data Source Maintain a Stock
Purchase Directly
from Store Order from Distributor
Order from Manufacturer
Large Contractors (n=6) 2 0 4 0 Small Contractors (n=6) 0 0 5 1
2.3.4 Early Retirement, Annual Service Rate, and Other Efficiency Trends
Only one large and one small contractor reported an increase in central air conditioning units being retired
early (versus failure) within this survey. The large contractor reported that 20 percent more units are
being replaced earlier, prior to replacement on failure; the small contractor reported a 10 percent unit
sales impact from early central air conditioning retirement.
Based on the single-family on-site inspections, about 40 percent of homes that had central air conditioners
indicated during the on-site inspection that the equipment had been serviced in 2013 or 2014. This result
compares to 71 percent of homes with an air source or ground source heat pump.
30 NYSERDA Residential Statewide Baseline Study Volume 3: HVAC Market Assessment
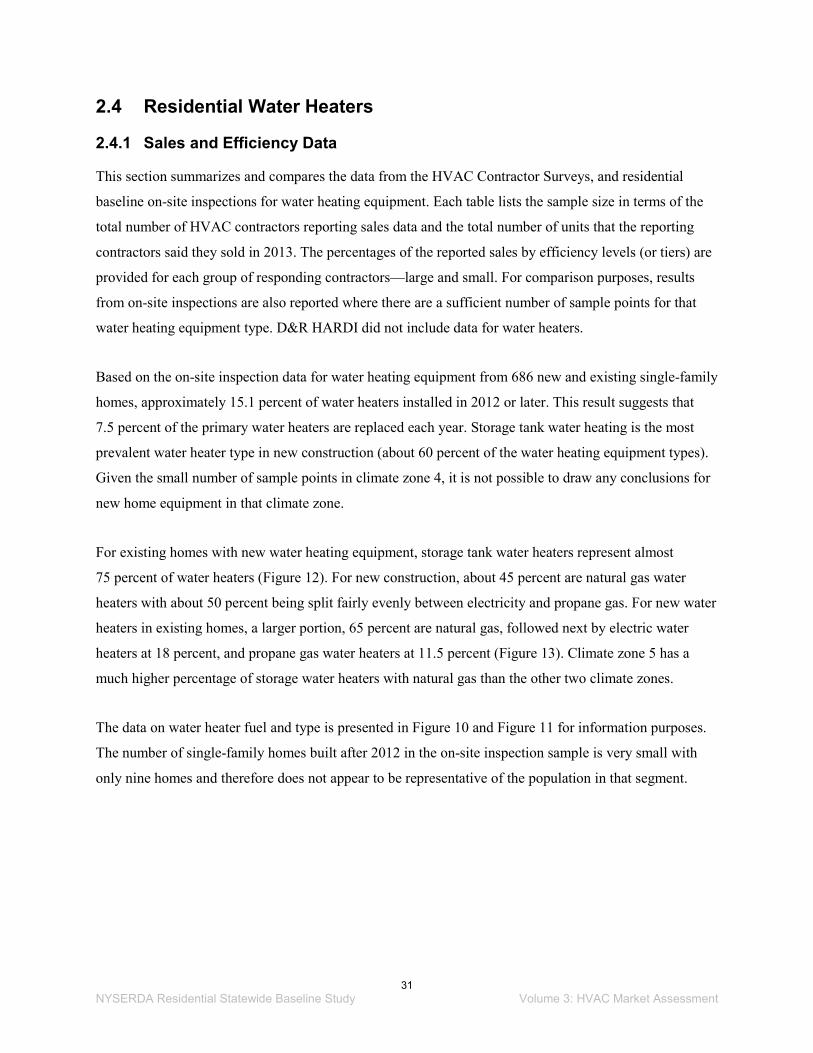
2.4 Residential Water Heaters
2.4.1 Sales and Efficiency Data
This section summarizes and compares the data from the HVAC Contractor Surveys, and residential
baseline on-site inspections for water heating equipment. Each table lists the sample size in terms of the
total number of HVAC contractors reporting sales data and the total number of units that the reporting
contractors said they sold in 2013. The percentages of the reported sales by efficiency levels (or tiers) are
provided for each group of responding contractors—large and small. For comparison purposes, results
from on-site inspections are also reported where there are a sufficient number of sample points for that
water heating equipment type. D&R HARDI did not include data for water heaters.
Based on the on-site inspection data for water heating equipment from 686 new and existing single-family
homes, approximately 15.1 percent of water heaters installed in 2012 or later. This result suggests that
7.5 percent of the primary water heaters are replaced each year. Storage tank water heating is the most
prevalent water heater type in new construction (about 60 percent of the water heating equipment types).
Given the small number of sample points in climate zone 4, it is not possible to draw any conclusions for
new home equipment in that climate zone.
For existing homes with new water heating equipment, storage tank water heaters represent almost
75 percent of water heaters (Figure 12). For new construction, about 45 percent are natural gas water
heaters with about 50 percent being split fairly evenly between electricity and propane gas. For new water
heaters in existing homes, a larger portion, 65 percent are natural gas, followed next by electric water
heaters at 18 percent, and propane gas water heaters at 11.5 percent (Figure 13). Climate zone 5 has a
much higher percentage of storage water heaters with natural gas than the other two climate zones.
The data on water heater fuel and type is presented in Figure 10 and Figure 11 for information purposes.
The number of single-family homes built after 2012 in the on-site inspection sample is very small with
only nine homes and therefore does not appear to be representative of the population in that segment.
31 NYSERDA Residential Statewide Baseline Study Volume 3: HVAC Market Assessment

Figure 10. Type of Water Heaters in New Homes (Built 2012 and Later)
Note that climate zone 4 should not be considered representative of that population segment due to the small sample size.
Source: Single-family On-site Inspection Data for Homes Built Before 2012
Figure 11. Water Heater Fuel in New Homes (Built 2012 and Later)
Note that climate zone 4 should not be considered representative of that population segment due to the small sample size.
Source: Single-family On-site Inspection Data for Homes Built Before 2012
0% 10% 20% 30% 40% 50% 60% 70% 80% 90%
100%
Climate Zone 4 (n=9)
Climate Zone 5 (n=124)
Climate Zone 6 (n=47)
Overall Statewide (n=180)
Space-heating Boiler w/ Coil or Tankless Coil and Indirect WH Heat Pump Water Heater
Geo-Thermal Heat Pump w/ water heating
Instantaneous Tankless Water Heater
Space-heating boiler w/ Storage Tank
Storage Tank Water Heater
0% 10% 20% 30% 40% 50% 60% 70% 80% 90%
100%
Climate Zone 4 (n=9)
Climate Zone 5 (n=124)
Climate Zone 6 (n=47)
Overall Statewide (n=180)
Oil #2
Propane
Electricity
Natural Gas
32 NYSERDA Residential Statewide Baseline Study Volume 3: HVAC Market Assessment

Figure 12. Type of New Water Heaters (2012 and Later) in Existing Homes
Note that climate zone 4 with 19 responses meets 80/15 confidence/precision
Source: Single-family On-site Inspection Data for Existing Homes
Figure 13. Fuel for New Water Heaters (2012 and Later) in Existing Homes
Source: Single-family On-site Inspection Data for Existing Homes
0% 10% 20% 30% 40% 50% 60% 70% 80% 90%
100%
Climate Zone 4 (n=19)
Climate Zone 5 (n=25)
Climate Zone 6 (n=34)
Overall Statewide (n=78)
Heat Pump Water Heater
Space-heating Boiler w/ Coil or Tankless Coil and Indirect WH Instantaneous Tankless Water Heater
Space-heating boiler w/ Storage Tank
Storage Tank Water Heater
0%
10%
20%
30%
40%
50%
60%
70%
80%
90%
100%
Climate Zone 4 (n=19)
Climate Zone 5 (n=25)
Climate Zone 6 (n=34)
Overall Statewide
(n=78)
Oil #2
Propane
Electricity
Natural Gas
33 NYSERDA Residential Statewide Baseline Study Volume 3: HVAC Market Assessment

Residential water heaters must comply with the amended standards found in the Code of Federal
Regulations,12 by April 16, 2015. This information is also in the Electronic Code of Federal
Regulations13. Table 20 gives the standards for the non-electric water heaters for comparison to current
installation practices. Natural gas water heaters move from the 2004 standard of 0.67 to 0.675 Energy
Factor14 (EF) for 20 gallon to 55 gallon water heaters, while 50 gallon oil-fired water heaters have a
larger increase from 0.59 to 0.68 EF.
Table 20. Amended Energy Conservation Standards for Residential Water Heaters
Vs: Rated Storage Volume – the water storage capacity of a water heater (in gallons).
Product Class Rated Storage Volume Energy Factor (EF)
Natural Gas-fired Water Heater ≥20 gal and ≤55 gal 0.675 – (0.0015*Vs) > 55 gal and ≤100 gal 0.8012 – (0.00078* Vs)
Oil-fired Water Heater ≤50 gal 0.68 – (0.0019*Vs) Instantaneous Natural Gas-fired Water Heater < 2 gal 0.82 – (0.0019*Vs)
Based on the HVAC Contractor Survey respondents, it appears that the majority of natural gas-fired water
heaters installed in 2013 will likely meet the new 2015 standard of 0.675 EF because it is only a small
increase from 0.67 EF. The majority of the natural gas-fired water heaters installed in 2012 or later did
not meet the new standards based on the primary data collected during the on-site inspections. At the
same time, the data includes water heaters in 2012 and the trend indicates water heating distributors and
manufacturers have just recently (2013 and later) begun to respond to the impending new standards.
The HVAC contractor data and the on-site observations in Table 21 compared closely for the percentage
of natural gas water heaters that were installed recently at the Tier 2: 0.80 EF and above level (less than
9 percent). However, there were some differences in what was reported by HVAC contractors as
percentage of natural gas storage water heaters for the Tier 1 efficiency level and for not high efficiency
versus what was found in the on-site inspections. The on-site inspections reported that the majority of
those water heaters were less than 0.67 EF, which is surprising because it would not meet the 2013 federal
standard. No D&R HARDI data for water heaters were available to make comparisons to the other two
sources.
12 10 CFR 430.32(d) 13 http://www.gpo.gov/fdsys/browse/collectionCfr.action?collectionCode=CFR 14 Energy Factor (EF) is an annual measure of the useful energy coming out of a water heater, divided by the amount of
energy going in to the water heater to heat the water.
34 NYSERDA Residential Statewide Baseline Study Volume 3: HVAC Market Assessment
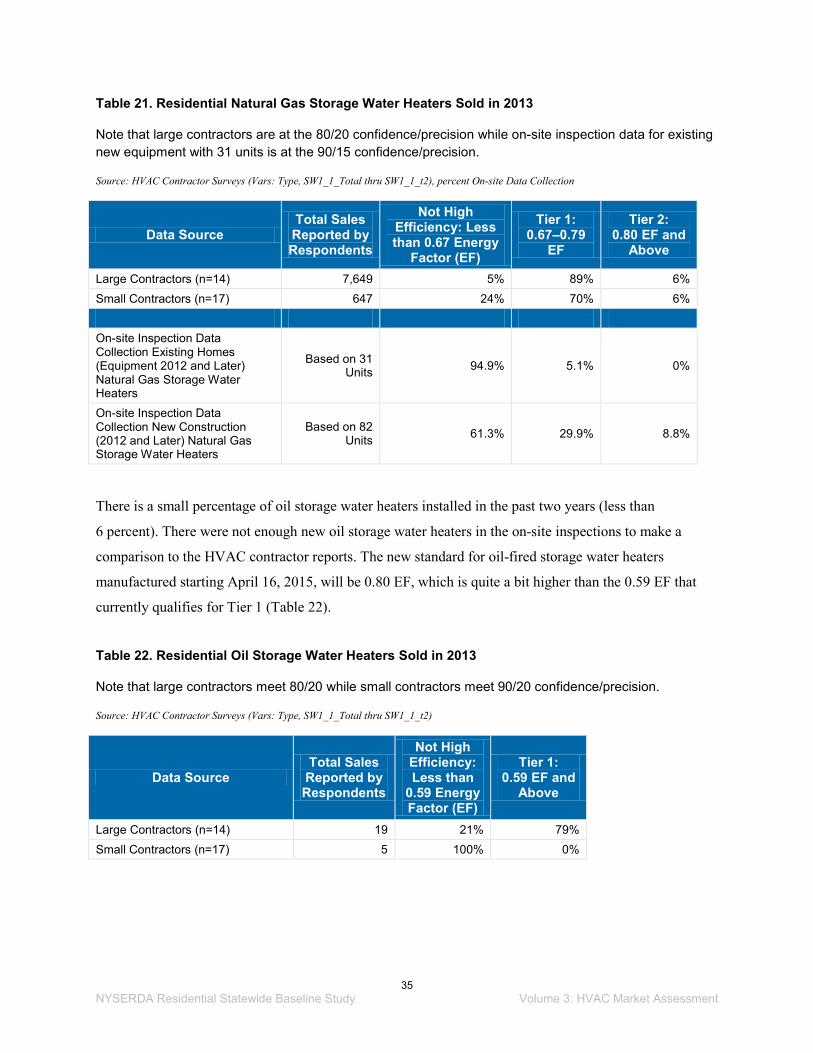
Table 21. Residential Natural Gas Storage Water Heaters Sold in 2013
Note that large contractors are at the 80/20 confidence/precision while on-site inspection data for existing new equipment with 31 units is at the 90/15 confidence/precision.
Source: HVAC Contractor Surveys (Vars: Type, SW1_1_Total thru SW1_1_t2), percent On-site Data Collection
Data Source Total Sales Reported by Respondents
Not High Efficiency: Less than 0.67 Energy
Factor (EF)
Tier 1: 0.67–0.79
EF
Tier 2: 0.80 EF and
Above
Large Contractors (n=14) 7,649 5% 89% 6% Small Contractors (n=17) 647 24% 70% 6% On-site Inspection Data Collection Existing Homes (Equipment 2012 and Later) Natural Gas Storage Water Heaters
Based on 31 Units 94.9% 5.1% 0%
On-site Inspection Data Collection New Construction (2012 and Later) Natural Gas Storage Water Heaters
Based on 82 Units 61.3% 29.9% 8.8%
There is a small percentage of oil storage water heaters installed in the past two years (less than
6 percent). There were not enough new oil storage water heaters in the on-site inspections to make a
comparison to the HVAC contractor reports. The new standard for oil-fired storage water heaters
manufactured starting April 16, 2015, will be 0.80 EF, which is quite a bit higher than the 0.59 EF that
currently qualifies for Tier 1 (Table 22).
Table 22. Residential Oil Storage Water Heaters Sold in 2013
Note that large contractors meet 80/20 while small contractors meet 90/20 confidence/precision.
Source: HVAC Contractor Surveys (Vars: Type, SW1_1_Total thru SW1_1_t2)
Data Source Total Sales Reported by Respondents
Not High Efficiency: Less than
0.59 Energy Factor (EF)
Tier 1: 0.59 EF and
Above
Large Contractors (n=14) 19 21% 79% Small Contractors (n=17) 5 100% 0%
35 NYSERDA Residential Statewide Baseline Study Volume 3: HVAC Market Assessment

The data reported by HVAC contractors and collected from the on-site inspections of 686 new and
existing single-family homes were fairly consistent for natural gas tankless water heaters. With the
exception of a few natural gas tankless water heaters installed in existing homes in 2012 and later, the
majority (97 percent or more) met the Tier 1: 0.82 and above efficiency. As of April 16, 2015, 0.82 EF
becomes the new federal standard, which meets current ENERGY STAR criteria. It appears that most
units are already meeting the federal standard although the 2010 standard that was in place is much lower
at 0.62 EF (Table 23).
Table 23. Residential Natural Gas Water Heaters Tankless Sold in 2013
Note that existing homes included in the on-site inspections with new water heaters are based on 7 units, which is very small and does not meet the 80/20 confidence/precision met by both contractor groups. New homes are at 80/15 or better.
Source: HVAC Contractor Surveys (Vars: Type, SW1_3_Total thru SW1_3_t1), On-site Inspection Data Collection
Data Source Total Sales Reported by Respondents
Not High Efficiency: Less than
0.82 Energy Factor (EF)
Tier 1: 0.82 EF
and Above
Large Contractors (n=14) 290 3% 97% Small Contractors (n=14) 92 0% 100% On-site Inspection Data Collection Existing Homes (Equipment 2012 and Later) Natural Gas Tankless Water Heater
Based on 7 Units
16% 84%
On-site Inspection Data Collection New Construction (2012 and Later) Natural Gas Tankless Water Heater
Based on 23 Units
3.3% 96.7%
The on-site inspections for single-family homes did not specifically identify water heaters as condensing
water heaters. The majority of large contractors and small contractors said they installed Tier 1: 0.80 EF
and above efficiency for this equipment (Table 24).
36 NYSERDA Residential Statewide Baseline Study Volume 3: HVAC Market Assessment

Table 24. Residential Natural Gas Water Heaters-Condensing Sold in 2013
Note that contractors have more than 11 responses to meet 80/20 confidence/precision.
Source: HVAC Contractor Surveys (Vars:Type, SW1_4_Total thru SW1_4_t1)
Data Source Total Sales Reported by Respondents
Not High Efficiency: Less than
0.80 Energy Factor (EF)
Tier 1: 0.80 EF and
Above
Large Contractors (n=13) 146 45% 55% Small Contractors (n=14) 40 11% 89%
2.4.2 Efficiency Levels (Tiers) Recommended by Contractors
Seventy-three percent (11 of 15) of large contractors who recommend residential water heaters
recommend Tier 1 or above efficiency levels. A similar proportion of small contractors (70 percent, or
16 of 23 contractors) recommend something higher than the standard level water heater efficiency
(Figure 14).
Figure 14. Efficiency Levels (Tiers) of Residential Water Heaters HVAC Contractors Typically Recommend to Customers
Source: HVAC Contractor Surveys (Vars: Type, SW2)
0% 10% 20% 30% 40% 50% 60% 70% 80% 90%
100%
Large Contractors Small Contractors
Tier 1 Efficiency or higher
Not High Efficiency
37 NYSERDA Residential Statewide Baseline Study Volume 3: HVAC Market Assessment

2.4.3 Stocking Practices
The majority of HVAC contractors indicated that they order water heaters from distributors on a case-by-
case basis. However, a few, primarily large contractors, maintain a stock of water heaters (Table 25).
Table 25. Number of HVAC Contractors Mentioning Each Stocking Practice for Residential Water Heaters
Does not add to total contractors because multiple responses were allowed.
Source: HVAC Contractor Surveys, (Vars: Type, SW3_1 thru SW3_OTHER)
Data Source Maintain a Stock
Purchase Directly from
Store Order from Distributor
Order from Manufacturer
Large Contractors (n=16) 5 0 13 1 Small Contractors (n=26) 2 0 20 1
2.4.4 Oil to Natural Gas Conversions and Efficiency Trends
Large contractors indicated that an average of nearly 20 percent of natural gas water heaters they have
sold in the past 12 months were oil-to-natural gas conversions; however, only a very small percentage
(2 percent) are heat pump water heaters. Small contractors estimated a smaller (11 percent) oil-to-natural
gas conversation sales rate in the past 12 months on average, with only one percent being heat pump
water heaters.
Large contractors reported not seeing much of an early retirement increase when it comes to water
heaters. Large contractors reported no movement on early retirement of tankless water heaters. Responses
among small contractors were highly similar (Table 26).
Table 26. Recent Trends in Water Heater Sales
Source: HVAC Contractor Surveys, (Vars: Type, SW6, SW7)
Large Contractors Percent of 2013 Units
Sold
Small Contractors Percent of 2013 Units
Sold
Conversions from Oil to Natural Gas 18% 11% Heat Pump Water Heaters Sales 2% 1%
38 NYSERDA Residential Statewide Baseline Study Volume 3: HVAC Market Assessment

2.5 Quality Design, Installation, and Maintenance
2.5.1 Training and Certification
The HVAC contractors were asked which industry sources they primarily used as references to ensure
quality installation of residential HVAC equipment. Table 27 lists widely recognized primary sources
among HVAC contractors. Large contractors more frequently mentioned a recognized industry source as
a primary reference compared to small contractors. North American Technician Excellence (NATE)15
received the most mentions among surveyed contractors, with three large contractors and two small
contractors reporting it as a primary resource.
Contractors of all sizes were more likely to indicate another reference (“Other”) to ensure quality
installations. Sixteen respondents mentioned the manufacturer as their other source of information. Six
respondents mentioned building codes and NYSERDA as other sources of training and certification.
Seven large contractors and eight small contractors answered that they had no particular industry source
they considered for a reference.
Table 27. Primary Sources Used as References to Ensure Quality Installations
Multiple responses were allowed. Note that large contractors are very close to 90/20 and small contractors are close to 90/15 confidence/precision levels.
Source: HVAC Contractor Surveys, (Vars: Type, IM1_1 through IM1_7)
Primary Sources
Number of Large
Contractors Mentioned
(n=16)
Number of Small
Contractors Mentioned
(n=28)
Air Conditioning Contractors of America (ACCA) 1 0 American Society of Heating, Refrigerating, and Air Conditioning Engineers (ASHRAE)
2 2
Plumbing, Heating-Cooling Contractors National Association (PHCC)
2 0
North American Technician Excellence (NATE) 3 2 Building Performance Institute (BPI) 2 2 Other (Manufacturer, Codes, NYSERDA) 11 18 None 7 8
15 North American Technician Excellence (NATE) is the leading nonprofit certification program for technicians in the heating, ventilation, air-conditioning, and refrigeration (HVACR) industry that is supported by the entire industry.
39 NYSERDA Residential Statewide Baseline Study Volume 3: HVAC Market Assessment
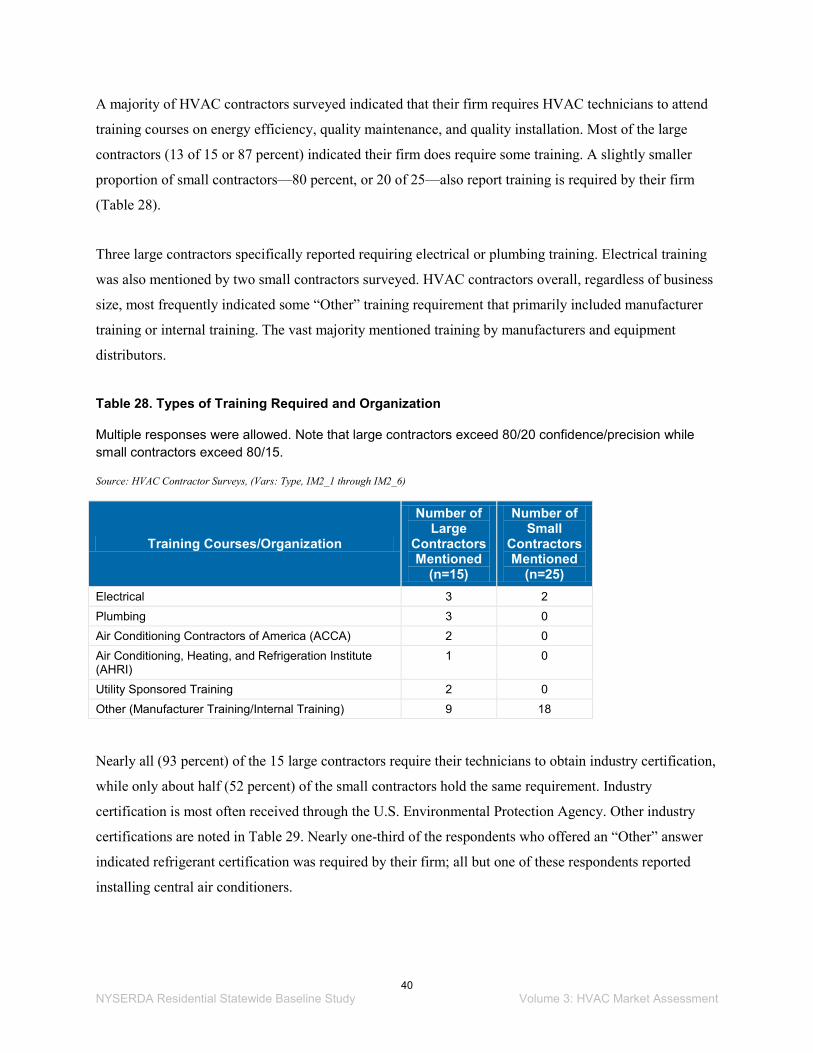
A majority of HVAC contractors surveyed indicated that their firm requires HVAC technicians to attend
training courses on energy efficiency, quality maintenance, and quality installation. Most of the large
contractors (13 of 15 or 87 percent) indicated their firm does require some training. A slightly smaller
proportion of small contractors—80 percent, or 20 of 25—also report training is required by their firm
(Table 28).
Three large contractors specifically reported requiring electrical or plumbing training. Electrical training
was also mentioned by two small contractors surveyed. HVAC contractors overall, regardless of business
size, most frequently indicated some “Other” training requirement that primarily included manufacturer
training or internal training. The vast majority mentioned training by manufacturers and equipment
distributors.
Table 28. Types of Training Required and Organization
Multiple responses were allowed. Note that large contractors exceed 80/20 confidence/precision while small contractors exceed 80/15.
Source: HVAC Contractor Surveys, (Vars: Type, IM2_1 through IM2_6)
Training Courses/Organization
Number of Large
Contractors Mentioned
(n=15)
Number of Small
Contractors Mentioned
(n=25) Electrical 3 2 Plumbing 3 0 Air Conditioning Contractors of America (ACCA) 2 0 Air Conditioning, Heating, and Refrigeration Institute (AHRI)
1 0
Utility Sponsored Training 2 0 Other (Manufacturer Training/Internal Training) 9 18
Nearly all (93 percent) of the 15 large contractors require their technicians to obtain industry certification,
while only about half (52 percent) of the small contractors hold the same requirement. Industry
certification is most often received through the U.S. Environmental Protection Agency. Other industry
certifications are noted in Table 29. Nearly one-third of the respondents who offered an “Other” answer
indicated refrigerant certification was required by their firm; all but one of these respondents reported
installing central air conditioners.
40 NYSERDA Residential Statewide Baseline Study Volume 3: HVAC Market Assessment

Table 29. Types of Certification Required and Organization
Multiple responses allowed. Note that large contractors exceed 80/20 confidence/precision while small contractors exceed 80/15.
Source: HVAC Contractor Surveys, (Vars: Type, IM3_1 through IM3_4)
Types of Certification
Number of Large
Contractors Mentioned
(n=15)
Number of Small Contractors
Mentioned (n=25)
North American Technician Excellence (NATE) 1 2 Building Performance Institute (BPI) 1 0 EPA HVAC Certification 4 1 Other (Refrigerant Certification, Manufacturer, Utility, National Oil Heat Research Alliance or NORA)
7 9
The HVAC contractors were also asked to rate their firm in terms of skill level for various quality design
elements for HVAC equipment. The elements appear in Table 30. The ratings are based on a scale of 1 to
5, where 1 = not at all proficient, and 5 = extremely proficient. Both large and small contractors report, on
average, that they are “very” or “extremely proficient” at all quality design elements we asked about.
Large contractors, in particular, indicated they were extremely proficient in diagnosing techniques for
ensuring adequate system refrigerant.
Table 30. Rating of Proficiency in Quality Design Elements by HVAC Contractors
Note that large contractors exceed 80/20 confidence/precision while small contractors exceed 80/15.
Source: HVAC Contractor Surveys (Vars: Type, D1_A through D1_4)
Quality Design Element Large
Contractors Average
Rating (n=15)
Small Contractors
Average Rating (n=25)
Practices, techniques, and experiences with sizing new systems 4.67 4.64 Designing, installing, replacing, and fixing air distribution systems 4.14 4.35 Recommending and specifying system efficiencies 4.67 4.60 Diagnosing techniques for ensuring adequate system refrigerant charging 5 4.50
41 NYSERDA Residential Statewide Baseline Study Volume 3: HVAC Market Assessment

2.5.2 Installation and Servicing Practices
HVAC contractors were asked how often they perform various tests when installing or servicing HVAC
equipment. The frequency was based on a scale of 1 to 5, where 1 = usually not done, and 5 = always
done. Table 31 lists the practices or tests contractors to rate on frequency in which they are performed,
along with the average rating for each test among large and small contractors.
Small contractors were less likely to perform tests including building ventilation calculations, duct
leakage tests, and duct pressurization tests. Large contractors were also less likely to conduct duct leakage
and duct pressurization tests, and measure water flows. Ensuring the HVAC system has the proper
refrigerant charge is always done according to the responses of a large portion of both small and large
contractors alike.
Table 31. Rating of Frequency of Performing Various Tests During Installation/Servicing of Equipment
Scale of 1 to 5, where 1 = usually not done, and 5 = always done. Note that large contractors exceed 80/20 confidence/precision while small contractors exceed 80/15.
Source: HVAC Contractor Surveys, (Vars: Type, D2_A through D2_H, and D3_A through D3_D)
Test or Procedure
Large Contractors
Average Rating of
Frequency Performed
(n=13)
Small Contractors
Average Rating of
Frequency Performed
(n=21) Conduct building ventilation calculations 4.15 2.22 Conduct heat loss and heat gain load calculations 4.14 4.13 Ensure equipment is properly sized and selected prior to installation 4.79 4.71 Confirm heating and cooling equipment are properly matched systems using industry-recognized product certification databases such as AHRI, CEE, or OEM performance data
4.62 4.17
Verify the airflow through the indoor blower unit (e.g., furnaces, fan coil, air handler) is within acceptable CFM ranges
4.31 4.37
Verify the water flow through indoor heat exchangers are within acceptable ranges (refers to boilers)
4.00 4.09
Ensure the HVAC system has the proper refrigerant charge 5.00 4.79 Conduct duct leakage tests 2.77 2.84 Conduct duct pressurization tests 2.15 1.89 Measure airflows 4.08 3.42 Measure water flows 2.86 3.13
42 NYSERDA Residential Statewide Baseline Study Volume 3: HVAC Market Assessment

2.6 Impacts of Efficiency Programs and Standards
2.6.1 Familiarity and Use of Energy Efficiency Programs in New York State
Less than 10 percent of the large HVAC contractors are not at all familiar with energy efficiency
programs in New York State. The majority (93 percent) of large contractors indicated they were
somewhat familiar or very familiar with energy efficiency programs in New York State. Slightly more
than one-third of the small contractors are not at all familiar with the programs (Table 32).
Table 32. Familiarity with Energy Efficiency Programs in New York State
Note that large contractors exceed 80/20 confidence/precision while small contractors exceed 80/15.
Source: HVAC Contractor Surveys, (Vars: Type, PA1)
Data Source Not at
All Familiar
Somewhat Familiar Very Familiar
Large Contractors (n=15) 7% 73% 20% Small Contractors (n=24) 37.5% 37.5% 25%
The programs most often mentioned by large contractors were most often named only by utility or
implementer, such as National Grid or NYSERDA programs. A few large contractors were able to recall
full program names, such as NYSERDA’s Multifamily or High Efficiency Heating programs. Among
large contractors who sell equipment through an energy efficiency program, the average percent of
equipment that large contractors sold or rebated through the programs was 63 percent.
Two-thirds of small contractors who confirmed some familiarity with energy efficient programs in New
York State most often mentioned NYSERDA programs. Other utilities/implementers named were
National Grid, NYSEG, and Con Ed. Small contractors reported actual program names with far lower
frequency than large contractors. The average percent of equipment sold or rebated through the programs,
according to small contractors who sold equipment through these programs was 55 percent.
43 NYSERDA Residential Statewide Baseline Study Volume 3: HVAC Market Assessment
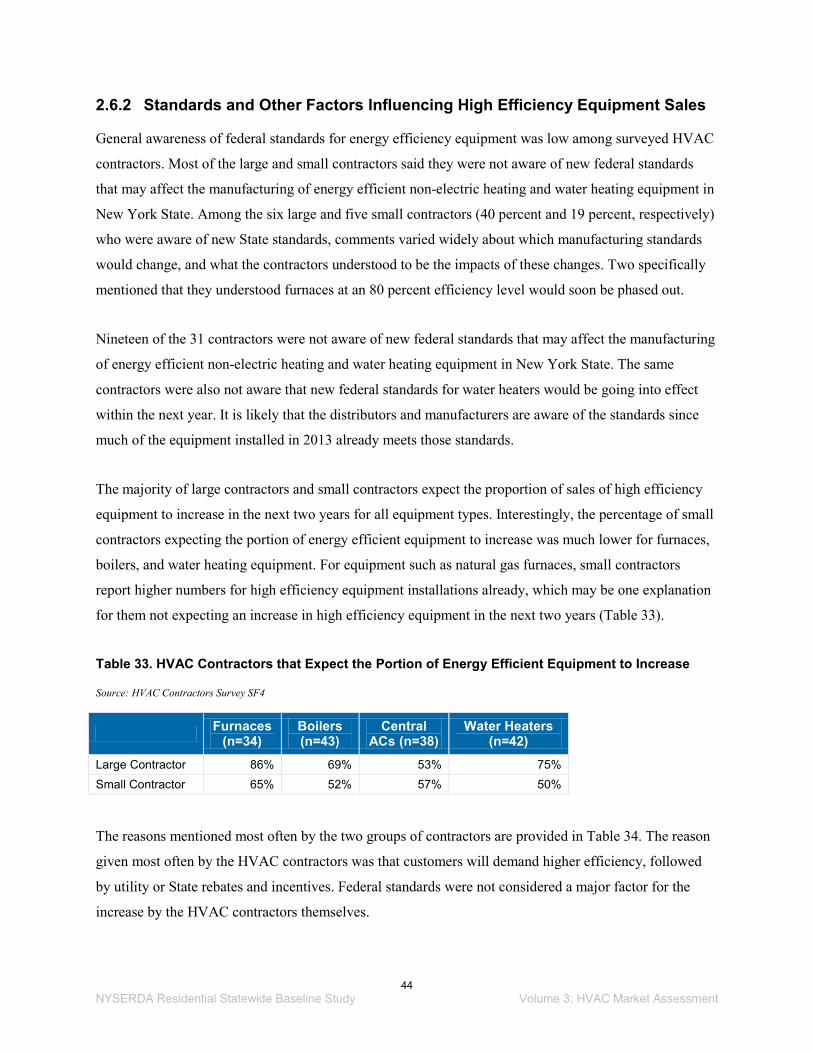
2.6.2 Standards and Other Factors Influencing High Efficiency Equipment Sales
General awareness of federal standards for energy efficiency equipment was low among surveyed HVAC
contractors. Most of the large and small contractors said they were not aware of new federal standards
that may affect the manufacturing of energy efficient non-electric heating and water heating equipment in
New York State. Among the six large and five small contractors (40 percent and 19 percent, respectively)
who were aware of new State standards, comments varied widely about which manufacturing standards
would change, and what the contractors understood to be the impacts of these changes. Two specifically
mentioned that they understood furnaces at an 80 percent efficiency level would soon be phased out.
Nineteen of the 31 contractors were not aware of new federal standards that may affect the manufacturing
of energy efficient non-electric heating and water heating equipment in New York State. The same
contractors were also not aware that new federal standards for water heaters would be going into effect
within the next year. It is likely that the distributors and manufacturers are aware of the standards since
much of the equipment installed in 2013 already meets those standards.
The majority of large contractors and small contractors expect the proportion of sales of high efficiency
equipment to increase in the next two years for all equipment types. Interestingly, the percentage of small
contractors expecting the portion of energy efficient equipment to increase was much lower for furnaces,
boilers, and water heating equipment. For equipment such as natural gas furnaces, small contractors
report higher numbers for high efficiency equipment installations already, which may be one explanation
for them not expecting an increase in high efficiency equipment in the next two years (Table 33).
Table 33. HVAC Contractors that Expect the Portion of Energy Efficient Equipment to Increase
Source: HVAC Contractors Survey SF4
Furnaces (n=34)
Boilers (n=43)
Central ACs (n=38)
Water Heaters (n=42)
Large Contractor 86% 69% 53% 75% Small Contractor 65% 52% 57% 50%
The reasons mentioned most often by the two groups of contractors are provided in Table 34. The reason
given most often by the HVAC contractors was that customers will demand higher efficiency, followed
by utility or State rebates and incentives. Federal standards were not considered a major factor for the
increase by the HVAC contractors themselves.
44 NYSERDA Residential Statewide Baseline Study Volume 3: HVAC Market Assessment

Table 34. Reasons Given Most Often for Greater Portion of Energy Efficiency Sales in the Future
Source: HVAC Contractors Survey SF4.
Furnaces (n=29)
Central Air Conditioners
(n=28) Boilers (n=30)
Water Heaters (n=25)
Customers will demand higher efficiency 19 12 16 16 Utility or state rebates and incentives 10 5 11 7 Equipment Costs will come down for EE Equipment 4 1 4 2
HVAC businesses will be better informed or educated on high efficiency 4 4 4 4
Improved or new tech available 4 4 6 5 New federal standards for minimum efficiency of manufactured units 3 3 1 2
Federal tax credits 2 0 2 0
45 NYSERDA Residential Statewide Baseline Study Volume 3: HVAC Market Assessment

Appendix A: Detailed Methodology
A.1 Objective
The HVAC Market Assessment is a key component of the statewide residential baseline study. The
purpose of the HVAC Market Assessment is to identify the baseline conditions for residential non-electric
heating and water heating equipment, central air conditioning, and heat pumps in New York State. The
market assessment describes where the market is now (based on equipment sold or installed in 2012 and
later) and what percent of the equipment currently being sold is high efficiency. This information was
used to establish more accurate baselines for calculating program energy savings and to support program
planning in New York State.
Data to support the market assessment were collected in Web or telephone surveys, on-site inspections,
contractor interviews, and distributor sales reports to determine the baseline efficiency of specific types of
residential heating and cooling equipment installed in New York. Market channels and specification
practices for these technologies were also characterized. This investigation looked at the market
differences throughout the State. When a sufficient number of data points are available, the data are
presented for the three climate zones.
The study focused on units installed in single-family homes and in multifamily buildings with
1 to 4 units, or in townhouse type configurations where individual units have their own heating systems.
Multifamily units with five or more units typically have central systems served by the commercial
equipment contractors, and were not part of this assessment. The purposes of the HVAC contractor
interviews were to determine the efficiency level of equipment currently being installed and gauge
common practices in the HVAC installer and service market. Additionally, the interviews examined
levels of awareness with respect to problems resulting from over sizing, leaky ducts, air distribution
system design, and charging deficiencies. Elements of common practice explored included, but were not
limited to:
• Practice, techniques, and experiences with sizing new systems and retrofit systems. • Designing, installing, replacing, and fixing air distribution systems. • Recommending and specifying system efficiencies. • Diagnosing techniques for ensuring adequate system refrigerant charging.
A-1 NYSERDA Residential Statewide Baseline Study Volume 3: HVAC Market Assessment

Data were provided to NYSERDA from D&R International through an agreement with Heating Air-
conditioning & Refrigeration Distributors International (HARDI). D&R provided estimates of annual
sales data for 2013 for central air conditioners, central heat pumps, furnaces, and boilers. The HARDI
data was used to estimate the percentage sales by efficiency level for those equipment types. In addition,
2009 U.S. Census data and telephone and Web surveys reporting type and age of equipment were used to
confirm the annual HARDI sales data reported by D&R. Further, equipment type and efficiency levels of
equipment reported from the on-site inspection data for new single-family homes and new equipment
(2012 and later) were also used as a comparison to HVAC contractor survey reports and HARDI data.
The approach included a combination of cold calling by a Tetra Tech scheduler and emailing, when email
addresses were available. The calling began May 5, 2014, by one of Tetra Tech’s senior interviewers. Due
to the low response rate after one month of calling, Tetra Tech revised the letter requesting participation.
NYSERDA mailed these letters in early June 2014. A few additional HVAC Contractor Surveys were
completed that seemed to be helped by the mailing. Due to very low response rates, calling was
suspended as of July 14, 2014, for the summer season, when the HVAC contractors were very busy and
non-responsive. On September 8, 2014, calling resumed for HVAC contractor interviews with a team of
consultants and experienced interviewers, a streamlined survey instrument, additional sample, and a more
compelling script for the letter and email introduction. The HVAC contractor calling continued through
September 25, 2014.
The decision was made to not include a financial incentive (e.g., a gift card) to the HVAC contractors for
completing the survey. They were offered an aggregate summary of the key results of the HVAC
Contractor Surveys as a non-financial incentive.
A.2 Sampling Strategy
The source of the HVAC contractor population and sample for telephone surveys were identified through
http://companies.findthebest.com/. Using http://companies.findthebest.com/, the evaluation team was able to
identify more than 18,000 contractors within New York State who fit into the target group for the HVAC
market assessment. In addition, the database included, and could be sorted by, the number of employees
and annual sales volume. Tetra Tech reviewed other HVAC contractor list sources, but a number of these
other sources were not comprehensive. For example, some limited their lists to those HVAC businesses
with NATE (North American Technician Excellence) certification. The http://www.yellowpages.com/
was also fairly comprehensive but did not include data to indicate company size.
A-2 NYSERDA Residential Statewide Baseline Study Volume 3: HVAC Market Assessment

The initial sample was drawn from http://companies.findthebest.com/database from each of the three climate
zones. Slightly more than 90 percent of the population of HVAC contractors listed in the database are
considered small businesses with 0–10 employees.
The sampling strategy established targets of 20 (10 small and 10 large) for each climate zone with at least
one large contractor and one small contractor in each of the 10 regions to ensure statewide representation.
If there were multiple climate zones in a region, the targets included at least one from each climate zone
in the region. The targets were somewhat proportional to the population of residential homes, which
should be somewhat representative of the equipment sold in that county or region. The sampling was
adjusted for locations such as North Country where there are few, if any, large HVAC businesses.
The HVAC contractor sample lists were developed manually by pulling up individual counties in the
http://companies.findthebest.com/ database because the system did not allow for a download of a list of
contractors. Counties with the largest populations of residential households were drawn first to provide
the largest number of HVAC contractor sample. The final number of contractors are shown in Table A-1.
Table A-1. Population of HVAC Contractors in New York State
Source: companies.findthebest.com/ Construction: Specialty Trade Contractors > Building Equipment Contractors > Plumbing, Heating, and Air-Conditioning Contractors
Climate Zone
Population of NYS HVAC Contractors HVAC Contractor Survey Responses
Large Contractors (more than 10 employees)
Small Contractors (0–10 employees)
Large Contractors
Small Contractors
Climate zone 4 1,338 13,160 8 8 Climate zone 5 302 2,802 9 5 Climate zone 6 46 582 1 15 Total 1,686 16,544 18 28
Although http://companies.findthebest.com/ was deemed the most comprehensive data set, there were still a
high number of ineligibles in the sample drawn from that database. Ineligible businesses included: (a)
sold commercial equipment only, (b) did not sell any of the equipment in the HVAC assessment, (c) out
of business or retired, or (d) deceased. Over 20 percent of the large contractors were ineligible for the
study as shown in Table A-2.
A-3 NYSERDA Residential Statewide Baseline Study Volume 3: HVAC Market Assessment

Table A-2. Total Sample Count and Ineligible Subset Count by Climate Zone
Type
Climate Zone 4 Climate Zone 5 Climate Zone 6 Overall Statewide
Sample Count
Ineligible Count
Ineligible Percent
Sample Count
Ineligible Count
Ineligible Percent
Sample Count
Ineligible Count
Ineligible Percent
Sample Count
Ineligible Count
Ineligible Percent
Large 300 64 21% 89 21 24% 83 22 27% 472 107 23% Small 186 16 9% 133 12 9% 111 15 14% 430 43 10% Total 486 80 16% 222 33 15% 194 37 19% 902 150 17%
A-4 NYSERDA Residential Statewide Baseline Study Volume 3: HVAC Market Assessment

A.3 Response Rates
After one month of calling, Tetra Tech’s senior interviewer had completed eight interviews with three
more interviews that still needed the HVAC contractor to send in the equipment sales and efficiency
data. To calculate a very rough response rate in early July, the response rate was about three percent
(17 completes/640 sample).
As of July 9, 18 full completes and nine partial completes (needing sales and efficiency data tables) were
done with 284 hours, so over 10 hours of interviewer time per complete. The total hours including
recruiting were over 400 for this task.
As of July 14, 2014, the HVAC contractor calling was suspended until September 8, 2014, because the
summer cooling season was at its peak and the response rates were minimal.
The response rates continued to be very low through the survey as shown in this summary that reported
on one of the last months of calling, which was September 2014. Tetra Tech was using experienced
consultants and interviewers to do the calling with the following results:
• Made over 1,000 unique calls in September. • Completed 19 total interviews, and collected another three partial interviews. • Partial completes typically are missing sales data, which was especially difficult for small
business owners to produce.
Table A-3 highlights the difficulty of contacting and completing calls with this particular population when
calling resumed in September.
A-5 NYSERDA Residential Statewide Baseline Study Volume 3: HVAC Market Assessment

Table A-3. HVAC Contractor Calling September 2014 Response Rates
Climate Zone 4 –
Large & Small
Contractors
Climate Zone 5 – Large & Small
Contractors
Climate Zone 6 – Large & Small
Contractors
Overall Statewide
Number of cases attempted 367 124 121 612 New cases not attempted 33 0 0 33 Number of calls made 469 201 402 1,072 Number of emails/faxes sent 13 50 30 93 Cases finalized 244 6 28 278 Completed interviews 11 4 4 19 Completed Interview - partial 0 1 2 3 Hours used 46 24 56 126 Response rate 3.0% 4.0% 5.0% 3.6%
The overall barriers to completing HVAC Contractor Surveys were identified by the interviewers:
• Contractors very rarely returned any voicemails or emails. • Contractors in general are active, in the field, and focused on customer service. It is difficult to
get their attention or time. • Interviewers were at the mercy of weather or other active times that created windows of
contractor unavailability (due to customer call volume or field work).
The specific barriers for small HVAC contractor firm included:
• The owner is often the only person with key data. These owners are often (a) extremely busy, and (b) in the field all day.
• Small HVAC contractors are difficult to reach and their cell number was not available in the sample file. This presented challenges in reaching key contacts during the day. Getting cell numbers of contractors from answering machines or services occasionally yielded a completed survey after additional dials.
• Small businesses within the sample files frequently use answering services. Messages left with these services or contacts were not returned.
A-6 NYSERDA Residential Statewide Baseline Study Volume 3: HVAC Market Assessment

The specific barriers for large HVAC contractor firms included:
• Key interviewees at large HVAC companies are often difficult to reach because he or she is not the individual answering the phone; calls are often fielded by a receptionist. The interviewer often did not get to have that initial conversation with a large HVAC contractor in question. Messages are rarely returned.
• Companies that appear to be “large” (more than 10 employees) in the sample file (from FindtheBest) were not large contractors. They did not have enough employees to qualify as a completed “large” interview (that problem was especially apparent in climate zone 6).
• Large companies in the sample file were often commercial-only businesses, and not ultimately eligible for this study. Again, this barrier was especially apparent in climate zone 6.
A.4 Weighting
The Tetra Tech evaluation team attempted to weight the responses by using the size of the HVAC
contractor (one to 10 employees for small and over 10 employees for large contractors) and the number of
each of those businesses in each county. When the weights were applied to the annual sales reported by
the HVAC contractors and rolled up, the total sales appeared to be two to four times what was being
reported for 2013 HARDI annual sales by D&R International. The conclusion was that the HVAC
contractors likely over-reported their annual sales since the HARDI data was confirmed as reasonable by
other sources. For that reason, the decision was made to simply report unweighted responses by the two
types of businesses—large and small contractors.
A.5 Data Limitations and Suggestions for Future Studies
The following were elements of the methodology that worked well for the HVAC Market Assessment:
• The FindtheBest database was effective in identifying the complete population of HVAC contractors throughout New York State. The database allowed for stratifying by large contractors and small contractors. In addition, the population could be summarized by county and subsequently by climate zone.
• The approach of using triangulation of various data sources—HVAC Contractor Surveys, HARDI data, and on-site inspection data collection at single-family homes—was effective in confirming data and identifying questionable results.
A-7 NYSERDA Residential Statewide Baseline Study Volume 3: HVAC Market Assessment

Some of the data limitations and suggested changes for future studies are as follows:
• More resources should be devoted to developing sample lists from FindtheBest including pre-screening to ensure size of business and eligibility.
• Emails and mailings should be sent out, preferably from NYSERDA, to introduce HVAC contractors to the study and engage their cooperation. A possible value proposition may be complimentary passes to training sessions.
• The annual sales data may have been overstated by individual HVAC contractors. Future studies should continue to include HARDI data for annual sales and possibly for efficiency levels. Water heaters should be added if possible.
• The survey covered many different topics and was at least a half hour or longer, depending on the number of equipment types, out of the busy day for an HVAC contractor. A separate survey should be conducted to gather just the information on sales and efficiency levels of installed equipment in the future, especially as new equipment standards are announced and implemented. In addition, repeating that portion of the survey and a few other questions would allow NYSERDA to track market effects from market transformation activities.
A-8 NYSERDA Residential Statewide Baseline Study Volume 3: HVAC Market Assessment

Appendix B: HVAC Contractors Instrument
NYSERDA RESIDENTIAL BASELINE STUDY – HVAC CONTRACTOR SURVEY CODEBOOK
NOTE:
- Variable names are in bold type.
- A code of (-1) means that the data was not gathered for a particular question in the July fielding period because the question had been updated.
- A code of (-2) means that the data was not gathered for a particular question in the September fielding period because the question had been updated.
- A code of (-6) means programmed skip or an expected missing (i.e., a skip that was purposely programmed based, or the respondent was not expected to answer a question based on previous survey data responses.
- A code of (-8) means don’t know.
- A code of (-9) means refused or missing.
- Questions were asked of all respondents unless indicated otherwise.
CONTRACTOR Contractor company name
CITY Contractor location – city (in the State of New York)
TYPE Small (<=10 employees) or large (>10 employees)
COUNTY County where the HVAC contractor is located
CLIMATE ZONE Climate zone where the HVAC contractor is located
CASEID Unique case identifier
B-1 NYSERDA Residential Statewide Baseline Study Volume 3: HVAC Market Assessment
TELEPHONE INTRODUCTION
INTRO Hello, my name is [NAME] and I’m calling on behalf of NYSERDA. We are conducting a study about the residential HVAC market. In particular, we are interested in natural gas and oil-fired heating equipment and water heaters, central air conditioning and heat pumps sold and installed in the state of New York.
I1 Are you the person most familiar with your company’s heating and cooling equipment sales, installation, servicing and maintenance practices in the state of New York?
1 Yes [SKIP TO C1] 2 No -8 Don’t know
I2 Is there another contact we should speak to who may be familiar with the company’s heating and cooling equipment sales, products and services?
1 Yes [GET CONTACT NAME AND BEGIN INTERVIEW AGAIN] 2 No [TERMINATE] -8 Don’t know [TERMINATE]
INTRO_1 I'm with Tetra Tech, an independent research firm. This is not a sales call; we are contacting HVAC professionals on behalf of the New York State Energy Research and Development Authority (NYSERDA) in order to learn more about the residential HVAC market in the state of New York. The information will be used to develop programs in New York State to promote the sale and installation of efficient HVAC equipment. Do you sell or install heating and cooling equipment for residential homes in New York State?
[IF NOT, TERMINATE THE SURVEY AND RECORD DISPOSITION. OTHERWISE, CONTINUE]
While we are on the phone, may I email or fax you a letter now from NYSERDA explaining the study and listing the categories of equipment that we will ask about. (Ask for email and/or fax)
[IF THEY PREFER TO COMPLETE THE ENTIRE SURVEY ON THEIR OWN, ASK]:
B-2 NYSERDA Residential Statewide Baseline Study Volume 3: HVAC Market Assessment
We can also email or fax you the full survey, and we would like to follow-up with you within the next 10 days to see if you have been able to complete the survey or have any questions. When is the best day and time to reach you?
Please be assured that the information you provide will be kept confidential to the extent permitted by law. NYSERDA’s analysis will only use summary level data and will not identify individual respondents or firms. Your participation in this study is very important to ensure any new energy efficiency programs will help you provide the most value in serving your customers.
Would it be okay if I recorded our conversation to make sure that I’m capturing all the necessary information?
[READ IF NEEDED: If you would like to talk with a representative of NYSERDA to verify this study, please call 1-877-NYSMART (1-877-697-6278), or email at [email protected], or visit the web-site at http://www.nyserda.ny.gov/energystudyinfo.]
HVAC CONTRACTOR COMPANY INFORMATION
We will be asking questions about your company’s sales and installation of central air conditioning, non-electric heating equipment such as natural gas and oil-fired furnaces, boilers, and water heaters.
C1 Does your company sell, install, or service air conditioners, heat pumps, furnaces, boilers, or water heaters for single-family residential customers in the state of New York? By single-family residential, I mean residential dwellings that include 1 to 4 living units in the building.
1 Yes 2 No [THANK AND TERMINATE]
C2a PHASE ONE (July) QUESTION ONLY: What types of equipment do you sell for single-family (1 to 4 unit) homes? [READ CATEGORIES; SELECT ALL THAT APPLY]
For C2a_1 through C2a_9
0 Does not sell equipment type 1 Does sell equipment type -2 Question not asked during September fielding
B-3 NYSERDA Residential Statewide Baseline Study Volume 3: HVAC Market Assessment

C2a_1 Residential furnaces
C2a_2 Residential boilers
C2a_3 Storage tank water heaters
C2a_4 Tankless water heaters
C2a_5 Central air conditioners
C2a_6 Heat pumps
C2a_7 Wi-Fi Communicating Thermostats
C2a_8 Boiler Reset Controls
C2a_9 None
C2b What types of equipment do you sell and install in single-family (1 to 4 unit) homes? I’ll read a list of equipment and please indicate whether or not you install each type.
[READ CATEGORIES; SELECT ALL THAT APPLY]
For C2b_1 through C2b_9
0 Does not sell and install equipment type
1 Does sell and install equipment type
C2b_1 Residential furnaces
C2b_2 Residential boilers
C2b_3 Storage tank water heaters
C2b_4 Tankless water heaters
C2b_5 Central air conditioners
C2b_6 Heat pumps
C2b_7 Wi-Fi Communicating Thermostats
C2b_8 Boiler Reset Controls
C2b_9 None
B-4 NYSERDA Residential Statewide Baseline Study Volume 3: HVAC Market Assessment

C2c PHASE ONE (July) QUESTION ONLY: What types of equipment do you repair or maintain in single-family (1 to 4 unit) homes? [READ CATEGORIES; SELECT ALL THAT APPLY]
For C2c_1 through C2c_7
0 Does not repair equipment type 1 Does repair equipment type -2 Question not asked during September fielding
C2c_1 Residential furnaces
C2c_2 Residential boilers
C2c_3 Storage tank water heaters
C2c_4 Tankless water heaters
C2c_5 Central air conditioners
C2c_6 Heat pumps
C2c_7 Wi-Fi Communicating Thermostats
C3 PHASE ONE QUESTION ONLY: Approximately what percent of your residential business (in terms of % of jobs) is? (PROBE: All three categories should add up to 100%)
C3_1 % residential, single-family homes defined as 1- to 4-family buildings, including free-standing homes and townhouses [IF ZERO, THANK AND TERMINATE]
C3_2 % multifamily low-rise buildings with 5 or more units in 3 stories or less
C3_3 % multifamily high rise buildings with more than 4 stories and 5 or more units
C4 Approximately how long has your company been providing HVAC services to customers located in the State of New York?
C4_1 Months
C4_2 Years
C4_3 Other response
B-5 NYSERDA Residential Statewide Baseline Study Volume 3: HVAC Market Assessment

C5 In what New York State Counties are your residential single-family home customers located?
[DO NOT READ LIST; SELECT ALL THAT APPLY]
For C5_1 through C5_OTHER
___ Name of county 0 No more counties mentioned
C5_1 First County Mentioned by Respondent
C5_2 Second County Mentioned by Respondent
C5_3 Third County Mentioned by Respondent
C5_4 Fourth County Mentioned by Respondent
C5_5 Fifth County Mentioned by
C5_OTHER Other County Mentioned by Respondent [SPECIFY]
B-6 NYSERDA Residential Statewide Baseline Study Volume 3: HVAC Market Assessment
FIPS Code County FIPS
Code County FIPS Code County FIPS
Code County
001 Albany County 033 Franklin
County 065 Oneida County 097 Schuyler
County
003 Allegany County 035 Fulton
County 067 Onondaga County 099 Seneca
County
005 Bronx County 037 Genesee
County 069 Ontario County 089 St. Lawrence
County
007 Broome County 039 Greene
County 071 Orange County 101 Steuben
County
009 Cattaraugus County 041 Hamilton
County 073 Orleans County 103 Suffolk
County
011 Cayuga County 043 Herkimer
County 075 Oswego County 105 Sullivan
County
013 Chautauqua County 045 Jefferson
County 077 Otsego County 107 Tioga County
015 Chemung County 047 Kings
County 079 Putnam County 109 Tompkins
County
017 Chenango County 049 Lewis
County 081 Queens County 111 Ulster County
019 Clinton County 051 Livingston
County 083 Rensselaer County 113 Warren
County
021 Columbia County 053 Madison
County 085 Richmond County 115 Washington
County
023 Cortland County 055 Monroe
County 087 Rockland County 117 Wayne
County
025 Delaware County 057 Montgomery
County 091 Saratoga County 119 Westchester
County
027 Dutchess County 059 Nassau
County 093 Schenectady County 121 Wyoming
County
029 Erie County 061 New York County 095 Schoharie
County 123 Yates County
031 Essex County 063 Niagara
County
B-7 NYSERDA Residential Statewide Baseline Study Volume 3: HVAC Market Assessment

SALES AND INSTALLATION OF EQUIPMENT BY EFFICIENCY LEVELS
AW How familiar are you with the Consortium for Energy Efficiency (CEE) and ENERGY STAR Tiered efficiency levels? These are generally categorized into two or three Tiers of efficiency levels. NYSERDA and many of the electric and natural gas utilities in New York State used these Tiers to establish rebate levels. Would you say you are very familiar, somewhat familiar, not too familiar or not at all familiar with these Tiered efficiency levels?
1 Very familiar 2 Somewhat familiar 3 Not too familiar 4 Not at all familiar -8 Don’t know -9 Missing
SF1 I will be asking about your company’s sales and installation of residential heating and cooling equipment that you indicated you sell and install in New York State. For each residential equipment type, we would like:
The total amount of the residential units you sold in 2013 by equipment category? [RECORD IN TABLE BELOW]
The percent or number sold and installed in 2013 at the different efficiency levels? [RECORD IN TABLE BELOW]
For SF1_1_Total through SF1_2_T1 -- (Equip type: furnaces)
_____ Number of units -6 Expected missing -9 Missing
SB1_1_Total through SB1_2_T1 – Equip type: boilers
SW1_1_Total through SW1_4_T1 – Equip type: water heaters
AC1_1_Total through AC1_2_T2 – Equip type: central air conditioners
HP1_1_Total through HP1_3_T2 – Equip type: heat pumps.
SF2 The efficiency level that you most recommend to your customers? [RECORD IN TABLE BELOW]
SF5 About how many of each type of equipment have you serviced in the past 12 months in New York State?
B-8 NYSERDA Residential Statewide Baseline Study Volume 3: HVAC Market Assessment

RESIDENTIAL NATURAL GAS AND OIL-FIRED FURNACES AND BOILERS
Equipment Type Total Units Sold in 2013
Not High Efficiency
Qualify for Tier 1
Qualify for Tier 2
Qualify for Tier 3
Which of these three efficiency levels do you typically
recommend to your customers to purchase? (CHECK ONE)
About how many residential units have you serviced in the
past 12 months in New York State? (CHECK ONE)
Residential Gas Furnaces (<225,000
Btu/h)
# # # # # Res. Gas Furnaces: Res. Gas Furnaces:
SF1_1_Total Less than 90%
AFUE SF1_1_stan
Greater than 90% AFUE
but less than 92%
SF1_1_T1
Greater than
92% AFUE but less
than 94% SF1_1_T2
94% AFUE and above SF1_1_T3
• Standard Eff: (Less than 90% AFUE)
• Tier 1: (90%<92%) • Tier 2: (92%<94%) • Tier 3 (94% and above)
SF2: Phase one (July); asked about residential furnaces overall only. SF2_1_REC: Phase two (Sept); asked about residential gas and oil furnaces separately
0 None 1 Less than 5 2 5 to 20 3 21 to 50 4 51 to 100 5 More than 100 -1 Question not asked during July fielding -2 Question not asked during Sept fielding -6 Expected missing -8 Don’t know -9 Missing
SF5: Phase one (July); asked about residential furnaces overall only SF5_1: Phase two (Sept); asked about residential gas and oil furnaces separately
Residential Oil-fired Furnaces
(<225,000 Btu/h)
# # # NA NA Res. Oil-fired Furnaces: Res. Oil-fired Furnaces:
SF1_2_Total Less than 85% AFUE
SF1_2_stan
85% AFUE and above SF1_2_T1
• Standard Eff: (Less than 85% AFUE)
• Tier 1: (85% and above) SF2_2_REC
0 None 1 Less than 5 2 5 to 20 3 21 to 50 4 51 to 100 5 More than 100 -1 Question not asked during July fielding -9 Missing
SF5_2
B-9 NYSERDA Residential Statewide Baseline Study Volume 3: HVAC Market Assessment

RESIDENTIAL BOILERS
Residential Gas Boilers
(<300,000 Btu/h)
# # # # # Res. Gas Boilers: Res. Gas Boilers:
SB1_1_Total Less than 85%
AFUE SB1_1_stan
Greater than 85% AFUE
but less than 90% AFUE SB1_1_T1
90% AFUE and Above SB1_1_T2
94% AFUE and above SB1_1_T3
• Standard Eff: (Less than 85% AFUE)
• Tier 1: (86%<90%) • Tier 2: (90%<93%) • Tier 3: (94%+)
SB2: Phase one (July); asked about residential boilers overall only. SB2_1_REC: Phase two (Sept); asked about residential gas and oil boilers separately.
0 None 1 Less than 5 2 5 to 20 3 21 to 50 4 51 to 100 5 More than 100 -1 Question not asked during July fielding -2 Question not asked during Sept fielding -8 Don’t know -9 Missing
SB5:_Phase one (July); asked about residential boilers overall only. SB5_1: Phase two (Sept); asked about residential gas and oil boilers separately, by type.
Residential Oil Boilers
(<225,000 Btu/h)
# # # NA NA Res. Oil-fired Boilers: Res. Oil-fired Boilers:
SB1_1_Total Less than 85%
AFUE SB1_2_stan
85% AFUE and
above SB1_2_T1
• Standard Eff: (Less than 85% AFUE)
• Tier 1: (85%+) SB2_2_REC
0 None 1 Less than 5 2 5 to 20 3 21 to 50 4 51 to 100 5 More than 100 -1 Question not asked during July fielding -2 Question not asked during Sept fielding -8 Don’t know -9 Missing
SB5_2
B-10 NYSERDA Residential Statewide Baseline Study Volume 3: HVAC Market Assessment
RESIDENTIAL WATER HEATERS (WH)
Equipment Type Total Units Sold in 2013
Not High Efficiency
Qualify for Tier 1
Qualify for Tier 2
Qualify for Tier 3
Which of these three efficiency levels do
you typically recommend to your
customers to purchase? (CHECK
ONE)
About how many residential units have you
serviced in the past 12 months in New York
State? (CHECK ONE)
Residential Gas Water Heaters--
Storage
# # # # NA Res. Gas Water Heater Storage:
Res. Gas Water Heater Storage:
SW1_1_Total Less than .67 EF
SW1_1_stan
Greater than .67 EF but less
than .80 EF SW1_1_T1
.80 EF and above
SW1_1_T2
• Standard Eff:
(Less than .67 EF)
• Tier 1: (.68-.79 EF)
• Tier 2: (.80 EF and above)
SW2: Phase one (July); asked about residential water heaters overall only. SW2_1_REC: Phase two (Sept); asked about each residential water heater type separately.
0 None 1 Less than 5 2 5 to 20 3 21 to 50 4 51 to 100 5 More than 100 -1 Question not asked during July fielding -2 Question not asked during Sept fielding -8 Don’t know -9 Missing SW5: Phase one (July); asked about residential water heaters overall only.
SW5_1: Phase two (Sept); asked about residential water heaters separately, by type.
Residential Oil Water Heaters--
Storage
# # # NA NA Res. Oil Water Heater Storage
Res. Oil Water Heater Storage
B-11 NYSERDA Residential Statewide Baseline Study Volume 3: HVAC Market Assessment
RESIDENTIAL WATER HEATERS (WH) -- Continued
8.5
Less than .59 EF
SW1_2_stan
.59 EF and above
SW1_2_T1
• Standard Eff: (Less
than .59 EF) • Tier 1: (.59 EF and
above) SW2_2_REC
0 None 1 Less than 5 2 5 to 20 3 21 to 50 4 51 to 100 5 More than 100 -1 Question not asked during July fielding -8 Don’t know -9 Missing
SW5_2
Residential Gas Water Heaters-
Tankless (Instantaneous)
# # # NA NA Res. Gas Water Heater Tankless:
Res. Gas Water Heater Tankless:
SW1_3_Total Less than .82 EF
SW1_3_stan
.82 EF and above
SW1_3_T1
• Standard Eff: (Less than .82 EF)
• Tier 1: (.82 EF and above)
SW2_3_REC
0 None 1 Less than 5 2 5 to 20 3 21 to 50 4 51 to 100 5 More than 100 -1 Question not asked during July fielding -8 Don’t know -9 Missing
SW5_3
Residential Gas Water Heaters--
Condensing
# # # NA NA Res. Gas Water Heater Condensing:
Res. Gas Water Heater Condensing:
SW1_4_Total Less than .80 EF
SW1_4_stan
.80 EF and above
SW1_4_T1
• Standard Eff: (Less than .80 EF)
• Tier 1: (.80 EF and above)
SW2_4_REC
0 None 1 Less than 5 2 5 to 20 3 21 to 50 4 51 to 100 5 More than 100 -1 Question not asked during July fielding -8 Don’t know -9 Missing
SW5_4
B-12 NYSERDA Residential Statewide Baseline Study Volume 3: HVAC Market Assessment
RESIDENTIAL CENTRAL AIR CONDITIONERS (AC)
Equipment Type Total Units Sold in 2013
Not High Efficiency
Qualify for Tier 1 Qualify for Tier 2
Qualify for Tier 3
Which of these three efficiency levels do you typically recommend to
your customers to purchase? (CHECK ONE)
About how many residential units have
you serviced in the past 12 months in New York State? (CHECK ONE)
Central Air Conditioners—Split Systems
# # # # # Central AC Split Systems: Central AC Split Systems:
AC1_1_Total Less than 14.5 SEER or Less than 12 EER AC1_1_stan
14.5 SEER but less than 15 SEER or 12 EER but less than
12.5 EER AC1_1_T1
15 SEER but less than 16
SEER or 12.5 EER but less than 13
EER AC1_1_T2
16 SEER and Above or 13 EER and Above AC1_1_T3
• Standard Eff: (Less than 14.5 SEER/12 EER)
• Tier 1: (14.5-14.9 SEER/12-12.4 EER)
• Tier 2: 15.0-15.9 SEER/12.5-12.9)
• Tier 3: (16 SEER/13 EER+)
AC2: Phase one (July); asked about residential central air systems overall.
AC2_1_REC: Phase two (Sept); asked about each residential central air units separately by type.
0 None 1 Less than 5 2 5 to 20 3 21 to 50 4 51 to 100 5 More than 100 -1 Question not asked during July fielding -2 Question not asked during Sept fielding -9 Missing AC5: Phase one (July); asked about residential central air units overall only. AC5_1: Phase two (Sept); asked about residential central air units separately by type.
Central Air Conditioners--
Packaged
# # # # NA Central AC Packaged Systems:
Central AC Packaged Systems:
B-13 NYSERDA Residential Statewide Baseline Study Volume 3: HVAC Market Assessment

RESIDENTIAL CENTRIAL AIR CONDITIONERS (AC) continued
AC1_2_Total Less than 14 SEER or Less than 11 EER AC1_2_stan
14 SEER or 11 EER but less than 12
AC1_2_T1
14 SEER and above or 12 EER and above AC1_2_T2
• Standard Eff: (Less
than 14 SEER/11 EER)
• Tier 1: (14 SEER/11 EER)
• Tier 2: (Above 14 SEER/ Above 12 EER) AC2_2_REC
0 None 1 Less than 5 2 5 to 20 3 21 to 50 4 51 to 100 5 More than 100 -1 Question not asked during July fielding -9 Missing
AC5_2
B-14 NYSERDA Residential Statewide Baseline Study Volume 3: HVAC Market Assessment

AIR SOURCE HEAT PUMPS (HP)
Equipment Type
Total Units Sold in 2013
Not High Efficiency
Qualify for Tier 1 Qualify for Tier 2
Qualify for Tier 3
Which of these three efficiency levels do you
typically recommend to your customers to purchase?
(CHECK ONE)
About how many residential units have you
serviced in the past 12 months in New York
State? (CHECK ONE)
Heat Pumps—Split Systems
# # # # NA Heat Pumps Split Systems: Heat Pumps Split Systems:
HP1_1_Total Less than 14.5 SEER or Less
than 12 EER or Less than 8.2
HSPF HP1_1_stan
14.5 SEER to less than 15
SEER or 12 EER to less than 12.5 EER or 8.2 HSPF to less than 8.5
HSPF HP1_1_T1
15 SEER or 12.5 EER or
8.5 HSPF HP1_1_T2
• Standard Eff: (Less than 14.5 SEER/12) EER
• Tier 1: (14.5-14.9 SEER/12-12.4 EER)
• Tier 2: 15.0 SEER/12.5 EER and Above
HP2: SPECIAL NOTE: Phase one (July) did NOT record recommended efficiency levels overall for Heat Pumps. HP2_1_REC: Phase two (Sept); asked about each residential heat pumps separately by type
0 None 1 Less than 5 2 5 – 20 3 21 – 50 4 51 – 100 5 More than 100 -8 DON’T KNOW HP5: SPECIAL NOTE: Phase one (July); asked about residential heat pump servicing overall. HP5_1: Phase two (Sept); asked about residential heat pumps separately by type.
Heat Pumps— Packaged Systems
# # # # NA Heat Pumps Packaged Systems:
Heat Pumps Packaged Systems:
HP1_2_Total Less than 14 SEER or less than
11 EER or less than 8.0 HSPF
HP1_2_stan
14 SEER or 11 EER
or 8 HSPF
HP1_2_T1
14+ SEER or 12+ EER
or 8+ HSPF
HP1_2_T2
• Standard Eff: (Less than
14 SEER/11 EER • Tier 1: (14
SEER/11EER) • Tier 2: (Above 14 SEER/
Above 12 EER)
HP2_2_REC
0 None 1 Less than 5 2 5 – 20 3 21 – 50 4 51 – 100 5 More than 100 -8 DON’T KNOW
HP5_2
B-15 NYSERDA Residential Statewide Baseline Study Volume 3: HVAC Market Assessment

AIR SOURCE HEAT PUMPS (HP)
Ductless Mini-Split
Heat Pumps
# # # # NA Ductless Mini-Split Heat Pumps:
Ductless Mini-Split Heat Pumps:
HP1_3_Total Less than 14 SEER or less than
11 EER or less than 8.0 HSPF HP1_3_stan
14 SEER 11 EER 8 HSPF
HP1_3_T1
14+ SEER 12+ EER 8+
HSPF HP1_3_T2
• Standard Eff: (Less than
14 SEER/11 EER) • Tier 1: (14
SEER/11EER) • Tier 2: (Above 14 SEER/
Above 12 EER)
HP2_3_REC
0 None 1 Less than 5 2 5 – 20 3 21 – 50 4 51 – 100 5 More than 100 -8 DON’T KNOW
HP5_3
B-16 NYSERDA Residential Statewide Baseline Study Volume 3: HVAC Market Assessment

SF3 Do you typically maintain a stock of the following residential equipment or do you order the needed equipment directly from stores, distributors, or manufacturers on a case-by-case basis?
1 Maintain a stock 2 Purchase directly from store [WHICH ONES] 3 Order from distributor [WHICH ONES] 4 Order from manufacturer representative [WHICH ONES] 5 Other [SPECIFY] -6 Expected missing -9 Missing
1 Maintain a stock (Check Box)
2 Purchase directly from store (list which ones)
3 Order from distributor (list which ones)
4 Order from manufacturer representative (list which ones)
5 Other
SF3. Res. Natural Gas & Oil-fired Furnaces
SF3_1 SF3_2
SF3_2VERBATIM
SF3_3
SF3_3VERBATIM
SF3_4
SF3_4VERBATIM
SF3_OTHER
SB3. Res. Natural Gas & Oil Fired Boilers
SB3_1 SB3_2
SB3_2VERBATIM
SB3_3
SB3_3VERBATIM
SB3_4
SB3_4VERBATIM
SB3_OTHER
SW3. Res. Non-electric Water Heaters
SW3_1 SW3_2
SW3_2VERBATIM
SW3_3
SW3_3VERBATIM
SW3_4
SW3_4VERBATIM
SW3_OTHER
AC3. Res. Central AC
AC3_1 AC3_2
AC3_2VERBATIM
AC3_3
AC3_3VERBATIM
AC3_4
AC3_4VERBATIM
AC3_OTHER
HP3. Res. Heat Pumps
HP3_1 HP3_2
HP3_2VERBATIM
HP3_3
HP3_3VERBATIM
HP3_4
HP3_4VERBATIM
HP3_OTHER
B-17 NYSERDA Residential Statewide Baseline Study Volume 3: HVAC Market Assessment

SF4 For the equipment types that you sell and install, do you expect the proportion of sales of equipment that are high efficiency compared to standard efficiency to increase over the next two years? If yes, why do you think that will happen and for which equipment types? [DO NOT READ LIST; SELECT ALL MENTIONED]
1 Equipment costs will come down [FOR WHICH EQUIPMENT TYPES] 2 Customers will demand higher efficiency [FOR WHICH EQUIPMENT
TYPES] 3 New Federal Standards for minimum efficiency of manufactured units
[FOR WHICH EQUIPMENT TYPES] 4 Federal Tax Credits [FOR WHICH EQUIPMENT TYPES] 5 Utility or state rebates and incentives [FOR WHICH EQUIPMENT
TYPES] 6 HVAC businesses will be better informed/educated on high efficiency 7 Improved or new technologies available [FOR WHICH EQUIPMENT
TYPES] 8 Other [SPECIFY]
For all variables in the table below, values are as follows:
1 Yes 0 No -6 Expected Missing -8 Don't know -9 Missing
SF4. Res. Natural Gas & Oil-fired Furnaces
SB4. Res. Natural Gas & Oil Fired Boilers
SW4. Res. Non-electric Water Heaters
AC4. Res. Central AC
HP4. Res. Heat Pumps
Expect high-efficiency sales to increase (Yes/No) If Yes – indicate reasons below:
SF4
SB4
SW4
AC4
NA in dataset
B-18

1 Equipment costs will come down
SF4_1 SB4_1 SW4_1 AC4_1 HP4_1
2 Customers will demand higher efficiency
SF4_2 SB4_2 SW4_2 AC4_2 HP4_2
3 New Federal Standards for minimum efficiency of manufactured
SF4_3 SB4_3 SW4_3 AC4_3 HP4_3
4 Federal Tax Credits
SF4_4 SB4_4 SW4_4 AC4_4 HP4_4
5 Utility or state rebates and incentives
SF4_5 SB4_5 SW4_5 AC4_5 HP4_5
6 HVAC businesses will be better informed/ educated on high efficiency
SF4_6 SB4_6 SW4_6 AC4_6 HP4_6
7 Improved or new technologies available
SF4_7 SB4_7 SW4_7 AC4_7 HP4_7
8 Other SF4_8 SB4_8 SW4_8 AC4_8 HP4_8
Other_Specify
SF4_8_Specify
SB4_8_Specify
SW4_8_Specify
AC4_8_Specify
HP4_8_Specify
B-19

OIL-TO-NATURAL GAS CONVERSIONS, EARLY RETIREMENT, AND OTHER SPECIAL EQUIPMENT
SF6 Approximately what percent of the natural gas furnaces that you sold in New York State in the past 12 months have been oil-to-natural gas conversions?
[PROBE: An oil to natural gas conversion refers to replacing an oil furnace with a natural gas furnace.]
_____ [RECORD PERCENTAGE] -6 Expected missing -9 Missing
SB6 Approximately what % of the natural gas boilers that you sold in New York State in the past 12 months have been oil-to-natural gas conversions?
_____ [RECORD PERCENTAGE] -6 Expected missing -9 Missing
SW6 Approximately what % of the natural gas water heaters that you sold in New York State in the past 12 months have been oil-to-natural gas conversions?
_____ [RECORD PERCENTAGE] -6 Expected missing [IF RESPONDENT DID NOT SELL FURNACES
IN 2013] -9 Missing
SW7 Approximately what % of the natural gas or oil water heaters that you sell are heat pump water heaters?
_____ [RECORD PERCENTAGE] -6 Expected missing [IF RESPONDENT DID NOT SELL FURNACES IN
2013] -9 Missing
B-20

PA6 Have you observed any increase in the number of units of equipment that are now being retired early versus replaced on failure?
1 Yes 2 No -6 Expected Missing -8 Don't know -9 Missing
PA6a [IF PA6=1] For what types of equipment?
How large of an impact in terms of percentage of units? [PROBE AND ENTER ZERO IF NO IMPACT]
For PA6a_1 through PA6a_6
_____% [RECORD PERCENTAGE]
PA6a_1 Residential furnaces
PA6a_2 Residential boilers
PA6a_3 Tank (storage) water heaters
PA6a_4 Tankless water heaters
PA6a_5 Central air conditioners
PA6a_6 Heat pumps
PA7 How many Wi-Fi Communicating Thermostats have you sold and installed in the past 12 months for residential homes in New York State?
For PA7_1 through PA7_2
_____ [RECORD NUMBER]
PA7_1 Number sold
PA7_2 Number installed
PA8 How many Boiler Reset Controls have you sold and installed in the past 12 months for residential homes in New York State?
B-21

For PA8_1 through PA8_2
_____ [RECORD NUMBER]
PA8_1 Number sold
PA8_2 Number installed
QUALITY INSTALLATION AND MAINTENANCE PRACTICES
IM1 [IF INSTALL] What industry sources do you primarily use as references to ensure quality installation of residential HVAC equipment? [DO NOT READ LIST; SELECT ALL MENTIONED]
For IM1_1 through IM1_7
1 Affirmative answer; source is used 2 No, or source not mentioned -6 Expected Missing -8 Don't know -9 Missing
IM1_1 Air Conditioning Contractors of America (ACCA)
IM1_2 American Society of Heating, Refrigerating, and Air-Conditioning Engineers (ASHRAE)
IM1_3 Plumbing, Heating-Cooling Contractors National Association (PHCC)
IM1_4 North American Technician Excellence,(NATE)
IM1_5 Building Performance Institute (BPI)
IM1_6 Other [SPECIFY]
IM1_7 None
IM1_6_specify Other industry source used as reference
B-22

[RECORD FIRST MENTIONS]
IM2 Does your firm require HVAC technicians attend training courses on energy efficiency, quality maintenance, or quality installation?
1 Yes 2 No -6 Expected Missing -8 Don't know -9 Missing
IM2_ [IF IM2=1] What type(s) of training(s) and from what organizations?
[DO NOT READ LIST; SELECT ALL THAT APPLY]
For IM2_1 through IM2_6
1 Affirmative answer; training is required 2 Answer not chosen
IM2_1 Electrical
IM2_2 Plumbing
IM2_3 Air Conditioning Contractors of America (ACCA)
IM2_4 Air-Conditioning, Heating, and Refrigeration Institute (AHRI)
IM2_5 Utility-sponsored Training on Efficient
IM2_6 Other [SPECIFY]
IM2_6_specify Other type of training.
IM3 Does your firm require HVAC technicians obtain industry certification?
1 Yes 2 No -6 Expected Missing -8 Don't know -9 Missing
B-23
IM3_ [IF IM3=1] What type(s) of certification(s)?
[DO NOT READ LIST; SELECT ALL THAT APPLY]
For IM3_1 through IM3_4
1 Affirmative answer; training is required 2 Answer not chosen
IM3_1 North American Technician Excellence,(NATE)
IM3_2 Building Performance Institute (BPI)
IM3_3 EPA HVAC Certification
IM3_4 Other [SPECIFY]
IM3_specify Other type of certification.
WE Thinking of all of the equipment that you sell or install such as furnaces, boilers, water heaters, central air conditioners and heat pumps; did any major weather events or other events affect your inventory or sales of high efficient equipment in 2013 in any way? (Probe on Hurricane Sandy in late 2012 and the unusually cold and long 2013–2014 Winter) If so, how were sales or installations or inventory affected?
1 Yes 2 No 3 Not Sure -9 Missing
WE_1 How were sales and inventory affected?
QUALITY DESIGN ASPECTS
D1 On a scale of 1 to 5, where 1 = not at all proficient, and 5 = extremely proficient, please rate how skilled your firm is in the following areas. How skilled is your firm in the area of:
For D1_A through D1_D
1 Not at all proficient 2 Not very proficient 3 Somewhat Proficient
B-24

4 Very Proficient 5 Extremely proficient -8 Don't know -9 Missing
D1_A Practices, techniques and experiences with sizing new systems?
D1_B Designing, installing, replacing and fixing air distribution systems?
D1_C Recommending and specifying system efficiencies?
D1_D Diagnosing techniques for ensuring adequate system refrigerant charging?
B-25

D2 When installing new residential HVAC (heating, ventilation, and cooling) equipment, on a scale of 1 to 5, where 1 = usually not done, and 5 = always done, please indicate how often you would perform the following tests. How often, using the scale of 1 to 5, would you:
[READ EACH ONE; RECORD RATING]
For D2_A through D2_H
1 Usually not done 2 Rarely done 3 Sometimes done 4 Often done 5 Always done -8 Don't know -9 Missing
D2_A Conduct building ventilation calculations
D2_B Conduct heat loss and heat gain load calculations for installations or replacements
D2_C Ensure the load equipment is properly sized and selected prior to installation
D2_D Confirm heating and cooling equipment are properly matched systems using industry-recognized product certification database such as AHRI, CEE, or OEM performance data
D2_E Verify the airflow through the indoor blower unit (e.g., furnaces, fan coil, air handler) is within acceptable CFM ranges
D2_F Verify the water flow through indoor heat exchangers are within acceptable ranges [PROBE: This refers to boilers.]
D2_G Ensure the HVAC system has the proper refrigerant charge
D2_H Conduct duct leakage tests
B-26

DISTRIBUTION SYSTEM
D3 When installing or servicing residential HVAC equipment, on a scale of 1 to 5, where 1 = usually not conducted, and 5 = always conducted, please indicate how often you would perform the following tests. How often, using the scale of 1 to 5, would you:
[READ EACH ONE; RECORD RATING]
For D3_A through D3_C
1 Usually not conducted 2 Rarely conducted 3 Sometimes conducted 4 Often conducted 5 Always conducted -8 Don't know -9 Missing
D3_A Conduct duct pressurization tests
D3_B Measure airflows
D3_C Measure water flows
IMPACTS OF EFFICIENCY PROGRAMS AND STANDARDS
PA1 How familiar are you with programs offered in New York State to promote energy efficient non-electric heating and water heating equipment? Are you:
1 Not at all familiar 2 Somewhat familiar 3 Very familiar -8 Don't know -9 Missing
PA2 [If PA1>1, ASK] Which programs are you familiar with in NYS that promote energy efficiency non-electric heating and water heating equipment?
[ASK FOR ENTITY OPERATING THE PROGRAM AND NAME OF PROGRAM; RECORD ALL MENTIONED]
PA3 [IF PA1>1] Approximately what percentage of the equipment that you sell is rebated or incentivized through each of these programs?
B-27
______% [RECORD PERCENTAGE FOR EACH PROGRAM MENTIONED] -8 Don’t know -9 Missing (or Refused)
PA4 Are you aware of any new federal standards that may affect the manufacture of energy efficient non-electric heating and water heating equipment in New York State?
1 Yes 2 No 3 Not sure -9 Missing (or Refused)
PA4a [If PA4=1, ASK] Which standards and what effect do you think these standards will have on your sales or installation of non-electric heating and water heating equipment? When will that occur? [RECORD VERBATIM]
PA5 [If (PA4=2 or 3) OR (PA4=1 and Water Heating Standards not mentioned in PA4_1) and they sell/install water heaters. ASK] Are you aware of new federal standards for water heaters going into effect next year?
1 Yes 2 No 3 Not sure -6 Expected missing 9 Missing (or Refused)
PA5a [If PA5=1, ASK] What effect do you think the water heating standards will have on your sales or installation of non-electric heating and water heating equipment? When will that occur? [RECORD VERBATIM]
B-28

CONCLUSION
We’re almost done. Can you tell me approximately how many full-time, part-time and seasonal employees work for your firm within New York State?
For CN1_1 through CN1_3
_____ [RECORD NUMBER] -9 Missing or refused
CN1_1 Full-time
CN1_2 Part-time
CN1_3 Seasonal
Thank you for taking the time to respond to our survey. Your answers will be very valuable in helping improve energy efficiency programs for heating and cooling equipment in New York State!
CN2 Would you like to receive a brief summary of the highlights of the statewide results for this study at the conclusion of the project? [IF SO, CONFIRM EMAIL AND/OR FAX NUMBER.]
1 Yes ____ 2 No
B-29

Appendix C. Letter to HVAC Contractors
C-1 NYSERDA Residential Statewide Baseline Study Volume 3: HVAC Market Assessment

C-2 NYSERDA Residential Statewide Baseline Study Volume 3: HVAC Market Assessment

C-3 NYSERDA Residential Statewide Baseline Study Volume 3: HVAC Market Assessment

NYSERDA, a public benefit corporation, offers objective information and analysis, innovative programs, technical expertise, and support to help New Yorkers increase energy efficiency, save money, use renewable energy, and reduce reliance on fossil fuels. NYSERDA professionals work to protect the environment and create clean-energy jobs. NYSERDA has been developing partnerships to advance innovative energy solutions in New York State since 1975.
To learn more about NYSERDA’s programs and funding opportunities,
visit nyserda.ny.gov or follow us on Twitter, Facebook, YouTube, or
Instagram.
New York State Energy Research and
Development Authority
17 Columbia CircleAlbany, NY 12203-6399
toll free: 866-NYSERDAlocal: 518-862-1090fax: 518-862-1091

State of New York
Andrew M. Cuomo, Governor
New York State Energy Research and Development Authority
Richard L. Kauffman, Chair | John B. Rhodes, President and CEO