nypro china mro spend analysis identify and eliminate waste ... 9 nypro clinton case study ... nypro...
TRANSCRIPT
Project Number ZAZ-0801
NYPRO CHINA MRO SPEND ANALYSIS
A Major Qualifying Project Report:
Submitted to the Faculty
of the
WORCESTER POLYTECHNIC INSTITUTE
in partial fulfillment of the requirements for the
Degree of Bachelor of Science
by
Michael J. Fitzpatrick ___________________________
With HUST Partners:
Yuhao Deng, Cong Guo, Lin Tang
Date: September 5, 2008
Approved:
___________________________
Professor Amy Zeng, Major Advisor
This report represents the work of one or more WPI undergraduate students
submitted to the faculty as evidence of completion of a degree requirement.
WPI routinely publishes these reports on its website without editorial or peer review.

2
Abstract
In many organizations MRO (maintenance, repair, and operation) spending represents an
area of significant cost savings. The primary goal of this project is to analyze the current MRO
spending for the Nypro Pan China region and to estimate the potential savings that could be
achieved through a more strategic MRO management. This project proposes a potential MRO
supplier classification system, MRO vendor reduction model, among other recommendations for
Nypro China to implement to achieve their over-arching goal to improve the MRO purchasing
process.
3
Acknowledgements There are a many people who the WPI/HUST project team would like to acknowledge for
their support and guidance throughout the course of this project. With out the help of the
following people this work would not have been possible. From WPI we would like to thank
Professor Amy Zeng and Professor Kevin Rong who were our primary project advisors. From
HUST Professor Gao and Professor Qiu. And we would also like to acknowledge our corporate
sponsor Nypro. There were several people from the Nypro China supply chain team who were
critical to the success of our work. Although the list of these people is long we would like to
extend a special thanks to Ronald Alciati and Sunshine Xia who travelled with the project team
and offered so much help.

4
Table of Contents Table of Figures .............................................................................................................................. 7
1 Introduction ............................................................................................................................. 8
2 Company Profile ................................................................................................................... 10
2.1 Nypro Tianjin ................................................................................................................. 11
2.2 Nypro Shenzhen ............................................................................................................. 12
2.3 Nypro Guangzhou .......................................................................................................... 12
2.4 Nypro Suzhou ................................................................................................................. 13
3 Background ........................................................................................................................... 14
3.1 The Purchasing Department ........................................................................................... 14
3.2 MRO Purchasing ............................................................................................................ 15
3.2.1 Trends in MRO Purchasing .................................................................................... 16
3.3 Supplier Relationship Management (SRM) ................................................................... 16
3.4 Negotiation in China ...................................................................................................... 17
4 Methodology ......................................................................................................................... 19
4.1 MRO Vendor Data Collection........................................................................................ 20
4.1.1 BPCS System Information ...................................................................................... 20
4.1.2 MRO Buyer Interviews ........................................................................................... 22
4.2 MRO Classification System ........................................................................................... 23
4.3 Identify and Eliminate Waste ......................................................................................... 24
4.4 Vendor Reduction Model ............................................................................................... 24
5 Findings One – MRO Classification System ........................................................................ 25
5.1 Constraints ...................................................................................................................... 25
5.2 Design............................................................................................................................. 26
5.2.1 Classification Overlaps and Keyword .................................................................... 28
5.2.2 Direct Materials Suppliers Classification ............................................................... 29
5.2.3 Other Classification ................................................................................................ 30
5.3 Implementation............................................................................................................... 30
6 Findings Two – Waste Identification and Elimination ......................................................... 31
6.1 Vendor Redundancy ....................................................................................................... 31
6.1.1 Identify .................................................................................................................... 31
6.1.2 Recommendation .................................................................................................... 34
6.1.3 Value ....................................................................................................................... 35
6.1.4 Limitations .............................................................................................................. 36
5
6.2 High Quantity of Purchase Orders ................................................................................. 36
6.2.1 Identify .................................................................................................................... 36
6.2.2 Recommendation .................................................................................................... 38
6.2.3 Value ....................................................................................................................... 40
6.2.4 Limitations .............................................................................................................. 40
6.3 Low Volume Vendors .................................................................................................... 41
6.3.1 Identify .................................................................................................................... 42
6.3.2 Recommendation .................................................................................................... 43
6.3.3 Value ....................................................................................................................... 43
6.3.4 Limitations .............................................................................................................. 44
7 Findings Three – MRO Supplier Evaluation Model ............................................................. 44
7.1 Model Structure .............................................................................................................. 45
7.2 Suggested Major Factors and Sub-Factor Definitions ................................................... 46
7.3 Implementation............................................................................................................... 48
7.4 Recommendations .......................................................................................................... 51
7.5 Limitations ..................................................................................................................... 52
8 Overall Recommendations .................................................................................................... 53
8.1 Short-term Recommendations ........................................................................................ 53
8.1.1 Create MRO Commodity Study Team ................................................................... 53
8.1.2 Standardize the New Vendor Adoption Process ..................................................... 53
8.1.3 Cleanse Vendor Data .............................................................................................. 54
8.1.4 Separate Direct Materials from MRO ..................................................................... 54
8.2 Long-term Recommendations ........................................................................................ 55
8.2.1 Goals for MRO Commodity Study Team ............................................................... 55
8.2.2 Vendor Evaluation Process ..................................................................................... 56
8.2.3 Map-Out Purchasing Processes............................................................................... 56
8.2.4 Monitor Usage ........................................................................................................ 56
9 Nypro Clinton Case Study .................................................................................................... 57
10 Conclusions and Future Work .............................................................................................. 59
Appendix A: MRO Classification Definitions .............................................................................. 60
Level One Classification Definitions ........................................................................................ 60
Level Two Classification Definitions ....................................................................................... 60
Appendix B: MRO Classification Guide ...................................................................................... 62
Appendix C: Vendor Redundancies.............................................................................................. 67
6
Redundancy One ....................................................................................................................... 67
Redundancy Two ...................................................................................................................... 67
Redundancy Three .................................................................................................................... 68
Redundancy Four ...................................................................................................................... 69
Appendix D: Purchase Order Quantity ......................................................................................... 71
Appendix E: Hot Commodity Analysis ........................................................................................ 72
Appendix F: Proposed Factors and Weights ................................................................................. 73
Appendix G: Request for Information (RFI) ................................................................................ 74
Reference List ............................................................................................................................... 76
7
Table of Figures
Figure 1: Methodology Overview ................................................................................................. 20 Figure 4: Classification Example .................................................................................................. 28 Figure 2: Level One Classifications .............................................................................................. 28 Figure 3: Classification System Overlap ...................................................................................... 28 Figure 5: Classification Screenshot .............................................................................................. 29
Figure 6: Redundancy One ........................................................................................................... 32 Figure 7: Redundancy Two ........................................................................................................... 33 Figure 8: Redundancy Three ......................................................................................................... 33 Figure 9: Redundancy Four .......................................................................................................... 34 Figure 10: Proposed New Vendor Adoption Process ................................................................... 34
Figure 11: Purchase Order Quantity ............................................................................................. 37 Figure 12: Level One PO Quantities ............................................................................................. 38
Figure 13: Pareto Analysis ............................................................................................................ 42 Figure 14: Hot Commodities ........................................................................................................ 43
Figure 15: Major Factors and Sub Factors .................................................................................... 46 Figure 16: Supplier Evaluation Model Implementation ............................................................... 48
Figure 17: Original Data ............................................................................................................... 50 Figure 18: Standardized Data........................................................................................................ 50 Figure 19: Weighted Average ....................................................................................................... 51
Figure 20: Vendor Rating ............................................................................................................. 51 Figure 21: MRO Relationships ..................................................................................................... 52

8
1 Introduction
A tightening economy, rising cost pressures, along with a more technology-enabled and
competitive marketplace are forcing companies to look to new areas to achieve cost savings.
Nypro China has identified MRO (maintenance, repair, and operating) spending as a potential
area that can generate a significant cost savings. However, the current MRO purchasing practice
for Nypro China has received little attention from management because it has typically been
viewed as a small area for savings. This project suggests that through strategic management
MRO operations can generate a significant cost savings across Nypro China.
The goal of this project is to provide potential cost reductions that could be achieved
through a more effective management of MRO related suppliers for Nypro China. The objectives
of this project were established with the support and guidance of the Nypro China supply chain
team. Over the course of seven weeks the project team visited Nypro’s facilities in Tianjin
(NTJ), Shenzhen (NSZ), Guangzhou (NGZ), and Suzhou (NSU). The project team worked
closely with the Nypro China supply chain team in order to confirm data accuracy and request
suggestions and feedback about progress.
One of the primary objectives of the project team was to create a master MRO supplier
directory for the Nypro China region (NTJ, NSZ, NGZ, and NSU). This directory includes
supplier spend and contact information directly from Nypro’s MRP system, called BPCS (spend
information for FY08 Jul 1st 2007- Jun 30
th 2008). The project team used this information to
interview the MRO buyers at each facility. During these interviews the supplier directory helped
to assure the MRO buyers were providing accurate details about the specific items purchased
from each supplier. Interviewing the MRO buyers was a necessary step for our project because it

9
provided the project team with the information needed about each facility’s MRO suppliers to
move forward with a supplier classification system.
Another objective was to develop and implement a classification system for all MRO
related suppliers. This classification system was designed to be robust enough to include all
MRO items, but detailed enough to provide a specific description for each item. The project team
used this classification system to provide a comprehensive review of MRO spending across
Nypro China for FY08. The team discovered that the MRO spend for Nypro China is a very
large amount and that there are many areas for improvements that could generate a significant
cost savings.
The classification system along with the master MRO supplier directory also helped the
project team to complete another objective – identify and eliminate waste. By combining the
spend information with the classification system the project team was able to identify MRO
commodities with a high potential for supplier consolidation. Because the one of the goals of the
project was to provide the potential cost reductions that could be achieved through improving the
MRO buy, identifying and eliminating these wastes is necessary objective to estimating a
potential cost reduction.
The project team’s final objective was to create a supplier reduction model that can be
used to determine an overall rating for each MRO supplier. This rating is based off many
supplier evaluation metrics that provide a comprehensive review of supplier capabilities. Using
this model Nypro China can determine which suppliers may be consolidated and which suppliers
could take a more strategic role in the organization.
It is clear that through a more strategic, and standardized MRO supplier selection and
purchasing process Nypro China will be able to leverage its MRO spend across a smaller supply
10
base to generate better supplier relationships, better supplier performance, and cost savings.
Although it is difficult to measure exactly, industry trends show that improvements in MRO
operations can result in a ten to fifteen percent reduction in total cost.1 For Nypro China, MRO
spending represents over 40 million dollars annually and this could result in four to six million
dollars in potential savings per year (FY08).
It is important to have a clear understanding of the background information that is
relevant to this research. The company profile, background, methodology, findings, and overall
recommendations are detailed in the following chapters.
2 Company Profile
Nypro Inc. is headquartered in the small New England town of Clinton, Massachusetts
and is a leading driver of innovation and quality throughout the plastics industry. Nypro’s core
businesses deal with varying aspects of the plastics industry– from product design and
development through mold building, injection molding and assembly.
During fifty-one years of operation Nypro has established successful long-term
relationships throughout the global marketplace serving companies in the following markets:
Electronics and Telecommunications, Consumer and Industrial, Packaging, Healthcare,
Automotive, and Contract Manufacturing. Some of their customers include Abbot
Pharmaceutical, Motorola, and Procter & Gamble.
“Start-to-finish” services allow Nypro to produce quickly while minimizing costs to
deliver “reliability, repeatability, and consistency – worldwide.” However, it is not only the
innovative and efficient operations of Nypro’s facilities that have positioned this company for
continued growth and success. Nypro has created a network of state of the art facilities that are
1 (Kemp, MRO Today, 2003)
11
located throughout the world in most developed and many developing areas. With 52 facilities in
17 countries Nypro is able to meet worldwide standards and tackle the most challenging projects
for their customers whenever and wherever needed. One area where Nypro has grown
tremendously in the past decade is China. With over nine facilities in China they are well
positioned to benefit from the increasing success that China is experiencing in its growth as a
nation.
2.1 Nypro Tianjin
Yaguang Nypro Precision Molding (Tianjin) Co.Ltd.is a Sino-American Joint venture
established by Nypro Inc. and Zhonghuan Group Co. The company was registered in August
1996 in Tianjin Economic Development Area (TEDA).
Yaguang Nypro is located in the XiQing microelectronic industrial park in Tianjin, which
consists of various state-of-the-art technologies such as high precision injection molding,
painting, printing, assembly, laser marking, gasket dispensing and etc. Due to the rapid
expansion of customer base and market share, another advanced design manufacturing plant was
established in 2005 to meet the increasing demands, both in quality and quantity, of existing and
new customers.
Yaguang Nypro has earned itself high praise and recognition in the molding and contract
manufacturing areas by its technological strength, strict quality standard, sound management
system, high caliber employees and most important, customer-oriented corporate culture. It has
ranked in the Best 100 Enterprises of TEDA over the past couple of years. This state of the art
facility has received authentication by SGS, and ISO9001:2000 and ISO14001 certification. To
date, Nypro Tianjin encompasses 30,826 square meters in total, with more than 4,300 employees.
12
2.2 Nypro Shenzhen
Nypro Shenzhen is backed by Nypro Inc., a company committed to be the best in the world
in precision plastic injection molding and other related manufacturing operations. The
combination of molding expertise, technology and dedication to success is present in every facet
of business at Nypro Shenzhen.
With Nypro Shenzhen as a partner, customers benefit from expertise in thin wall molding,
insert molding, bi-component molding, in mold decoration molding, and also traditional injection
molding. When more than just molding is needed, Nypro Shenzhen offers an extensive array of
precise secondary operations, such as cosmetic painting, decoration, and assembly. In fact,
contract manufacturing services are a particular strength of Nypro Shenzhen, with nearly all
components receiving at least one secondary operation prior to shipping.
Since opening in 1993, Nypro first plant in China, Nypro Shenzhen has provided injection
molding products and services, in partnership with customers, for the consumer/industrial,
electronic/telecommunications and healthcare industries.
2.3 Nypro Guangzhou
Nypro Guangzhou Molding Plastics Products Co., Ltd. is an entirely American ventured
company belonging to the American parent company. It was acquired by Nypro in 2001, located
in Yi Xing Industrial Estate, Donghuan Street, Pan Yu, Guangzhou, and covers 16,000 square
meters. The company started with about 120 employees and has grown rapidly since 2001 to
include more than 800 employees.
13
It brought a high level of experience in molding technology, sophisticated decorative
solutions and electronics/mechanical assemblies. Some of Nypro Guangzhou’s customers
include Microsoft, Motorola, Nokia, Johnson & Johnson, Plantronics, and Philips.
Nypro Guangzhou's core capabilities include precision injection molding, bi-component
molding, vertical insert molding for plastic parts and components. In-mold decorating and in-
mold labeling capabilities provide added proficiency in the molding of decorative windows,
lenses and covers for electronics and telecommunications customers.
Nypro Guangzhou has recently expanded production capacity to a second location adjacent
to the facility, providing an additional 94,000 sq. ft. This additional capacity will empower
Nypro Guangzhou to meet the growing challenges from the global customers in electronics and
telecommunications, healthcare products, consumer and industrial devices, as well as in the
automotive industries.
2.4 Nypro Suzhou
Nypro Suzhou was established in December 2000, located in the FengQiao Industrial Park,
Suzhou New District. Nypro Suzhou is specifically designed to provide contract manufacturing
for Nypro's molding and assembly customers and complete plastics solutions for customers in
the electronics/telecommunications, consumer/industrial, and automotive industries.
Nypro Suzhou has more than 700 employees and annual of about 20 million U.S. dollars.
With a Class 100,000 clean room, and specializing in product assemblies and final pack-out,
Nypro Suzhou has earned high praise and recognition from customers for their technological
strength, advanced equipment and processes, exacting quality standards, sound management
systems and world class team of employees. The company's products are widely used in
electronic communication devices (cell phone/laptop case), auto parts, medical equipment and

14
personal care products (toothbrush, razor handle). Some of their customers include Motorola,
Cisco, Sunstar, HTC, and RIM Blackberry.
The company has large plants with a total area of 11,000 square meters, with 4,000 square
meters of 100,000 dust-free clean workshop, equipped with advanced production equipment
industry, and has achieved product quality and management system certification: ISO9001:
2000, QS9000, TS16949, ISO13845, which reflected the company's production and management
processes have reached the advanced world level.
3 Background
Over the past decade organizations have turned towards operations and supply chain
management to create a more efficient, effective, and lean business. Procurement is an area of
operations that is rapidly changing as technology has helped ignite the growth of a more dynamic
and globalized marketplace. According to a recent survey from Purchasing Magazine, March
2008, 88 percent of purchasing processionals say that their buy is more strategic today than it
was five years ago. Newer and more widespread accessibility to technologies has enabled
purchasers to develop methods to process purchase orders, monitor inventories, and mange
supplier relationships more effectively. For many organizations procurement is an area full of
room for improvement and cost savings.
3.1 The Purchasing Department
Essentially, the mission of the Purchasing Department is to effectively implement
strategies for the acquisition of goods and services in a way that provides added value to the
15
organization.2 This follows the old adage that the Purchasing Department’s role is “to deliver the
right material (or service) in the right amount to the right place at the right time and at the right
price.” 3 The responsibilities of the purchasing manger today have extended far beyond the
processing of purchase orders. According to Sollish, “Purchasing mangers today must have the
ability to assess and respond effectively to current market conditions and the foresight to
envision the future needs of the organization.”4 Purchasing mangers must be able to
continuously deal with change and be experts in the latest strategies and best practices
throughout the industry.
When it comes to purchasing there are two kinds of spend that make up the entire buy of
an organization – direct materials spend and indirect materials spend. The way this spend is
categorized and defined can vary across different organizations however, the general concepts
are the same. Direct materials spend is typically characterized by the purchasing of goods or
services that are value adding and are crucial to the production of the final product. For Nypro
China direct materials spend is defined as any spending that is a materials cost. On the other
hand indirect materials spend consists of materials that are not integral to the production of the
final product.5 A key component of the indirect spend is on MRO or maintenance, repair and
operating supplies. The following section provides a clear definition of what MRO purchasing is
and is not.
3.2 MRO Purchasing
MRO (maintenance, repair, and operating) spending is typically an area of purchasing
that generates many low-dollar, unplanned buys, and for most organizations it is an area that can
2 (Sollish, 2005) pg 23
3 (Sollish, 2005) pg 4
4 (Sollish, 2005) pg 4
5 (SAP)
16
generate significant operational advantages and cost reductions through strategic management.6
Experts estimate that MRO purchasing averages about 20 percent of the total buy for US
manufacturers. Although the MRO spend makes up only a small percentage of the total buy it
consists of frequent, small purchases – making up about 80 percent of all purchasing
transactions.7
3.2.1 Trends in MRO Purchasing
When it comes to purchasing the traditional best practice is to make purchasing decisions
primarily based on price, however organizations need to break this traditional way of thinking
and approach purchasing with a strategic plan. As many industries are becoming e-commerce
enabled the MRO purchasing operations is slowly becoming electronic. Using procurement
management companies can upload their suppliers into an “electronic catalog” and better
monitor the suppliers they select.8 As the overriding trend in MRO purchasing is to elevate its
importance and try to align the MRO purchasing process with that of direct materials in order to
generate a cost savings, many organizations are investigating supplier relationship management
(SRM).
3.3 Supplier Relationship Management (SRM)
Supplier relationship management comes into play when a supply chain recognizes the
benefits that can be achieved through strategic sourcing. According to the APICS Dictionary,
11th
edition strategic sourcing is defined as “The development and management of supplier
relationships to acquire goods and services in a way that aids in achieving the immediate needs
6 (Kemp, MRO Today, 2004)
7 (Kemp, MRO Today, 2004)
8 (Arabe, 2001)
17
of a business.” If organizations focus on developing their suppliers and creating a strategic
sourcing policy this represents a significant opportunity for improving the MRO purchasing
process and generating savings. Across the industry there are many sources that can be analyzed
to better understand and determine the best methodology for implementing a plan for SRM. One
comprehensive source is from APICS, the Association for Operations Management. From the
APICS Certified Supply Chain Professional Learning system, Module three, Managing Customer
and Supplier Relationships, there is a complete overview of SRM principles and best practices
for implementing these strategies throughout the organization.
3.4 Negotiation in China
Since the scope of our research involves doing business outside of the United States it is
fitting to provide an overview to the way negotiation is viewed and carried out in China. There
are many technicalities to the way business in China is conducted and without a clear
understanding of these details your business may be seriously hindered. When it comes to MRO
purchasing at Nypro China the buyers are responsible for confirming the price for the purchase
order with the suppliers. This may require negotiating a price, quantity, delivery, or even
technical specification. According to Ashley Tang, an MRO buyer at Nypro Tianjin, the majority
of their MRO buy is done locally because it makes delivery easier and many of their suppliers
actually need to be nearby to provide services to the plant. Therefore, it is vital to make sure that
these buyers are well trained to interact professionally with the local Chinese to avoid being
deceived or damaging a potential relationship.
The Chinese people view negotiation much differently than most business people from
the United States. While negotiation in the US may be strictly business and can be fairly quick
and impersonal the Chinese want to get acquainted before they do business. Instead of rushing
18
into negotiations the Chinese seek to “soften their visitors up” by extending their hospitality and
appreciation of the finer things in life, such as eating and drinking.9 For many foreign negotiators
who come to China this formal introduction phase of negotiating can be frustrating because it is
time consuming. One technique commonly used by Chinese negotiators is to use go-slow
techniques in order to get impatient adversaries to give away more than they planned.10
An ideal
approach to speeding up this part of negotiation is to arrive with introductions from one or two
people who are known and respected by as many Chinese people as possible.11
Chinese negotiation is characterized by two distinct phases – the technical phase and the
commercial phase. These two phases typically involve two separate negotiation teams; one team
is specialized in understanding the technical information and the other team specializes in price
negotiation.
Despite claiming to negotiate on the principle of equality and mutual benefit the Chinese
can be very blunt while negotiating. Oftentimes holding back on information and pointing out
what may be fair to the foreigner has nothing to do with the circumstances in China.12
The technical phase will come first in the negotiation process and it is generally the most
drawn-out and detailed. It is important for foreigners to understand how the Chinese view
introducing new technologies to avoid revealing too much information. During these
presentations the Chinese expect all of the technical information to be shared with them, without
necessarily giving anything in return.13
After the “jishu jiaoliu” or “technical transfer,” if the
Chinese side decides to make a deal the negotiation will shift to the commercial phase.
9 (Mente, 1994) pg 110
10 (Mente, 1994) pg. 120
11 (Mente, 1994) pg. 112
12 (Mente, 1994) pg. 111
13 (Mente, 1994) pg. 114

19
During this phase price negotiators who are especially good at beating the other side
down on cost and other factors will come in to make a deal.14
According to De Mente, the
Chinese attitude is that foreign companies have a lot while they have nothing or only a little – the
more they can get from the foreign company, the fairer it is for them and for China. “They see
each encounter with a foreign group of technology experts as a valuable learning process,
regardless of whether or not the meeting results in a business deal.”15
For all of these reasons it is crucial for foreign business people who participate in
technical presentations in China to know exactly where to draw the line when preparing
presentations to avoid revealing too much knowledge for free.
All in all, there are two keys to successful negotiations with Chinese business people –
patience and preparation. Patience coupled with proper etiquette and respect for Chinese customs
will merit respect in return for the foreign negotiator. Also to avoid being taken advantage or
offending the Chinese it is important to prepare enough for your negotiation to understand some
of the basics differences among Chinese negotiations.16
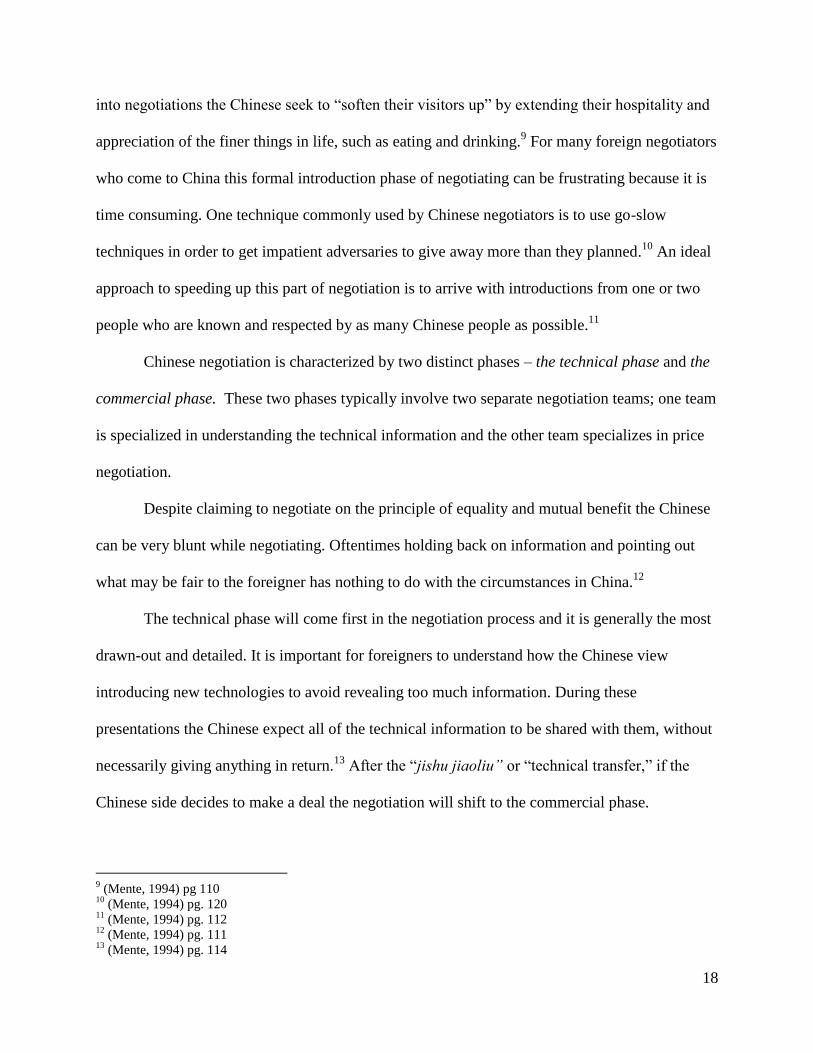
4 Methodology
In order to improve the MRO purchasing process there are many steps that need to be taken.
The project team pioneered the MRO purchasing analysis for Nypro China. The team’s
methodology was established based off industry best practices, suggestions from the Nypro
China supply chain team, and the original thinking of the team. An overview of the team’s
methodology is presented in Figure 1: Methodology Overview.
14
(Mente, 1994) pg. 114 15
(Mente, 1994) pg. 115 16
(Mente, 1994) pg. 117
20
Figure 1: Methodology Overview
4.1 MRO Vendor Data Collection
The most challenging and time consuming part of completing an MRO spend analysis for
was centralizing and collecting information about all of the MRO related vendors for Nypro
China. However, as Dr. Robert Kemp from MRO Today suggests getting the enterprise-wide
information about each vendor is a necessary first step to improving the MRO buying process.17
4.1.1 BPCS System Information
The first information that the project team collected included the vendor identification
number and vendor name of all of the MRO related suppliers for each of the four Nypro China
facilities. With the help of the Nypro China supply chain team the team received reports from the
BPCS system detailing all of the indirect (MRO) related vendors for each facility. The
17
(Kemp, MRO Today, 2004)
MRO Vendor Data Collection (NTJ, NSZ, NGZ, NSU)
Create MRO Vendor Classification System
Identify and Eliminate Waste across Nypro
Create Vendor Reduction Model
21
information included the vendor number and vendor name for every indirect vendor that has ever
been used at the four Nypro facilities.
In order to supplement this basic information the project team also collected all of the
contact information available for every MRO related vendor from the BPCS system reports. This
contact information includes vendor addresses, contact names, telephone numbers, and fax
numbers. This information is valuable; 1) Because it could be used to identify vendors that may
be repeated in the system under different names; 2) Because it could be used to contact vendors
when moving forward with supplier evaluation.
However, there were some difficulties compiling the contact information. First, the project
team discovered that this information may not be complete. For example some vendors only
have partial contact information (address available but no contact name, telephone or fax
numbers) and some vendors don’t have any contact information at all. Secondly, the team notes
that some of this information may be outdated or inaccurate because supplier information is not
frequently updated in the BPCS system.
The last report the team collected from the BPCS system provided the spend details for the
MRO vendors at each of the Nypro China facilities. This spend information was taken during
fiscal year 2008, FY08 (July 1st 2007- June 31
st 2008). Because the total spend for each vendor
was not given directly from the spend report the project team calculated the total spend summing
all of the purchase orders for each vendor. Using this method the team also counted the total
number of purchase orders used for each vendor during FY08.
The project team’s next step was to combine all of the information from these separate
reports into a master MRO vendor directory for all of Nypro China. The team managed this
directory using a Microsoft Excel worksheet. This directory is one of the major accomplishments
22
of the project team because it combines information that was scattered in several different reports
into one centralized, comprehensive directory. This directory is also a resource that the project
team used in order to facilitate interviews with MRO buyers.
4.1.2 MRO Buyer Interviews
Once the project team created the MRO supplier directory the team still needed more
information about the MRO vendors in order to create an accurate MRO classification system
and to complete the other project objectives.
To get more information about the vendors the project team interviewed buyers from NTJ,
NSZ, and NGZ about the specific items purchased from each MRO related vendor. This is where
the information from the centralized MRO vendor directory was most useful. Using Microsoft
Excel’s auto filter feature it was easy to filter the vendors to quickly find vendors during the
interviewing process.
The project team’s process for interviewing buyers was simple and effective. Because the
scope of the project only allowed for about one week at NTJ, NSZ, and NGZ the team needed to
be effective with time management. In order to save time the project team conducted group
interviews rather than individual interviews. During the interviewing process the project team
presented the vendor number, vendor name, contact information, and spend information from
FY08 for the all of the MRO related vendors used at the facility under investigation. Then, using
this information, the buyers would talk openly among themselves, other members of the Nypro
China supply chain team (when available), and our team members to determine the best item
description for each of the vendors.
In order to check the accuracy of descriptions and help ensure the quality of the
information of the buyers the project team also presented additional details about the vendors.
23
For each vendor we presented the BPCS report of the specific items that were purchased from
the vendor in question during FY08. If the buyer was unable to provide an accurate description
for the supplier using this information the team called specific departments for more information
or consulted the details of prior purchasing requisitions until the supplier description was
determined.
Despite the project team’s concerted effort to obtain the most accurate data possible there
may be some errors in the vendor descriptions. Because of the limited time at each facility the
project teams was unable to meet with representatives from related technical departments to
confirm the accuracy of the MRO buyers information. The project team’s major concern is that
the buyers may not have provided best description of the suppliers because they may lack
technical training.
Another concern that affects the quality of the descriptions is the accuracy of Chinese to
English interpretations. Because many of the item descriptions were only described in Chinese
and the MRO buyers in some cases did not speak English very well there may be some errors in
these descriptions due to translation errors. Despite these potential areas for error the project
team is confident that these descriptions provide an accurate starting point for further
investigation into understanding and improving the MRO buy.
Due to time limitations the project team was unable to visit the NSU facility for long
enough to complete the descriptions for NSU’s vendors. However, the project team suggests that
a similar methodology is followed in order to complete the missing information.
4.2 MRO Classification System
Once our team finished interviewing the buyers from each Nypro facility we created our
MRO classification system. Creating the MRO classification system was challenging because
24
there is no standardized methodology for classifying MRO vendors and MRO vendors provide a
large range of items and services. The project team worked closely with the Nypro China supply
chain team to make sure that the proposed classification system is valuable for Nypro China’s
operation. In order to determine accurate classifications the project team toured the Nypro
facilities and noted MRO items in operation. The project team also solicited feedback and
suggestions from the Nypro China supply chain team throughout the course of the project.
The design and details of this classification system are discussed later in Findings One –
MRO Classification System.
4.3 Identify and Eliminate Waste
In order to identify waste in the MRO operation the project team used the MRO
classification system to help compile a comprehensive MRO spend analysis. Using the MRO
classification system the project team identified spend by commodities and sub-commodities.
This allowed the project team to identify commodities that have the best opportunity for potential
cost savings. Dr. Kemp, MRO consultant from MRO Today, proposes a similar methodology for
identifying waste in his article “Improving the MRO Buy.” 18
After reviewing the spend analysis
the team identified three major kinds of waste – vendor redundancy, high quantities of purchase
orders, and low-volume vendors. These three wastes are explained in detail in Findings Two –
Waste Identification and Elimination.
4.4 Vendor Reduction Model
The final objective of the project team was to develop a vendor reduction model. This model
was created to help standardized the supplier evaluation process and is a useful tool for
18
(Kemp, MRO Today, 2004)
25
improving the efficiency of the supply chain. As Sherry Gordon, Vice President of Supplier
Performance Intelligence, states “measuring the performance of suppliers is vital to ensuring a
well-functioning supply chain.”19
The vendor reduction model suggested by the project team is designed to be easy to
implement and can be used as a starting point for identifying key suppliers for Nypro China. The
details of the proposed vendor reduction model are documented in Findings Three – MRO
Supplier Evaluation Model.
5 Findings One – MRO Classification System
One of the primary objectives of the project team was to create an MRO supplier
classification system for Nypro China. This system was designed and implemented using
industrial engineering concepts to satisfy the design capstone graduation requirement for WPI
industrial engineering students. The following sections document the proposed classification
system in details.
5.1 Constraints
Creating an MRO classification system was not an easy task for the project team. As the
first team to develop MRO classifications for Nypro China there was limited prior information to
use as starting point. Therefore, the project team worked closely with the Nypro China supply
chain team to define the constraints of the system. It was important for the project team to work
closely with Nypro in order to create a result that is easy to deploy and valuable to the Nypro
China Operation.
19
(Gordon, 2006)

26
The first constraint identified by the project team was that the final MRO classification
system must be very clear and easily understood by all users. It was critical that the design of the
system is complex enough to satisfy the other constraints of the system, but simple, effective,
and easy to implement. This system was designed to be intuitive so users can quickly and
accurately identify which suppliers provide specific items.
The second constraint identified by the project team was that the classification system must
be robust enough to classify every MRO supplier at each Nypro China facility. Nypro’s need for
an MRO supplier classification system was inspired from a lack of MRO knowledge across the
operation. The project team’s classification system was created to better understand the range of
MRO items purchased across Nypro China and to determine what suppliers are providing these
items. For these reasons, it was a critical constraint of the project team to ensure that every MRO
supplier can be identified in the proposed MRO classification system.
The third constraint of the project team’s classification system is that system must include
detailed vendor descriptions without any overlaps across classifications. It is important to ensure
that every supplier is accurately described in the system and that each supplier classification is
detailed enough so that it cannot be confused with other classifications.
5.2 Design
The classification system that the project team designed for Nypro China is the first of its
kind and was created based off information collected during the project. In order to organize the
suppliers into specific classifications the project team started with a broad, preliminary
classification. The preliminary classifications established a starting point for refining the system
and determining accurate MRO classifications.
27
After analyzing the preliminary classifications it was clear a three-level classification
system should be used for MRO classification. This structure works best for MRO vendors
because it is robust enough to include the entire range of vendors, but detailed enough to give
specific vendor descriptions. The project team worked with the Nypro China supply chain team
to define the three levels of the classification system.
The first level is a commodity grouping. This is the most basic grouping, but it is one of
the most important levels because these groupings represent the major areas of MRO spending.
The six level one classifications are Equipment and Spare Parts, Supporting Goods,
Maintenance/Service, Chemicals, Gases, Oils, Lubricants, Direct Material Suppliers, and Other.
The Direct Materials Suppliers and Other classifications are special classifications that will be
explained in detail later in this chapter.
The second level of the project team’s proposed MRO classification system is a sub-
commodity or department grouping. This is the best grouping for level two because the majority
of the vendors that are used throughout Nypro China are used by only specific departments or the
items that they provide fall into distinct sub-commodities. There are 30 level two classifications
in the proposed MRO classification system; these classifications are defined in Appendix A:
MRO Classification Definitions.
The third level of the proposed MRO classification system is the supplier’s specific item
details. This is the most detailed level of the classification system. This level is designed to
clearly distinguish exactly what the vendor is providing to Nypro. There are 165 level three
classifications.
An overview of all three levels of the proposed MRO classification system is shown in
Appendix B: MRO Classification Guide.

28
Equipment
Spare PartsServices
5.2.1 Classification Overlaps and Keyword
During the classification process the project team discovered that there was overlap across
some of the three levels of the classification system. Figure 2: Level One Classifications shows
the six level-one classifications and Figure 3: Classification System Overlap shows the four areas
of overlap.
The project team solved this overlap issue by creating an additional keyword description.
The keyword gives more details about what the supplier is providing without adding any
additional levels to the classification system. For example, consider a supplier who provides only
spare parts for a molding robot. Using the proposed three-level system with the keyword the
supplier would be classified as shown in Figure 4: Classification Example.
Level 1 Level 2 Level 3 Keyword
Equipment and Spare
Parts
Molding Molding Robots
(Pick-up Robots)
spare
Figure 4: Classification Example
Figure 2: Level One Classifications Figure 3: Classification System Overlap
29
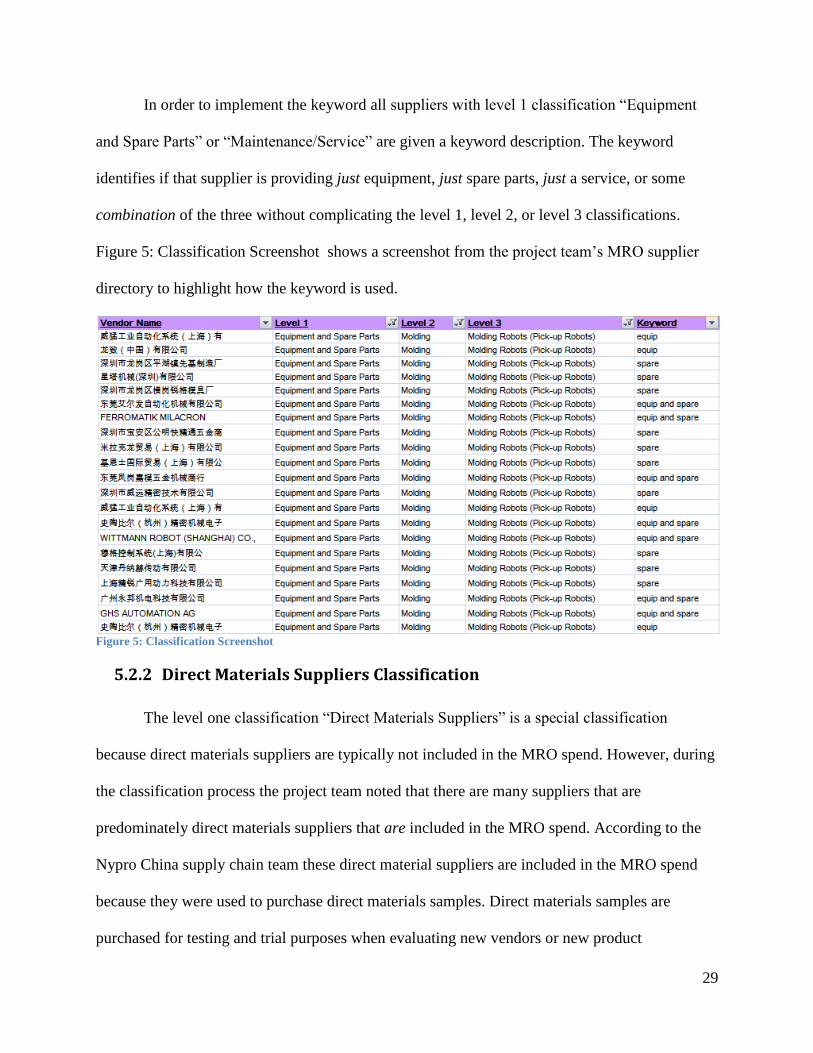
In order to implement the keyword all suppliers with level 1 classification “Equipment
and Spare Parts” or “Maintenance/Service” are given a keyword description. The keyword
identifies if that supplier is providing just equipment, just spare parts, just a service, or some
combination of the three without complicating the level 1, level 2, or level 3 classifications.
Figure 5: Classification Screenshot shows a screenshot from the project team’s MRO supplier
directory to highlight how the keyword is used.
Figure 5: Classification Screenshot
5.2.2 Direct Materials Suppliers Classification
The level one classification “Direct Materials Suppliers” is a special classification
because direct materials suppliers are typically not included in the MRO spend. However, during
the classification process the project team noted that there are many suppliers that are
predominately direct materials suppliers that are included in the MRO spend. According to the
Nypro China supply chain team these direct material suppliers are included in the MRO spend
because they were used to purchase direct materials samples. Direct materials samples are
purchased for testing and trial purposes when evaluating new vendors or new product
30
specifications. These samples are not included in the direct materials spend because they are not
considered a materials cost, instead Nypro views them as an additional or special spending cost
that is part of MRO. The project team created the separate classification called “Direct Materials
Suppliers” so that it is easy distinguish this spending from the rest of the MRO spending.
5.2.3 Other Classification
The level one classification “Other” was created to classify suppliers that have a special
relationship with Nypro. This classification deals with two different kinds of special supplier
relationships.
First, some Nypro facilities create a vendor in the BPCS system that is used only to make
small one-time purchases or to request product samples. Thus, instead of adding a new vendor to
the system every time a one-time buy is placed facilities can use this vendor. For example, Nypro
Tianjin maintains a vendor in their BPCS system called “NTJ OTHER VENDOR” that is used
for these reasons.
Secondly, suppliers that are a Nypro facility or subsidiary of Nypro are included in this
classification. This includes Nypro Tool facilities and major Nypro facilities such as Nypro
Tianjin, Nypro Suzhou, or Nypro Shenzhen.
5.3 Implementation
Using this classification system the project team successfully classified 822 MRO related
suppliers for Nypro Shenzhen, Nypro Tianjin, and Nypro Guangzhou. The complete directory of
MRO related vendors for Nypro China includes the classification information centralized in a
Microsoft Excel worksheet. Using pivot tables and the auto filtering feature of Microsoft Excel it
is easy to find suppliers and calculate spend reports by classifications. Unfortunately, the project
31
team was unable to create classifications for NSU’s vendors due to the limited time spent at the
NSU facility. However, Nypro can use the same methodology as the project team to complete
these classifications. The initial impressions of the project team’s MRO classification system
from the Nypro China supply chain suggests that it is a very good system that establishes a great
starting point for future investigation of the MRO operation of Nypro China.
6 Findings Two – Waste Identification and Elimination
One of the primary goals of the project team was to identify and suggest ways to eliminate
waste in the MRO operation of Nypro China. After collecting information about Nypro’s MRO
operation and creating a vendor classification system the project team was able identify three
major areas of waste – vendor redundancy, high quantity of purchase orders, and low-volume
vendors.
6.1 Vendor Redundancy
The project team identified that there are many vendors in the BPCS system that are
repeated at the same facility or across the Nypro China region. Vendors are repeated in the BPCS
system because there is a lack of communication across facilities and each facility is allowed to
create their own unique vendor identification. It is important to identify and correct these
problems because they represent incomplete and inaccurate information in the BPCS system.
This information may also be used to leverage the MRO buying power of the region.
6.1.1 Identify
The project team identified 77 different instances of vendors that are repeated in the
BPCS system. Identifying the vendors that were repeated across all of the Nypro China facilities
32
was not an easy task. Because each facility creates their own unique identification for vendors
the same vendor may be entered into the system under multiple different vendor names and/or
vendor numbers. Therefore, it is impossible to identify the same vendors across multiple
facilities by comparing just vendor numbers or vendor names.
The project team used many features of Microsoft Excel including pivot tables, auto
filter, and vlookup to compare the vendor numbers, vendor names, and contact information of all
of the MRO related vendors to identify redundant vendors. By comparing all of this information
the project team could successfully identify common vendors. After completing this analysis of
all the MRO vendors the project team identified four major kinds of vendor repetition.
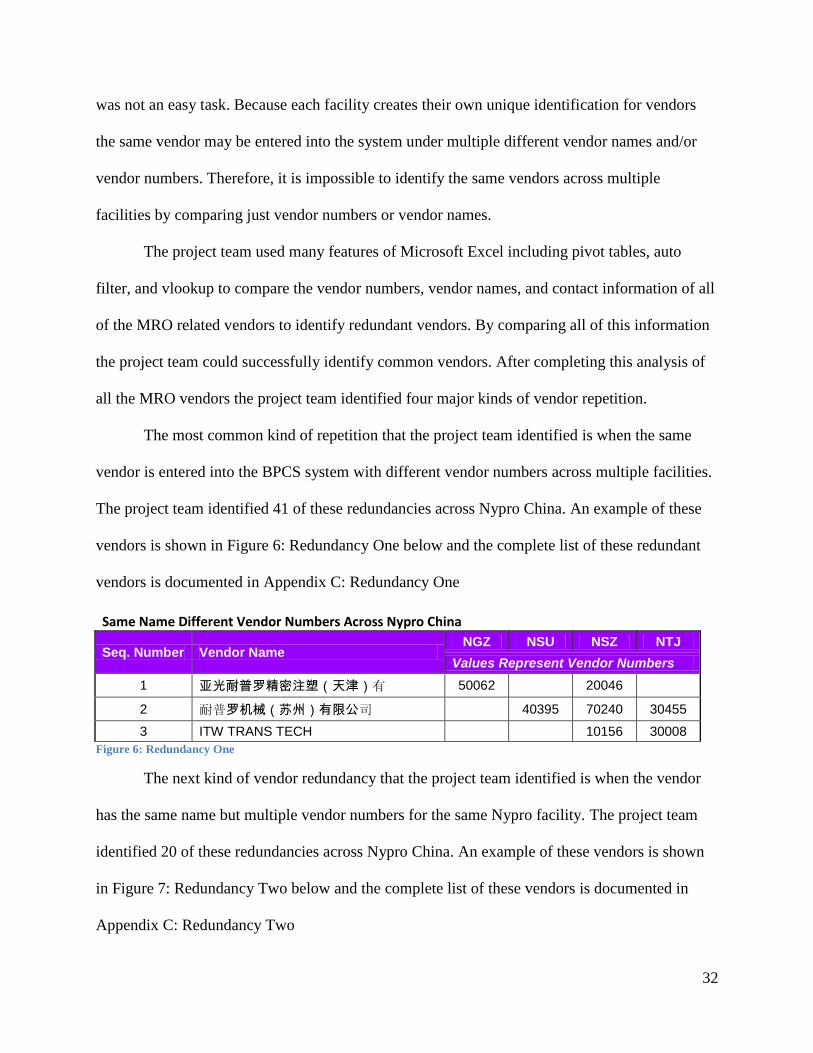
The most common kind of repetition that the project team identified is when the same
vendor is entered into the BPCS system with different vendor numbers across multiple facilities.
The project team identified 41 of these redundancies across Nypro China. An example of these
vendors is shown in Figure 6: Redundancy One below and the complete list of these redundant
vendors is documented in Appendix C: Redundancy One
Same Name Different Vendor Numbers Across Nypro China
Seq. Number Vendor Name NGZ NSU NSZ NTJ
Values Represent Vendor Numbers
1 亚光耐普罗精密注塑(天津)有 50062 20046
2 耐普罗机械(苏州)有限公司 40395 70240 30455
3 ITW TRANS TECH 10156 30008
Figure 6: Redundancy One
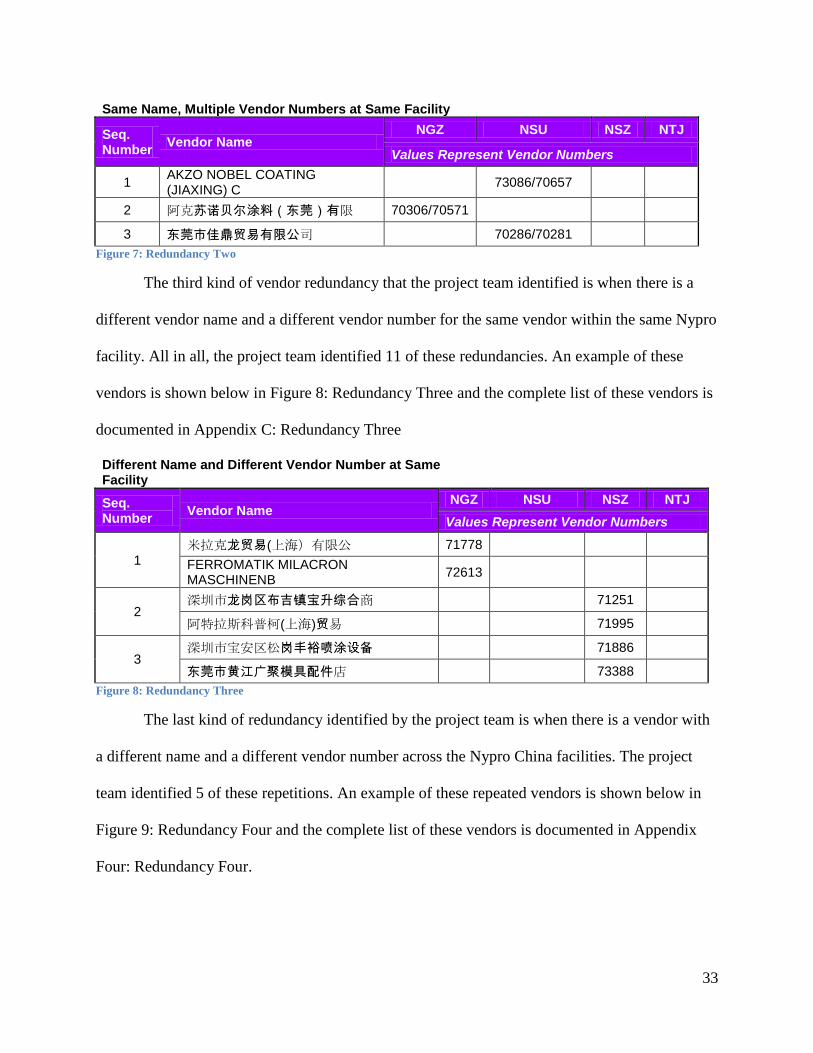
The next kind of vendor redundancy that the project team identified is when the vendor
has the same name but multiple vendor numbers for the same Nypro facility. The project team
identified 20 of these redundancies across Nypro China. An example of these vendors is shown
in Figure 7: Redundancy Two below and the complete list of these vendors is documented in
Appendix C: Redundancy Two
33
Same Name, Multiple Vendor Numbers at Same Facility
Seq. Number
Vendor Name NGZ NSU NSZ NTJ
Values Represent Vendor Numbers
1 AKZO NOBEL COATING (JIAXING) C
73086/70657
2 阿克苏诺贝尔涂料(东莞)有限 70306/70571
3 东莞市佳鼎贸易有限公司 70286/70281
Figure 7: Redundancy Two
The third kind of vendor redundancy that the project team identified is when there is a
different vendor name and a different vendor number for the same vendor within the same Nypro
facility. All in all, the project team identified 11 of these redundancies. An example of these
vendors is shown below in Figure 8: Redundancy Three and the complete list of these vendors is
documented in Appendix C: Redundancy Three
Different Name and Different Vendor Number at Same Facility
Seq. Number
Vendor Name NGZ NSU NSZ NTJ
Values Represent Vendor Numbers
1 米拉克龙贸易(上海)有限公 71778
FERROMATIK MILACRON MASCHINENB
72613
2 深圳市龙岗区布吉镇宝升综合商 71251
阿特拉斯科普柯(上海)贸易 71995
3 深圳市宝安区松岗丰裕喷涂设备 71886
东莞市黄江广聚模具配件店 73388
Figure 8: Redundancy Three
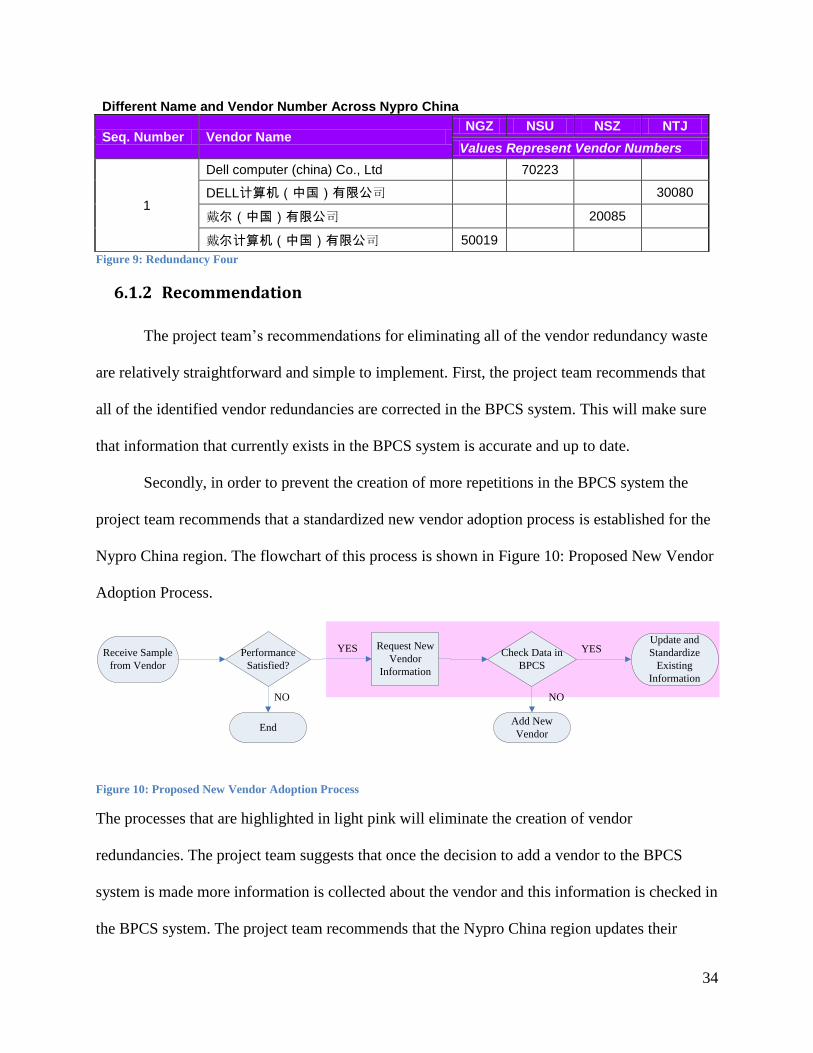
The last kind of redundancy identified by the project team is when there is a vendor with
a different name and a different vendor number across the Nypro China facilities. The project
team identified 5 of these repetitions. An example of these repeated vendors is shown below in
Figure 9: Redundancy Four and the complete list of these vendors is documented in Appendix
Four: Redundancy Four.
34
Different Name and Vendor Number Across Nypro China
Seq. Number Vendor Name NGZ NSU NSZ NTJ
Values Represent Vendor Numbers
1
Dell computer (china) Co., Ltd 70223
DELL计算机(中国)有限公司 30080
戴尔(中国)有限公司 20085
戴尔计算机(中国)有限公司 50019
Figure 9: Redundancy Four
6.1.2 Recommendation
The project team’s recommendations for eliminating all of the vendor redundancy waste
are relatively straightforward and simple to implement. First, the project team recommends that
all of the identified vendor redundancies are corrected in the BPCS system. This will make sure
that information that currently exists in the BPCS system is accurate and up to date.
Secondly, in order to prevent the creation of more repetitions in the BPCS system the
project team recommends that a standardized new vendor adoption process is established for the
Nypro China region. The flowchart of this process is shown in Figure 10: Proposed New Vendor
Adoption Process.
Receive Sample
from Vendor
Performance
Satisfied?
Request New
Vendor
Information
End
Check Data in
BPCS
Add New
Vendor
Update and
Standardize
Existing
Information
YES
NO
YES
NO
Figure 10: Proposed New Vendor Adoption Process
The processes that are highlighted in light pink will eliminate the creation of vendor
redundancies. The project team suggests that once the decision to add a vendor to the BPCS
system is made more information is collected about the vendor and this information is checked in
the BPCS system. The project team recommends that the Nypro China region updates their
35
current new vendor adoption form to include all current contact information AND prior company
names and addresses. This additional information can be used to perform a search in the BPCS
system to see if the vendor already exists under a different identification. If the search is not
successful then the chances of that vendor existing in the BPCS system is unlikely. However, if
the vendor is found then a standardized vendor identification can be created. This process also
identifies vendors that are common across multiple facilities and could be considered for a
strategic relationship.
6.1.3 Value
Through implementation of these recommendations Nypro China will benefit in several
ways. Implementation of a standardized process for adding new vendors to the BPCS system will
benefit Nypro China because vendor repetitions will no longer be created in the BPCS system.
Adoption of this process creates a standardized vendor identification across the Nypro China
region. The benefits of standardized vendor identification are two-fold:
First, standardized vendor information allows for better communication and shared
knowledge across facilities. This creates a shift towards a more strategic purchasing process that
is done at the regional level, rather than the plant level.
Secondly, the adoption of this process helps to identify vendors that are used at multiple
facilities and could be potential strategic vendors. Through supplier negotiation techniques,
quantity discounts, long-term relationships and other strategic relationships may be established
with vendors that are common across multiple facilities to achieve a cost-savings.
36
6.1.4 Limitations
It is important to explain the limitations that the project team experienced during the
identification of vendor redundancy waste. Because the project team was unable to collect
contact information for all of the MRO vendors at each facility there may be more unidentified
redundancies in the BPCS system. However, using the same methodology as the project team the
Nypro China supply chain team can update the missing vendor information and search for any
additional redundancies.
6.2 High Quantity of Purchase Orders
The second kind of waste identified by the project team is a high quantity of purchase
orders during FY08. The project team identified that Nypro is processing a very high quantity of
purchase orders with some vendors. For example, during FY08 Nypro Tianjin processed more
than 457 purchase order with one vendor! This accounts for more than two purchase orders every
working day. In order to make this problem clear the project team considered two assumptions:
Nypro is processing too many purchase orders and that there is a better purchasing method to
process less purchase orders.
6.2.1 Identify
In order to calculate the number of purchase orders for each vendor the project team used
the pivot table feature of Microsoft Excel to count each unique purchase order number from each
vendor during FY08. After this analysis the project team discovered that Nypro China processed
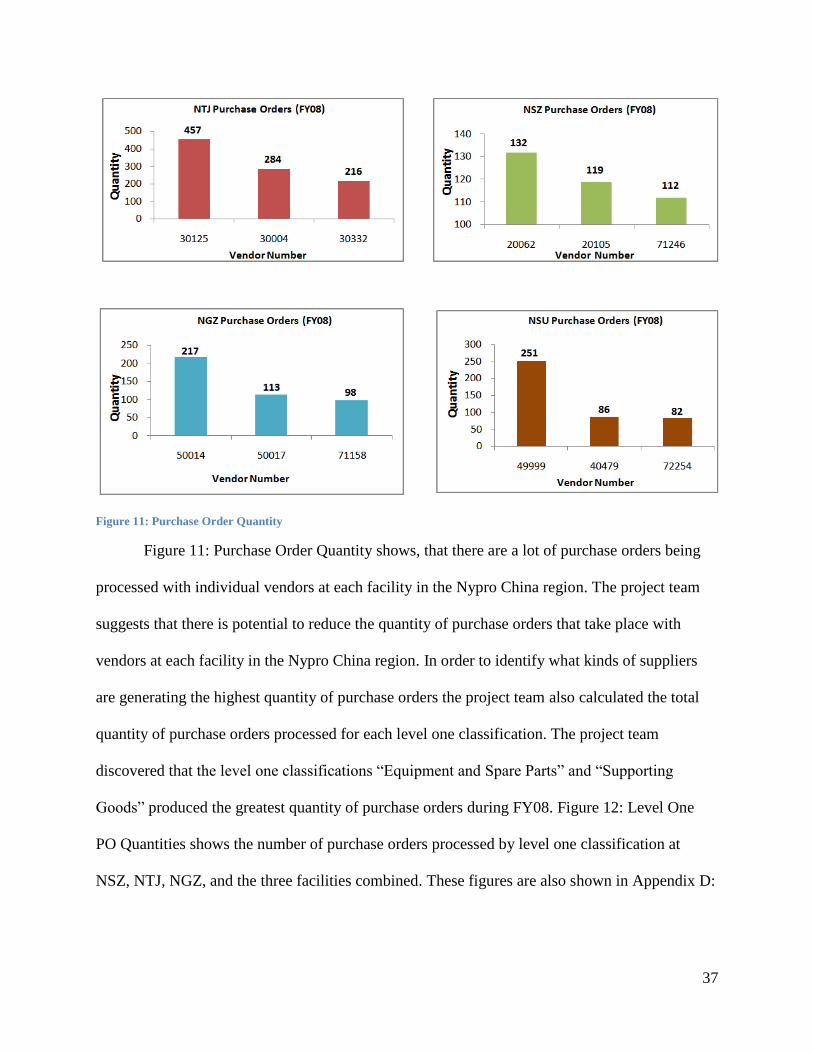
11,162 purchase orders during FY08. The top three vendors with the highest quantity of purchase
orders processed for each facility during FY08 are shown in Figure 11: Purchase Order Quantity.
37
Figure 11: Purchase Order Quantity
Figure 11: Purchase Order Quantity shows, that there are a lot of purchase orders being
processed with individual vendors at each facility in the Nypro China region. The project team
suggests that there is potential to reduce the quantity of purchase orders that take place with
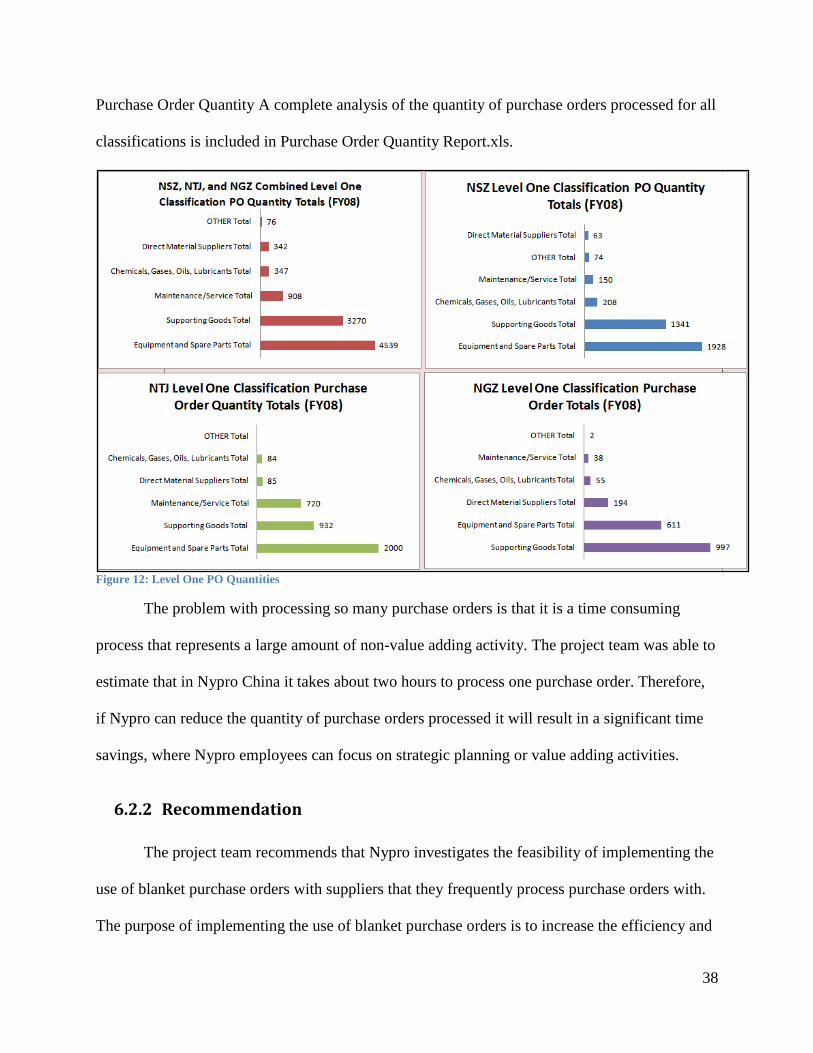
vendors at each facility in the Nypro China region. In order to identify what kinds of suppliers
are generating the highest quantity of purchase orders the project team also calculated the total
quantity of purchase orders processed for each level one classification. The project team
discovered that the level one classifications “Equipment and Spare Parts” and “Supporting
Goods” produced the greatest quantity of purchase orders during FY08. Figure 12: Level One
PO Quantities shows the number of purchase orders processed by level one classification at
NSZ, NTJ, NGZ, and the three facilities combined. These figures are also shown in Appendix D:
38
Purchase Order Quantity A complete analysis of the quantity of purchase orders processed for all
classifications is included in Purchase Order Quantity Report.xls.
Figure 12: Level One PO Quantities
The problem with processing so many purchase orders is that it is a time consuming
process that represents a large amount of non-value adding activity. The project team was able to
estimate that in Nypro China it takes about two hours to process one purchase order. Therefore,
if Nypro can reduce the quantity of purchase orders processed it will result in a significant time
savings, where Nypro employees can focus on strategic planning or value adding activities.
6.2.2 Recommendation
The project team recommends that Nypro investigates the feasibility of implementing the
use of blanket purchase orders with suppliers that they frequently process purchase orders with.
The purpose of implementing the use of blanket purchase orders is to increase the efficiency and

39
productivity of the purchasing process. A blanket purchase order is typically used for items or
services that are used repeatedly and is effective for a fixed period of time. Using a blanket
purchase order makes managing relationships with suppliers with a high quantity of purchase
orders easier because it consolidates multiple purchase orders on one blanket purchase order.
There are several steps in order to successfully implement the use of blanket purchase
orders. The first step that the project team recommends is that the Nypro China supply chain
team determines what commodities are most suitable and have the best chance of success for
implementing the use of blanket purchase orders. It is an industry best practice that blanket
purchase orders work best to improve the purchasing process of repeatedly purchased low-value
items.20
For Nypro China this could represent items that are bought within the “Supporting
Goods” MRO classification.
Secondly, the project team suggests that prior purchasing data is used to forecast the
demand for MRO items. This information can then be used to determine the time period for
establishing the blanket purchase order. This information could also be shared with suppliers to
establish better performance and to help builder a better relationship.
The next step in order to effectively implement a blanket purchase order strategy is to
determine which suppliers are willing to establish blanket purchase order relationships.
Maintaining a blanket purchase order is not an easy job for some vendors and this kind of
relationship requires a sophisticated and qualified supplier. The proposed vendor reduction
model discussed in Findings Three – MRO Supplier Evaluation Model could be used to help
qualify suppliers for blanket purchase order use.
The last step to implementing an effective blanket purchase order strategy is to negotiate
terms with vendors. The Negotiation in China section of this report explains in details some best
20
(Carter, 2002)
40
practices for negotiating in China. It is important to negotiate with suppliers because it will help
ensure that the goals and objectives of the partnership are clearly defined to both parties and the
best deal is made.21
6.2.3 Value
Implementing a strategy that effectively utilizes blanket purchase orders across Nypro
China could significantly decrease the amount of time and money that is spent processing
purchase orders. Although it is difficult to quantify how much time would be saved for each
blanket purchase order that is implemented it is clear that in the current purchasing system there
is a significant amount of time spent processing purchase orders. If the quantity of purchase
orders is reduced then buyers will have more time to focus their efforts on value-adding
activities. Another benefit is that Nypro may be able to consolidate their supplier base and
receive a quantity discount from vendors that they negotiate blanket purchase orders with. The
benefits of implementing blanket purchase orders also extend to the vendors. For vendors they
will benefit from a more consistent and potentially increased volume of business. This will allow
for vendors to maintain better control over their production cycle and deliver savings in better
performance or price.22
6.2.4 Limitations
This analysis of purchase order quantities does not take into account vendor redundancy;
therefore some vendors will have higher purchase order quantities if they are added together. It is
also important to note that this analysis is not complete, rather it should be considered as a
starting point for future investigation. In the course of a seven week analysis it is difficult to
21
(Vantage Partners, 2008) 22
(U.S. General Services Administration, 2008)
41
gather enough information to successfully implement a blanket purchase order strategy; however
the project team’s work summarizes the information needed and provides a suggested
methodology for moving forward.
6.3 Low Volume Vendors
The last kind of waste that the project team identified in their research stems from Nypro’s
use to too many low-volume vendors. The project team defines low-volume vendors as vendors
that have infrequent, unplanned purchases that make up a low purchasing value. It is beneficial
to investigate these vendors because they represent a potential cost savings through vendor
consolidation.
42
6.3.1 Identify
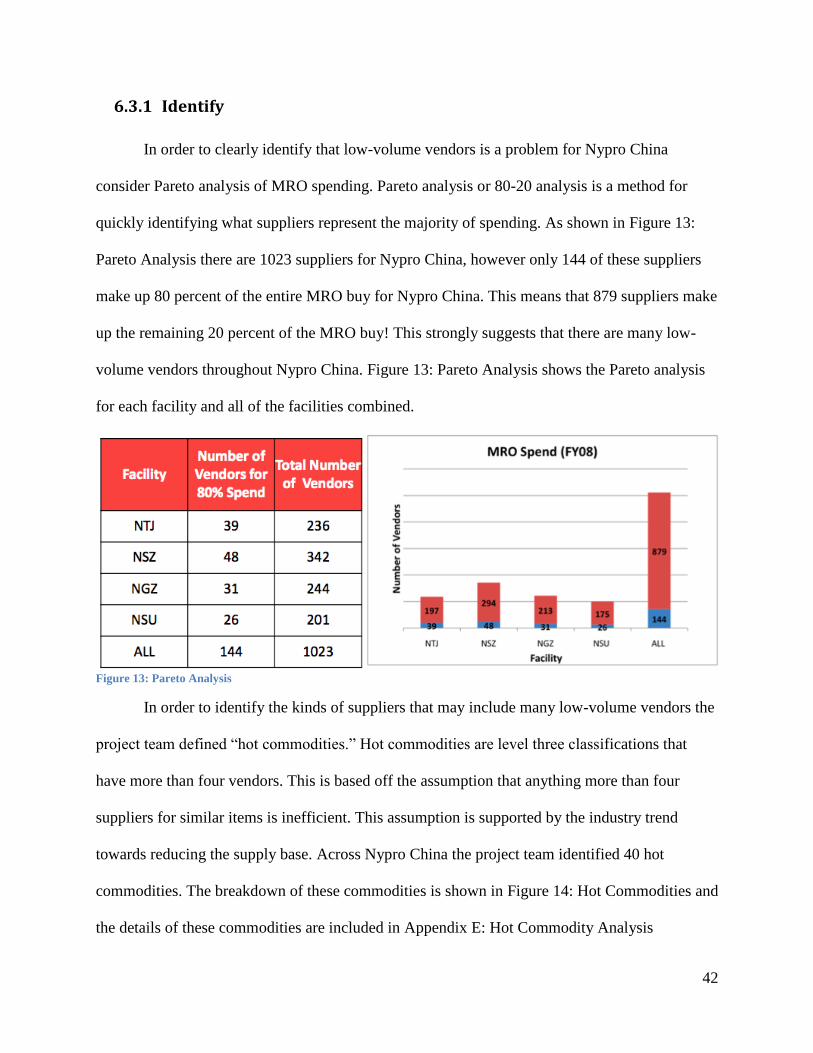
In order to clearly identify that low-volume vendors is a problem for Nypro China
consider Pareto analysis of MRO spending. Pareto analysis or 80-20 analysis is a method for
quickly identifying what suppliers represent the majority of spending. As shown in Figure 13:
Pareto Analysis there are 1023 suppliers for Nypro China, however only 144 of these suppliers
make up 80 percent of the entire MRO buy for Nypro China. This means that 879 suppliers make
up the remaining 20 percent of the MRO buy! This strongly suggests that there are many low-
volume vendors throughout Nypro China. Figure 13: Pareto Analysis shows the Pareto analysis
for each facility and all of the facilities combined.
Figure 13: Pareto Analysis
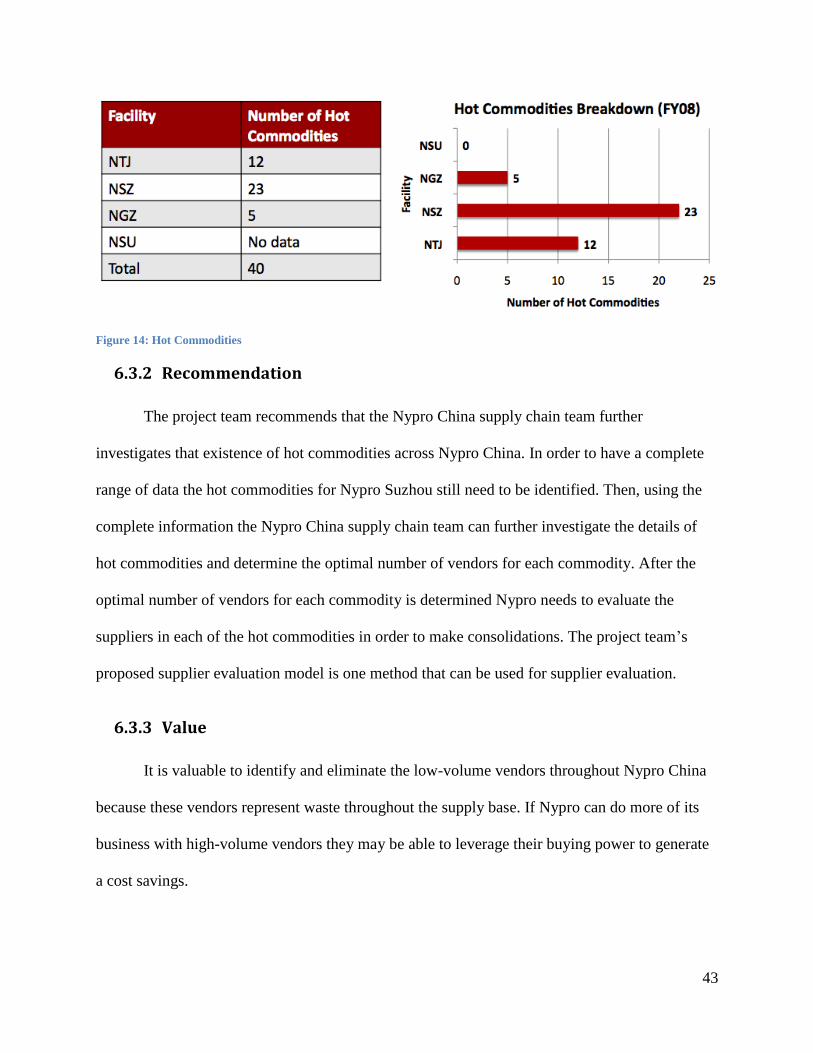
In order to identify the kinds of suppliers that may include many low-volume vendors the
project team defined “hot commodities.” Hot commodities are level three classifications that
have more than four vendors. This is based off the assumption that anything more than four
suppliers for similar items is inefficient. This assumption is supported by the industry trend
towards reducing the supply base. Across Nypro China the project team identified 40 hot
commodities. The breakdown of these commodities is shown in Figure 14: Hot Commodities and
the details of these commodities are included in Appendix E: Hot Commodity Analysis
43
Figure 14: Hot Commodities
6.3.2 Recommendation
The project team recommends that the Nypro China supply chain team further
investigates that existence of hot commodities across Nypro China. In order to have a complete
range of data the hot commodities for Nypro Suzhou still need to be identified. Then, using the
complete information the Nypro China supply chain team can further investigate the details of
hot commodities and determine the optimal number of vendors for each commodity. After the
optimal number of vendors for each commodity is determined Nypro needs to evaluate the
suppliers in each of the hot commodities in order to make consolidations. The project team’s
proposed supplier evaluation model is one method that can be used for supplier evaluation.
6.3.3 Value
It is valuable to identify and eliminate the low-volume vendors throughout Nypro China
because these vendors represent waste throughout the supply base. If Nypro can do more of its
business with high-volume vendors they may be able to leverage their buying power to generate
a cost savings.

44
6.3.4 Limitations
It is important to stress the significance of the major assumption that was made in order to
identify the hot commodities for Nypro China. The project team assumed the anything more than
four suppliers for similar items is inefficient. However, there are cases where it may be necessary
for Nypro to have more than four suppliers for similar items. For example, it may be necessary
for Nypro to have many different suppliers for molding machines because it is a very important,
technical aspect of their operation. On the other hand, it may be wasteful for Nypro to have more
than four suppliers for a commodity such as office stationary supplies. That is why it is important
for the Nypro China team to further evaluate the optimal number of suppliers for commodity
groups.
7 Findings Three – MRO Supplier Evaluation Model
Supplier evaluation is an important task because it is the base for supplier reduction and
helps to structure a powerful supply chain.23
Traditionally, vendor selection was based on
picking the supplier with the best price, however today it is important to evaluate suppliers based
off the their total cost which includes indirect supplier costs such as those associated with late
delivery and poor quality.24
The project team’s proposed MRO supplier evaluation model was
designed to average a multitude of supplier performance metrics to calculate a standardized
rating that can be used to help determine which vendors to consolidate.
23
(Kemp, MRO Today, 2002) 24
(Filip Roodhooft, 2005)
45
7.1 Model Structure
The project team decided to use a weighted-point model to evaluate supplier performance.
Essentially, implementing a weighted-point model involves selecting a number of criteria,
determining different weights and selecting the supplier with the highest weighted total score.25
In order to create a model that is broad enough to cover the many aspects of supplier
performance the project team’s proposed model has a two level criteria system. The two level
system provides a more specific and informed ranking of supplier performance. The first level
criteria are called the “major factors” and the level two criteria are “sub-factors” that make the
major factors more measureable. The project teams suggested factors are shown in Figure 15:
Major Factors and Sub Factors.
25
(Wind, 1968)
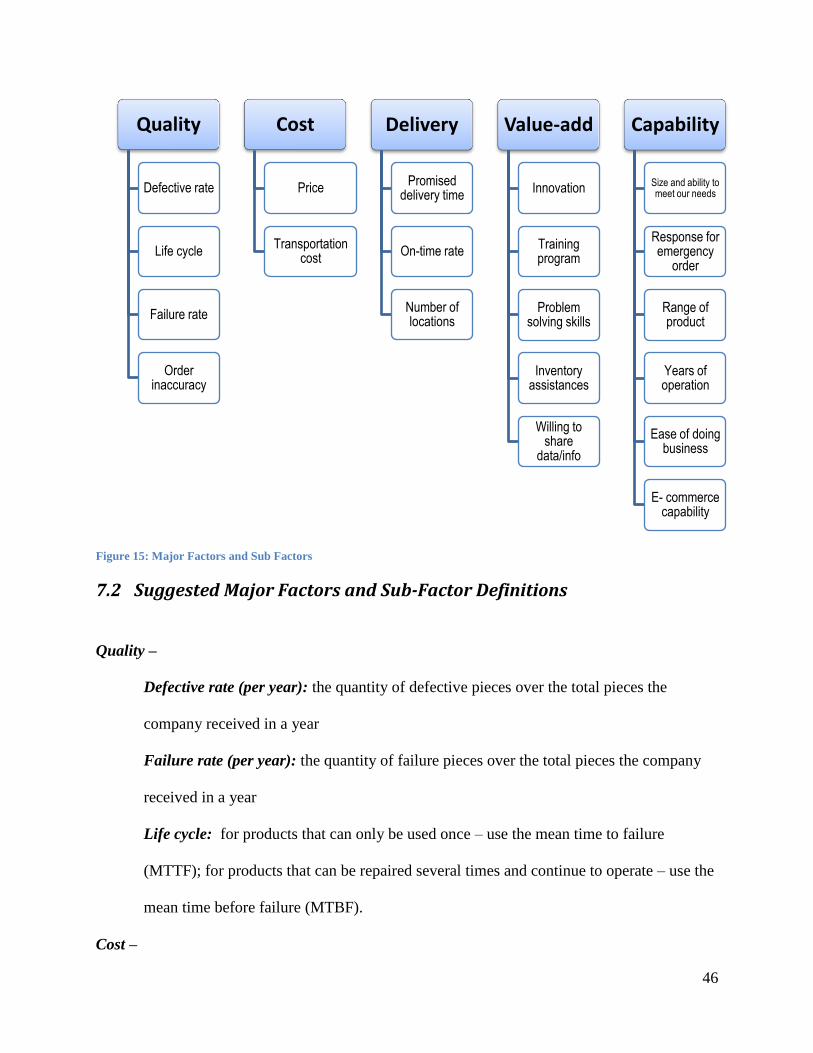
46
Figure 15: Major Factors and Sub Factors
7.2 Suggested Major Factors and Sub-Factor Definitions
Quality –
Defective rate (per year): the quantity of defective pieces over the total pieces the
company received in a year
Failure rate (per year): the quantity of failure pieces over the total pieces the company
received in a year
Life cycle: for products that can only be used once – use the mean time to failure
(MTTF); for products that can be repaired several times and continue to operate – use the
mean time before failure (MTBF).
Cost –
Quality
Defective rate
Life cycle
Failure rate
Order inaccuracy
Cost
Price
Transportation cost
Delivery
Promised delivery time
On-time rate
Number of locations
Value-add
Innovation
Training program
Problem solving skills
Inventory assistances
Willing to share
data/info
Capability
Size and ability to meet our needs
Response for emergency
order
Range of product
Years of operation
Ease of doing business
E- commerce capability
47
Price: the price of the material or service.
Transportation cost: included any transportation or freight cost that is not included in the
price of the item.
Delivery –
Promised delivery time: recorded on purchase order and invoice.
On-time rate: times that the goods arrive on time over the total number of orders
received.
Number of locations: count of locations.
Value-added –
Innovation: measured by number of patents.
Training program: marked 100 if have, 1 if not.
Problem solving skills: score problem solving skills from 1 – 100 based off willingness
and ability to address specific problems.
Inventory assistances (VMI): marked 100 if have, 1 if not.
Ease of doing business: measured by time needed to set down a transaction.
Willing to share data/info: percentage of information shared.
Capability –
Size and ability to meet our needs: percentage of times that can meet our needs.
Response performance for emergency order: guaranteed delivery available marked 100
if have, 1 if not.
Range of products: number of needed commodities the vendor can provide.
Years of operation: number of years in operation.
Ease of doing business: measured by the P.O. number per year.
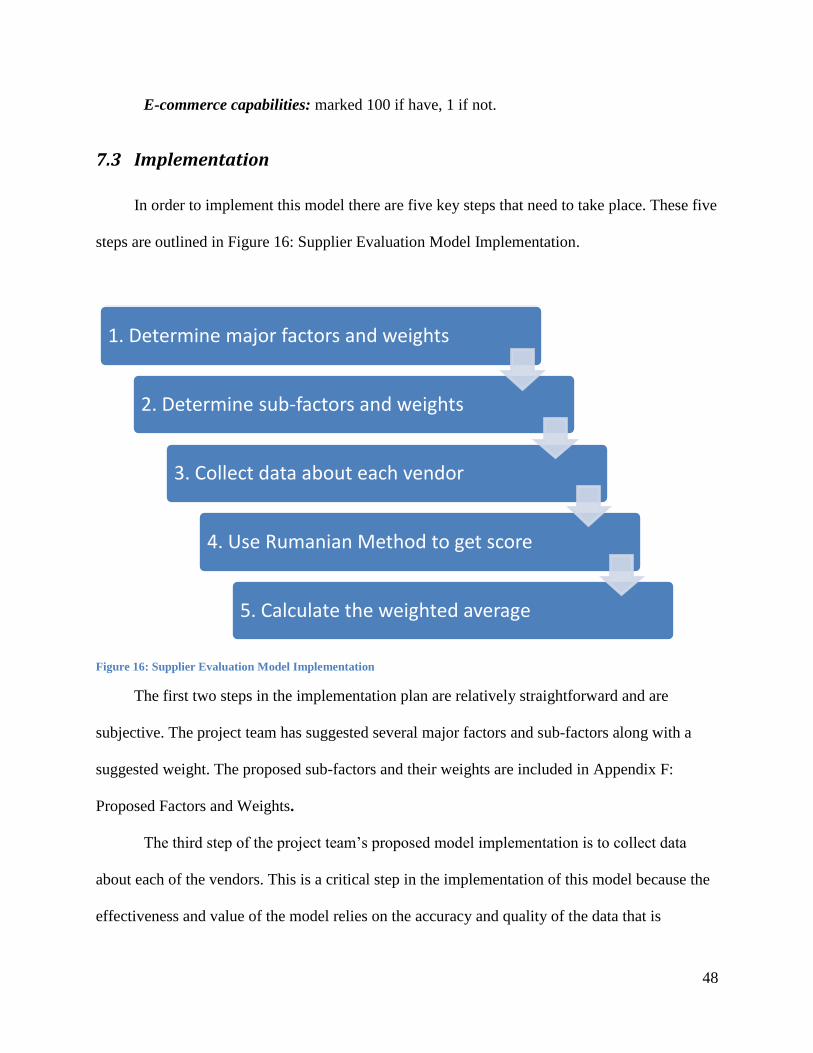
48
E-commerce capabilities: marked 100 if have, 1 if not.
7.3 Implementation
In order to implement this model there are five key steps that need to take place. These five
steps are outlined in Figure 16: Supplier Evaluation Model Implementation.
Figure 16: Supplier Evaluation Model Implementation
The first two steps in the implementation plan are relatively straightforward and are
subjective. The project team has suggested several major factors and sub-factors along with a
suggested weight. The proposed sub-factors and their weights are included in Appendix F:
Proposed Factors and Weights.
The third step of the project team’s proposed model implementation is to collect data
about each of the vendors. This is a critical step in the implementation of this model because the
effectiveness and value of the model relies on the accuracy and quality of the data that is
1. Determine major factors and weights
2. Determine sub-factors and weights
3. Collect data about each vendor
4. Use Rumanian Method to get score
5. Calculate the weighted average
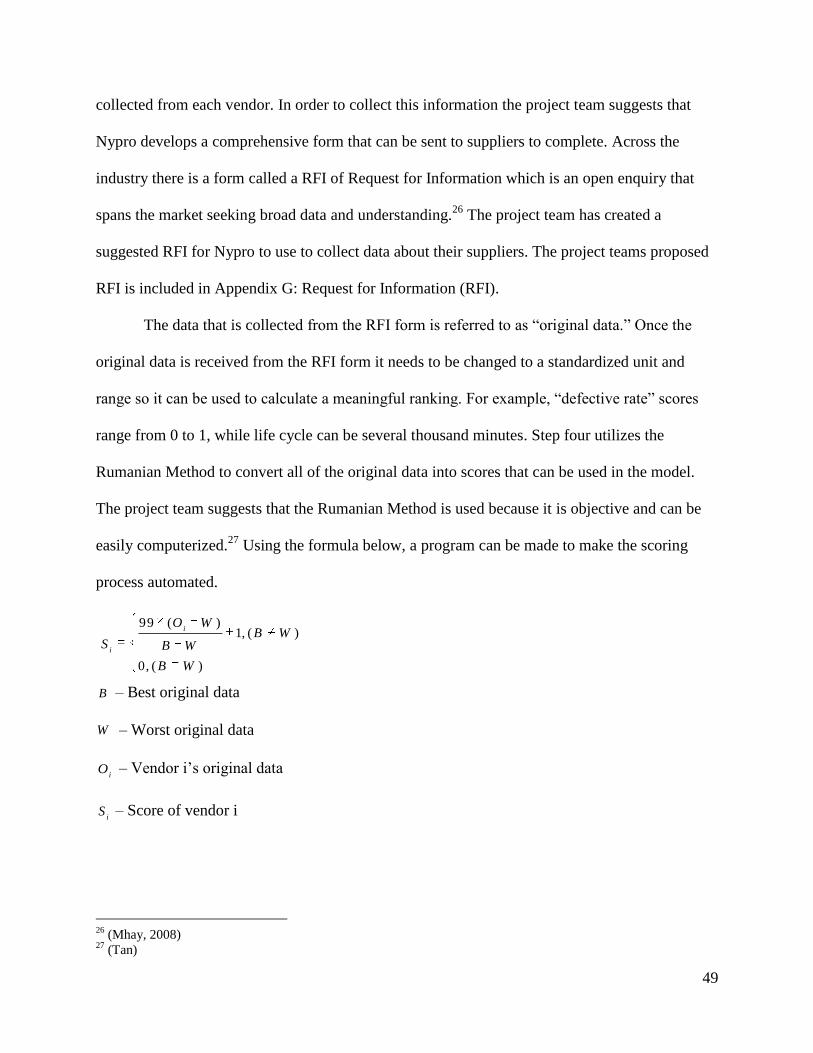
49
collected from each vendor. In order to collect this information the project team suggests that
Nypro develops a comprehensive form that can be sent to suppliers to complete. Across the
industry there is a form called a RFI of Request for Information which is an open enquiry that
spans the market seeking broad data and understanding.26
The project team has created a
suggested RFI for Nypro to use to collect data about their suppliers. The project teams proposed
RFI is included in Appendix G: Request for Information (RFI).
The data that is collected from the RFI form is referred to as “original data.” Once the
original data is received from the RFI form it needs to be changed to a standardized unit and
range so it can be used to calculate a meaningful ranking. For example, “defective rate” scores
range from 0 to 1, while life cycle can be several thousand minutes. Step four utilizes the
Rumanian Method to convert all of the original data into scores that can be used in the model.
The project team suggests that the Rumanian Method is used because it is objective and can be
easily computerized.27
Using the formula below, a program can be made to make the scoring
process automated.
B – Best original data
W – Worst original data
iO – Vendor i’s original data
iS – Score of vendor i
26
(Mhay, 2008) 27
(Tan)
99 ( )1, ( )
0, ( )
i
i
O WB W
S B W
B W

50
Using this scoring method the best vendor will receive a score of 100 and the worst vendor a
score of 1, the remaining vendors will receive a score between 1 and 100 with higher scores
representing the better vendors.
Finally, using the standardized data, the weighted average is calculated for all of the sub-
factors and major factors to calculate total score. Vendors with a higher total score represent
more qualified and capable vendors. To more clearly understand the last two steps in the supplier
evaluation model consider the following example.
Original Data from RFI
Major Factor
Weight Sub - Factors Weight Vendor
1 Vendor
2 Vendor
3 Vendor
4
Quality 0.3
Defective rate 0.1 1% 3% 2% 0%
Life cycle 0.6 40 42 38 36
Failure rate 0.2 3% 1% 2% 1%
Order accuracy 0.1 0% 1% 0% 0%
Figure 17: Original Data
In Figure 17: Original Data the original data from the RFI form is shown for each vendor. The
next step is to standardize this data by using the Rumanian Method as shown in Figure 18:
Standardized Data.
Standardized Data by Rumanian Method
Major Factor Weight Sub - Factors Weight
Vendor 1
Vendor 2
Vendor 3
Vendor 4
Quality 0.3
Defective rate 0.1 67 1 34 100
Life cycle 0.6 67 100 34 1
Failure rate 0.2 1 100 51 100
Order accuracy 0.1 100 1 100 100
Figure 18: Standardized Data
Next, the standardized data is used to calculate the weighted average of the sub-factors to
calculate the total score for the major factor – quality. See Figure 19: Weighted Average

51
Calculating the Weighted Average of Major Factors
Major Factor
Weight Sub - Factors Weight Vendor
1 Vendor
2 Vendor
3 Vendor
4
Quality 0.3
Defective rate 0.1 67 1 34 100
Life cycle 0.6 67 100 34 1
Failure rate 0.2 1 100 51 100
Order accuracy 0.1 100 1 100 100
Total score of quality - 57.1 80.2 43.9 40.6
Figure 19: Weighted Average
This process is repeated for every major factor and then the weighted average of the major
factors is calculated to determine the final score. See Figure 20: Vendor Rating.
Calculating Overall Vendor Rating
Major Factor
Weight Vendor
1 Vendor
2 Vendor
3 Vendor
4
Quality 0.3 57.1 80.2 43.9 40.6
Cost 0.25 40.8 50.7 81.3 48.2
Delivery 0.15 58.1 48.3 76.3 83.1
Value-add 0.15 60.5 81.3 42.2 58.1
Capability 0.15 45.1 76.4 67.2 78.9
Final Score 51.9 67.9 61.4 57.2
Ranking 4 1 2 3 Figure 20: Vendor Rating
From this example one can tell that vendors 2 and 3 have this highest final score, so this suggests
that they are the most qualified vendors.
7.4 Recommendations
The project team recommends that Nypro implements a supplier evaluation model that is
similar the model proposed in this report. This standardized supplier evaluation process is one
effective method for comparing similar suppliers who may not seem different until their total
57.1 = (0.1*67) + (0.6*67) + (0.2*1) + (0.1*100)
67.9 = (0.3*80.2) + (0.25*67) + (0.15*81.3) + (0.15*76.4)
52
score is calculated. The project team also recommends that Nypro implements some kind of RFI
form to begin to collect more information about suppliers that can be used for supplier
evaluation. Through the implementation of these suggestions Nypro will be able to perform a
more effective and meaningful supplier evaluation. The project team recommends that over the
long run Nypro begins to shift the majority of business to vendors with a high total score (as
determined through supplier evaluation model). This is shown in Figure 21: MRO Relationships.
Figure 21: MRO Relationships
7.5 Limitations
The supplier evaluation model and RFI form that the project team has created should be
used as starting points to creating a model and RFI form that is customized for the Nypro China
operation. Due to time constraints on the project the project team based this model off
observations and best practices. In a perfect situation this model and RFI form would be based
off Nypro’s specific needs and its creation would involve the input of several managers from
various Nypro China departments.
53
8 Overall Recommendations
To review all of the recommendations the project team has divided the suggestions into
short term and long term recommendations. Short term recommendations can be completed in
less than six months, while long term recommendations take longer than half a year.
8.1 Short-term Recommendations
8.1.1 Create MRO Commodity Study Team
As Dr. Kemp suggests the first step to improving the MRO buy is to create a strategic
MRO commodity study team.28
The project team recommends that this team is diverse and
cross-functional. The team should include members not only from purchasing, but from
engineering, finance, and operations to make sure that no aspect of MRO evaluation is
overlooked or neglected. Much of the preliminary analysis and data collection that this team
would be responsible for has already been done by the project team. The goals of this team are
long-term recommendations and include moving forward with MRO classification and supplier
evaluation. These long-term recommendations are explained more in Goals for MRO
Commodity Study Team.
8.1.2 Standardize the New Vendor Adoption Process
As suggested earlier in section 6.2, High Quantity of Purchase Orders, Nypro China
should standardize the new vendor adoption process. This is a process that can be implemented
immediately and its results are also immediate and significant. First, by standardizing this
process this will stop the creation of duplicate vendors in the BPCS system. Secondly,
28
(Kemp, MRO Today, 2004)
54
standardized processes across Nypro China will help to establish coordination at the regional
level. This process will also allow Nypro China to collect more information about their suppliers
which could be used to gain a competitive advantage through strategic supplier management.
8.1.3 Cleanse Vendor Data
The project team has identified 77 different vendor redundancies in the BPCS system
which represents inaccurate information in the BPCS system. The project team recommends that
Nypro updates these errors in the BPCS system immediately. This will create standardized
vendor identifications in the BPCS system which will help Nypro China to leverage their buying
power across the region. The project team also recommends that information in the BPCS system
is checked for accuracy and updated periodically to keep contact information up to date.
8.1.4 Separate Direct Materials from MRO
The last short term recommendation proposed by the project team is to create a system to
separate direct materials samples from the MRO spend. In the current system it is a time
consuming process to identify which suppliers are providing MRO items and which ones are
providing direct materials samples. By separating this spending from the MRO spending one will
be able to quickly and easily distinguish the MRO spend from the direct materials samples
spend. The project team has identified a quick fix to this problem – Create a dedicated direct
materials samples vendor for each facility in the BPCS system. All of the direct materials
samples should be purchased through one vendor name for each facility. For example all direct
materials samples for Nypro Tianjin should be purchased under the vendor NTJ DIRECT
SAMPLES. This recommendation is a simple fix that will effectively distinguish direct materials
samples and MRO spending.
55
8.2 Long-term Recommendations
8.2.1 Goals for MRO Commodity Study Team
Although the creation of the MRO commodity study team is a short term goal the goals
of this team are implemented over the long term. The first goal for the MRO commodity team
should be to implement a standardized MRO classification system across Nypro China. The
classification system proposed by the project team is a great starting point for future work
however; before it is implemented it should be refined and expanded to make sure that it is
perfect for the Nypro China operation. Also the classifications that the project team made should
be reviewed at each facility to make sure that each supplier has the best classification.
The second goal for the MRO commodity study team should be to select major MRO
commodities for analysis.29
This team will be responsible for evaluating the needs of these
commodities and collecting information about them at the regional level. Using this information
the project team will be able to identify commodities that have the best chance of successful
consolidation and cost savings.
The last suggested goal for the MRO commodity study team is to implement a strategy to
collect more information about vendors for evaluation and consolidation. There are many ways
to collect this information such as the RFI form proposed in Appendix G: Request for
Information (RFI). Using this information Nypro China will be able to perform a comprehensive
supplier evaluation and consolidate their supply base effectively.
29
(Kemp, MRO Today, 2004; Kemp, MRO Today, 2004)
56
8.2.2 Vendor Evaluation Process
As explained in Findings Three – MRO Supplier Evaluation Model this is a important
aspect to evaluating the effectiveness of a supply chain. The project team suggests that Nypro
China expands upon the proposed supplier evaluation model and determines key vendors for
consolidation and strategic relationship opportunities.
8.2.3 Map-Out Purchasing Processes
The project team also recommends that Nypro China looks into mapping out all of the
current purchasing processes for each facility and creating a lean, six sigma, HVS project. By
mapping out all of the purchasing processes for each facility the HVS team will be able to
identify waste and inefficiencies in the current processes. Then by applying six sigma and lean
thinking principles these processes can be optimized and standardized at the regional level. This
will make processes easier to implement and will encourage communication and coordination at
the regional level.
8.2.4 Monitor Usage
The last long term recommendation that the project team suggests is for Nypro China to
begin to monitor MRO buying behaviors and patterns. There are many different software
programs that are available to track and monitor inventory levels and spending. This kind of
information is useful to an organization because it can be used to work with suppliers during
negotiation to create better performance and price.
Nypro Clinton is an example of one Nypro facility which has already started to implement
some of these strategies to improve their MRO operation. A case study of the Nypro Clinton
facility is included in the following section, Nypro Clinton Case Study.
57
9 Nypro Clinton Case Study
The purpose of this case study was to understand the MRO purchasing process at Nypro
Clinton and to understand how the MRO spend is managed at Nypro Clinton to provide to Nypro
China a benchmark of what other Nypro facilities are doing.
At Nypro Clinton purchase orders for indirect materials originate from the engineers within
their respective departments. When the department needs to order something they will complete
a document that contains information about: the part numbers to be ordered, vendor
identification number, quantities, and prices. It is up to the employee requesting the PO to get a
quote for the items to be ordered and determine which vendor to use. Once they have completed
the PO it is sent to a Central Store Technician and the PO is processed using the BPCS system.
This system has an extensive database of vendor numbers and part numbers that have been
utilized in the past. Nypro Clinton’s purchasing group is in charge of maintaining the database of
vendors. Once the Technician receives the PO they enter all of the information from the PO into
BPCS and the BPCS system generates an official PO that is sent to both the requestor and the
vendor via email or efax. Once the vendor receives the PO it is confirmed and the order is
processed then the PO is matched with the invoice and packing slip to make sure the order is
correctly paid.
Another important type of purchase order that is used at the Clinton facility is a blanket
purchase order. At Nypro Clinton blanket purchase orders are capped at a certain dollar amount
at the beginning of each period. Every order that is placed with a vendor using a blanket PO is
listed under the same purchase order during the period. If the dollar amount established on the
blanket PO is expected to be exceeded before the end of the period this amount can be
augmented. At Nypro Clinton, each technician is in charge of a select number of blanket POs and

58
they are responsible for making sure that they are not exceeded and they also maintain a healthy
relationship with representatives from these vendors.
The Nypro Clinton facility uses a standardized form called a supplier identification form or
SIF to collect data about suppliers before they are entered into the BPCS system. The SIF form is
required to be completed for every supplier before they can be registered into the BPCS system.
The SIF form is comprehensive and collects information about the complete capabilities and
qualifications of the supplier before they are entered into the system. This is a great practice
because it makes supplier evaluation and consolidation an easier process because there is more
information to analyze.
Inventory management is another important aspect of MRO management at Nypro Clinton.
Central Store Technician Virgenmina Irizarry is in charge of controlling the inventory levels for
two MRO repositories at the Clinton facility. One facility in her control has mainly office
supplies, safety, janitorial supplies, and other miscellaneous MRO items. The other facility is
located adjacent to the injection molding machines and includes parts that are vital to the
maintenance, upkeep, and repair of these machines. Both of these MRO repositories are
important to keep satisfactory inventories levels because if these parts or materials are not
available the workflow is slowed and the downtime causes delays and lost profit.
The Clinton facility uses a powerful program called MP2 to track inventory levels, usage,
and monitor buying behaviors and patterns. All of the items that are available at the MRO
repositories are listed in the MP2 database by part number, quantity available, description, etc.
Each repository has a sign-out sheet where employees record exactly what they are taking out of
the inventory. At various points throughout the day Virgenmina checks the sign-out sheet and
updates the inventories in the MP2 system. To assure that the MP2 system is keeping an accurate
59
inventory of the items in the repository once or twice a week Virgenmina also performs a manual
count and scan of items that are held in the repository. The MP2 system also features a reporting
system that generates a weekly report including information about the usage of each department.
This report is sent out to all of the departments every week so they can keep track of their buying
patterns and behaviors at various time periods.
10 Conclusions and Future Work
The work of the project team centralized and made a lot of information about the MRO
spend for Nypro China available. In a very short period of time the project team was able to
identify several possible areas where the MRO buy can be improved and provide a
comprehensive methodology to move forward with these initiatives. The project team has
provided several recommendations for Nypro China as they move forward with the overall goal
of improving the MRO operation across the region. According to industry research, improving
the MRO buy is a worthwhile initiative for many organizations. This is certainly the case for
Nypro China – with an annual MRO spend of about 40 million United States dollars industry
experts estimate that a 10 percent reduction in total MRO spending is attainable.30
This
represents a significant cost savings for Nypro China.
30
(Kemp, MRO Today, 2003)
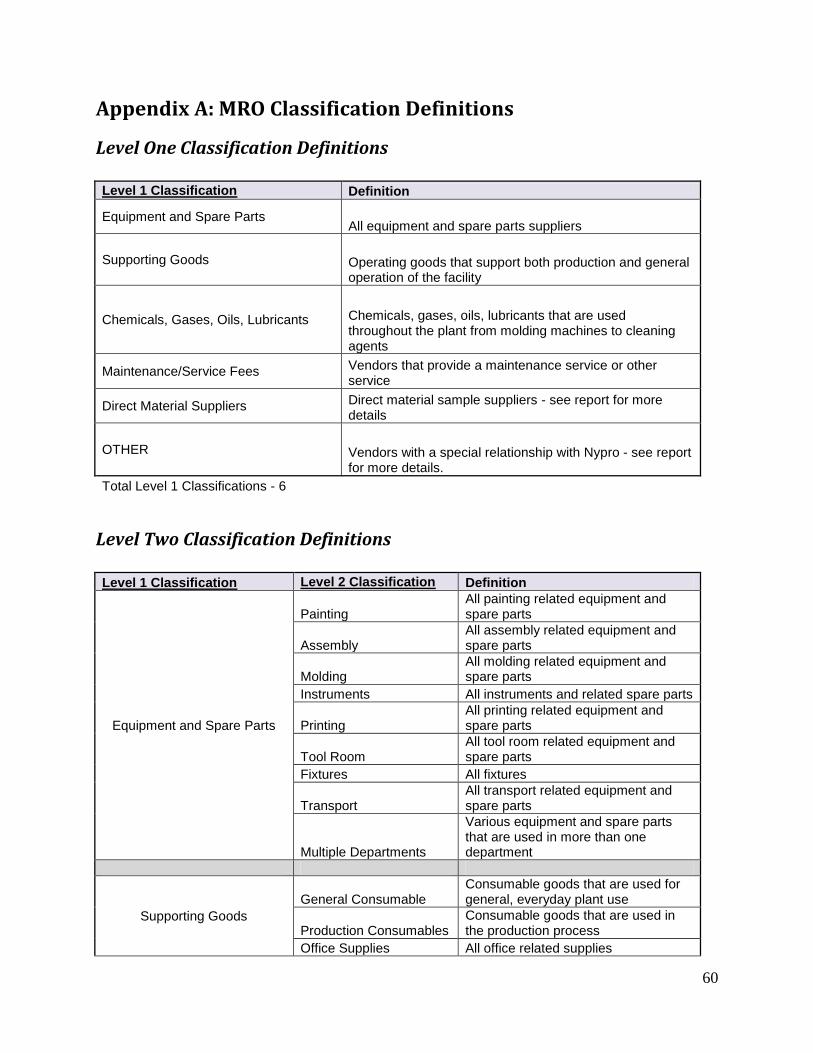
60
Appendix A: MRO Classification Definitions
Level One Classification Definitions
Level 1 Classification Definition
Equipment and Spare Parts All equipment and spare parts suppliers
Supporting Goods Operating goods that support both production and general operation of the facility
Chemicals, Gases, Oils, Lubricants Chemicals, gases, oils, lubricants that are used throughout the plant from molding machines to cleaning agents
Maintenance/Service Fees Vendors that provide a maintenance service or other service
Direct Material Suppliers Direct material sample suppliers - see report for more details
OTHER Vendors with a special relationship with Nypro - see report for more details.
Total Level 1 Classifications - 6
Level Two Classification Definitions
Level 1 Classification Level 2 Classification Definition
Equipment and Spare Parts
Painting All painting related equipment and spare parts
Assembly All assembly related equipment and spare parts
Molding All molding related equipment and spare parts
Instruments All instruments and related spare parts
Printing All printing related equipment and spare parts
Tool Room All tool room related equipment and spare parts
Fixtures All fixtures
Transport All transport related equipment and spare parts
Multiple Departments
Various equipment and spare parts that are used in more than one department
Supporting Goods
General Consumable Consumable goods that are used for general, everyday plant use
Production Consumables Consumable goods that are used in the production process
Office Supplies All office related supplies

61
Welfare Supplies Supplies that are used for employee satisfaction or benefit
Renovations Building renovations or remodeling
Packaging Materials All packaging related items
Storage All storage related items
Building Security Security system and supporting
Chemicals, Gases, Oils, Lubricants
Chemicals Various chemicals used in plant
Lubricants Various lubricants used in plant
Gases Various gases used in plant
Oils Various oils used in plant
Wax Various waxes used in plant
Maintenance/Service Fees
Assembly Assembly related maintenance and service vendors
Painting Painting related maintenance and service vendors
Molding Molding related maintenance and service vendors
Tool Room Tool Room related maintenance and service vendors
Power Generator Power Generator related maintenance and service vendors
All Plant Maintenance and service vendors that are used throughout the plant
Direct Material Suppliers Direct Materials Direct material samples related vendors
OTHER OTHER VENDOR Vendors with a special relationship with Nypro
Total Level 2 Classifications - 30
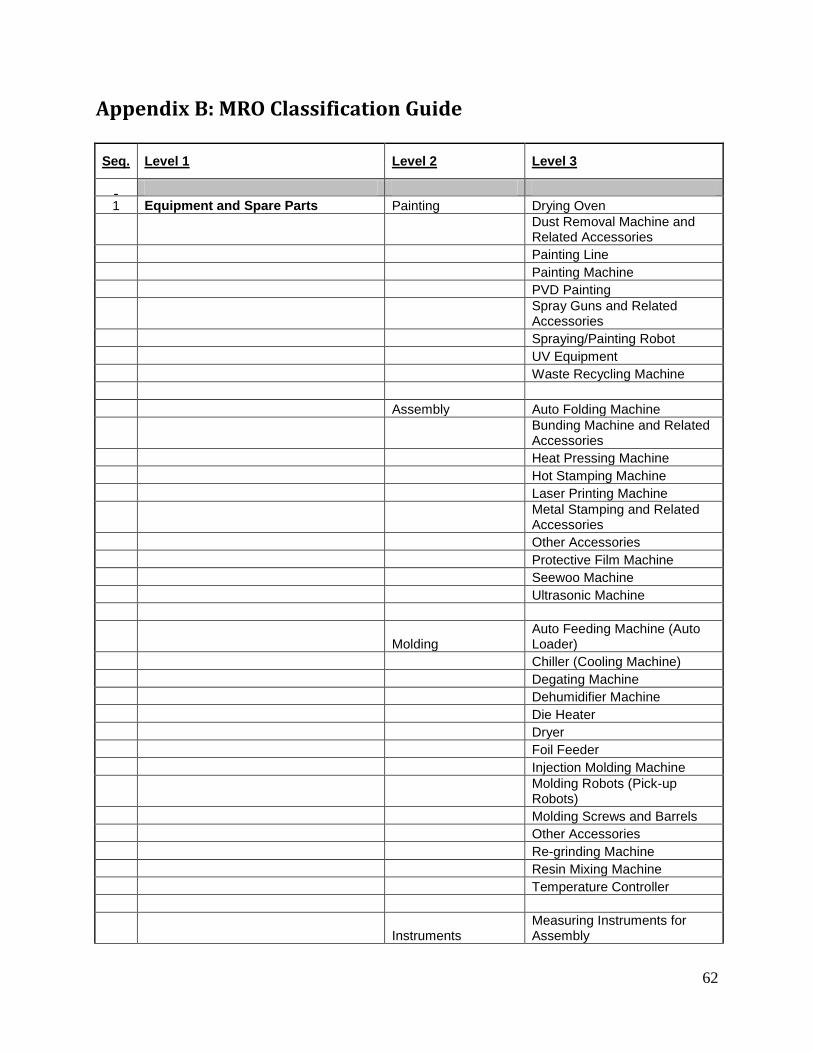
62
Appendix B: MRO Classification Guide
Seq. Level 1 Level 2 Level 3
1 Equipment and Spare Parts Painting Drying Oven
Dust Removal Machine and Related Accessories
Painting Line
Painting Machine
PVD Painting
Spray Guns and Related Accessories
Spraying/Painting Robot
UV Equipment
Waste Recycling Machine
Assembly Auto Folding Machine
Bunding Machine and Related Accessories
Heat Pressing Machine
Hot Stamping Machine
Laser Printing Machine
Metal Stamping and Related Accessories
Other Accessories
Protective Film Machine
Seewoo Machine
Ultrasonic Machine
Molding Auto Feeding Machine (Auto Loader)
Chiller (Cooling Machine)
Degating Machine
Dehumidifier Machine
Die Heater
Dryer
Foil Feeder
Injection Molding Machine
Molding Robots (Pick-up Robots)
Molding Screws and Barrels
Other Accessories
Re-grinding Machine
Resin Mixing Machine
Temperature Controller
Instruments Measuring Instruments for Assembly
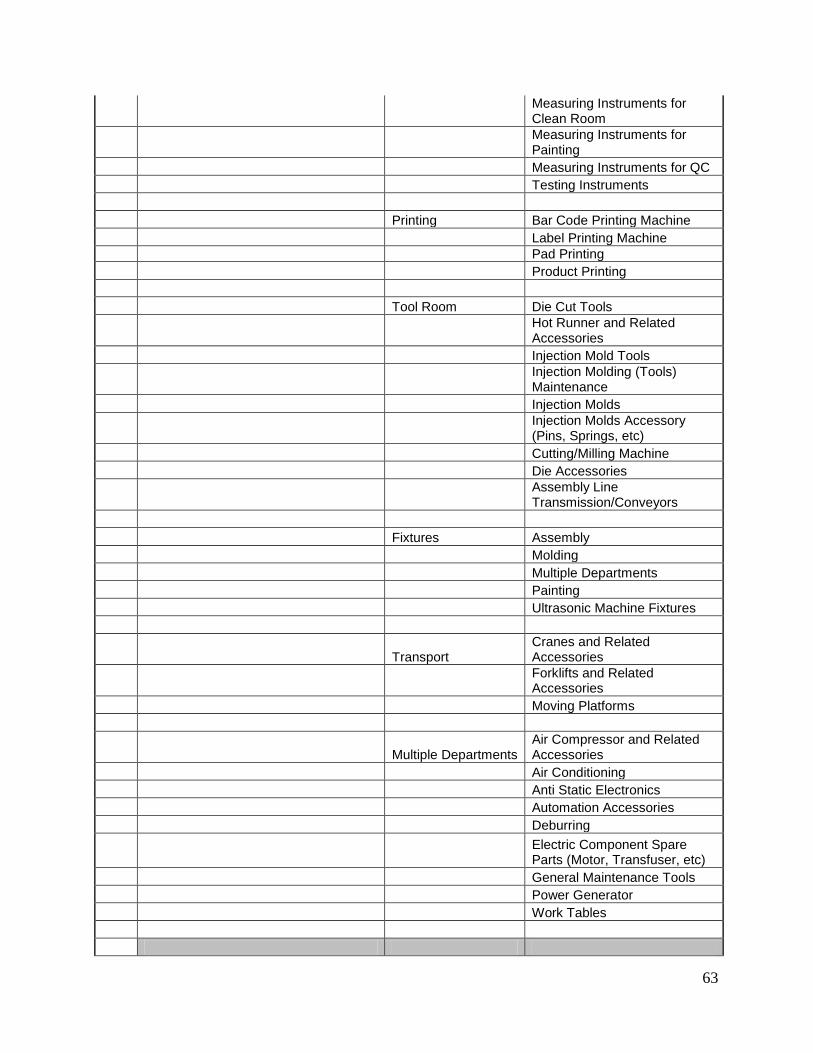
63
Measuring Instruments for Clean Room
Measuring Instruments for Painting
Measuring Instruments for QC
Testing Instruments
Printing Bar Code Printing Machine
Label Printing Machine
Pad Printing
Product Printing
Tool Room Die Cut Tools
Hot Runner and Related Accessories
Injection Mold Tools
Injection Molding (Tools) Maintenance
Injection Molds
Injection Molds Accessory (Pins, Springs, etc)
Cutting/Milling Machine
Die Accessories
Assembly Line Transmission/Conveyors
Fixtures Assembly
Molding
Multiple Departments
Painting
Ultrasonic Machine Fixtures
Transport Cranes and Related Accessories
Forklifts and Related Accessories
Moving Platforms
Multiple Departments Air Compressor and Related Accessories
Air Conditioning
Anti Static Electronics
Automation Accessories
Deburring
Electric Component Spare Parts (Motor, Transfuser, etc)
General Maintenance Tools
Power Generator
Work Tables
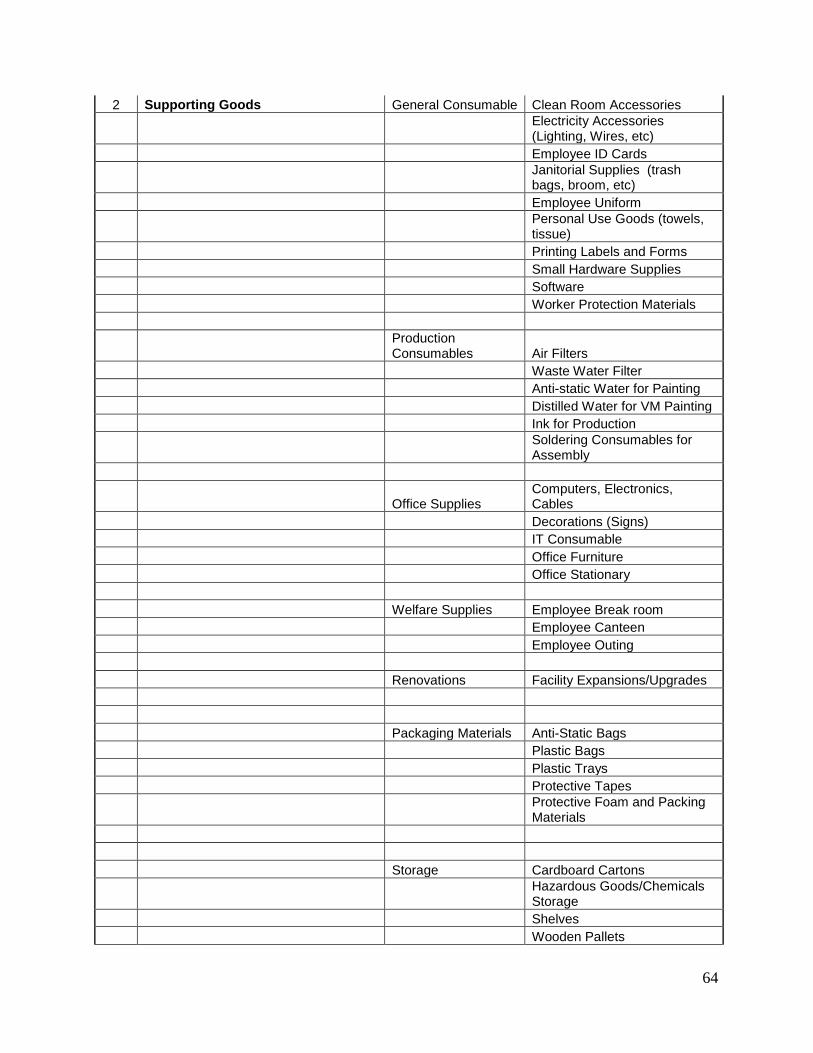
64
2 Supporting Goods General Consumable Clean Room Accessories
Electricity Accessories (Lighting, Wires, etc)
Employee ID Cards
Janitorial Supplies (trash bags, broom, etc)
Employee Uniform
Personal Use Goods (towels, tissue)
Printing Labels and Forms
Small Hardware Supplies
Software
Worker Protection Materials
Production Consumables Air Filters
Waste Water Filter
Anti-static Water for Painting
Distilled Water for VM Painting
Ink for Production
Soldering Consumables for Assembly
Office Supplies Computers, Electronics, Cables
Decorations (Signs)
IT Consumable
Office Furniture
Office Stationary
Welfare Supplies Employee Break room
Employee Canteen
Employee Outing
Renovations Facility Expansions/Upgrades
Packaging Materials Anti-Static Bags
Plastic Bags
Plastic Trays
Protective Tapes
Protective Foam and Packing Materials
Storage Cardboard Cartons
Hazardous Goods/Chemicals Storage
Shelves
Wooden Pallets
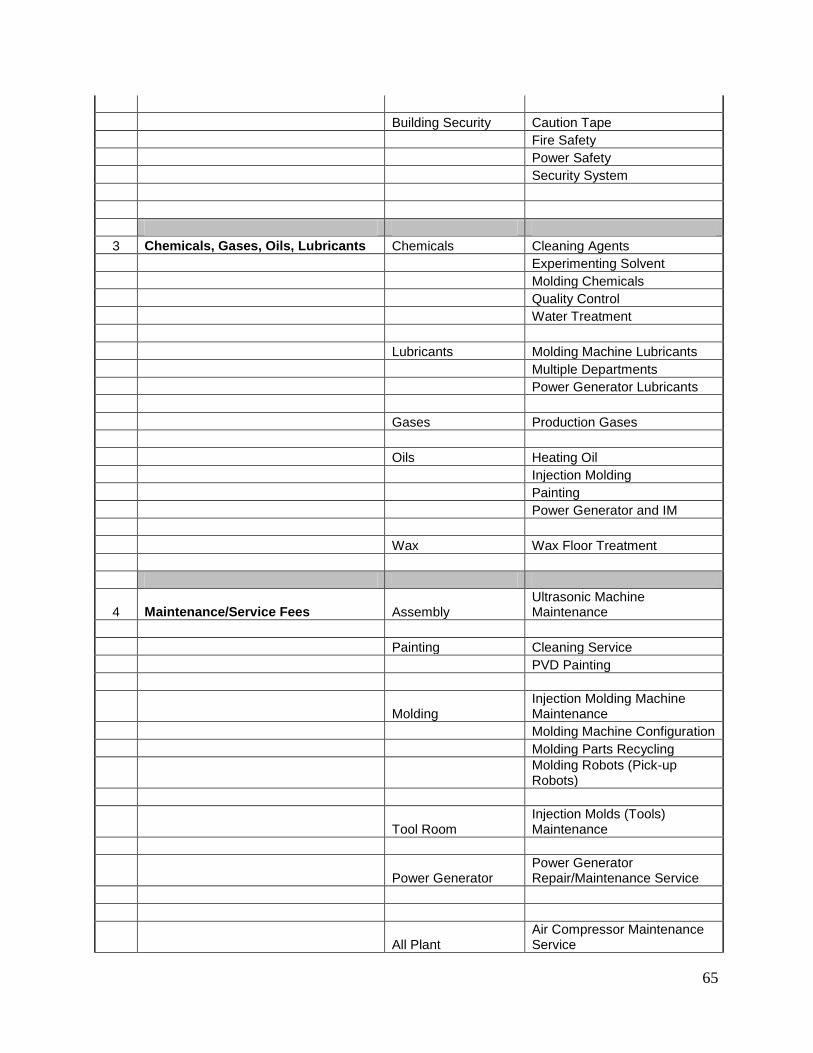
65
Building Security Caution Tape
Fire Safety
Power Safety
Security System
3 Chemicals, Gases, Oils, Lubricants Chemicals Cleaning Agents
Experimenting Solvent
Molding Chemicals
Quality Control
Water Treatment
Lubricants Molding Machine Lubricants
Multiple Departments
Power Generator Lubricants
Gases Production Gases
Oils Heating Oil
Injection Molding
Painting
Power Generator and IM
Wax Wax Floor Treatment
4 Maintenance/Service Fees Assembly Ultrasonic Machine Maintenance
Painting Cleaning Service
PVD Painting
Molding Injection Molding Machine Maintenance
Molding Machine Configuration
Molding Parts Recycling
Molding Robots (Pick-up Robots)
Tool Room Injection Molds (Tools) Maintenance
Power Generator Power Generator Repair/Maintenance Service
All Plant Air Compressor Maintenance Service
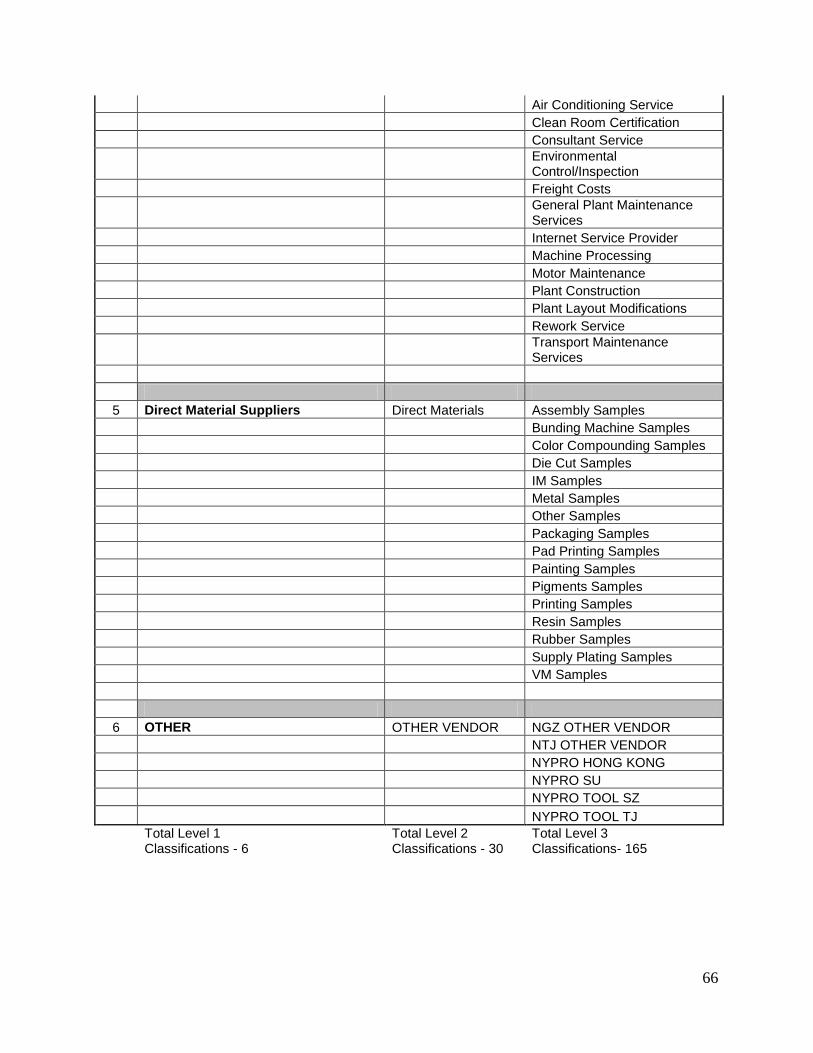
66
Air Conditioning Service
Clean Room Certification
Consultant Service
Environmental Control/Inspection
Freight Costs
General Plant Maintenance Services
Internet Service Provider
Machine Processing
Motor Maintenance
Plant Construction
Plant Layout Modifications
Rework Service
Transport Maintenance Services
5 Direct Material Suppliers Direct Materials Assembly Samples
Bunding Machine Samples
Color Compounding Samples
Die Cut Samples
IM Samples
Metal Samples
Other Samples
Packaging Samples
Pad Printing Samples
Painting Samples
Pigments Samples
Printing Samples
Resin Samples
Rubber Samples
Supply Plating Samples
VM Samples
6 OTHER OTHER VENDOR NGZ OTHER VENDOR
NTJ OTHER VENDOR
NYPRO HONG KONG
NYPRO SU
NYPRO TOOL SZ
NYPRO TOOL TJ
Total Level 1 Classifications - 6
Total Level 2 Classifications - 30
Total Level 3 Classifications- 165
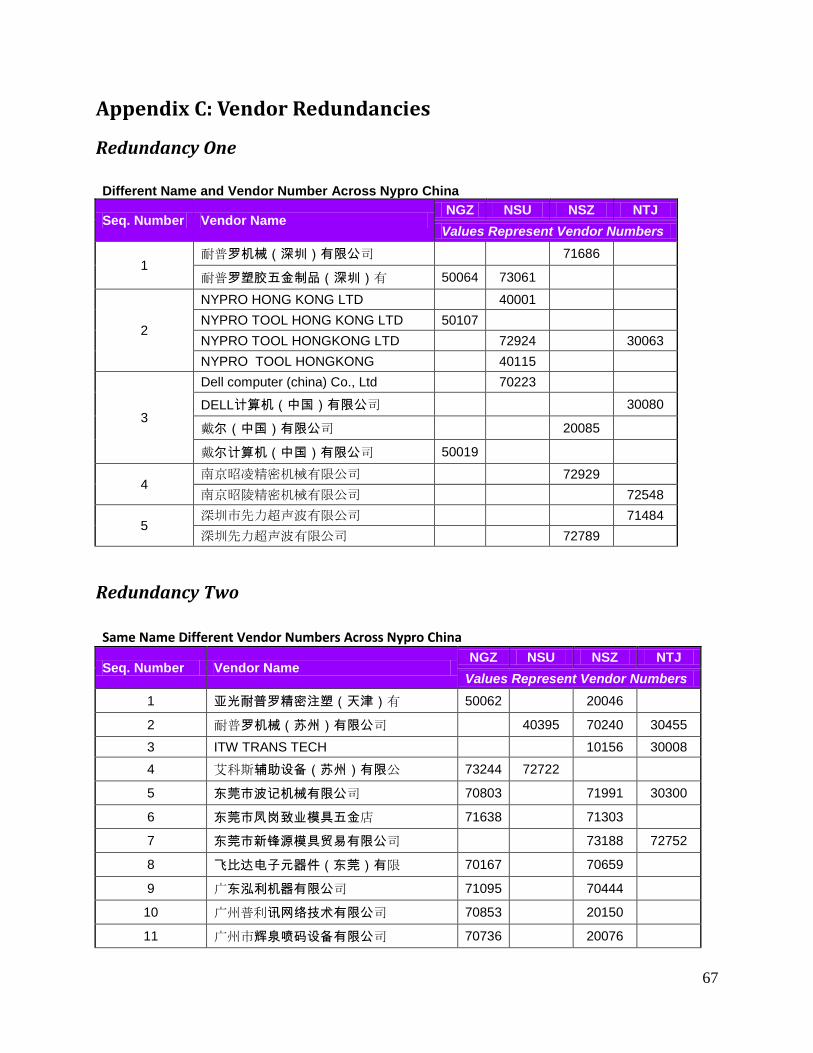
67
Appendix C: Vendor Redundancies
Redundancy One
Different Name and Vendor Number Across Nypro China
Seq. Number Vendor Name NGZ NSU NSZ NTJ
Values Represent Vendor Numbers
1 耐普罗机械(深圳)有限公司 71686
耐普罗塑胶五金制品(深圳)有 50064 73061
2
NYPRO HONG KONG LTD 40001
NYPRO TOOL HONG KONG LTD 50107
NYPRO TOOL HONGKONG LTD 72924 30063
NYPRO TOOL HONGKONG 40115
3
Dell computer (china) Co., Ltd 70223
DELL计算机(中国)有限公司 30080
戴尔(中国)有限公司 20085
戴尔计算机(中国)有限公司 50019
4 南京昭凌精密机械有限公司 72929
南京昭陵精密机械有限公司 72548
5 深圳市先力超声波有限公司 71484
深圳先力超声波有限公司 72789
Redundancy Two
Same Name Different Vendor Numbers Across Nypro China
Seq. Number Vendor Name NGZ NSU NSZ NTJ
Values Represent Vendor Numbers
1 亚光耐普罗精密注塑(天津)有 50062 20046
2 耐普罗机械(苏州)有限公司 40395 70240 30455
3 ITW TRANS TECH 10156 30008
4 艾科斯辅助设备(苏州)有限公 73244 72722
5 东莞市波记机械有限公司 70803 71991 30300
6 东莞市凤岗致业模具五金店 71638 71303
7 东莞市新锋源模具贸易有限公司 73188 72752
8 飞比达电子元器件(东莞)有限 70167 70659
9 广东泓利机器有限公司 71095 70444
10 广州普利讯网络技术有限公司 70853 20150
11 广州市辉泉喷码设备有限公司 70736 20076
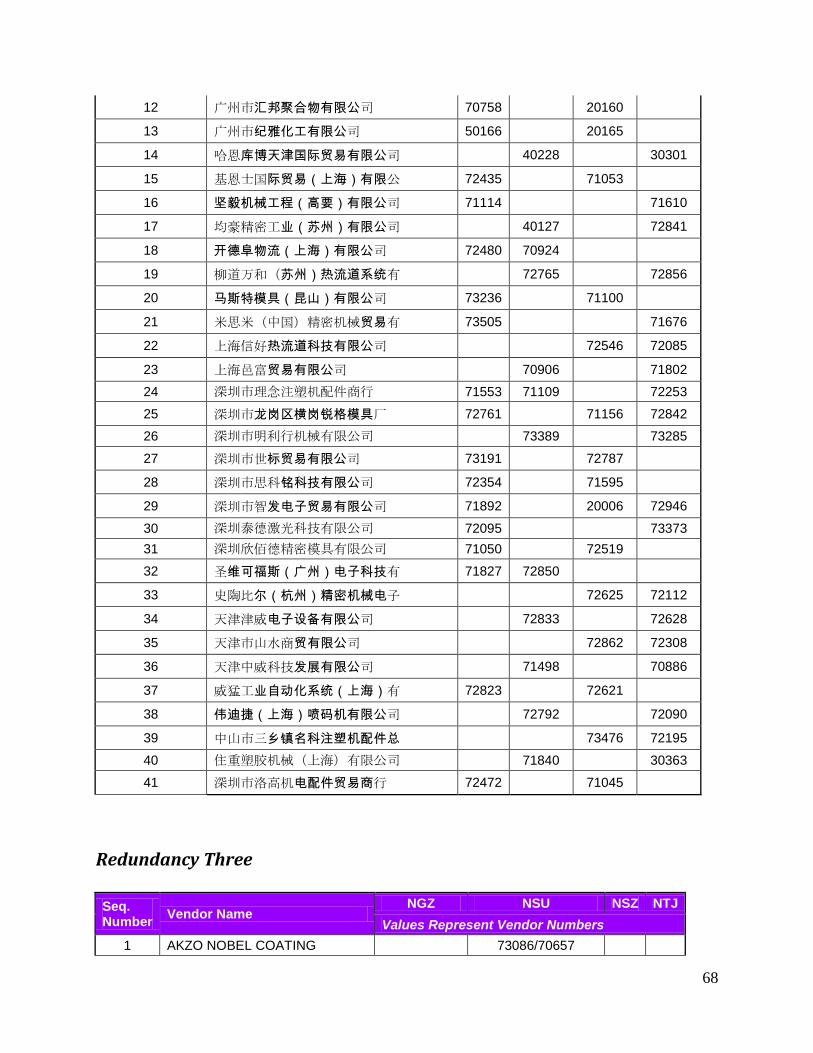
68
12 广州市汇邦聚合物有限公司 70758 20160
13 广州市纪雅化工有限公司 50166 20165
14 哈恩库博天津国际贸易有限公司 40228 30301
15 基恩士国际贸易(上海)有限公 72435 71053
16 坚毅机械工程(高要)有限公司 71114 71610
17 均豪精密工业(苏州)有限公司 40127 72841
18 开德阜物流(上海)有限公司 72480 70924
19 柳道万和(苏州)热流道系统有 72765 72856
20 马斯特模具(昆山)有限公司 73236 71100
21 米思米(中国)精密机械贸易有 73505 71676
22 上海信好热流道科技有限公司 72546 72085
23 上海邑富贸易有限公司 70906 71802
24 深圳市理念注塑机配件商行 71553 71109 72253
25 深圳市龙岗区横岗锐格模具厂 72761 71156 72842
26 深圳市明利行机械有限公司 73389 73285
27 深圳市世标贸易有限公司 73191 72787
28 深圳市思科铭科技有限公司 72354 71595
29 深圳市智发电子贸易有限公司 71892 20006 72946
30 深圳泰德激光科技有限公司 72095 73373
31 深圳欣佰德精密模具有限公司 71050 72519
32 圣维可福斯(广州)电子科技有 71827 72850
33 史陶比尔(杭州)精密机械电子 72625 72112
34 天津津威电子设备有限公司 72833 72628
35 天津市山水商贸有限公司 72862 72308
36 天津中威科技发展有限公司 71498 70886
37 威猛工业自动化系统(上海)有 72823 72621
38 伟迪捷(上海)喷码机有限公司 72792 72090
39 中山市三乡镇名科注塑机配件总 73476 72195
40 住重塑胶机械(上海)有限公司 71840 30363
41 深圳市洛高机电配件贸易商行 72472 71045
Redundancy Three
Seq. Number
Vendor Name NGZ NSU NSZ NTJ
Values Represent Vendor Numbers
1 AKZO NOBEL COATING 73086/70657

69
(JIAXING)
2 阿克苏诺贝尔涂料(东莞)有限 70306/70571
3 东莞市佳鼎贸易有限公司 70286/70281
4 明朗商务 71007/73107
5 三井塑料贸易(上海)有限公司 60112/73050
6 三星特种印刷器材有限公司 72771/70794
7 深圳市宝安区乡镇极而峰静电器 71532/73126
8 苏州风华精密塑料有限公司 72838/73165/72727
9 苏州工业园区华杰物资有限公司 72809/40479
10 苏州工业园区金田印刷涂层器材 73168/72852
11 苏州利坤电子科技有限公司 71567/72723
12 苏州利来特贸易有限公司 72254/72785
13 苏州燃料有限公司 73153/72420
14 苏州市爱宏化工科技有限公司 72496/73156
15 苏州市大朋化学试剂有限公司 73082/70628
16 苏州市高科精密模具有限公司 73197/73198
17 苏州市吴中区木渎久佳诺精密模 72864/72865
18 苏州永家物资有限公司 73112/71068
19 武藏涂料(昆山)有限公司 73139/71935
20 振达喷涂五金设备有限公司 70810/73097
Redundancy Four
Different Name and Different Vendor Number at Same Facility
Seq. Number
Vendor Name NGZ NSU NSZ NTJ
Values Represent Vendor Numbers
1 米拉克龙贸易(上海)有限公 71778
FERROMATIK MILACRON MASCHINENB 72613
2 深圳市龙岗区布吉镇宝升综合商 71251
阿特拉斯科普柯(上海)贸易 71995
3 深圳市宝安区松岗丰裕喷涂设备 71886
东莞市黄江广聚模具配件店 73388
4 陆河县建筑工程公司龙岗分公司 71440
东莞市鑫欣装饰工程有限公司 73227
5 高要市坚毅威龙移印器材有限公 70411/60104
坚毅工程有限公司 40358
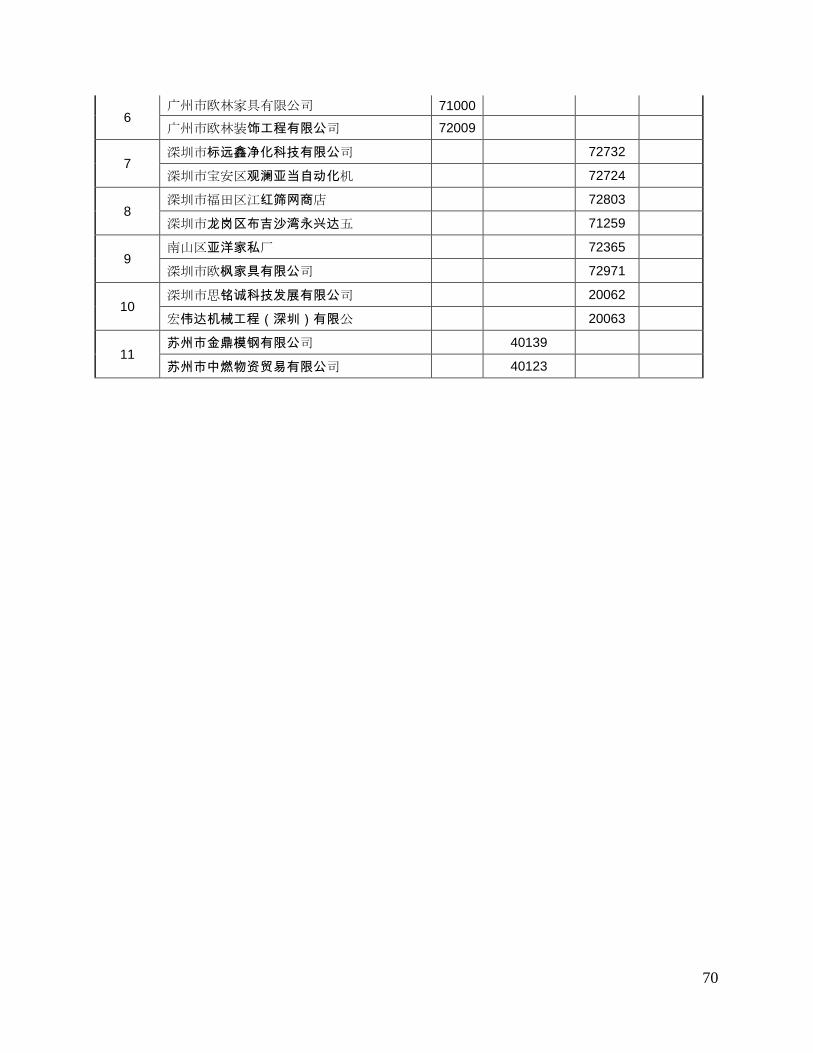
70
6 广州市欧林家具有限公司 71000
广州市欧林装饰工程有限公司 72009
7 深圳市标远鑫净化科技有限公司 72732
深圳市宝安区观澜亚当自动化机 72724
8 深圳市福田区江红筛网商店 72803
深圳市龙岗区布吉沙湾永兴达五 71259
9 南山区亚洋家私厂 72365
深圳市欧枫家具有限公司 72971
10 深圳市思铭诚科技发展有限公司 20062
宏伟达机械工程(深圳)有限公 20063
11 苏州市金鼎模钢有限公司 40139
苏州市中燃物资贸易有限公司 40123
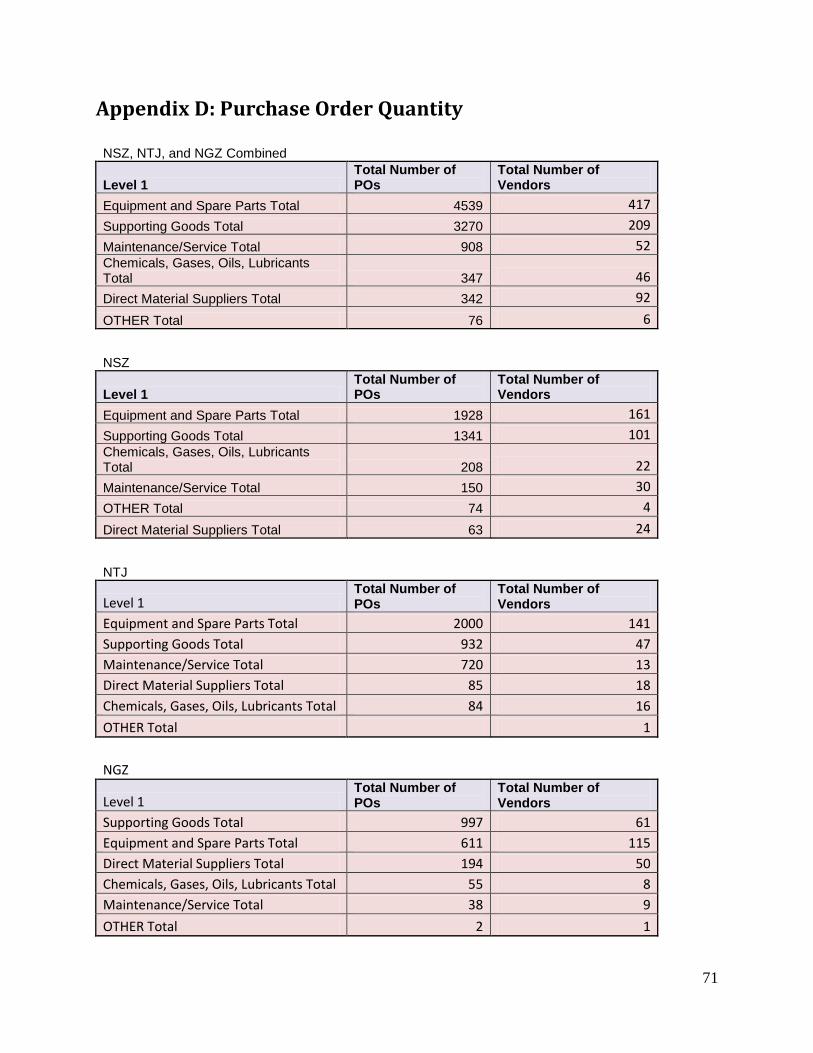
71
Appendix D: Purchase Order Quantity
NSZ, NTJ, and NGZ Combined
Level 1 Total Number of POs
Total Number of Vendors
Equipment and Spare Parts Total 4539 417
Supporting Goods Total 3270 209
Maintenance/Service Total 908 52 Chemicals, Gases, Oils, Lubricants Total 347 46
Direct Material Suppliers Total 342 92
OTHER Total 76 6
NSZ
Level 1
Total Number of POs
Total Number of Vendors
Equipment and Spare Parts Total 1928 161
Supporting Goods Total 1341 101 Chemicals, Gases, Oils, Lubricants Total 208 22
Maintenance/Service Total 150 30
OTHER Total 74 4
Direct Material Suppliers Total 63 24
NTJ
Level 1
Total Number of POs
Total Number of Vendors
Equipment and Spare Parts Total 2000 141
Supporting Goods Total 932 47
Maintenance/Service Total 720 13
Direct Material Suppliers Total 85 18
Chemicals, Gases, Oils, Lubricants Total 84 16
OTHER Total 1
NGZ
Level 1 Total Number of POs
Total Number of Vendors
Supporting Goods Total 997 61
Equipment and Spare Parts Total 611 115
Direct Material Suppliers Total 194 50
Chemicals, Gases, Oils, Lubricants Total 55 8
Maintenance/Service Total 38 9
OTHER Total 2 1
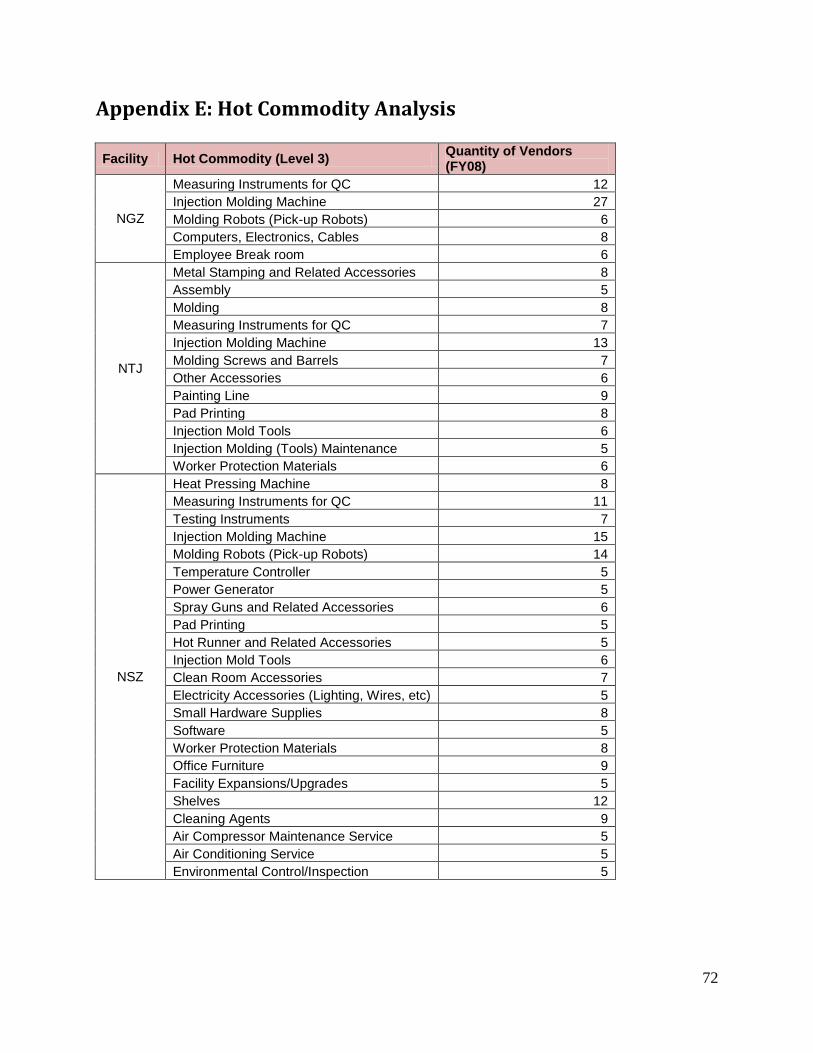
72
Appendix E: Hot Commodity Analysis
Facility Hot Commodity (Level 3) Quantity of Vendors (FY08)
NGZ
Measuring Instruments for QC 12
Injection Molding Machine 27
Molding Robots (Pick-up Robots) 6
Computers, Electronics, Cables 8
Employee Break room 6
NTJ
Metal Stamping and Related Accessories 8
Assembly 5
Molding 8
Measuring Instruments for QC 7
Injection Molding Machine 13
Molding Screws and Barrels 7
Other Accessories 6
Painting Line 9
Pad Printing 8
Injection Mold Tools 6
Injection Molding (Tools) Maintenance 5
Worker Protection Materials 6
NSZ
Heat Pressing Machine 8
Measuring Instruments for QC 11
Testing Instruments 7
Injection Molding Machine 15
Molding Robots (Pick-up Robots) 14
Temperature Controller 5
Power Generator 5
Spray Guns and Related Accessories 6
Pad Printing 5
Hot Runner and Related Accessories 5
Injection Mold Tools 6
Clean Room Accessories 7
Electricity Accessories (Lighting, Wires, etc) 5
Small Hardware Supplies 8
Software 5
Worker Protection Materials 8
Office Furniture 9
Facility Expansions/Upgrades 5
Shelves 12
Cleaning Agents 9
Air Compressor Maintenance Service 5
Air Conditioning Service 5
Environmental Control/Inspection 5
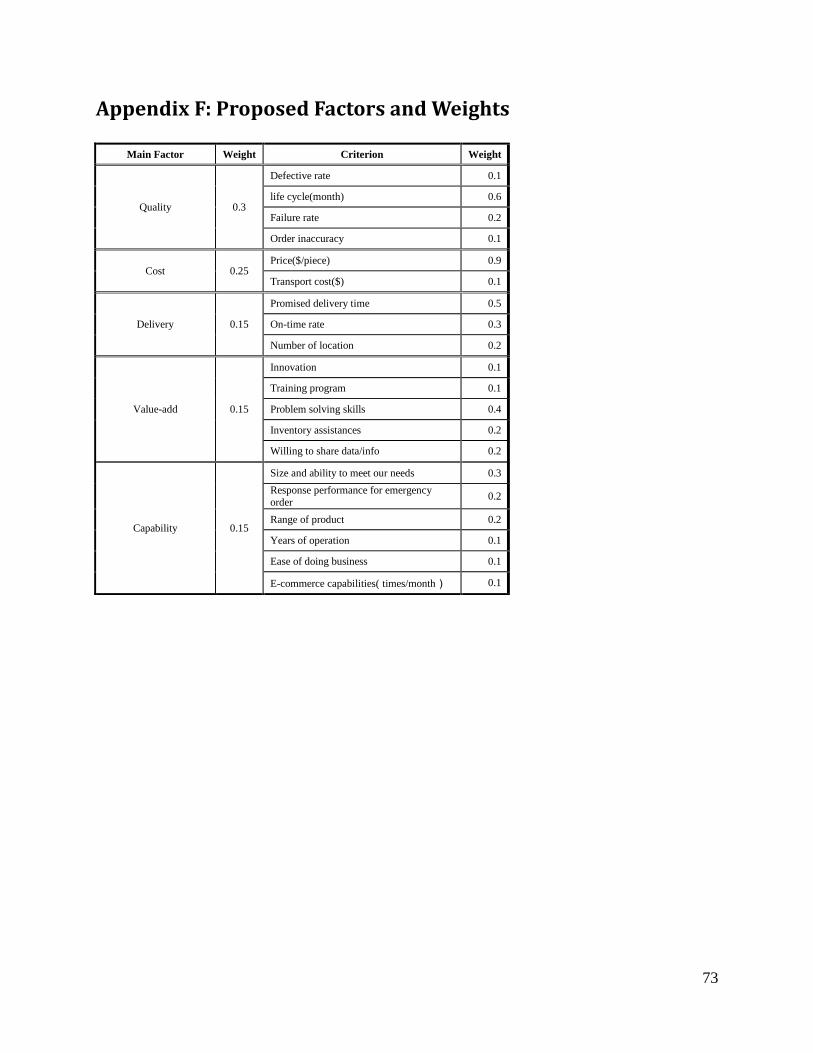
73
Appendix F: Proposed Factors and Weights
Main Factor Weight Criterion Weight
Quality 0.3
Defective rate 0.1
life cycle(month) 0.6
Failure rate 0.2
Order inaccuracy 0.1
Cost 0.25 Price($/piece) 0.9
Transport cost($) 0.1
Delivery 0.15
Promised delivery time 0.5
On-time rate 0.3
Number of location 0.2
Value-add 0.15
Innovation 0.1
Training program 0.1
Problem solving skills 0.4
Inventory assistances 0.2
Willing to share data/info 0.2
Capability 0.15
Size and ability to meet our needs 0.3
Response performance for emergency order
0.2
Range of product 0.2
Years of operation 0.1
Ease of doing business 0.1
E-commerce capabilities( times/month) 0.1
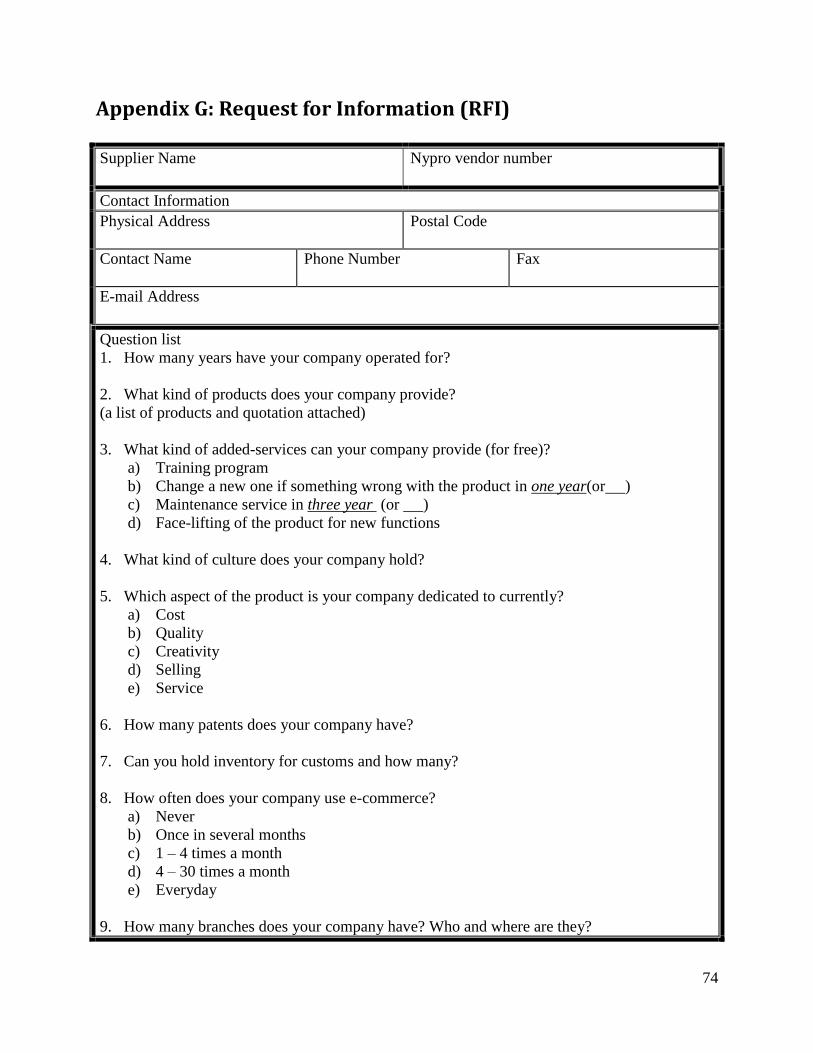
74
Appendix G: Request for Information (RFI)
Supplier Name
Nypro vendor number
Contact Information
Physical Address
Postal Code
Contact Name
Phone Number Fax
E-mail Address
Question list
1. How many years have your company operated for?
2. What kind of products does your company provide?
(a list of products and quotation attached)
3. What kind of added-services can your company provide (for free)?
a) Training program
b) Change a new one if something wrong with the product in one year(or )
c) Maintenance service in three year (or )
d) Face-lifting of the product for new functions
4. What kind of culture does your company hold?
5. Which aspect of the product is your company dedicated to currently?
a) Cost
b) Quality
c) Creativity
d) Selling
e) Service
6. How many patents does your company have?
7. Can you hold inventory for customs and how many?
8. How often does your company use e-commerce?
a) Never
b) Once in several months
c) 1 – 4 times a month
d) 4 – 30 times a month
e) Everyday
9. How many branches does your company have? Who and where are they?
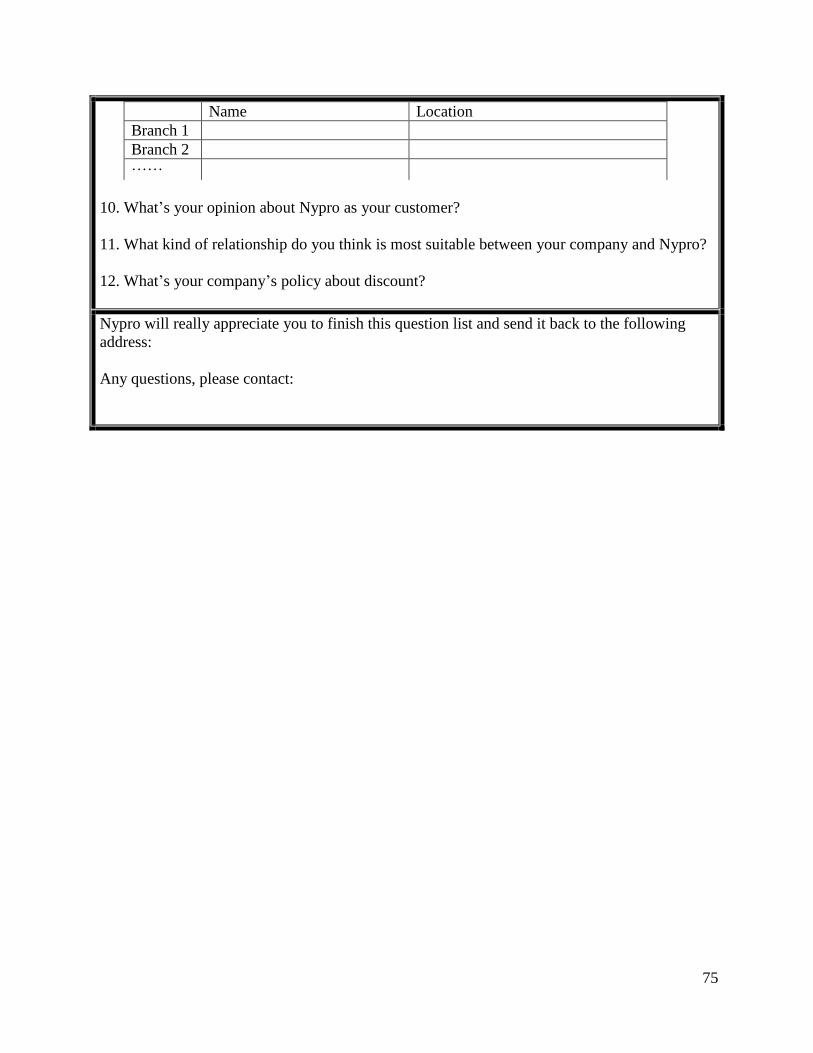
75
Name Location
Branch 1
Branch 2
……
10. What’s your opinion about Nypro as your customer?
11. What kind of relationship do you think is most suitable between your company and Nypro?
12. What’s your company’s policy about discount?
Nypro will really appreciate you to finish this question list and send it back to the following
address:
Any questions, please contact:

76
Reference List Arabe, K. C. (2001, January 18). ThomasNet IndustrialNewsRoom. Retrieved May 2008, 5 ,
from MRO Purchasing Goes Electronic:
http://news.thomasnet.com/IMT/archives/2001/01/mro_purchasing.html
Barry, J. (1996, June 22). Access my Library. Retrieved May 5, 2008, from A development
model for effective MRO procurement (maintenance, repair and operating):
http://www.accessmylibrary.com/coms2/summary_0286-
[email protected]&library=
Carter, J. S. (2002, October). Policy and Procedure for the use of Blanket Purchase Orders.
Retrieved August 17, 2008, from Miami Government:
www.miamigov.com/procurement/docs/policies/blanketpoprocedures.pdf
Filip Roodhooft, J. K. (2005). Vendor selection and evaluation An activity based costing
approach. European Journal of Operational Research , 97-98.
Gordon, S. R. (2006, May). Institute for Supply Management. Retrieved August 14, 2008, from
www.ism.ws/files/Pubs/Proceedings/FFGordon.pdf
Kemp, D. R. (2002, June). MRO Today. Retrieved August 17, 2008, from Traditional Evaluation
Models: www.mrotoday.com/mro/archives/mro%20coach/kemp/kempJJ2002.htm
Kemp, D. R. (2003, January). MRO Today. Retrieved August 19, 2008, from A value-enhancing
initiative : www.mrotoday.com/mro/archives/mro%20coach/kemp/kempD02J03.htm
Kemp, D. R. (2004, May). MRO Today. Retrieved 8 11, 2008, from Improving the MRO Buy:
www.mrotoday.com/mro/archives/mro%20coach/images/kemp_on04.pdf
Kemp, D. R. (2004, July). MRO Today. Retrieved August 19, 2008, from Management by
commoditiy : www.mrotoday.com/mro/archives/mro%coach/Kemp/kempJJ04.htm
Mente, B. L. (1994). Chinese Etiquette & Ethics In Business. Chicago: NTC Business Books.
Mhay, S. (2008). The Negotiation Experts. Retrieved August 18, 2008, from Request for...
Procurement Process Terms: www.negotiations.com/articles/procurement-terms/
SAP. (n.d.). SAP Help. Retrieved August 19, 2008, from direct material (EBP):
www.help.sap.com/saphelp_srm30/helpdata/en/f6/1bc7fe7773d411a4950060b03c3b0e/content.h
tm
Sollish, F. (2005). Purchasing and Supply Manager's Guide to the C.P.M Exam. Alameda:
Sybex Incorporated.
Tan, Y. System Engineering.
77
U.S. General Services Administration. (2008, May 8). GSA. Retrieved August 17, 2008, from
Benefits and Advantages of Using Blanket Purchase Agreements (BPAs):
http://www.gsa.gov/Portal/gsa/ep/contentView.do?programId=10013&channelId=-
13462&ooid=8101&contentId=21336&pageTypeId=8199&contentType=GSA_BASIC&progra
mPage=%2Fep%2Fprogram%2FgsaBasic.jsp&P=FX7
Vantage Partners. (2008). vantagepartners. Retrieved August 17, 2008, from Developing a
Supplier Negotiation and Relationship Management Process and Toolkit:
www.vantagepartners.com/consulting/successstory.cfm?id=8
Wind, Y. a. (1968). The determinants of vendor selection: The evaluation function approach.
Journal of Purchasing and Supply Management , 29-41.