nypd stop & frisk data by race compared to new york city
TRANSCRIPT

Printed: 05/28/2013 Executive Summary Page: 1 of 6
NYPD Stop & Frisk Data By RaceCompared to New York City Population by Race
Per Summary Data Provided by NYCLU 2003 to 2012
Executive Summary
EXECUTIVE SUMMARY:
This study demonstrates that horrendous racial bias exists in the people selected by the NYPD for stop and frisks. During the last ten years (2003 to 2012) the NYPD has done stop & frisks, on Blacks, to the equivalent of nearly 105% of the Black population of New York City! During the same period of time the NYPD has done stop & frisks on the equivalent of less than 11% of the White population. Indeed, the NYPD has done stop & frisks on the equivalent of nearly 58% of the total population of New York City! This practice must stop! We do not need a new police review board bureaucracy: we need to stop the current bureaucracy from continuing this hideous practice! My New York City is not supposed to be an apartheid police state! The following table summarizes the results:
NYPD Stop & Frisk Data - 10 Year Totals (2003 to 2012)
RacePopulation
2012Population
%Stop & Frisks
Stop & Frisk
%
Stop & Frisks as
% of Population
Disparity
Black 2,367,952 28.4% 2,479,250 51.7% 104.7% 82.1%
Latino 2,400,051 28.8% 1,467,144 30.6% 61.1% 6.3%
White 4,487,537 53.8% 471,932 9.8% 10.5% -81.7%
Other 1,256,655 15.1% 374,347 7.8% 29.8% -48.2%
TOTAL (1) 10,512,195 126.1%
TOTAL (2) 8,336,697 100.0% 4,792,673 100.0% 57.5% 0.0%
The NYPD Stop & Frisk data was provided in a summary, by year, on the NYCLU website. The summary includes a Total plus race categories for Black, Latino & White. The “Other” category is the remainder after subtracting the values for Black, Latino and White from the Total. (It probably includes mostly Asians and some other peoples.)
The Population by Race data is derived from US Census Quick Facts data, by county. In this data set the data for “Hispanic/Latino” is extra. People selecting this option on Census forms also list themselves as being exclusively another race: White, Black, Asian or Indigenous.
Printed: 05/28/2013 Copyright, William J. Keck III, 2013 Page: 1of 6

Printed: 05/28/2013 Executive Summary Page: 2 of 6
TOTAL(1) is the total for all four race categories (Black, Latino, White & Other.) The total is about 26% higher than the correct population of New York City due to the addition of the values for Latinos (which are already included in the values for each other race.).TOTAL(2) shows the correct population totals for New York City. Which are slightly higher than the sum of the values in this table for Black + White + Other, due to rounding errors (about 0.1%) introduced while calculating the population values for each race from Census totals by county.“Disparity” is a measurement of the degree that a race is over selected or under selected in the NYPD Stop & Frisk data. Notice that Blacks are about 82% over selected for stop & frisks while Whites are almost -82% under selected. This indicates horrendous bias in the selection (or non-selection) of persons from each race for stop & frisks.This chart clearly visualizes the above data:
I suppose I could do a fancy statistical calculation to determine if this is a “random” result or caused by “bias.” Or you could just look at the graph.
Printed: 05/28/2013 Copyright, William J. Keck III, 2013 Page: 2of 6
0
500,000
1,000,000
1,500,000
2,000,000
2,500,000
3,000,000
3,500,000
4,000,000
4,500,000
5,000,000
Black Latino White Other
10 Year NYPD Stop & Frisk Data Compared to NYC Population by Race
Population Stop & Frisks

Printed: 05/28/2013 Executive Summary Page: 3 of 6
The NYPD's Over-Focus on Blacks has been Counter Productive! The NYCLU data summary by year includes columns for total stop & frisks and another for “totally innocent.” I subtracted “totally innocent” from total stop & frisks and got a “Not Innocent” remainder. Please note that “Not Innocent” does not mean “Guilty.” It merely means the NYPD did not release the person as “Innocent.” The person was arrested or given a summons. Overall, about 88% of people selected for stop & frisks are released as “Innocent” and about 12% fall into the “Not Innocent” category. I then calculated the change in focus on Blacks over time and compared it to the change in Not Innocent results over time.
Note in this graph that the over selection of Blacks for stop & frisks has increased by about 11% since 2003. Meanwhile, the change in the percent of “Not Innocent” results has decreased by about 11% during the same time period.
Printed: 05/28/2013 Copyright, William J. Keck III, 2013 Page: 3of 6
-30.00%
-25.00%
-20.00%
-15.00%
-10.00%
-5.00%
0.00%
5.00%
10.00%
15.00%
2003 2004 2005 2006 2007 2008 2009 2010 2011 2012
Indexed to 2003
NYPD 10 Year Stop & Frisk DataOver Focus on Blacks is Not Productive
Change in Black % Change in Not Innocent %

Printed: 05/28/2013 Executive Summary Page: 4 of 6
My guess is that Black New Yorkers, like the citizens of any city, occupied by hostile forces, have adapted their behavior to avoid arrest during inevitable stop & frisks. People are reporting that they are afraid to go out in their own neighborhood. If a person does go out it is obvious they should not carry even small amounts of marijuana on their persons. It is suggested that gay, Black & Hispanic, transvestites should have five or fewer condoms in their purse, or they will be arrested for “prostitution.”
(I noticed, on the internet, that the City of San Francisco has banned the police's use of condom counts as evidence of “wrong doing.” I think New York City should ban the use of condom counts too!)
Slightly over 50% of all stop & frisks are done on people in the age group from 14 to 24 years old. Over ten years it is inevitable that some of the same persons are being selected again and again for stop & frisks.
Since about 12% of Stop & Frisks have "Not Innocent" results, this implies that about 300,000 Blacks (about 150,000 of them young Blacks) have "Not Innocent" results, thus a police record, often for a minor offense. Thus Blacks who are already discriminated against, will find it harder to get a job, because they have a "police record." Does anybody really think that is socially useful policy?
In Mayor Michael Bloomberg's New York City, it is a suspicious activity (and probably a crime) to be young and Black and living in a Black neighborhood!
Mayor Michael Bloomberg says that New York City Police Officers do not have arrest quotas. (New York State law makes quotas illegal.) Mr. Bloomberg says they have “productivity goals!” Will somebody please explain the difference between a “quota” and a “productivity goal.”
Innocent versus Not Innocent
Over the last ten tears, the NYPD has done stop & frisks equaling about 58% of the population of New York City and has found 50.6% of us to be totally innocent. Overall, about 88% of stop & frisks have an “Innocent” result. Only 12% have a “Not Innocent” result.
“Anyone who trades liberty for security deserves neither liberty nor security.”Benjamin Franklin
Mayor Michael Bloomberg is convinced he is saving lives! (I listen to him of WOR 710 AM on Fridays.) I think he is wrecking lives and turning our city into a racist police state! He needs to be STOPPED! CENSURED! IMPEACHED! OUT OF OFFICE!
Printed: 05/28/2013 Copyright, William J. Keck III, 2013 Page: 4of 6

Printed: 05/28/2013 Executive Summary Page: 5 of 6
Pie Charts of New York City Population by Race versus NYPD Stop & Frisks by Race
I am not completely satisfied with the included pie chart of New York City's population by race. It includes the “Latino” category which overstates the New York City population by about 26%. While the chart is mathematically incorrect, it is adequate for visualizing New York City's population by race, including “Latinos.”
Please see the detailed study for details of these charts. Please focus on the fact that 82% of stop & frisks have been done to Black & Latino persons who are only about 44% of the population. Indeed 90% of stop & frisks have been done on about 46% of our non-White population. (My New York City is not supposed to be an apartheid state!)
Printed: 05/28/2013 Copyright, William J. Keck III, 2013 Page: 5of 6
88%
12%
NYPD Stop & Frisk Data 10 Year TotalsInnocent Not Innocent

Printed: 05/28/2013 Executive Summary Page: 6 of 6
Printed: 05/28/2013 Copyright, William J. Keck III, 2013 Page: 6of 6
22%
22%42%
14%
NYC Population by Race2012
Black
Latino
White
Other
52%
30%
10%
8%
NYPD Stop & Frisks by Race2003 to 2012
Black
Latino
White
Other

Printed: 05/25/2013 NYPD Stop & Frisk Data 2003 to 2012 Page: 1 of 13
NYPD Stop & Frisk Data By RaceCompared to New York City Population by Race
Per Summary Data Provided by NYCLU 2003 to 2012
SUMMARY:
My goal was to compare New York City populations by race to NYPD Stop & Frisk data by race, to determine if there were any disparities in the NYPD's selection of people for stop & frisks. The results are that horrendous racial bias exists in the people selected for stop and frisks. During the last ten years (2003 to 2012) the NYPD has done stop & frisks, on Blacks, to the equivalent of nearly 105% of the Black population of New York City! During the same period of time the NYPD has done stop & frisks on the equivalent of less than 11% of the White population. Indeed, the NYPD has done stop & frisks on the equivalent of nearly 58% of the total population of New York City! This practice must stop! We do not need a new police review board bureaucracy: we need to stop the current bureaucracy from continuing this hideous practice! The following table summarizes the results:
NYPD Stop & Frisk Data - 10 Year Totals (2003 to 2012)
RacePopulation
2012Population
%Stop & Frisks
Stop & Frisk
%
Stop & Frisks as
% of Population
Disparity
Black 2,367,952 28.4% 2,479,250 51.7% 104.7% 82.1%
Latino 2,400,051 28.8% 1,467,144 30.6% 61.1% 6.3%
White 4,487,537 53.8% 471,932 9.8% 10.5% -81.7%
Other 1,256,655 15.1% 374,347 7.8% 29.8% -48.2%
TOTAL (1) 10,512,195 126.1%
TOTAL (2) 8,336,697 100.0% 4,792,673 100.0% 57.5% 0.0%
The NYPD Stop & Frisk data was provided in a summary, by year, on the NYCLU website. The summary includes a Total plus race categories for Black, Latino & White. The “Other” category is the remainder after subtracting the values for Black, Latino and White from the Total. (It probably includes mostly Asians and some other peoples.)
The Population by Race data is derived from US Census Quick Facts data, by county. In this data set the data for “Hispanic/Latino” is extra. People selecting this option on Census forms
Printed: 05/25/2013 Copyright, William J. Keck III, 2013 Page: 1 of 13

Printed: 05/25/2013 NYPD Stop & Frisk Data 2003 to 2012 Page: 2 of 13
also list themselves as being exclusively some other race: White, Black, Asian or Indigenous.
The “Other” category for race is the sum of Census values for Asians + Mixed race people + Indigenous peoples living in New York City. “Indigenous people” includes native American Indians, native Hawaiians, native Alaskans & native Polynesians living in New York City. (There is no way for me to tell if this compares very well to the “Other” category for Stop & Frisks.)
TOTAL(1) is the total for all four race categories (Black, Latino, White & Other.) The total is about 26% higher than the correct population of New York City due to the addition of the values for Latinos (which are already included in the values for each other race.).
TOTAL(2) shows the correct population totals for New York City. Which are slightly higher than the sum of the values in this table for Black + White + Other, due to rounding errors (about 0.1%) introduced while calculating the population values for each race from Census totals by county.
Each column:
“Population %” equals the population for each race category divided by the TOTAL(2) Population total.
“Stop & Frisk %” equals the Stop & Frisk value for each race category divided by the TOTAL(2) Stop & Frisk total.
“Stop & Frisks as % of Population” equals the Stop & Frisks for each race category divided by the Population for each race category. Notice here that the equivalent of nearly 105% of the Black population of New York City has been subjected to stop & frisks over the last ten years. It's no wonder that many Blacks feel they are living in a police state! Indeed, the equivalent of nearly 58% of the total population of New York City has been subjected to stop & frisks. (Can you spell “police state”? P-O-L-I-C-E S-T-A-T-E !!!!)
“Disparity” equals the (“Stop & Frisk %” / “Population %”) -1 for each race category. If this value equals zero (0) (or close to it) then there is no disparity and that race category is being selected in a “fair & balanced” way for stop & frisks.If this value is a positive number, greater than zero, then that race group is being over selected for stop & frisks. If this number is a negative number, less than zero, than that race group is being under selected for stop & frisks.Notice that Blacks are about 82% over selected for stop & frisks while Whites are almost -82% under selected. This indicates horrendous bias in the selection (or non-selection) of
Printed: 05/25/2013 Copyright, William J. Keck III, 2013 Page: 2 of 13

Printed: 05/25/2013 NYPD Stop & Frisk Data 2003 to 2012 Page: 3 of 13
persons from each race for stop & frisks.
I take notice that Mayor Micheal Bloomberg is campaigning, nationally, for stricter gun control laws. Is this because he wants a disarmed population of citizens who can be more easily oppressed by his well armed and militarized police force? Or, is Mr. Bloomberg one of those evil “One Percenters” that Occupy Wall Street warns us about? Or is he in an evil conspiracy with George Soros and other Fabian Socialists to overthrow our sacred way of life? Maybe he is just a misguided, Limousine Liberal & do-gooder? I don't care! What he is doing is UNACCEPTABLE!
This chart clearly visualizes the above data:
I suppose I could do a fancy statistical calculation to determine if this is a “random” result or caused by “bias.” Or you could just look at the graph.
Printed: 05/25/2013 Copyright, William J. Keck III, 2013 Page: 3 of 13
0
500,000
1,000,000
1,500,000
2,000,000
2,500,000
3,000,000
3,500,000
4,000,000
4,500,000
5,000,000
Black Latino White Other
10 Year NYPD Stop & Frisk Data Compared to NYC Population by Race
Population Stop & Frisks

Printed: 05/25/2013 NYPD Stop & Frisk Data 2003 to 2012 Page: 4 of 13
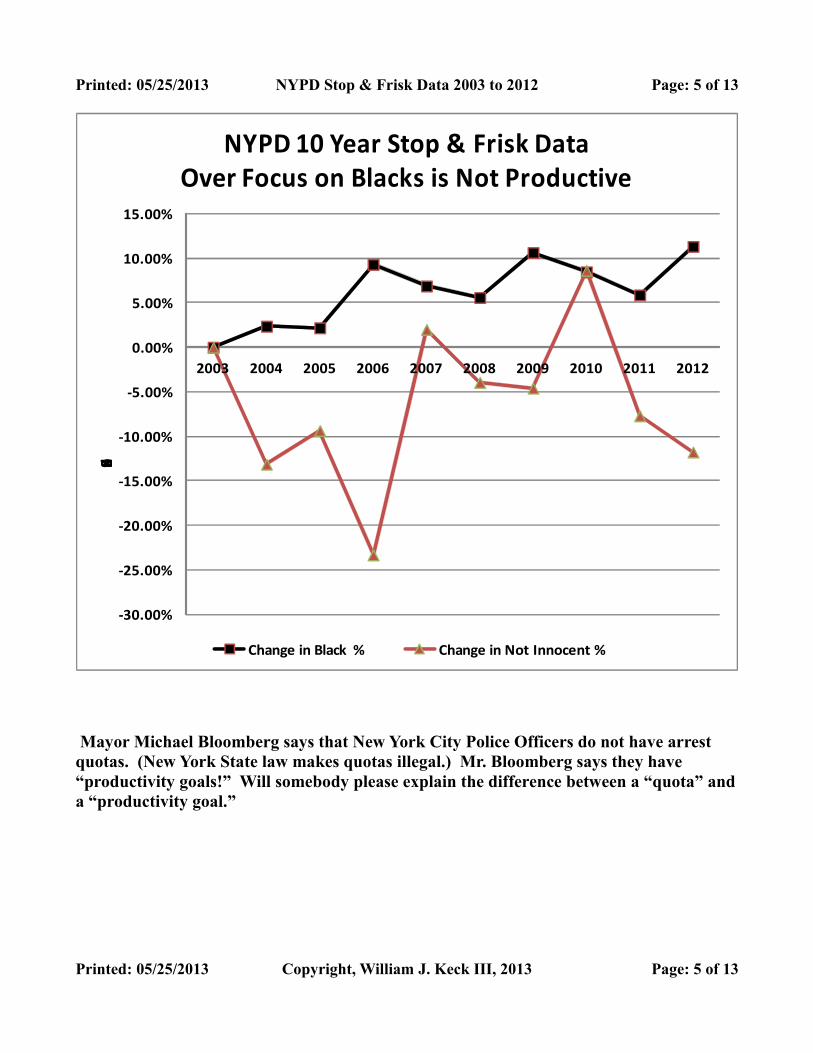
The NYPD's Over-Focus on Blacks has been Counter Productive!The NYPD's over-focus on Blacks has been counter productive. The NYCLU data summary by year includes columns for total stop & frisks and another for “totally innocent.” I subtracted “totally innocent” from total stop & frisks and got a “Not Innocent” remainder. Please note that “Not Innocent” does not mean “Guilty.” It merely means the NYPD did not release the person as “Innocent.” The person was arrested or given a summons. Overall, about 88% of people selected for stop & frisks are released as “Innocent” and about 12% fall into the “Not Innocent” category. I then calculated the change in focus on Blacks over time and compared it to the change in Not Innocent results over time.
Note in this graph that the over selection of Blacks for stop & frisks has increased by about 11% since 2003. Meanwhile, the change in the percent of “Not Innocent” results has decreased by about 11% during the same time period.
Note that in 2006 the NYPD increased its focus on Blacks and got a major decrease in Not Innocent results. In 2007 it decreased it's focus on Blacks and got a major increase in Not Innocent results. In 2009 an increase in the focus on Blacks lead to no additional results, but the next year, 2010, a slight decrease in focus on Blacks lead to a significant increase in Not Innocent results. In 2011 and 2012 we see little relationship between the numbers of Blacks stop & frisked and Not Innocent results. In fact a major increase in focus on Blacks during 2012 lead to a major decrease in Not Innocent results.
My guess is that Black New Yorkers, like the citizens of any city, occupied by hostile forces, have adapted their behavior to avoid arrest during inevitable stop & frisks. People are reporting that they are afraid to go out in their own neighborhood. If a person does go out it is obvious they should not carry even small amounts of marijuana on their persons. It is suggested that gay, Black & Hispanic, transvestites should have five or fewer condoms in their purse, or they will be arrested for “prostitution.”
Slightly over 50% of all stop & frisks are done on people in the age group from 14 to 24 years old. Over ten years it is inevitable that some of the same persons are being selected again and again for stop & frisks.
Since about 12% of Stop & Frisks have "Not Innocent" results, this implies that about 297,510 Blacks have "Not Innocent" results, thus a police record, often for a minor offense. Thus about 300,000 Black people (at least half of them young, Black people) who are already discriminated against, will find it harder to get a job, because they have a "police record." (Does anybody really think that is socially useful?)
In Mayor Michael Bloomberg's New York City, it is a suspicious activity (and probably a crime) to be young and Black and living in a Black neighborhood!
Printed: 05/25/2013 Copyright, William J. Keck III, 2013 Page: 4 of 13
Printed: 05/25/2013 NYPD Stop & Frisk Data 2003 to 2012 Page: 5 of 13
Mayor Michael Bloomberg says that New York City Police Officers do not have arrest quotas. (New York State law makes quotas illegal.) Mr. Bloomberg says they have “productivity goals!” Will somebody please explain the difference between a “quota” and a “productivity goal.”
Printed: 05/25/2013 Copyright, William J. Keck III, 2013 Page: 5 of 13
-30.00%
-25.00%
-20.00%
-15.00%
-10.00%
-5.00%
0.00%
5.00%
10.00%
15.00%
2003 2004 2005 2006 2007 2008 2009 2010 2011 2012
Indexed to 2003
NYPD 10 Year Stop & Frisk DataOver Focus on Blacks is Not Productive
Change in Black % Change in Not Innocent %

Printed: 05/25/2013 NYPD Stop & Frisk Data 2003 to 2012 Page: 6 of 13
Innocent versus Not Innocent
You will be comforted to know, that over the last ten tears, the NYPD has done 4,792,673 stop & frisks equaling about 58% of the population of New York City and has found 4,221,881 (50.6%) of us to be totally innocent. Overall, about 88% of stop & frisks have an “Innocent” result. Only 12% have a “Not Innocent” result.
“Anyone who trades liberty for security deserves neither liberty nor security.”Benjamin Franklin
Printed: 05/25/2013 Copyright, William J. Keck III, 2013 Page: 6 of 13
0
100,000
200,000
300,000
400,000
500,000
600,000
700,000
800,000
2003 2004 2005 2006 2007 2008 2009 2010 2011 2012
NYPD Stop & Frisk Data by YearInnocent versus Not Innocent
Innocent Not Innocent

Printed: 05/25/2013 NYPD Stop & Frisk Data 2003 to 2012 Page: 7 of 13
Pie Charts of New York City Population by Race versus NYPD Stop & Frisks by Race
I am not completely satisfied with the included pie chart of New York City's population by race. It includes the “Latino” category which overstates the New York City population by about 26%. While the chart is mathematically incorrect, it is adequate for visualizing New York City's population by race, including “Latinos.” Please note that I used the colors automatically generated by Excel 2007 for each pie slice. Please don't be offended if your race is represented by a color that you don't approve.
Please focus on the fact that 82% of stop & frisks have been done to Black & Latino persons who are only about 44% of the population. Indeed 90% of stop & frisks have been done on about 46% of our non-White population. (Is New York City an apartheid state?)
Printed: 05/25/2013 Copyright, William J. Keck III, 2013 Page: 7 of 13
88%
12%
NYPD Stop & Frisk Data 10 Year TotalsInnocent Not Innocent

Printed: 05/25/2013 NYPD Stop & Frisk Data 2003 to 2012 Page: 8 of 13
Printed: 05/25/2013 Copyright, William J. Keck III, 2013 Page: 8 of 13
22%
22%42%
14%
NYC Population by Race2012
Black
Latino
White
Other
52%
30%
10%
8%
NYPD Stop & Frisks by Race2003 to 2012
Black
Latino
White
Other

Printed: 05/25/2013 NYPD Stop & Frisk Data 2003 to 2012 Page: 9 of 13
Description of the Original Data and Methods:
I used a summary of the NYPD Stop & Frisk data provided by the NYCLU at their web page:http://www.nyclu.org/content/stop-and-frisk-data
This page summarizes data from the NYPD Stop & Frisk data files. It includes data for the years 2002 through 2012, however, the data for 2002 includes no details by race, and was not useful for this study.
The data set for 2012 is missing data for the category “aged 14-24”. Otherwise the following data set is included for each year.
YearNew Yorkers were stopped by the police # times# totally innocent (%) # black (%) # Latino (%)# white (%) # aged 14-24 (%)
Here is a sample of the data set for 2005:
In 2005, New Yorkers were stopped by the police 398,191 times.352,348 were totally innocent (89 percent).196,570 were black (54 percent).115,088 were Latino (32 percent).40,713 were white (11 percent).189,854 were aged 14-24 (51 percent).
I hand copied the data from the web page into an Excel 2007 worksheet with the following column headers:
Count (1 to 10 for each year)Year = YearTotal = New Yorkers were stopped by the police # times Innocent = # totally innocentBlack = # black Latino = # LatinoWhite = # white Age 14 to 24 = # aged 14-24
Printed: 05/25/2013 Copyright, William J. Keck III, 2013 Page: 9 of 13

Printed: 05/25/2013 NYPD Stop & Frisk Data 2003 to 2012 Page: 10 of 13
B+L+W = SUM(Black + Latino + White)
Other Race = Total – (B+L+W) (Note that this is a remainder, and probably includes mostly Asian New Yorkers but also other people.)
!Innocent = Total – Innocent (This means “Not Innocent.” In certain programming languages the exclamation point “!” is used to mean “Not.”) This can be looked at as the NYPD's “success rate” for the Stop & Frisk Program. (It is important to remember that the “Not Innocent” category does not mean “Guilty.” It merely means the person was not released by the NYPD as “Innocent.”)
!I% = (!Innocent / Total) This calculates the percent “Not Innocent.” The long run average for “Not Innocent” is 11.9%, just under 12%. This implies that the long run average for “Innocent” results is 88%. (100% - 12%) = 88%
% Black = (Black / Total) as a percent. The long run average is that just under 52% of stop & frisks are done on Blacks. However, this has been increasing over the 10 year period.
Delta Blk% = (%Black for current year / %Black for 2003) This indexes the percent of Blacks selected each year to the value for 2003. The result shows us that over the last 10 years, the NYPD has increased its focus on Blacks by 11.3% by 2012. The long run average increase in focus is about 7.1% per year. In math, “Delta” (usually expressed by the Greek letter “delta”) implies “change in value” over time.
Delta !I% = (!I% for current year / !I% for 2003) This indexes the percent of “Not Innocent” results to 2003 and show us that over the last 10 years, the NYPD's “success rate” as expressed by “Not Innocent” results has decreased by about 11.8% (100% - 88.2%) by 2012 even while its focus on Blacks has increased. Clearly the obsessive racial focus on Blacks is counter productive. The long run average decrease in “Not Innocent” is about 6.2% (100% - 93.8%).
There are additional calculations in the rows across the bottom of the worksheet:Row:
TOTAL = sum of the data for the ten years above.
Percents = The number under TOTAL (Total) is 100% showing that the NYPD has done 4,792,673 stop & frisks over the last ten years. Of these:
• 88.1% (4,221,881) stops were “totally Innocent• 51.7% involved Blacks• 30.6% involved Latinos• 9.8% involved Whites
Printed: 05/25/2013 Copyright, William J. Keck III, 2013 Page: 10 of 13

Printed: 05/25/2013 NYPD Stop & Frisk Data 2003 to 2012 Page: 11 of 13
• About 50.4% involved people aged 14 to 24• 7.8% involved people of some other race.
Unfortunately, the US Census Quick Facts data by county does not include easily comparable data by age and race. However, we can infer that:
Since 2,479,250 stop & frisks have been done on Blacks over the last 10 years;AND since about 12% of stop & frisks cause a “Not Innocent” result;THEN about 297,510 Black New Yorkers now have a police record because of a “Not Innocent” stop & frisk; AND 50.4% or 149,945 involved young Black people between the ages of 14 and 24 at the time of the stop.
It is also obvious that some individual Black people MUST have been stopped more than once over the last 10 years. (If you are a Black person and you have not been stop & frisked, at least once, then you are unusual! And some other Black person has been stop & frisked more than once!)
CONCLUSION: About 150,000 young Black people now have a police record for at least a minor offense due to the Stop & Frisk Program. Thus a race group that is often discriminated against for employment (and other purposes) will be starting their life with a “police record” for at least a minor offense, that will cause them difficulties for the rest of their lives. Does anybody really think this is a useful social policy?
The data set provided by the NYCLU does not provide data on the type or severity of “Not Innocent” results. However, I have heard that Mayor Bloomberg has requested New York State to increase it's tolerance for small amounts of marijuana, since a great majority of “Not Innocent” stop & frisks are “busts” for small amounts of marijuana.
I have also heard that transvestites are being arrested and accused of “prostitution” if the have “too many” condoms in their purse. Legal advice suggests that having up to five condoms in your purse is “OK,” but having more than that will get you arrested for “prostitution.” One, young, gay, Hispanic, transvestite complained that the police planted nine condoms in her purse after they arrested her!
What if she's coming home from her favorite pharmacy with a carton of couple dozen condoms with her! Does that constitute her participation in an international prostitution ring?
I also noted, on the internet, that the City of San Francisco has banned the police's use of condom counts as evidence of “wrong doing.” I think New York City should ban the use of condom counts too!
Printed: 05/25/2013 Copyright, William J. Keck III, 2013 Page: 11 of 13

Printed: 05/25/2013 NYPD Stop & Frisk Data 2003 to 2012 Page: 12 of 13
Pop% = The percents under Black, Latino, White and Other Race are the percents for each race as a portion of New York City. Note that these total to 128.7% due to the over-counting caused by including “Latinos.” The percents for Black + White + Other Race = 99.9%, off slightly due to rounding errors.
(Stop% / Pop%) -1 = A measurement of disparity. If this value is zero (or close to it) it implies that the results for that race group are as expected. A positive result, greater than zero, implies over selection for that race group. A negative result, less than zero, implies under selection. Notice that the values for Black = 82.1% a hideous result indicating the obsessive and excessive selection of Blacks for stop & frisks. Notice that the value for White = -81.7% indicating that Whites are being ignored for stop & frisks. These constant, long running, results can only be caused by racial bias. Mayor Bloomberg has stated that the NYPD focuses on neighborhoods with high crime, which just happen to be Black neighborhoods. What he is saying is that being Black and living in a Black neighborhood is a suspicious activity, and maybe a crime!
Average = The average for each column for the last 10 years. (Except for the category, “Age 14 to 24” since data for the year 2012 was missing.) Thus there are an average of 479,267 stop & frisks every year. But notice that the actual amount has been over that for every year since 2008.
Average % Pop = The average stop & frisks for ten years as a percent of the population, thus, in an average year, the equivalent of:
• 5.7% of the total population of New York City is subjected to stop & frisks.• 5.1% are found to be “totally innocent.”• 10.5% of the Black population is subject to stop & frisks,• 6.1% of Latinos,• 1.1% of Whites• 2.5% of Other Races.• 0.7% of us are declared “Not Innocent”
Population by Race = Under the Total column is the correct total for the population of New York City, 8,336,697 people. The values under the columns for Black, Latino, White and Other Races are my calculated numbers for each race. Once again if you sum these, including Latino, your result will be much over the value under Total. If you add the values for Black + White + Other Races your result will be about 0.1% off due to rounding errors.
10 Year % of Pop = The ten year total stop & frisks for each race category divided by the total population for each race group. Thus, over the last ten Years, 2003 to 2012, the NYPD has stop & frisked the equivalent of:
Printed: 05/25/2013 Copyright, William J. Keck III, 2013 Page: 12 of 13

Printed: 05/25/2013 NYPD Stop & Frisk Data 2003 to 2012 Page: 13 of 13
• 57.5% of the total population of New York City.• 50.6% of us have been found to be “totally innocent.”• 104.7% of Blacks• 61.1% of Latinos• 10.5% of Whites• 25.4% of Other Races• 6.8% of us were declared “Not Innocent”
Do we New Yorkers really wish to live in an apartheid police state? Will we really feel safer if all Black & Latino people are afraid to go out on the street?
Mayor Michael Bloomberg is convinced he is saving lives! (I listen to him of WOR 710 AM on Fridays.) I think he is wrecking lives and turning our city into a racist police state! He needs to be STOPPED! CENSURED! IMPEACHED! OUT OF OFFICE!
Printed: 05/25/2013 Copyright, William J. Keck III, 2013 Page: 13 of 13

Printed: 5/25/2013 NYPD Stop and Frisk Data
2003 to 2012Page: 1 of 1
NYPD Stop & Frisk Data 2003 to 2012
Count Year Total Innocent Black Latino White Age 14 to 24 B+L+W Other Race !Innocent !I% % Black Delta Blk% Delta !I%
1 2003 160,851 140,422 77,704 44,581 17,623 83,499 139,908 20,943 20,429 12.7% 48.3% 100.0% 100.0%
2 2004 313,523 278,933 155,033 89,937 28,913 152,196 273,883 39,640 34,590 11.0% 49.4% 102.4% 86.9%
3 2005 398,191 352,348 196,570 115,088 40,713 189,854 352,371 45,820 45,843 11.5% 49.4% 102.2% 90.6%
4 2006 506,491 457,163 267,468 147,862 53,500 247,691 468,830 37,661 49,328 9.7% 52.8% 109.3% 76.7%
5 2007 472,096 410,936 243,766 141,868 52,877 247,691 438,511 33,585 61,160 13.0% 51.6% 106.9% 102.0%
6 2008 540,302 474,387 275,588 168,475 57,475 263,408 501,538 38,764 65,915 12.2% 51.0% 105.6% 96.1%
7 2009 581,168 510,742 310,611 180,055 53,601 289,602 544,267 36,901 70,426 12.1% 53.4% 110.6% 95.4%
8 2010 601,285 518,322 315,083 189,326 54,810 295,902 559,219 42,066 82,963 13.8% 52.4% 108.5% 108.6%
9 2011 685,724 605,328 350,743 223,740 61,805 341,581 636,288 49,436 80,396 11.7% 51.1% 105.9% 92.3%
10 2012 533,042 473,300 286,684 166,212 50,615 N/A 503,511 29,531 59,742 11.2% 53.8% 111.3% 88.2%
TOTAL 4,792,673 4,221,881 2,479,250 1,467,144 471,932 2,111,424 4,418,326 374,347 570,792 11.9% 51.7% 107.1% 93.8%
Percents 100.0% 88.1% 51.7% 30.6% 9.8% 50.4% 7.8%
Pop % 28.4% 28.8% 53.8% 17.7%
(Stop%/Pop%)-1 82.1% 6.3% -81.7% -55.9%
Average 479,267 422,188 247,925 146,714 47,193 234,603 441,833 37,435 57,079
Averge % Pop 5.7% 5.1% 10.5% 6.1% 1.1% 2.5% 0.7%
Population by Race 8,336,697 2,367,952 2,400,051 4,487,537 1,476,580
10 Year % of Pop 57.5% 50.6% 104.7% 61.1% 10.5% 25.4% 6.8%
data source:
http://www.nyclu.org/content/stop-and-frisk-data
Printed: 5/25/2013 Copyright, William J. Keck III, 2013 Page: 1 of 1

Printed: 05/25/2013 New York City Population by County & Race 2012 Page: 1 of 6
New York CityPopulation by County & Race
Per US Census, State & County Quick Facts Data2012
I calculated the populations for each race in New York City using the county by county data from US Census, State & County Quick Facts.
NYC Population by RaceRace Population PercentWhite 4,487,537 53.8%Black 2,367,952 28.4%Asian 1,121,899 13.5%Indigenous 134,756 1.6%Mixed 219,926 2.6%TOTAL (1) 8,332,069 99.9%TOTAL (2) 8,336,697 100.0%Error 4,628 0.1%
Hispanic 2,400,051 28.8%
White% 53.8%Other Than White % 46.2%
TOTAL (1) Calculated by summing the results by race.TOTAL (2) Calculated by summing the population by county.
(Original data provided by Census Quick Facts.)Error The rounding errors caused by calculating
populations for each race.
New York (City) “Given” Data:
If you go to the Census Quick Facts web page, you will find a click option for “Select a City.” You can then select “New York (city).” I am convinced this option gives incorrect data, by race for New York City. At least part of the problem (as of May 4, 2013) is that it is giving old estimates based on 2010 & 2011 data. This is the data it provides:
New York (City)Population: 8,244,910White persons, percent, 2010 (a): 44.0%
Printed: 05/25/2013 Copyright, William J. Keck III, 2013 Page: 1 of 6

Printed: 05/25/2013 New York City Population by County & Race 2012 Page: 2 of 6
Black persons, percent, 2010 (a): 25.5%American Indian and Alaska Native persons, percent, 2010 (a): 0.7%Asian persons, percent, 2010 (a): 12.7%Native Hawaiian and Other Pacific Islander, percent, 2010 (a): 0.1%Persons reporting two or more races, percent, 2010: 4.0%Persons of Hispanic or Latino origin, percent, 2010 (b): 28.6%White persons not Hispanic, percent, 2010: 33.3%
The Census notes state:(a) Includes persons reporting only one race.(b) Hispanics may be of any race, so also are included in applicable race categories.
For the purpose of my study, I will simplify the names of the race categories as follows: WhiteBlackAsianIndigenous (includes Native American Indians, Native Alaskans, Native Hawaiians and Natives of Other Pacific Islands. A small percentage of New York City's population.) Mixed (includes Persons reporting two or more races on Census forms.)Hispanics
I am completely ignoring the “White persons not Hispanic” category.
It's important to remember that the data on Census reports is self-reported. There is no guarantee a NYPD officer would identify a person as the same choice they made on Census forms.
If anybody is offended by my choices and category names, please accept my sincere apology. My goal is to get a simple column name for my worksheets, not to denigrate anybody. If it helps you to feel better, I was interracially married for 28 years (I am White and my wife was Black) and I included my family in the “Mixed” or “Other” category of census reports. My grandson's Mother is Hispanic/Latino, of light complexion. (I have no idea what choices she makes on US Census forms.) I find the Census Quick Facts data provided for New York (city) is inconsistent. The percents for each race (White, Black, Asian, Indigenous & Mixed) add up to only 87.0%, not 100.0%. Adding the 28.6% for Hispanics results in much over 100.0%. Since I find these numbers to be wrong, I did not use them in my study of NYPD Stop & Frisk data.
Printed: 05/25/2013 Copyright, William J. Keck III, 2013 Page: 2 of 6

Printed: 05/25/2013 New York City Population by County & Race 2012 Page: 3 of 6
However, a final note concerning Hispanics & Latinos. Census Quick Facts note (b) says, “Hispanics may be of any race, so also are included in applicable race categories.” This is why adding “Hispanics” to the total, results in more than 100.0% of the population. The identity as “Hispanic or Latino” seems to be more of a cultural, language and place of origin identification, rather than a racial one.
New York City Data Calculated by County:
Therefore, I used the US Census Quick Facts data for each county of New York City to calculate the population figures by County & Race. The county by county data includes population estimates through 2012 and percents by race based on 2011 estimates.
The Census Quick Facts data does not give numbers for each race, by county, but gives percents for each race by county. I find that the following race categories add up to very nearly 100% for each county:
White + Black + Asian + Indigenous + Mixed =~ 100.0%
In Richmond County (Staten Island) it equals exactly 100.0%. In New York County (Manhattan) it equals 100.1%. In the other counties it equals 99.9%. This is an acceptable margin of error due to rounding.
Again, the category for Hispanics, is extra, suggesting a language, cultural or place of origin identification, rather than a racial identity.
Since the Census Quick Facts data includes the race numbers as percents, I had to multiply the total population for each county by the percent for each race category, to derive the population for each race by county. I come up with a total population for New York City (as of 2012) of 8,336,697 people with an error of about 4,628 people, or about 0.1%, which is an acceptable margin of error, based on rounding.
New York City by County Population PercentNew York County 1,619,090 19.4%Bronx County 1,408,473 16.9%Queens County 2,272,771 27.3%Kings County 2,565,635 30.8%Richmond County 470,728 5.6%TOTAL (2) 8,336,697 100.0%
Printed: 05/25/2013 Copyright, William J. Keck III, 2013 Page: 3 of 6

Printed: 05/25/2013 New York City Population by County & Race 2012 Page: 4 of 6
NYC Population by RaceRace Population PercentWhite 4,487,537 53.8%Black 2,367,952 28.4%Asian 1,121,899 13.5%Indigenous 134,756 1.6%Mixed 219,926 2.6%TOTAL (1) 8,332,069 99.9%TOTAL (2) 8,336,697 100.0%Error 4,628 0.1%
Hispanic 2,400,051 28.8%
White % 53.8%Other Than White % 46.2%
TOTAL (1)Calculated by summing the results calculated for each race.
TOTAL (2) Calculated by summing the population by county.(Original data provided by Census Quick Facts.)
Error The rounding errors caused by calculatingpopulations for each race.
Printed: 05/25/2013 Copyright, William J. Keck III, 2013 Page: 4 of 6

Printed: 05/25/2013 New York City Population by County & Race 2012 Page: 5 of 6
Please note that I am using the colors, for each pie slice, automatically generated by Microsoft Excel 2007. Sorry if the pie slice for your race is not your preferred color.
Printed: 05/25/2013 Copyright, William J. Keck III, 2013 Page: 5 of 6
53.9%28.4%
13.5%
1.6%
2.6% NYC Population by Race 2012
White
Black
Asian
Indigenous
Mixed

Printed: 05/25/2013 New York City Population by County & Race 2012 Page: 6 of 6
Printed: 05/25/2013 Copyright, William J. Keck III, 2013 Page: 6 of 6
19.4%
16.9%
27.3%
30.8%
5.6%
NYC Population by County 2012
New York County
Bronx County
Queens County
Kings County
Richmond County

Printed: 5/25/2013 New York City Population by County and Race
2012Page: 1 of 1
New York City - Population by County
Data from US Census, State & County Quick Facts for 2012
Area Population White (a) Black (a) Asian (a) Indigenous (a,c) Mixed (d) Hispanic (b) Total Remainder
New York County 1,619,090 65.4% 18.5% 11.8% 1.4% 3.0% 25.6% 100.1% -0.1%
Bronx County 1,408,473 45.9% 43.3% 4.2% 3.3% 3.2% 53.8% 99.9% 0.1%
Queens County 2,272,771 50.4% 21.0% 24.3% 1.5% 2.7% 27.8% 99.9% 0.1%
Kings County 2,565,635 49.5% 36.1% 11.0% 1.1% 2.2% 20.0% 99.9% 0.1%
Richmond County 470,728 77.9% 11.7% 7.9% 0.7% 1.8% 17.6% 100.0% 0.0%
New York City (Calculated) 8,336,697 53.8% 28.4% 13.5% 1.6% 2.6% 28.8% 99.9% 0.1%
New York City (Given) 8,244,910 44.0% 25.5% 12.7% 0.8% 4.0% 28.6% 87.0% 13.0%
Error 91,787 9.8% 2.9% 0.8% 0.8% -1.4% 0.2% 12.9% -12.9%
Error % 1.1% 18.3% 10.2% 5.6% 50.5% -51.6% 0.7% 13.0% -23318.8%
(a) Includes persons reporting only one race.
(b) Hispanics may be of any race, so also are included in applicable race categories.
(c) Indigenous = Native American Indians, Native Alaskans, Native Hawaiians & Native Pacific Islanders who report being only one race.
(d) Mixed = People reporting more than one race
Total = White + Black + Asian + Indigenous + Mixed (Note that "Hispanics" are included as portions of other race groups.)
Remainder = 100% - Total%
New York City (Calculated) = Calculated from data for each county above
New York City (Given) = As given by Census Quick Facts for New York City
Error = Calculated - Given
Error % = Error / Calculated
New York City Calculated (Census Quick Facts give percents for each race group. This calculates numbers for each race group)
Area Population White (a) Black (a) Asian (a) Indigenous (a,c) Mixed (d) Hispanic (b) Total Remainder
New York County 1,619,090 1,058,885 299,532 191,053 22,667 48,573 414,487 1,620,709 -1,619
Bronx County 1,408,473 646,489 609,869 59,156 46,480 45,071 757,758 1,407,065 1,408
Queens County 2,272,771 1,145,477 477,282 552,283 34,092 61,365 631,830 2,270,498 2,273
Kings County 2,565,635 1,269,989 926,194 282,220 28,222 56,444 513,127 2,563,069 2,566
Richmond County 470,728 366,697 55,075 37,188 3,295 8,473 82,848 470,728 0
New York City (Calculated) 8,336,697 4,487,537 2,367,952 1,121,899 134,756 219,926 2,400,051 8,332,069 4,628
100.0% 53.8% 28.4% 13.5% 1.6% 2.6% 28.8% 99.9% 0.1%
Other Than White = (Calculated total - White) 3,849,160
Other Than White % (1 - White%) 46.2%
Printed: 5/25/2013 Copyright, William J. Keck III, 2013 Page: 1 of 1