nvision 8 account reports - palomar college · nvision 8 . account report . instructions . prepared...
TRANSCRIPT

nVISION 8 ACCOUNT REPORT
INSTRUCTIONS
Prepared for Palomar College
by Leslie Briggs
with
Traci Sickinger Technical Advisor
April 2006 Revised September 2009

i
TABLE OF CONTENTS nVISION 8 ACCOUNT REPORTS INSTRUCTIONS
Preliminary Financial Background ...............................................................................................1
What is nVision? ...........................................................................................................................1
What Are nVision Scopes? ...........................................................................................................1
What Is a Report Request? ............................................................................................................1
PeopleSoft 8 Sign In Procedures...................................................................................................2
Open nVision ................................................................................................................................2
Define Scopes ...............................................................................................................................4
Find/Modify an Existing Scope ..............................................................................................4
Add a Scope (Create a Scope) ................................................................................................6
Define Report Request ..................................................................................................................8
Run an Existing Report ...........................................................................................................8
Create a New Report Request ...............................................................................................11
Define Report Book ....................................................................................................................15
Run a Report Book................................................................................................................15
Report Manager ..........................................................................................................................20
Retrieve, Save, and View a Report .......................................................................................20
Run Drilldown ......................................................................................................................22
Troubleshooting ..........................................................................................................................25
Appendix A .................................................................................................................................28

1
nVISION 8 ACCOUNT REPORTS INSTRUCTIONS
PRELIMINARY FINANCIAL BACKGROUND Every financial transaction must be identified by a combination of chartfields.
For a detailed explanation of chartfields, go to the Palomar College Homepage and navigate as follows: Faculty & Staff Fiscal Services Policies & Procedures Accounting Chart of Accounts. Use the scroll arrow to see the Structure tab at the far left. The other tabs contain the lists of chartfield numbers referred to as Values. Put very simply, chartfields include the following informational elements:
DeptID department responsible for or affected by the transaction Program academic discipline or grouping of services Account type of expense or revenue earned Fund source of governmental funds Class campus site Project/Grant general, designated, or restricted monies Business Unit Palomar Community College or Associated Student Government PeopleSoft chartfield values are independent of one another, and the order in which they are strung together varies with different PeopleSoft uses. The combination of chartfield values is referred to as a chartfield string. [Example: Account-Fund-DeptID-Program-Class-Project/Grant] WHAT IS nVISION? nVision is a tool that retrieves information from the Financials database and puts it into an Excel spreadsheet for your convenience. WHAT ARE nVISION SCOPES? A Scope is a filter to tell nVision to retrieve only the information you want from the database. By setting up Scopes (parameters), nVision is directed to display only the information that relates to specified chartfield Values.
WHAT IS A REPORT REQUEST? A Report Request creates an nVision report using the desired Scope. The nVision report is a spreadsheet containing the financial data based upon the chartfield values specified in the Scope.

2
PEOPLESOFT 8 SIGN IN PROCEDURES 1. Dbl. Click: Finance People Tools icon on computer desktop 2. Enter: User ID and Password 3. Click: Sign In or press ENTER
OPEN nVISION 1. Click: Reporting Tools in the Menu box
Sign In here.
Click Reporting Tools to open nVision.
3
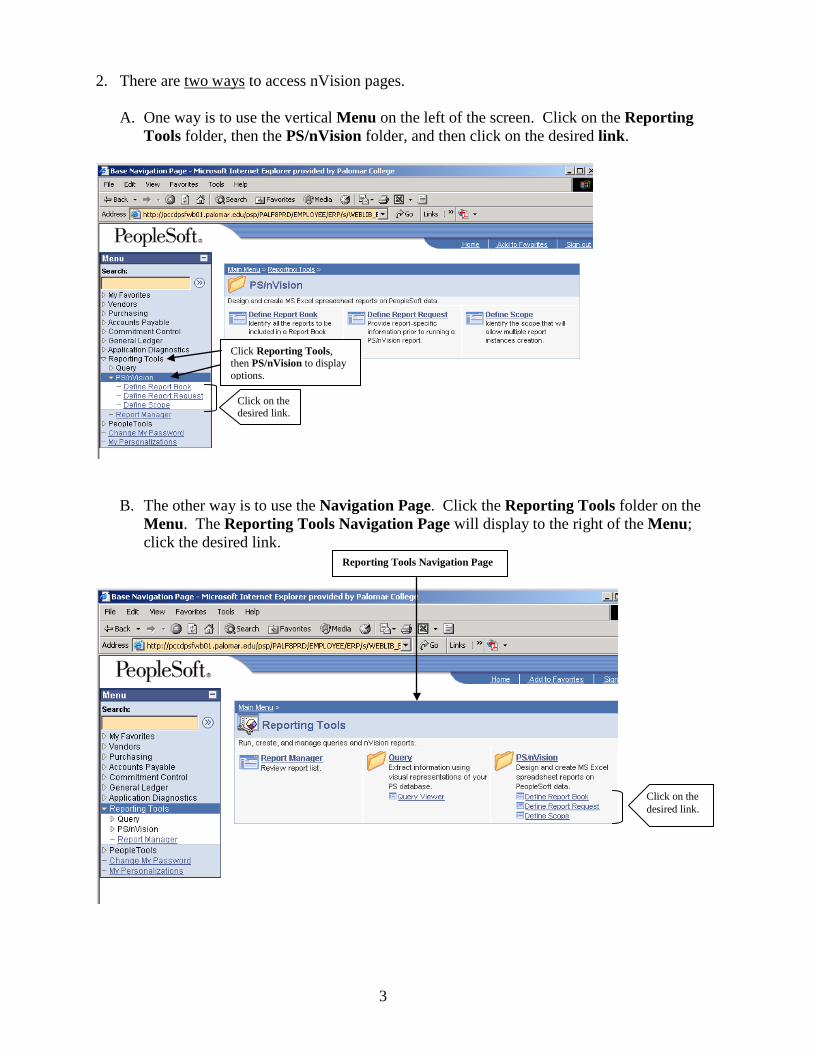
2. There are two ways to access nVision pages. A. One way is to use the vertical Menu on the left of the screen. Click on the Reporting
Tools folder, then the PS/nVision folder, and then click on the desired link.
B. The other way is to use the Navigation Page. Click the Reporting Tools folder on the
Menu. The Reporting Tools Navigation Page will display to the right of the Menu; click the desired link.
Click on the desired link.
Click on the desired link.
Click Reporting Tools, then PS/nVision to display options.
Reporting Tools Navigation Page

4
DEFINE SCOPES The only times the Define Scopes page needs to be accessed are when creating a new scope or making changes to an existing Scope. If there is no need to do either of these processes, skip the Define Scopes section and go directly to the Define Report Request section on page 8. FIND/MODIFY AN EXISTING SCOPE 1. Click: Define Scopes from either menu 2. Verify that the Find an Existing Value is the active page (or click the tab to activate) 3. Type: PALMR for SetID 4. Type: Scope name for Report Scope -or- A. Type a few beginning characters of the Scope name and press Enter B. Click Search button C. Click the desired Scope
5. Click: View All on the Scope Definition page to display all the Scope Fields (chartfields
e.g. DeptID, Program, Class, Fund, etc.) and their values (chartfield numbers, e.g. 10 is the Class chartfield signifying the location as the San Marcos Campus.)
Scope Definition page
Click View All to display all the Scope Field Names and their Values for the selected scope.
Field Name Value (chartfield number)
Type Scope name or beginning characters and click Search for a list of options. Click on the desired scope.
Verify that Find an Existing Value page is active (white tab indicates active page).
Type PALMR in SetID box.

5
6. To change a Value, place the cursor in the Select Value box, delete by using the keyboard Delete key or Backspace key. Type the new Value into the box.
Note: Do not use the minus (-) icon to the right of the Select Value box. It is used to delete a row when there are multiple Values assigned to a Field Name. The plus (+) icon is used to add Value rows for additional Values.
Warning: Do not click the Delete Scope link! It will delete the entire Scope, and it cannot
be reclaimed. The Scope would have to be recreated.
7. Click: Save at the bottom of the page
Delete Row icon
Insert Row icon
DO NOT CLICK ON THIS!

6
ADD A SCOPE (CREATE A SCOPE) Call Traci Sickinger at Ext. 3112 if there is need for a new Scope to be created, OR follow the directions below. 1. Click: Define Scope from either menu 2. Click: the Add a New Value tab 3. Type: PALMR in the SetID box 4. Type: name of the Scope being created in the Report Scope box (10 characters
maximum) 5. Click: Add button
6. Type: a description of what information this Scope accesses (e.g. Foundation Funds) (Leave the Business Unit blank) (Leave the Field Combination Table blank) The Scope Fields section of this page is where the chartfields and values are entered. These
are the filters set to retrieve the desired financial account information.
There are five Field Names and accompanying values to be set, and the majority of Scopes need all five. For departments that receive all the revenue for a specific project/grant number, only the Fund and Project/Grant fields are needed.
Following is a table of Scope Field Names and their corresponding Value Tables that need to be set:
Field Name Value Table Values (some examples) CLASS_FLD CLASS_CF_TBL 10, 14
DEPTID DEPT_TBL 342100, 349200
FUND_CODE FUND_TBL 11, 12
PROGRAM_CODE PROGRAM_TBL 60100, 60910
PROJECT_ID PAL_PROJECT_VW 0000000, 1612019
Add a New Value tab (white tab indicates active page)
Type PALMR at SetID
Type Scope name – up to 10 characters
Click Add button to continue the process.
7
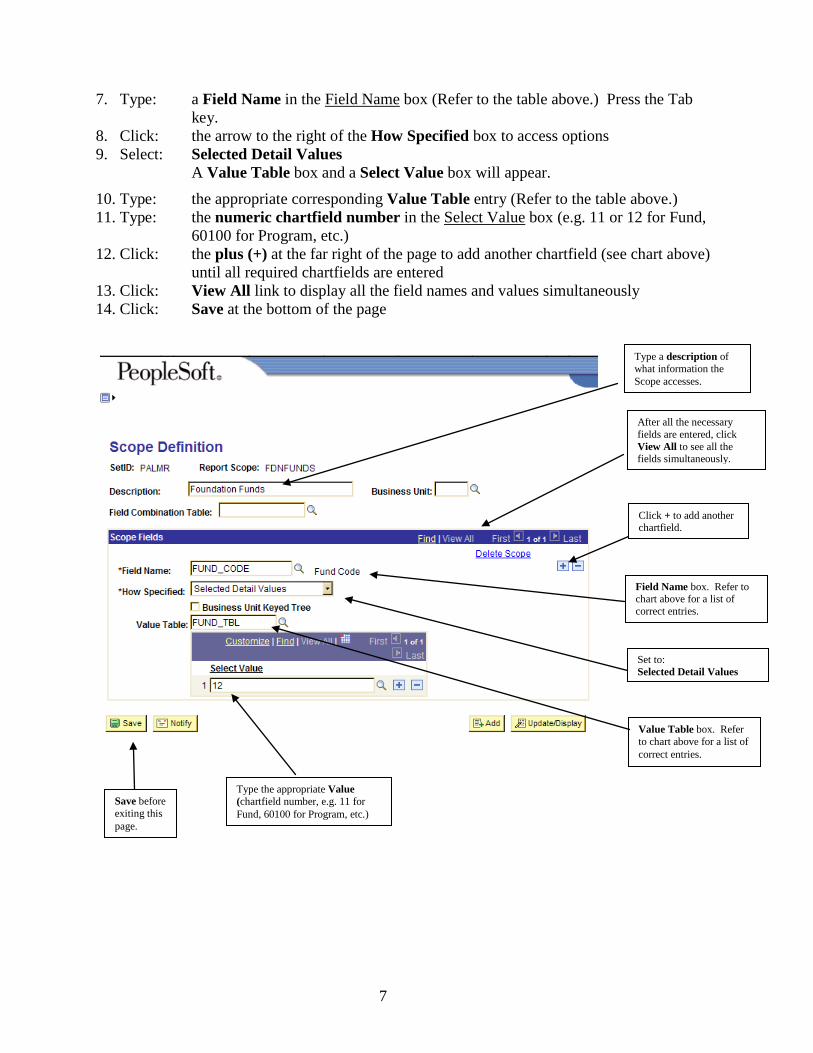
7. Type: a Field Name in the Field Name box (Refer to the table above.) Press the Tab
key. 8. Click: the arrow to the right of the How Specified box to access options 9. Select: Selected Detail Values A Value Table box and a Select Value box will appear.
10. Type: the appropriate corresponding Value Table entry (Refer to the table above.) 11. Type: the numeric chartfield number in the Select Value box (e.g. 11 or 12 for Fund,
60100 for Program, etc.) 12. Click: the plus (+) at the far right of the page to add another chartfield (see chart above)
until all required chartfields are entered 13. Click: View All link to display all the field names and values simultaneously 14. Click: Save at the bottom of the page
Type a description of what information the Scope accesses.
After all the necessary fields are entered, click View All to see all the fields simultaneously.
Set to: Selected Detail Values
Field Name box. Refer to chart above for a list of correct entries.
Value Table box. Refer to chart above for a list of correct entries.
Type the appropriate Value (chartfield number, e.g. 11 for Fund, 60100 for Program, etc.)
Save before exiting this page.
Click + to add another chartfield.

8
DEFINE REPORT REQUEST Note: For those who need to run more than one Report Request and the Report Requests
already exist, set up a Report Book which allows multiple Report Requests to be run simultaneously. See the DEFINE REPORT BOOK section on page 15.
RUN AN EXISTING REPORT 1. Click: Reporting Tools option on the Menu. 2. Click: PS/nVision then Define Report Request on the Menu - or - Define Report Request under the PS/nVision column on the Navigation Page
The Report Request page will appear. 3. Verify that Find an Existing Value is the active page (or click the tab to activate) 4. Type: PALMR for Business Unit 5. Type: the name of the report for Report ID and press Enter -or- A. Type a few beginning characters of the Report name B. Click Search button C. Click the desired Report ID
Verify that Find an Existing Value page is active (white tab indicates active page).
Type PALMR in Business Unit box.
Type Report ID (name) or beginning characters and click Search for a display of options. Click on the desired report name.

9
The nVision Report Request page will appear.
6. Verify: the reporting date option in the As of Reporting Date box
A. The Specify option provides a box to enter the desired reporting date. B. The Today’s Date option automatically sets the reporting date to the day the
report is requested. 7. Click: Scope and Delivery Templates link
The nVision Web Output page will appear. 8. Verify that the Scope name in the Report Scope box is correct. 9. Click: OK at the bottom of the page
Selecting Specify provides a box to enter the desired reporting date.
Selecting Today’s Date retrieves the most recent information.
Scope and Delivery Templates link
Verify that the Scope name in the Report Scope box is correct. Click OK.

10
The nVision Report Request page will reappear. 10. Verify: the Output Options (or click the drop-down menu arrows and set if necessary) A. Type: Web
B. Format: Microsoft Excel Files (*.xls) (See appendix A for one-time set-up instructions)
11. Click: the Run Report button
The Process Scheduler Request page will appear. 12. Click: OK button
The nVision Report Request page will again appear. To retrieve the requested report, see RETRIEVE, SAVE, AND VIEW A REPORT starting on page 20.
Click OK.
Click Run Report.
Set Output Options: Type: Web Format: Microsoft Excel Files (*.xls)

11
CREATE A NEW REPORT REQUEST 1. Click: Define Report Request from either the Menu or a Navigation Page 2. Click: Add a New Value tab
The Add a New Value page will be displayed. 3. Type: PALMR for SetID 4. Type: Report ID (name of the Report being created – up to 8 characters) 5. Click: Add button
Click Add a New Value tab.
Type PALMR for Business Unit. Type name of report being created in Report ID box.
Click Add button.

12
The Report Request page will appear. 5. Type: a title for the report in the Report Title box (This is what will be printed at the
top of the finished spreadsheet.)
6. Type: ACCOUNT_REPORT in the Layout box (Most reports will use this layout, but there are others available. Examples
include: 3-YR COMPARISON and the layouts for budget development.)
7. Select: a reporting date option by clicking the drop-down menu arrow to the right of the As of Reporting Date box
A. The Today’s Date option automatically sets the reporting date to the day the report is requested.
B. The Specify option provides a box to enter the desired reporting date.
8. Select: Microsoft Excel Files as the Format type.
9. Click: Advanced Options tab
The Advanced Options page will appear.
Type a title to be printed on the spreadsheet.
Type the appropriate Layout.
Accept Today’s Date or change to Specify from the drop-down menu.
After other information is entered, click the Advanced Options tab.
Click Enter Delivery Template Options – View All.
Change the Format to Microsoft Excel files

13
10. Click: Enter Delivery Template Options – View All link at the bottom of the screen
The PS/nVision Report Templates page will appear.
11. Type: the name of the Scope to be used for this report in the Report Scope box 12. Type: the filename in the File Template box (A filename is a name by which the spreadsheet – nVision report – will be saved.)
Note: The filename may be entered as regular words, e.g. Physics Administration, English Academic Funds, etc.
-or- The filename may be entered in codes that will tell Excel to use specified
variables (placeholders containing stored information) to create the filename.
For example, the variables can be strung together so the printed name will include the Report ID and the date the report is run. Another variable will tell Excel to include a specific chartfield value, such as the Program code or Project/Grant code, in the filename.
Variables are strung together with % and spaces. The percent sign (%) is similar to setting off text between parentheses; it tells Excel that the text between percent signs calls for variable information. Following are the most common variables:
PeopleSoft Codes for Variables Definition RID Report ID RTT Report TiTle (Title) SFV. Fieldname Scope Field Value ASD AS of Date
The date in the filename will be the date chosen in the Date Selection box.
An example of a common string of variables will tell Excel to name the
spreadsheet using the Report ID, the Program Code, and the date the report is run. The code string would be typed in this manner with spaces between percent signs: %RID% %SFV.PROGRAM_CODE% %ASD%
13. Click OK
Type Scope Name here.
Type the filename of the nVision report spreadsheet. Use words or code variables.
Click OK.
14
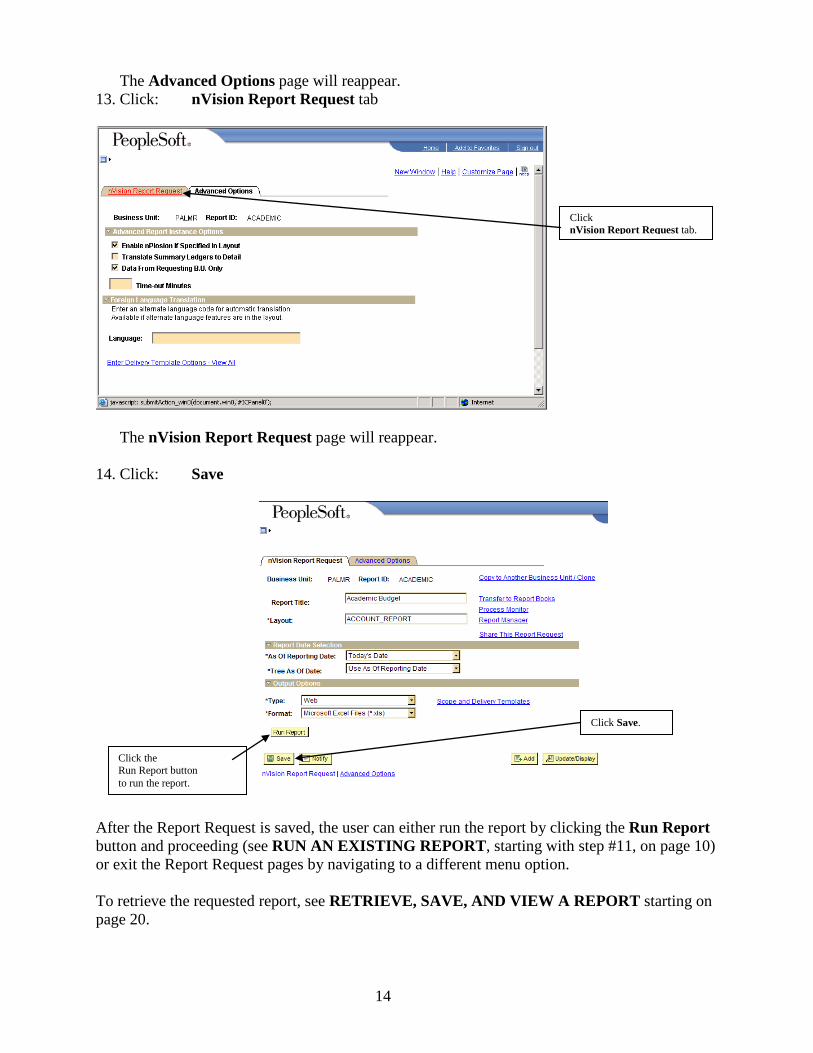
The Advanced Options page will reappear. 13. Click: nVision Report Request tab
The nVision Report Request page will reappear. 14. Click: Save
After the Report Request is saved, the user can either run the report by clicking the Run Report button and proceeding (see RUN AN EXISTING REPORT, starting with step #11, on page 10) or exit the Report Request pages by navigating to a different menu option. To retrieve the requested report, see RETRIEVE, SAVE, AND VIEW A REPORT starting on page 20.
Click nVision Report Request tab.
Click Save.
Click the Run Report button to run the report.

15
DEFINE REPORT BOOK Report Books can be set up to run multiple Report Requests simultaneously. CREATE A REPORT BOOK 1. Click: Define Report Book from either menu.
A Report Book Definition page will appear. 2. Click: Add a New Value tab
The Add a New Value page of Report Book Definition will appear. 3. Type: a name by which to identify this Report Book in the Run Control ID box
For example, a department that has multiple disciplines may want to run all the budgets for all the disciplines simultaneously. The name in the Run Control ID can reflect that, e.g. PHDEPT BUDGET for all the Physics Department budgets.
4. Click Add button
Click Add a New Value tab.
Type a name to identify the Report Book in the Run Control ID box.

16
The Report Book page will appear where all the report names (Report ID’s) to be included in the Report Book will be entered.
In the Report Requests section of the page do the following: 5. Type: PALMR in the Business Unit box 6. Type: name of the first report in the Report ID box, e.g. PHYSADM, ENGLACAD 7. Click: + (plus sign) at the right to add a new information row
Continue this process until all the Report ID’s to be run simultaneously are entered. 8. Click: Save button
Note: The default on this page is set to run all of the reports in the list (see the checkmarks
in the Run column). Deselect any reports not wanted in the run by “un-checking” (clicking) the corresponding checkbox in the Run column.
After the Report Book is saved, the user can either run the reports by clicking the Run button and proceeding (see next section, RUN A REPORT BOOK, starting with step #4, on page 18) or exit these pages by navigating to a different menu option.
Type PALMR in the Business Unit box.
Type report names in Report ID boxes.
Click + to add new information rows.
Click Save button.
Deselect any report not wanted in the run by “un-checking” (clicking) the corresponding checkbox in the Run column.
17
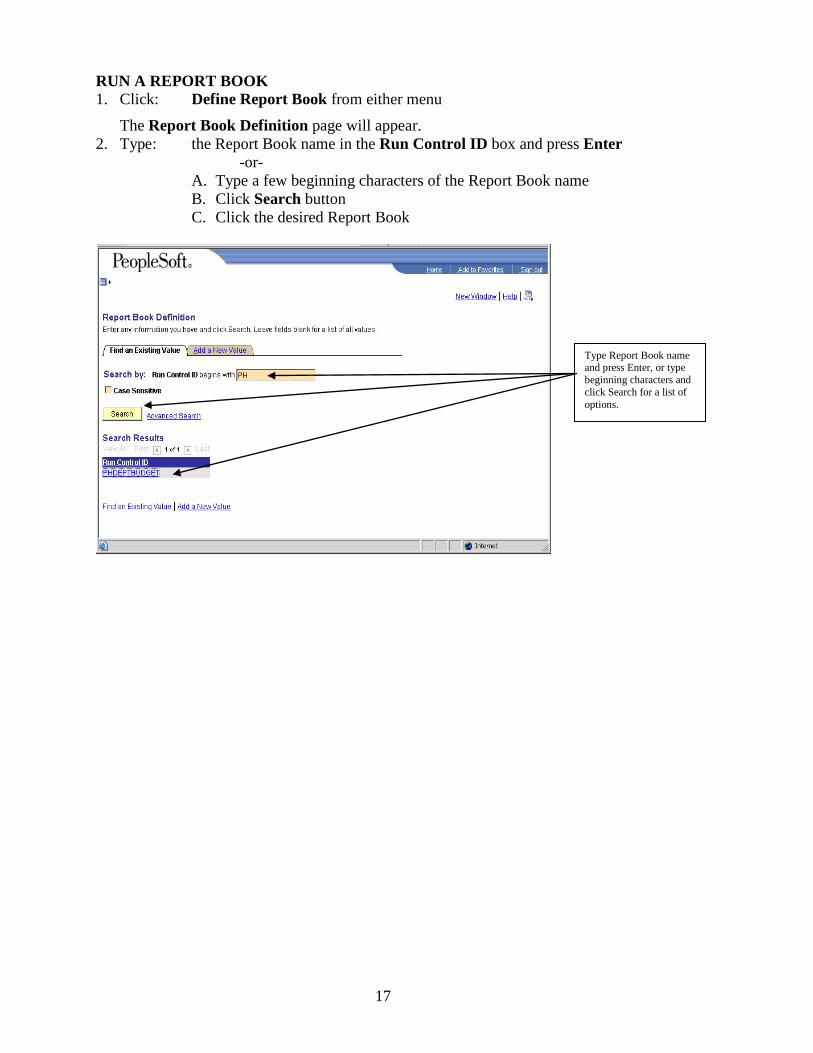
RUN A REPORT BOOK 1. Click: Define Report Book from either menu
The Report Book Definition page will appear. 2. Type: the Report Book name in the Run Control ID box and press Enter -or- A. Type a few beginning characters of the Report Book name B. Click Search button C. Click the desired Report Book
Type Report Book name and press Enter, or type beginning characters and click Search for a list of options.

18
The Report Book page will appear.
3. Select: a reporting date option by clicking the drop-down menu arrow to the right of the
As of Date box
A. The Today’s Date option automatically sets the reporting date to the day the report is requested.
B. The Specify option provides a box to enter the desired reporting date. 4. Select: the desired reports by checking the boxes in the Run column. To place a
checkmark in or remove a checkmark from a box, click on the box. 4. Click: Run button
Accept Today’s Date or change to Specify from the drop-down menu.
Select the desired reports by checking the corresponding checkbox in the Run column.
Click Run after other options are set.

19
The Process Scheduler Request page will appear. 4. Click: OK button
The Report Book page will reappear.
To retrieve the requested report, see RETRIEVE, SAVE, AND VIEW A REPORT starting on page 20.
Click OK.
20
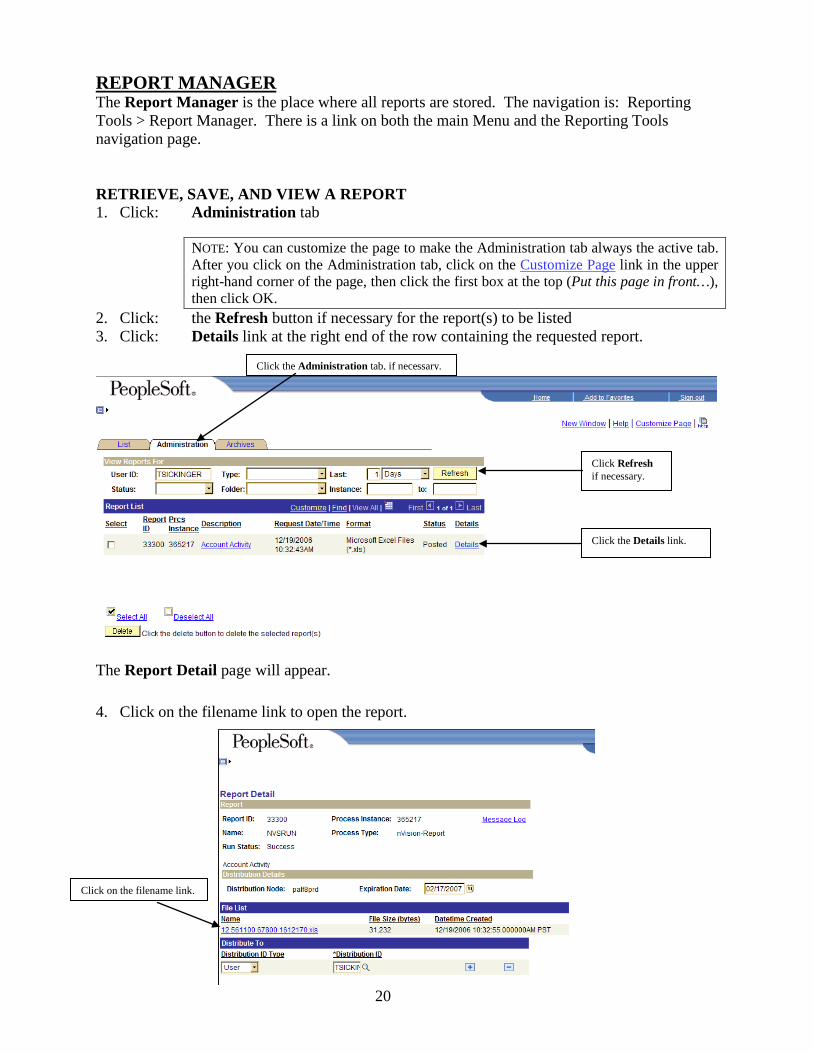
REPORT MANAGER The Report Manager is the place where all reports are stored. The navigation is: Reporting Tools > Report Manager. There is a link on both the main Menu and the Reporting Tools navigation page. RETRIEVE, SAVE, AND VIEW A REPORT 1. Click: Administration tab
NOTE: You can customize the page to make the Administration tab always the active tab. After you click on the Administration tab, click on the Customize Page link in the upper right-hand corner of the page, then click the first box at the top (Put this page in front…), then click OK.
2. Click: the Refresh button if necessary for the report(s) to be listed 3. Click: Details link at the right end of the row containing the requested report.
The Report Detail page will appear.
4. Click on the filename link to open the report.
Click the Administration tab, if necessary.
Click the Details link.
Click Refresh if necessary.
Click on the filename link.

21
The report will be opened in Excel as a Read-Only file.
6. Click: the Office Button, then Save As and save the file in the desired folder.

22
RUN DRILLDOWN (See Appendix A for one-time set-up information.) Details regarding the transactions that make up the figures in the report can be accessed by doing a drilldown function. 1. Click: the desired figure in the Current or Year to Date column in the spreadsheet
2. Click: the Add-Ins menu option
3. Click: nVisionDrill Drill
This returns the user from a Microsoft Excel window back into PeopleSoft in order to run the Drilldown.
Note: If you are not already signed into PeopleSoft, you will be requested to Sign In.
Click on figures for drilldown details.

23
4. Verify or select Window at the Type box. 5. Click: the desired Run Drilldown button
A. Journal Lines is the only choice for viewing on-campus “non purchase” expenses such as Mailroom charges, Comet Copy charges, etc. The following designators are used to identify these types of on-campus expenses:
Designator Type of Expense DR Departmental Receipts (Deposits) HR Adjustments to HR data MR Mailroom MS Miscellaneous PS Print Services (includes Comet Copy, Creative Services, & Paper Billing) PY Payroll SF Student Financials 0000 Expenditure transfers, various campus expenses (e.g. phone & data line connections)
Journal Lines also shows information for outside vendor purchases, but does
not give the details that AP Details displays.
B. AP Details is the better choice to view expenses that are payments for bills received by the College from outside vendors (including Cal Card), for purchases such as supplies and equipment. The AP Details option gives more information, including vendor name, PO#, and description of items purchased.
Click on the desired Run Drilldown button.
Verify or set Type to Window.

24
The drilldown report will be downloaded into Excel as a Read-Only file.
To save the drilldown report: 1. Click: the Office button 2. Click: Save As 3. Choose: the folder where you want it saved 4. Change: the filename

25
TROUBLESHOOTING If after running a report it does not show in the Report Manager, determine the cause by doing the following: 1. Navigate to the Process Monitor (PeopleTools > Process Scheduler > Process Monitor) 2. Click: Details link corresponding to the report that is missing from the Report Manager
The Process Detail page will appear. 3. Click: Message Log link
Click on the Details link corresponding to the report that is missing from the Report Manager
Click Message Log link.
The Run Status column shows whether the Report Request run was successful or had an error.

26
4. Read: the message in the Message Text column The message will describe the error that caused the report not to be posted to
the Report Manager.
5. Click: Return button to exit and return to Process Detail page
6. Click: OK or Cancel to return to Process Monitor page
Read the message in the Message Text column. It will describe the error that caused the report not to be posted to the Report Manager. In this case the error is because the layout name is incorrect – it is missing the underscore between the words ACCOUNT and REPORT.
Click Return button to exit.
Click OK or Cancel to return to Process Monitor page.

27
7. Correct the error reported in the Message Log.
8. Run the Report Request again after the correction is made. NOTE: Sometimes the error message is not clear. If this is the case, report the message to Traci Sickinger at x3112 and she will help you resolve the problem.
In this case the error is because the layout name is incorrect – it is missing the underscore between the words ACCOUNT and REPORT.
Correct the error in the Layout box by replacing the blank space with an underscore between the words ACCOUNT and REPORT.

28
APPENDIX A
In order to drill down from an nVision report, you must first install the nVisionDrill Add-In to Excel. This needs to be done only once. 1) Open Excel 2) Click on the Office button
3) Click on Excel Options
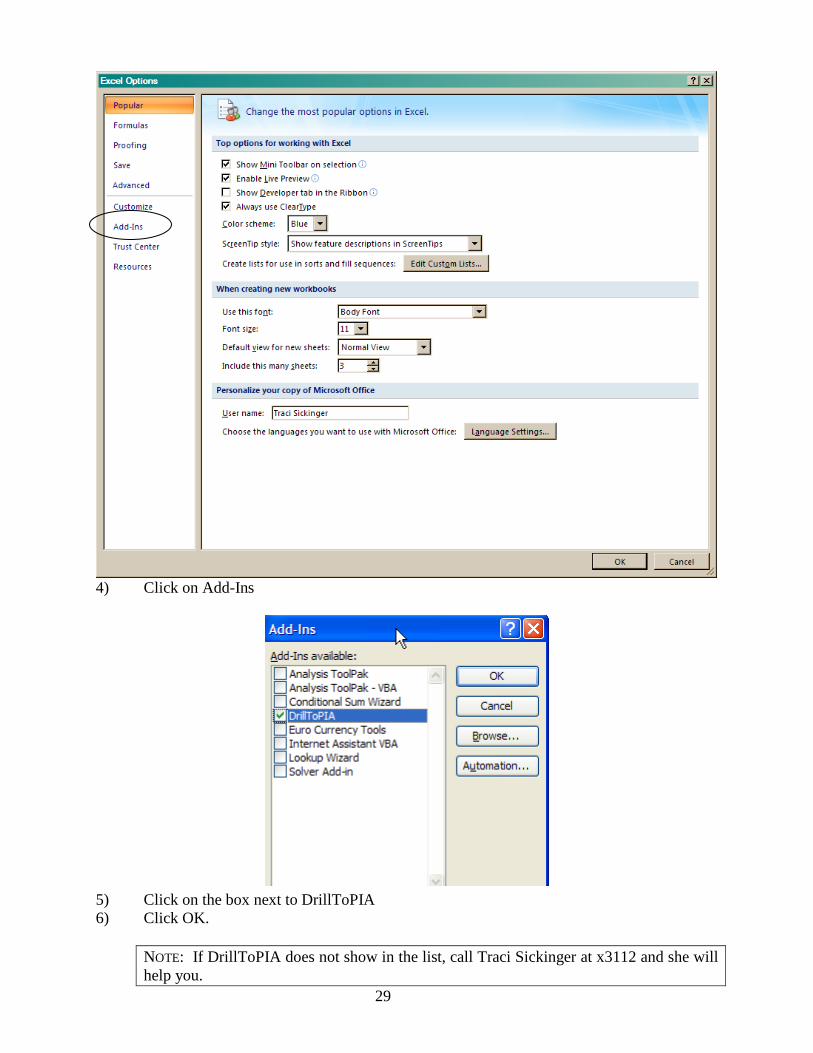
29
4) Click on Add-Ins 5) Click on the box next to DrillToPIA 6) Click OK.
NOTE: If DrillToPIA does not show in the list, call Traci Sickinger at x3112 and she will help you.