nutritional status of children under five years of age...
TRANSCRIPT
K O N T A K T 3 ( 2 0 1 4 ) 1 9 4 – 2 0 4
Available online at www.sciencedirect.com
journal homepage: http://www.elsevier.com/locate/kontakt
Original research article
Nutritional status of children under five years of age in Shire Indaselassie, North Ethiopia: Examining the prevalence and risk factorsGezae Brhane a, Nigatu Regassa b*a Addis Ababa University, Institute of Population Studies, Ethiopiab Hawassa University, Institute of Environment, Gender and Development, Ethiopia
I N F O R M A C E O Č L Á N K U
Received: 2013-12-03Received in revised form:
2014-06-03Accepted: 2014-06-13Published online: 2014-09-30
Keywords:MalnutritionUnder five childrenTigrayShire Endeslassie
A B S T R A C T
Malnutrition among children under five years of age is a chronic problem in most regions of Ethiopia, including the study region (Tigray). This study estimated the prevalence and identified the key risk factors of malnutrition in children under five years of age in Shire Indaselassie Town, North Ethiopia. Data were collected from 316 children aged under five and their mothers using quantitative survey and standard WHO protocols, and subsequent analysis was made using Emergency Nutrition Assessment (ENA) and SPSS software packages. The study estimated the prevalence of malnutrition and investigated the effects of demographic, socioeconomic, child health and sanitary conditions, feeding and dietary variables on malnutrition: stunting (low height for age), underweight (low weight for age) and wasting (low weight-for-height) among under-five children. Logistic regression was used to identify the determinants of malnutrition in the study area. The result showed that 56.6% of the children under age five have chronic malnutrition, are underweight (20.9%) and wasting (4.1%) with a mean z-score of –2.2, –1.0 and 0.3, respectively (i.e. average deviation, from the healthy and well nourished standard reference children of the same age). Children’s age, maternal education, maternal employment, child weight at birth, mothers’ body mass index and early initiation of breast feeding were the major factors associated with stunting among children. The main contributing factors of underweight among the children were found to be household size, marital status of mothers, decision on income allocation, contracting diarrhea two weeks preceding the survey, early initiation of breast feeding and bottle feeding. The study concluded that chronic malnutrition in the study area is still a major concern that needs timely intervention by governmental and non-governmental organizations.
© 2014 Jihočeská univerzita v Českých Budějovicích, Zdravotně sociální fakulta. Published by Elsevier Urban & Partner Sp. z o. o. All rights reserved.
* Korespondenční autor: Prof. Nigatu Regassa, PhD., Hawassa University, Institute of Environment, Gender and Development, P. O. Box 679, Hawassa, SNNPR, Ethiopia; email: [email protected]://dx.doi.org/10.1016/j.kontakt.2014.06.003
KONTAKT XVI/3: 194–204 • ISSN 1212-4117 (Print) • ISSN 1804-7122 (Online)
2014 • Volume 16 • Issue 1 • ISSN 1212-4117 (print) • ISSN 1804-7122 (on-line)
S O c I á l N í v ě d y
Článek citujte takto: Brhane G., Regassa N. Nutritional status of children under five years of age in Shire Indaselassie, North Ethiopia: Examining the prevalence and risk factors. Kontakt 2014; 16(3): e161–e170; http://dx.doi.org/10.1016/j.kontakt.2014.06.003

K O N T A K T 3 ( 2 0 1 4 ) 1 9 4 – 2 0 4 195
Introduction
Malnutrition is one of the most important health and welfare problems among infants and young children in Ethiopia [1]. Even though the prevalence of chronic malnutrition in the last eleven years has decreased significantly, children under five years of age still experience one of the highest rates of malnourishment in the world [1], that is, 44% of the children under age of five were stunted with a greater regional differences ranging from Amhara (52%), Tigray (51%), above the national prevalence to the lowest level in Addis Ababa (22%) and Gambella (27%) [1].
There is a consensus among many researchers that a complex set of factors determine malnutrition among young children while inadequate and inappropriate dietary intake and infectious diseases appear the immediate/direct causes. Also, numerous socioeconomic and demographic factors influence feeding patterns and health of children [2], which in turn results in decreased food intake, poor diet quality, and a high burden of early childhood infections that contribute to significant growth faltering, morbidity and mortality. The factors leading to any Anthropometric deficiency (stunting, wasting, and underweight) differ from one context to the other. For example, according to the recent national report [1], the prevalence of stunting increases as the age of children increases and male children are slightly more likely to be stunted than female children (46% and 43%, respectively). Based on national data, Patricia [3] indicated that environmental factors (access to water and sanitation at the community level) were key predictors of underweight children in Ethiopia. Another study based on a large sample size drawn from five zones of Southern Ethiopia by Gugsa [4] determined that women’s education, household economic status, age of the child and infant feeding practice were the significant predictors of stunting.
Despite few studies done at national and regional levels, the prevalence and risk factors at sub-regional or community level have been insufficiently emphasized, which makes interventions difficult in such circumstances. For example, according to the 2011 DHS [1], the prevalence of stunted, wasted and underweight children in the region (Tigray) was 51%, 10.3% and 35%, respectively, indicating that there are several zones and districts with higher prevalence rates than the regional average. Therefore, this study investigated the current prevalence and key risk factors of malnutrition among children under five years of age in Shire Indaselassie District, North West zone of Tigray. This study, thus, posed and addressed the following two questions: 1) What is the prevalence of stunting, wasting and underweight of children 0–59 months of age in the study area? 2) What are the key predictors of stunting and underweight among children 0–59 months of age in the study area?
Conceptual framework
The conceptual framework in this study (Chart 1) was adapted from the United Nations Children’s Fund
framework [2, 5] and the subsequent extended model [6]. The framework is comprehensive, incorporating both biological and socioeconomic causes, and encompasses causes at both micro and macro levels. It breaks the status and determinants of child malnutrition into three levels of causality: immediate determinants (the most proximate level), underlying determinants, and basic determinants.
The immediate determinants of child nutritional status manifest themselves at the level of the individual human being. They are dietary intake (energy, protein, fat, and micronutrients) and health status. These factors themselves are interdependent. A child with inadequate dietary intake is more susceptible to disease. In turn, disease depresses appetite, inhibits the absorption of nutrients in food, and competes for a child’s energy [5].
The immediate determinants of child nutritional status are, in turn, influenced by four underlying determinants manifesting themselves at the household level. These are socioeconomic and demographic characteristics, healthy environment, proper sanitary conditions and infant and young child feeding practices. The underlying factors are also interdependent to each other as depicted in the dashed red arrows which will not be focused in the analysis except their influence on nutritional status of children (Chart 1).
Material and methods
The study setting
The research was conducted in Shire Indaselassie, North West zone of Tigray Region, Ethiopia. Northwestern (or “Semien Mi‘irab”) is one of the five zones in Tigray. According to the 2007 Census conducted by the Central Statistical Agency of Ethiopia (CSA), this zone had a total population of 736,805, of which 368,254 were men and 368,551 women. About 15% of the population live in urban areas while the majority live in rural areas. The majority of its habitants are Ethiopian Orthodox Christians (85.1%) while 14.7% are Muslims and 0.2% follow other religions [7]. The study town is 1087 km north of the capital, Addis Ababa and 309 km north west of the regional capital, Mekelle. Shire Indaselassie is an urban area surrounded by Kebeles (villages) of Tahtay Koraro Woreda, and has a rapidly growing population of 47,284, of which 21,867 were men and 25,417 were women. A total of 6144 of the population were children 0–59 months of age [7].
Type and source of data and study design
Data were collected from 325 sample households by interviewing randomly selected mothers/care givers. The study employed cross-sectional descriptive survey (where information was collected at specific point in the lives of the respondent) using qualitative and quantitative approaches.

K O N T A K T 3 ( 2 0 1 4 ) 1 9 4 – 2 0 4196
Source: Adopted from UNICEF [2, 5] and modified by the authors.
chart 1 – conceptual framework
Sampling design
The sample size computation considered the number of children 0–59 months of age in the area which was 6144 [7], 5% precision level, 51% regional prevalence of malnutrition for children under age 5 [1] and 0.85 design effect for the different clusters [8]. Therefore, an optimum sample size of 307 children was calculated and 6% contingencies were added to get a total of 325 sample respondents.
The computed sample of 325 was drawn using two stage cluster sampling designs. In the first stage, the whole population of the study area was divided into five local administrative areas called “kebeles”. Accordingly the five kebeles were clustered into 52 small clusters, and then, 42 clusters were randomly selected using ENA software [8] with the chance of each cluster being selected proportional to the size of its population. In the second stage of sampling, the households with children of 0–59
197
months of age were listed for each selected cluster and unique code was assigned to each household. Then, sample of households with children 0–59 months of age were selected using systematic sampling by initially determining the sampling interval of each cluster (i.e. total number of households in the selected clusters divided by the number of households to be visited). The first sample was selected using a lottery method.
Data collection
A structured questionnaire was developed to collect some background characteristics, child health and sanitary conditions including infant and young child feeding practices through interviewing mothers/care givers and measuring mothers’ and children’s height and weight. The questionnaire was translated into the local language “Tigrigna” and was reviewed by nutritionists and then pre-tested on five respondent mothers and necessary modifications were made before starting the actual survey.
An electronic mother/child scale was used for weighing mothers and children with “double-weighing” approaches. Although fairly expensive, it is the recommended scale to use for weighing children in nutrition assessment because of the ease of use and the quality of the data collected [8]. A measuring board made of hardwood in 0.1 cm graduations, with movable head-board and large enough foot-board for a child to stand on it was used to measure children’s height. The scales were provided by the Central Statistical Agency of Ethiopia (CSA). Two degree holders and six high school completed enumerators who were able to communicate in the local language (Tigrigna) and had experience in other similar field surveys were recruited and given intensive training.
Approval for the data collection (i.e. a form of ethical clearance) was given by Shire Indaselassie Health Office and the study village administrators. Consent was also obtained from each mother/care giver of children in the selected households prior to the interview. The data collectors interviewed all eligible sampled respondents.
Data processing and analysis
Epi Info software package version 3.5.1 was used for entry, cleaning, verification of the data and ENA and SPSS (version 20.0) software packages were used to convert height and weight measures into z-scores, estimate the prevalence of malnutrition, and analyze the data, respectively.
In the course of the analysis, the WHO reference/Standard Population (8440 children from Brazil, Ghana, India, Norway, Oman and the United States) was used to measure the nutritional status of children [9], replacing the old one which was based on a limited sample of children from the United States of America. The new standards confirm that children born anywhere in the world and given the optimum start in life have the potential to reach the same range of height and weight.
The study employed the anthropometric measurements which are commonly used direct methods for the assessment of child nutritional status. Anthropometric indicators used to measure child malnutrition include
wasting, stunting, and underweight. These indicators compare the growth of the child being measured with the growth of well nourished and healthy children of the ‘reference’ population in the same age [9].
The study used three dependent variables in the course of identifying the key risk factors associated with malnutrition among children aged under five of the study area: stunting, wasting and underweight. The Stunting (Shortness) dimension is an indicator of chronic (long-term) nutritional status of children because it shows pre- and post-natal linear growth. It was calculated by comparing the height-for-age of a child with a reference population. “Stunting” refers to shortness that is not genetic, but occurs due to poor health or nutrition. It is good cumulative measure of “well-being” for populations of children as it could not be affected by weight recovery. The second dependent variable, wasting (thinness), is an indicator of acute (short-term) malnutrition which was calculated by comparing the weight-for-height of a child with a reference population. Wasting is usually the result of recent food insecurity or infection/illness, such as diarrhea. It is often used to assess the severity of an emergency situation, with severe wasting being highly correlated with mortality. The third measure was underweight, which is a composite of both acute and chronic malnutrition, calculated by comparing the weight-for-age of a child with the reference population.
The z-score was computed for each measure to see how far a child is from the median height/weight of the reference distribution for children of the same height/weight, taking into consideration the standard deviation of the reference distribution. In this case, height and weight measurement of children was converted into z-scores using ENA software taking age into consideration based on the new reference population recommended by the World Health Organization [9], to see the nutritional status of children in the study area. Thus, those below –2 standard deviations of the median reference of height-for-age, weight-for-age and weight-for-height were defined as stunted, underweight, and wasted, respectively implying the existence of undernutrition in the study area.
Because all three dependent variables mentioned above were dichotomous, variables were categorized into two: those children who were exposed to the event (i.e. stunted, wasted or underweight) and those who were not exposed to the event (i.e. not stunted, not underweight or not wasted). Binary logistic regression analysis was used to examine the net effects of each independent variable on the dependent variables of interest. The estimated coefficients tell us the increased or decreased chance of malnutrition, given a single independent variable, while controlling the effects of other variables in the model. Estimates of odds ratio >1.0 indicate that the risk of malnutrition was greater in a category than that for the reference category. Estimates >1.0 indicate that the risk of malnutrition was less than that for the reference category of each variable. In order to estimate the parameters, maximum likelihood based iteration algorithms were employed.
The backward logistic regression procedure was used to select the best fitting model, and the presence of multi-coolinearity was assessed by using a standard
K O N T A K T 3 ( 2 0 1 4 ) 1 9 4 – 2 0 4
198
error. Results with standard error greater than two were excluded from the analysis. The predictor variables analyzed as determinants of nutritional status of children were grouped into socioeconomic, demographic, health and sanitary conditions, including infant and young child feeding practices.
Results
Background characteristics
A total of 316 children aged 0–59 months were enrolled in this study. The results in Table 1 show that of the total 316 children in the sampled households, 51.9% and 48.1% were males and females, respectively. The mean age of the children in the study area was 24.5±15.3 months and the mean age difference between the index child and the immediate one was 57.5±32.6 months with a range of 12–24 months.
Thirty-seven percent of the households had only the index children while 45.6% households had two to three children, the rest 17.7% of households had four and above children. Christianity is the dominant religion (83.9%) followed by Islam (14.5%). The household size of the study households ranged from 2 to 9 with a mean of 4.2±1.4 members.
Among parents of the study children, 20.0% and 9.2% of mothers and fathers, respectively, did not attend school, while 44.6% of fathers and mothers/care givers had attended primary schooling. Relatively higher percentages of fathers attended secondary and above schooling levels (36.4%) compared to 35.4% of mothers/care givers.
The majority of the mothers/care givers (71.8%) were not employed or are engaged only in household tasks while the rest (28.2%) were employed for paid cash and/or own businesses outside their home. The majority of the households (82%) were headed by males while the rest 15.5 and 2.5% were headed by the respondents and others respectively.
Prevalence of malnutrition (stunting, wasting and underweight)
Anthropometric indicators were used to measure the nutritional status of children, and plausibility checks were made during calculations of z-score using the ENA software, and hence, z-score below –4SD and above 4SD were excluded from the analysis. This part of the plausibility report shows that the standard deviation is relatively high (mostly caused by inaccurate measurements) and therefore the rate of malnutrition is higher than it would be with a normal standard deviation.
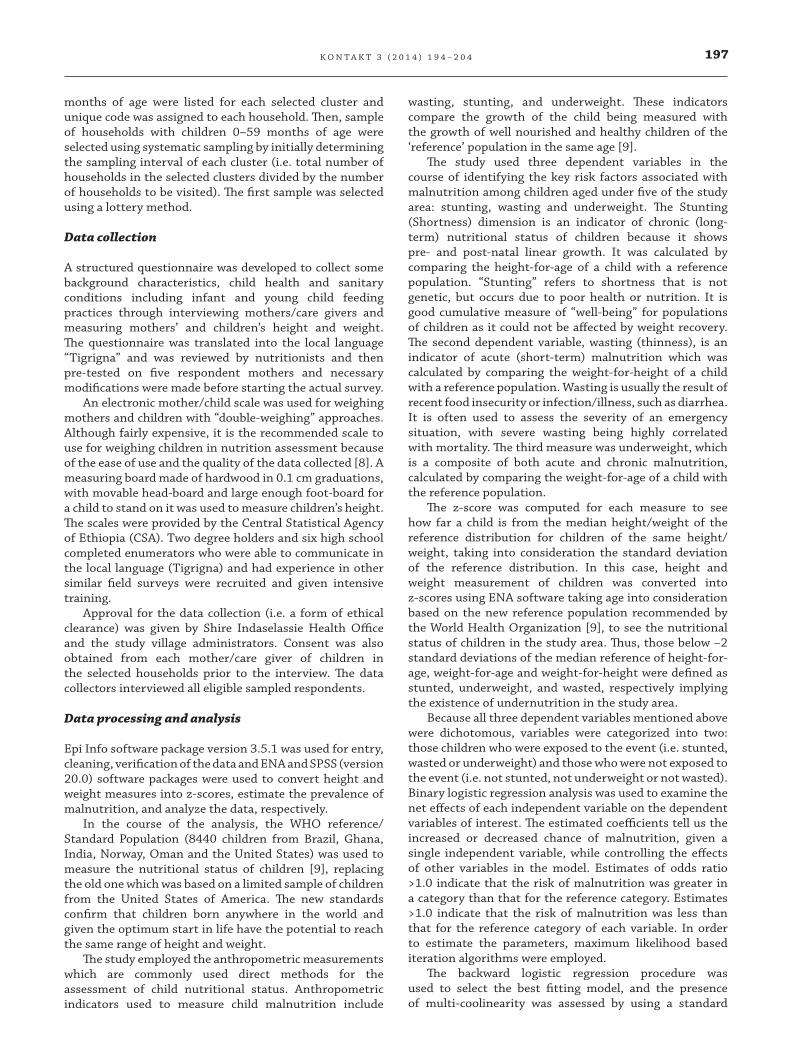
Stunting (low height-for-age)As shown in Chart 2, the study children’s height-for-age average deviation, from the healthy and well nourished standard reference children of the same age for male and female is –2.2 and –2.1, respectively. The prevalence of stunting for male and female children is 57.3% and 55.9%,
Table 1 – Percentage distribution of Respondents by background characteristics, Shire Indaselassie, 2013
Characteristics Number Percent
Age in months
0–5 39 12.3
6–8 12 3.8
9–11 36 11.4
12–17 33 10.4
18–23 41 13.0
24–35 71 22.5
36–47 52 16.5
48+ 32 10.1
Sex of children
Male 164 51.9
Female 152 48.1
Birth order
1st 116 36.7
2–3 144 45.6
4+ 56 17.7
Household size
<3 116 36.7
>4 200 63.3
Religion
Christian 267 84.5
Moslem 49 14.5
Mother’s education
Illiterate (0) 63 20.0
Primary (1–8) 141 44.6
Secondary and above 112 35.4
Father’s education
Illiterate (0) 29 9.2
Primary (1–8) 141 44.6
Secondary and above 146 46.2
Mothers’ employment status
Employed 89 28.2
Unemployed 227 71.8
Head of household
Mother/care giver 89 28.2
Father 227 71.8
Other 89 28.2
respectively. More male children (31.1%) were found to be severely stunted compared to female (26.3%). Overall, the prevalence of stunting for children aged less than five years is 56.6% with variations across the different predictor variables in the study area.
K O N T A K T 3 ( 2 0 1 4 ) 1 9 4 – 2 0 4
199
Underweight (low weight-for-age)
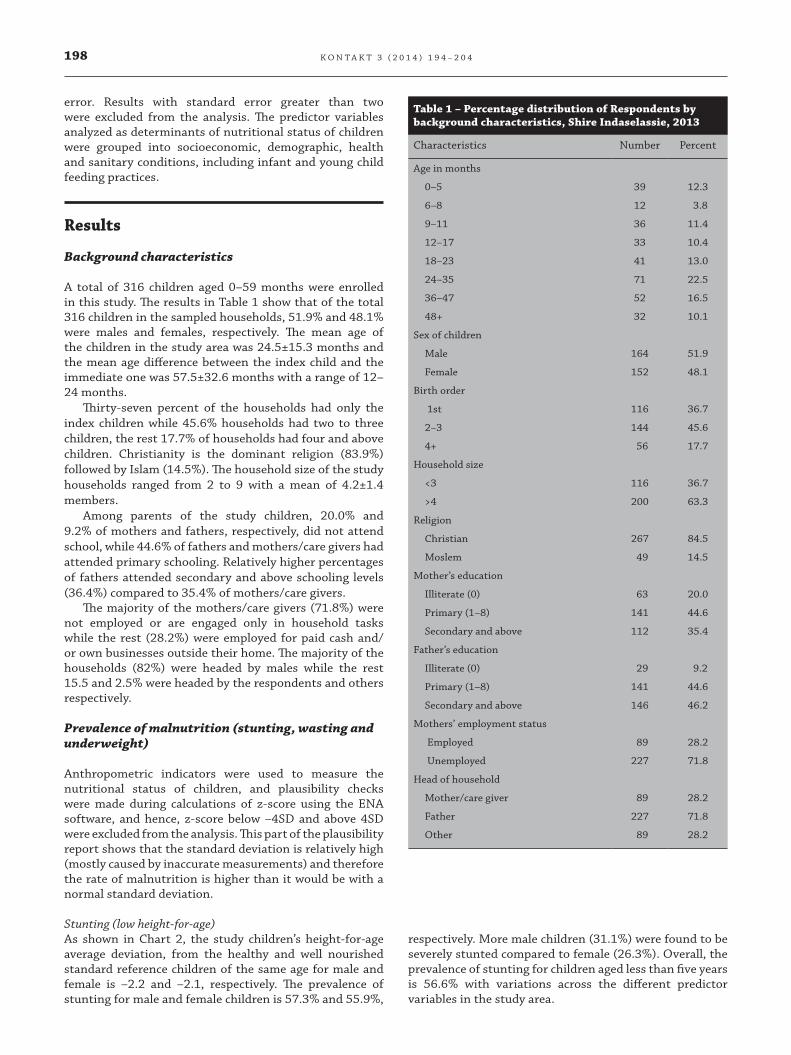
chart 3 – Weight-for-age: z-score distribution of children as compared to the standard reference population by sex, Shire Indaselassie, 2013
Underweight (low weight-for-age)The weight-for-age average deviation, from the standard reference children of the same age for male and female is
–1.1 and –1.0, respectively, in Shire Indaselassie as shown in Chart 3. Overall the prevalence of underweight in the study area is 20.9%.
Stunting (low height for age)
chart 2 – Height-for-age: z-score distribution of children as compared to the standard reference population by sex, Shire Indaselassie, 2013
Wasting (low weight-for-height)The children’s weight-for-height average deviation from the standard reference children of the same age for male and female is 0.3 and 0, respectively in Shire Indaselassie (Chart 4), showing that wasting is not a major nutritional problem of children in Shire Indaselassie and will not be discussed in this section.
Determinants of malnutrition in children under five years
Two different binary logistic regression models were fitted as described in section ‘Material and methods’
above to see the key explanatory variables of chronic malnutrition and underweight among children of the study area. The first model (stunting) is fitted to identify the determinants of stunting in children under five years of age. The second model (underweight) also demonstrates the major determinants of underweight (low height for age) in the same children. Tables 2 and 3 present the estimated coefficients of only those predictors that have significant influence on nutritional status of children in Shire Indaselassie which includes age of children, mothers’ educational status, mothers’ employment status, birth weight of children, body mass index of mothers and initiation of infant breast feeding. The estimated
Height-for-age z-scores (boys/girls)
Weight-for-age z-scores (boys/girls)
K O N T A K T 3 ( 2 0 1 4 ) 1 9 4 – 2 0 4

200Wasting (low weight-for-height)
chart 4 – Weight-for-height: z-score distribution of children as compared to the standard reference population by sex, Shire Indaselassie, 2013
Weight-for-height z-scores (boys/girls)
Table 2 – Results of logistic regression for the determinants of stunting, Shire Indaselassie, 2013
Determinants S.E. Wald P value Exp ( )
Child’s age in months 17.864 0.007*
<6 0.965 0.401 5.796 0.016* 2.626
6–8 1.484 0.703 4.461 0.035* 4.412
9–11 1.386 0.401 11.961 0.006* 4.000
12–17 0.845 0.42 4.05 0.014* 2.328
18–23 0.546 0.226 5.82 0.008* 1.726
24–35 0.143 0.072 3.948 0.010* 1.154
36+ (ref.) 1.000
Mother education 7.272 0.043*
Primary (ref.) 1.000
Illiterate 0.731 0.531 1.895 0.92 2.077
Secondary+ –1.583 0.59 7.195 0.003* 0.205
Mothers’ Employment
Unemployed (ref.) 1.000
Employed –0.515 0.26 3.923 0.041* 0.597
Birth weight
>2.5 kg (ref.) 1.000
<2.5 kg 0.83 0.24 11.992 0.001* 2.292
Mothers’ body mass index 6.354 0.042*
<18.5 (ref.) 1.000
18.5–24.99 –1.04 0.419 6.152 0.013* 0.353
25+ –0.379 0.132 8.244 0.039* 0.684
Early initiation of breast
Immediately (ref.) 1.000
More than an hour 0.462 0.138 11.208 0.023* 1.587
Constant 4.163 1.222 11.606 0.001 64.24
ref., reference category; , estimated coefficient; S.E., standard error.* Significance (P<0.05).
Determinants ̂ S.E. Wald P value Exp( ̂ )
Determinants ̂ S.E. Wald P value Exp( ̂ )
Determinants ̂ S.E. Wald P value Exp( ̂ )
K O N T A K T 3 ( 2 0 1 4 ) 1 9 4 – 2 0 4

201
coefficient for the covariates of the model, their standard error and each corresponding estimated coefficient of stunting among children aged under five has been given in the following tables.
Compared with children in the older age cohort (36+ months), the risk of stunting for the younger age cohort (<6 months) is 2.6 times higher and 4.4 times more for children in the age group 6–8 months which is the highest risk of stunting for children. Children in the age cohort 9–11 months are also four times more likely to face stunting than the older age groups (36 months) controlling the effect of the other factors. Overall, the chance of stunting increases from the youngest age cohort (<6 months) until 12–17 months and decreases for children aged 18 months and above.
Stunting among children of illiterate mothers is 2.1 times more than children of primary schooling level. However controlling the effect of other factors, the risk of being exposed to stunting is 79.5% lower for children of mothers who have secondary and above educational attainment when compared to children of primary schooling mothers.
The odds of stunting among children of employed mothers are 0.597 times less than children of unemployed mothers. Birth weight of children is also another important positive factor associated with children stunting. The odds of stunting among children with less than 2.5 kg birth weight are 2.292 times higher as compared to children with >2.5 kg birth weight, holding the other factors constant.
The risk of stunting in children whose mothers’ body mass index is 18.5 kg/m2 and above and below 18.5 kg/m2 is 64.7 and 31.6%, respectively. Early initiation of breast feeding is also inversely related to stunting among the study subjects. The odds of stunting among children who
were put on breast for more than an hour after birth is 1.587 times greater than children who started the breast milk within an hour after birth (immediately).
With regard to the key variables affecting underweight (Table 2), household size, mothers’ marital status, income decision of households, history of diarrhea in two weeks preceding the survey, early initiation of breast feeding and bottle feeding are identified as the major determinants.
A one-person increase in the household members increases the likelihood of being underweight by 6.172 times. Mothers living together with their husbands/fathers of their children were considered as living together and those who were divorced, separated and widowed were categorized as not living together. The study showed children from parents who do not live together are 3.6 times more likely to be exposed to underweight than children whose parents are living together. The likelihood of being underweight for children is 64.5% less when the decision on income allocation is made jointly by the mother and father than the decision is made separately. The risk of being underweight for children with no diarrhea in two weeks preceding the survey date decreases by 73% compared to children who had diarrhea.
It is observed that the likelihood of underweight for children is higher by 2.664 times more when breast feeding is initiated in more than an hour after birth as compared to children who were put to breast immediately after birth. In the same token, feeding from bottle with nipple has significant positive association with the likelihood of underweight in children of the study area. The odd of being underweight for children is 5.12 times is higher in children feeding from bottle with nipple than those who do not feed from a bottle with nipple.
Table 3 – Results of logistic regression for the determinants of underweight in children, Shire Indaselassie, 2013
Determinants S.E. Wald P value Exp ( )
Household size 1.82 0.876 4.316 0.006 6.172
Marital status
Living together (ref.) 1.000
Not living together 1.284 0.639 4.041 0.009 3.61
Income decision
Independently (ref.) 1.000
Jointly –1.036 0.463 5.011 0.025 0.355
Diarrhea last two weeks
Yes (ref.) 1.000
No –1.31 0.48 7.448 0.044 0.270
Early initiation breast
Immediately (ref.) 1.000
More than an hour 0.98 0.46 4.539 0.038 2.664
Bottle feeding
No (ref.) 1.000
Yes 1.631 0.655 6.2 0.013 5.120
Constant –0.33 0.146 5.109 0.893 0.719
Significance (P<0.05), ref., reference category; , estimated coefficient; S.E., standard error.
Determinants ̂ S.E. Wald P value Exp( ̂ )
Determinants ̂ S.E. Wald P value Exp( ̂ )
Determinants ̂ S.E. Wald P value Exp( ̂ )
K O N T A K T 3 ( 2 0 1 4 ) 1 9 4 – 2 0 4

202
discussion
One of the key findings of this study is that more than half of the children (56.6%) in Shire Indaselassie of Tigray region are stunted, and this is higher than the results of the Ethiopian Demographic and Health Survey [1] for urban areas, regional as well as national levels.
The result of multivariate analysis (logistic regression) also showed that stunting is significantly associated with age of the study children showing compatibility with previous studies conducted in other places [10, 11, 12]. Children in the oldest age group (36+ months) are at a significantly lower risk of stunting compared to the younger age groups. The higher risk at younger ages may be due to the increased nutritional needs for growth and development until three years. Or it could also be due to lack of adequate dietary diversity, meal frequency and acceptable diet, as the large proportions of children were not receiving it. This study has also indicated that exclusive breastfeeding up to 6 months of age is not widely practiced nor is the timely introduction of foods at about 6 months.
Children’s birth weight is one of the major demographic determinants of stunting among children in the study area. There is statistically inverse relationship between children’s birth weight and stunting. The likelihood of stunting decreased as the birth weight increased and vice versa. Children born being less than 2.5 kg are at higher risk of stunting. This finding is similar to a study conducted by Ramakrishnan et al. [13]. The negative association may be due to the inadequacy of nutrients starting from uterus until three years after birth, where high amount of nutrients is needed [14, 15].
The risk of stunting is lower among children whose mothers’ body mass index is normal (18.5–24.99) and overweight (25+) compared to thin mothers (<18.5). The reason for this may be due to the fact that small women have greater chance of delivering an infant with low birth weight and low birth weight infants have increased risk of stunting, leading to an intergenerational effect since low birth weight infants tend to attain a smaller size as adults [14].
The analysis showed that children from educated mothers have a lower chance of stunting compared to children of mothers with no education. The association of maternal education with chronic malnutrition of children in this study is consistent with many of the previous studies on the subject. Education of women exerts impacts on health and nutritional status of children since it provides the mother with the necessary skills for child care, increases awareness of nutritional needs and preference of modern health facilities as well as change of traditional beliefs about diseases causation [16].
Mother’s unemployment is a significant risk factor of stunting. This may be because employed mothers may earn more income and they may use it to benefit their child’s health and nutrition. Hence women’s participation in income generating activities is paramount in improving their children’s nutritional status. This finding is also
compatible with the studies of Charmarbagwala et al. [17] and Ajieroh [18].
Even though variables such as initiation of breast feeding, colostrums feeding, continued breast feeding and bottle feeding were significantly associated at the bivariate level, only early initiation of breast after birth is found to have a statistically significant association with stunting of children in the multivariate analysis. In this case, children who started breast immediately after birth have lower chance of stunting than children who were fed breast after hours of birth. This could be due to increased early production of milk, and colostrum feeding. The colostrum provides natural immunity protecting children from illness that could escalate stunting. This finding is compatible with the joint WHO and UNICEF [19] guidelines and recommendations. Even though there was no observed statistical relationship, stunting is lower among children who were fed colostrum, and continued breast feeding until two years, but higher among children who did not receive this.
In Ethiopia a decreasing pattern of underweight children was observed in the successive DHS surveys conducted by CSA [20, 21, 1]. In this study, the prevalence of underweight among children under age five also showed a similar diminishing pattern, with slightly higher than the UNICEF-WHO-The-World Bank [22] global estimate of underweight for the year 2011. However, there are still factors affecting the weight-for-age among under five years children observed in the bivariate and multivariate analysis. According to the fitted logistic regression on the observed data of children weight-for-age, the significant factors were household size, mothers’ marital status, household’s decision on income, history of diarrhea in two weeks preceding the survey, initiation of breast feeding and feeding from bottle with nipple.
An increase in household members has shown a strong negative influence on children weight for age. That is, as the size of household members changes the likelihood of weight-for-age decreases or increases the risk of underweight. This might be because of depletion of resources due to the large family size that decreases dietary intake which deteriorates health conditions and ultimately influences children’s nutritional status and survival.
Marital status was also statistically associated with children’s low weight-for-age. There is a lower chance of underweight among children of mothers living together with their husbands than those living alone. These results are compatible with previously conducted studies such as Haidar and Kogi-Makau [23]. The positive impact of marriage could be more when husbands have higher probability of working outside their home and earn more income, when they help their wives closely especially in improving their children health and feeding practices. For example, when decision on income allocation of the household is made together, their proportion of underweight children is smaller than when it is made separately.
Different studies revealed that the presence of diarrhea within the last two weeks before the survey was highly associated with underweight children. It is also documented that malnourished children have more severe
K O N T A K T 3 ( 2 0 1 4 ) 1 9 4 – 2 0 4

203
diarrheal episodes and a child with diarrhea loses weight and can quickly become malnourished. Similar to the UNICEF [24] report, in this study, children with diarrheal disease two weeks preceding the survey were more likely to be at risk of underweight than those without diarrhea. The reason may be that diarrhea depletes the body fluids. Children with diarrhea are more likely to lose weight and show low weight for their age.
Among the variables of young child and infant feeding practice studied, only early initiation of breast feeding and feeding from bottle with nipple were identified as significant determinants of low weight-for-age (underweight). Children who initiated breast immediately are less likely to be underweight than children who started after an hour of birth. Children who were fed from bottle with a nipple the day before the survey date were more likely to be underweight than those who were not. This tendency, coupled with inappropriate or inadequate feeding practices, may contribute to faltering nutritional status among children, because infant formulas (which are often watered down) and other types of milk do not provide comparable nutrition to breast milk for infants less than six months of age. Additionally, improper sanitary conditions with bottle feeding can introduce pathogens that cause infectious diseases and depress their nutritional status. For these reasons, bottle feeding puts infants at a higher risk of illness and malnutrition. The result is compatible with the successive studies of the Ethiopian Demographic and Health Survey results conducted by CSA [20, 21, 1] and Beka et al. [25].
Finally, this study had some drawbacks worth mentioning. The study provides a single/snap shot look at the study population, and hence, it may not be a sound base for studying the underlying causes and mechanisms related to the unacceptably high level of malnutrition among children aged under five. It is also worth mentioning that the current study did not compare the prevalence of malnutrition with other urban based studies in the region due to lack or absence of such studies. Despite these weaknesses, it is believed that this work contributes to our understanding of the depth of the problem in the area. Its findings can also be applicable to other populations with similar characteristics.
conclusion
In conclusion, the result of this study has revealed the existence of unacceptably higher prevalence of malnutrition (especially stunting) among children aged under five in the study area. Further, it was noted that several demographic, socioeconomic, children health and sanitary conditions and practices of feeding variables have appeared to be significant predictors of the nutritional status among children of Shire Indaselassie.
In view of the nature of the significant variables discussed in the discussion section, the authors suggest that health institutions at all levels should integrate nutrition as a health component and conduct close monitoring and evaluations of the activities. The program
should address child malnutrition through comprehensive preventive measures such as strengthening family practices related to infant and young child feeding, childcare with appropriate medical treatment and nutrition management, prevention of illnesses through immunization and hygiene/sanitation, educate appropriate dietary practices in the family, appropriate use of nutritional supplements and micronutrient supplements including diarrhea management through ORT. In order to support the family based counseling and behavior, change communication, and local community based approach should be taken up at community level to enable a positive environment to promote the appropriate family practices as acceptable social norms. Finally, it is worth mentioning that the capacity of the health centers and health extension workers should be strengthened through better staffing, additional trainings on management of nutrition education and service provision.
R E F E R E N C E S
[1] CSA (Ethiopian Central Statistical Agency). Demographic and Health Survey, Ethiopia; 2011.
[2] UNICEF (United Nations Children’s Fund). Strategies of improving nutrition of children and women in developing countries. New York; 1990.
[3] Patricia S. Environmental Factors and Children’s Malnutrition in Ethiopia. Policy Research working papers; 2005.
[4] Gugsa Y. Malnutrition among children in southern Ethiopia: Levels and risk factors. Ethiop. J. Health Dev 2000;14(3):283–92.
[5] UNICEF (United Nations Children’s Fund). The state of the world’s children focus on Nutrition: the silent energy; 1998. [online] [cit. 2013-06-12]. Available from: http://www.unicef.org/sowc98.
[6] Engle P, Menon P, Haddad L. Care and nutrition: Concepts and measurement. World Development 1999;27(8):1309–37.
[7] CSA (Ethiopia Central Statistical Agency). Population and Housing Census, Ethiopia; 2007.
[8] ENCU (Emergency Nutrition Coordination Unit). Interim guidelines for nutrition surveys in Ethiopia, Addis Ababa; 2008.
[9] WHO (World Health Organization). Multicentre Growth Reference Study Group. WHO Child Growth Standards: Length/Height-for-Age, Weight-for-Length, Weight-for-Height and Body Mass Index-for-Age: Methods and Development. Geneva, Switzerland: WHO; 2006.
[10] Samson TA, Lakech G. Malnutrition and enteric patasitoses among under-five children in Aynalem Village, Tigray. Ethiop J Health Dev 2000; 14(1):67–75.
[11] EHNRI (Ethiopian Health and Nutrition Institute). Nutrition Baseline Survey report for the national nutrition program of Ethiopia, Addis Ababa; 2009/10.
[12] Babatunde RO (2011). Prevalence and Determinants of Malnutrition among Under-five Children of Farming Households in Kwara State, Nigeria. Journal of Agricultural Science 2011;3(3):173–81.
[13] Ramakrishnan U, Manjrekar R, Rivera J, Gonzales-Cossio T, Martorell R. Micronutrients and pregnancy
K O N T A K T 3 ( 2 0 1 4 ) 1 9 4 – 2 0 4
204
outcome: A review of the literature. Nutrition Research 1999;19(1):103–59.
[14] Ellie Whitney, Sharon Rody Rolfes. Understanding nutrition. 11th edition. Adopted from the Dietary Reference Intake series, National Academy Press. Student Edition; 2005, 2008.
[15] World Bank. Repositioning Nutrition as Central to Development. A Strategy for Large-Scale Action. Washington, DC: 2006.
[16] United Nations. Population consensus at Cairo, Mexico City and Bucharest. Analytical Report; 1985.
[17] Charmarbagwala R, Ranger M, Waddington H, White H. The determinants of child health and nutrition; 2005.
[18] Ajieroh V. A Quantitative Analysis of Determinants of Child and Maternal Malnutrition in Nigeria. International Food Policy Research Institute (IFPRI), Abaja; 2009.
[19] WHO and UNICEF (World Health Organization and United Nations Children’s Fund). Global Strategy for
Infant and Young Child Feeding; 2003. [online] [cit. 2013-06-12]. Available from: URL:http://www.who.int/mediacentre/factsheets/fs342/en/
[20] CSA (Ethiopian Central Statistical Agency). Demographic and Health Survey, Ethiopia; 2000.
[21] CSA (Ethiopian Central Statistical Agency). Demographic and Health Survey, Ethiopia; 2005.
[22] UNICEF-WHO-The World Bank. Joint Child Malnutrition Estimates, 2011 revision; 2012.
[23] Haidar J, Kogi-Makau W. Gender differences in the household-headship and nutritional status of pre-school children. East Afr Med J 2009;86(2):69–73.
[24] UNICEF (United Nations Children’s Fund). The State of the World’s Children, New York; 2012.
[25] Beka Teshome, Wambui Kogi-Makau, Zewditu Getahun, Girum Taye. Magnitude and determinants of stunting in children under five years of age in food surplus region of Ethiopia: The case of West Gojam Zone. Ethiop J Health Dev 2009;23(2):98–106.
K O N T A K T 3 ( 2 0 1 4 ) 1 9 4 – 2 0 4