nutrition and fitness genetic profile report - accurate...
TRANSCRIPT

Name: Sample Patient
Date: 04-Dec-15
Nutrition and Fitness Genetic Profile Report
Page 1
Version 6.1See disclaimers on page 2 of this reportCopyright 2011All Rights Reserved

Sample Patient
04-Dec-15
Welcome and Introduction
On the following pages you will find personalized nutrition and fitness recommendations based on your genetic test results. This report is based on the analysis of your DNA sample and personal information you provided such as your height, weight, and gender. This approach to weight management is based on the most advanced science available. The goal is to help you develop an approach to nutrition and fitness based on your own unique genetic blueprint. Some of the topics covered in your report include:
What your DNA can tell you about the right balance of macronutrients for you
What your test results suggest about your fitness needs
What your results suggest about your health related behavioral tendencies
Now that you know more about what your DNA reveals about your nutritional and fitness needs, we can provide you with the support you need to make the most of this information. You have embarked on a journey to a healthier life and we are honored to be your partner on this journey. Thank you for choosing us as your weight management partner.
Best Regards,
The Genetic Weight Management Team
Hello Sample Patient,
Important: Please consult your physician before beginning any nutrition or fitness program. The information contained in this report is for weight management purposes only. It is not intended to prevent, diagnose or treat any medical condition and should not replace the advice of your physician. If you experience pain or physical difficulties while eating a reduced calorie diet or during exercise, please stop and contact your physician immediately.
If you are currently being treated for any illness or medical condition, taking prescription medication, or following a doctor recommended diet, it is essential for you to consult with your physician before starting this program and to follow up with your physician on a regular basis after you start losing weight. Changes to your nutritional program may create physical changes that should be monitored by a physician. If you are on prescription medication, losing weight may require a change in your treatment program or medication dosage. After review by your physician, any changes made by your physician to this program should be followed. This test has not been cleared or approved by the U.S. Food and Drug Administration.
Page 2
Version 6.1See disclaimers on page 2 of this reportCopyright 2011All Rights Reserved

Sample Patient
04-Dec-15
Welcome and Introduction
Sample PatientWelcome
Here’s what’s included in your report:
Section One - Overview of Your Genetic Test Results
Section One gives you an overview of your genetic results. It also gives you a quick snapshot of what these results can tell you about your nutrition and fitness needs.
Section Two - A Nutrition Plan Based on Your Genetics
Section Two explain in greater detail what your genetic results reveal about your nutritional needs. This section also gives some practical ways to optimize your nutritional plan.
Section Three - A Fitness Program Based on Your Genetics
The ideal approach to fitness varies from one individual to the next. Section Three explains what your DNA can tell you about the best activities for you, and how much activity you need for optimal health.
Section Four - Genetics and Healthy Behavior
Your genes help determine how easy or difficult you may find following a program of healthy eating and daily activity. This section tells you what your DNA says about your behavioral tendencies related to health.
Page 3
Version 6.1See disclaimers on page 2 of this reportCopyright 2011All Rights Reserved

Sample Patient
04-Dec-15
Your Results | Section One
The two charts on the following page show a summary of an ideal nutrition and fitness program as revealed by your DNA. In the sections of this report that follow, you will find a more detailed explanation of what we recommend based on the analysis we performed on the DNA sample you provided.
Test Results at a Glance
Section 1: Your Results
Understanding Your Genotype
Your Recommended Nutrition and Fitness Programs
Here are your individual results for the variations of the genes we tested. In following sections of this report you will find out more about what each of these variations means individually, as well as how they may interact to provide you with practical guidelines for optimal nutrition and fitness.
Name: Sample Patient
Report Date: 12/4/2015
Gender: FEMALE
DOB: 18-Mar-86 Height: 66 inches
Weight: 210 pounds
Nutrition and Fitness Genetic Profile Report
Report:
W. Douglas Scheer, PhD
Laboratory CLIA Number:
19D2032754
CLIA Laboratory Director:
ID Number: SP_4036
Order Number: 13869
Sample Source: Buccal Swab
Gene Variant Your Result
ACE D>I (G>A) AG
ACTN3 C>T TC
ADRB2 Gln27Glu (C>G) CC
ADRB2 Arg16Gly (A>G) AG
ADRB3 Trp64Arg (T>C) TC
APOA2 -265T>C TT
DRD2 C>T CC
eNOS T>C TT
FABP2 Ala54Thr (G>A) GA
FTO T>A AA
GIPR C>T CT
GLUT2 -265T>C GG
IL6 -174G>C GG
IRS1 C>T CC
LEPR C>T TT
LIPC -514C>T CC
LIPC -250G>A GG
MTHFR C>T CT
PPARG2 Pro12Ala (C>G) CC
TAS2R38 T>C TC
TCF7L2 A>G AG
TNF -308G>A GG
Page 4
Version 6.1See disclaimers on page 2 of this reportCopyright 2011All Rights Reserved

Sample Patient
04-Dec-15
Your Results | Section One
Your Results: Your Fitness Program Recommendations
Your Results: Your Recommended Macronutrient Ratios
Fat Optimized Program
15-20 MET-hours/week from activities with MET values above 6.0
This chart shows an appropriate proportion of fats, carbohydrates and proteins based on your genetic test results. Section 2 gives details of a nutrition program based on your DNA.
This is your recommended physical activity level based on your genotype. Please see Section Three for more information on designing a genetically appropriate exercise program.
Your Current Weight Management Status
Your Recommended Nutrition and Fitness ProgramsThe following nutrition and fitness guidelines are appropriate for you based on analysis of your DNA. A more detailed explanation of each is found in Section 2 and Section 3 of this report.
Source: U.S. Department of Agriculture and U.S. Department of Health and Human Services. Dietary Guidelines for Americans, 2010. 7th Edition, Washington, DC: U.S. Government Printing Office, December 2010.
55% of total calories20% of total calories
25% of total calories
Fats
Proteins
CarbohydratesUSDA
Recommended Macronutrient Proportions for Typical American Diets*
Carbohydrates
45-65%
Proteins
10 - 35%
Fat
20 - 35%
Low Intensity Activities ------------------ Moderate Intensity ------------------ Maximum Intensity Activities
15-20 MET-hours/week from activities with MET values above 6.0
1 MET<--------------------------------------- Exercise Intensity --------------------------------> 12 METs
Page 5
Version 6.1See disclaimers on page 2 of this reportCopyright 2011All Rights Reserved

Sample Patient
04-Dec-15
Your Results | Section One
Your Current BMI is: 36.90BMI is not a direct measure of body fat, and should be interpreted within the context of gender, age, and level of muscularity. For example, given the same BMI, women will tend to have more body fat than men. Similarly, for a given BMI older people will tend to have more body fat than younger people. Individuals who are very muscular such as trained athletes, will tend to have less body fat for a given BMI. The World Health Organization recommends that adults maintain a BMI between 18.5 and 25.0.
There are certain indicators, such as body mass index (BMI), which may be helpful in assessing your overall fitness level. These numbers need to be interpreted carefully because they are affected by many variables, such as bone structure and muscle mass. Nutritional and fitness indicators should be discussed with your personal health care provider before using them as the basis for any nutritional or fitness program.
Your Current Weight Management Status
* BMI guidelines are based on the recommendations of the World Health Organization (Global Database on Body Mass Index. WHO. 2006. http://www.who.int/bmi/index. Retrieved July 27, 2012.)
Below Recommended Range
Within Recommended Range
Above Recommended Range
below 18.5 %
18.5 - 25%
above 25%
Recommendation BMI
Page 6
Version 6.1See disclaimers on page 2 of this reportCopyright 2011All Rights Reserved
Sample Patient
04-Dec-15
Your Genetic Results | Section One
Your DNA carries the instructions for the structure and function of every cell in your body. DNA plays a major role in all life processes. It is responsible for a great deal of what makes you who you are, including how you respond to different foods and physical activities. There is a large body of interesting information about DNA available at libraries, book stores, and on the internet. This section of your report gives a very brief overview some basic concepts that will help you understand your report. If you are interested in knowing more, a search of available resources will quickly turn up a great deal of additional information. The end of your report also contains an extensive list of references.
DNA
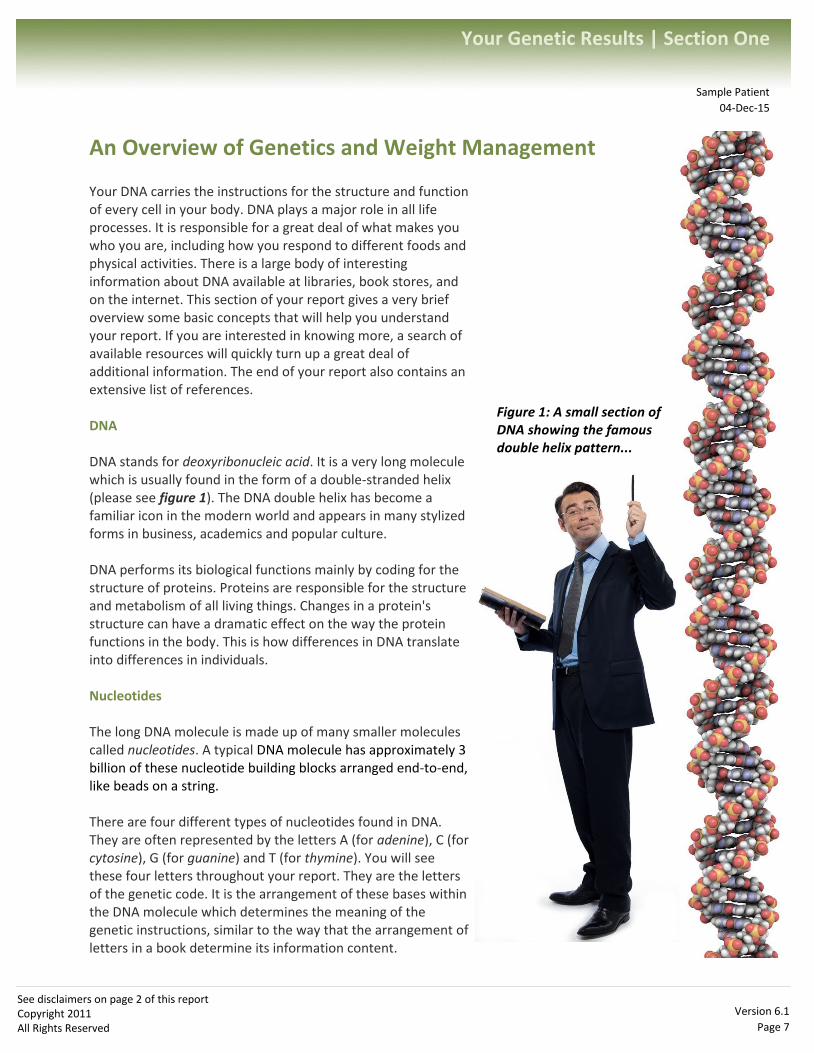
DNA stands for deoxyribonucleic acid. It is a very long molecule which is usually found in the form of a double-stranded helix (please see figure 1). The DNA double helix has become a familiar icon in the modern world and appears in many stylized forms in business, academics and popular culture.
DNA performs its biological functions mainly by coding for the structure of proteins. Proteins are responsible for the structure and metabolism of all living things. Changes in a protein's structure can have a dramatic effect on the way the protein functions in the body. This is how differences in DNA translate into differences in individuals.
Nucleotides
The long DNA molecule is made up of many smaller molecules called nucleotides. A typical DNA molecule has approximately 3 billion of these nucleotide building blocks arranged end-to-end, like beads on a string.
There are four different types of nucleotides found in DNA. They are often represented by the letters A (for adenine), C (for cytosine), G (for guanine) and T (for thymine). You will see these four letters throughout your report. They are the letters of the genetic code. It is the arrangement of these bases within the DNA molecule which determines the meaning of the genetic instructions, similar to the way that the arrangement of letters in a book determine its information content.
An Overview of Genetics and Weight Management
Figure 1: A small section of DNA showing the famous double helix pattern...
Page 7
Version 6.1See disclaimers on page 2 of this reportCopyright 2011All Rights Reserved

Sample Patient
04-Dec-15
Your Genetic Results | Section One
A, C, G, or T?In several locations throughout your report you will see the letters A, C, G, and T. These letters stand for the four different nucleotide bases of the genetic code: A for adenine, C for cytosine, G for guanine, and T for thymine. You don't need to remember the names or chemical structures. You can simply think of A, C, G an T as the four letters that make up the genetic alphabet. Your results are determined by which of these nucleotides you have for each SNP tested.
A = Adenine C = Cytosine
G = Guanine T = Thymine
Genes
A section of DNA which codes for a particular protein is called a gene. Genes are also the molecular basis of heredity because they are passed from parents to offspring. Generally, humans have two copies of each gene, one inherited from each parent. The study of genes and heredity is the science of genetics.
Within each cell, genes are organized into packages called chromosomes. For the purpose of understanding your results, it isn't important exactly which chromosome a gene is on, however the term chromosome comes up very often in genetics. Normally, humans have 23 pairs of chromosomes. One member of each pair is inherited from the mother and one is inherited from the father.
SNPs
Different forms of the same gene are referred to as variantsor alleles of that gene. In many cases, the change of a single nucleotide can alter the functioning of a gene and have significant consequences. A change involving one nucleotide is called a single nucleotide polymorphism, or SNP. A simple analogy might be changing the "b" in "bat" to a "c" and thereby changing the meaning of the word.
Scientists have identified certain SNPs which have a significant impact on weight management. These important SNPs are the foundation of this report. Because you have two copies of each gene tested, your result for each SNP consists of two letters (standing for their respective nucleotide). These two letters represent your genotype for that SNP.
Some SNPs have an effect on the way your body processes macronutrients such as fats and carbohydrates. Others affect how your body responds to exercise. Some SNPs affect your response to both diet and exercise.
Page 8
Version 6.1See disclaimers on page 2 of this reportCopyright 2011All Rights Reserved

Sample Patient
04-Dec-15
Nutrition and You | Section Two
These are appropriate levels of carbohydrates, fats and proteins based on the results of your genetic test.
Individuals express great genetic variability in the way they process fats, carbohydrates and proteins. The proportion of these macronutrients in your daily food intake plays a key role in maintaining healthy weight and optimal energy levels. Knowing your own genetic predispositions can help you choose the best balance of macronutrients to support your nutritional and fitness goals.
Proper dietary levels of fats, carbohydrates and proteins are all necessary for good health, so fad diets which severely restrict one or more of these macronutrient groups have many disadvantages. A better approach is to adopt the best diet for you based on your unique needs.
Section 2
Nutrition and You
Fats
Carbohydrates
According to your genotype:
Dietary carbohydrates are best known as a source of energy, however carbohydrates and their derivatives also play key roles in the immune system, blood clotting, development, and other vital functions. Your test results suggest that carbohydrates should make up about 55% of the calories in your diet.
Proteins are large biological molecules which perform a vast array of structural and metabolic roles within living organisms. Dietary proteins provide an energy source and amino acids for building new proteins. Your test results suggest that proteins should make up about 25% of the calories in your diet.
Dietary fats play many vital roles including: maintaining healthy skin and hair, insulating body organs against shock, maintaining body temperature, promoting healthy cell function, and serving as energy stores for the body. Your test results suggest that fats should make up about 20% of the calories in your diet.
55% Carbohydrates
25% Proteins
20% Fats
Your genetic test indicates that a Fat Controlled balance of nutrients will provide the optimal health and weight management benefits.
55 %
A Fat Controlled Nutritional Program is Most Suitable to Your Genetic Profile
Proteins
25 %20 %
Page 9
Version 6.1See disclaimers on page 2 of this reportCopyright 2011All Rights Reserved

Sample Patient
Nutrition and You | Section Two
04-Dec-15
Your Genetic Results Related to NutritionIn this section you will find your results for the genetic markers which help determine how you tend to process macronutrients (carbohydrates, fats, and proteins). You will see your result for each marker, along with a brief description of some of the effects associated with your particular genotype. If you want more information on one or more of these SNPs, you can refer to the references at the end of this report, as well as information available online or at your library.
Gene
Brief Description of Effects
SNP Your
Genotype
Please keep in mind that the combination of all of these gene variations is used to make your nutrional recommendations found in this report. The effect of any one gene must be understood within the context of many complex interactions.
FTO AArs9939609 Some variants of the FTO gene are widely recognized as being associated with a risk for being overweight. This gene affects the hypothalamus region of the brain, which regulates appetite, energy intake, and satiety. It also affects the rate at which fat cells accumulate. Depending on other genetic and environmental factors, individuals with the AA genotype may tend to have an increased BMI and a higher body fat percentage. This genotype may benefit from a relative decrease in fat intake as part of a weight management program.
APOA2 TTrs5082 The APOA2 gene encodes the lipoprotein apoA-II, the second most abundant protein in HDL. HDL, also known as "good" cholesterol, plays an important role in the composition of fat molecules found in the blood and tissues of the body. When expression of this gene is lowered, the result is increased triglyceride production and storage as body fat. Individuals with this genotype (TT) have normal expression of this gene. Depending on other genetic factors, they tend to have normal HDL levels and respond well to both physical activity and caloric reduction programs for weight loss.
TCF7L2 AGrs4132670 The TCF7L2 gene is a key regulator of glucose metabolism in the liver and also affects the metabolism of dietary fat. Increased expression of this gene tends to decrease production of insulin. Individuals with the AG genotype have an elevated expression of this gene. Depending on other genetic and environmental factors, clinical studies have demonstrated that these individuals may experience improved glycemic control with a diet which includes lower levels of fat.
Page 10
Version 6.1See disclaimers on page 2 of this reportCopyright 2011All Rights Reserved

Sample Patient
Nutrition and You | Section Two
04-Dec-15
IRS1 CCrs2943641 The IRS1 gene codes for an important mediator protein in the insulin signaling pathway and is important in generating energy from dietary carbohydrates. Other variants of the IRS1 gene may contribute to blood glucose remaining in circulation longer and ending up stored as fat. Clinical studies have demonstrated, however, that this genotype (CC) improves the processing of dietary carbohydrates and may, depending upon other genetic factors, allow for relatively higher levels of carbohydrate intake without negative effects.
GIPR CTrs2287019 GIPR is the acronym for the glucose-dependent insulinotropic polypeptide receptorgene. GIPR encodes for a protein which plays an important role in the release of insulin after ingestion of glucose and fat. Clinical studies have demonstrated that, depending on other factors, individuals with the CT genotype may benefit from limiting the amount of fats and carbohydrates in their diets.
LIPC GGrs2070895 LIPC, the hepatic lipase gene, is involved in the hydrolysis of triglycerides and phospholipids in LDL and HDL particles. Individuals with this genotype (GG) tend to have normal blood fat levels.
PPARG2 CCrs1801282 This gene is involved in fat and carbohydrate metabolism, as well as in fat cell formation. Individuals with this genotype tend to have an increased risk of being overweight. Individuals with this genotype (CC) may also have a higher sensitivity to the amount and quality of dietary fat in their diet.
IL6 GGrs1800795 This gene plays a role in glucose and lipid metabolism. Individuals with this genotype (GG) tend to have higher plasma IL6 levels and higher insulin levels, which are associated with higher levels of body fat. These individuals may benefit from lowering the level of saturated fats in their diet.
TNF GGrs1800629 This gene is important in regulating the body's inflammatory response. An elevated level of TNF alpha is associated with in an increase in the systemic inflammatory response, which has been demonstrated in studies to contribute to excess weight gain. Individuals with this genotype (GG) have the normal level of expression of this gene.
LIPC CCrs1800588 The hepatic lipase gene (LIPC) catalyzes the hydrolysis of triglycerides and phospholipids in LDL and HDL particles. Individuals with this genotype (CC) tend to have normal blood fat levels.
FABP2 GArs1799883 The FABP2 gene is involved in absorbing dietary fats from the digestive tract. Clinical studies have demonstrated that individuals with this genotype (GA) tend to show an increased intestinal absorption of dietary fat. This, depending on other factors, can lead to a greater risk for excess weight gain.
ADRB2 CCrs1042714 This gene is important in mobilizing stored body fat. Clinical study data has demonstrated that women who have this genotype (CC) tend to have a normal risk of gaining excessive weight depending on other genetic and environmental factors.
Page 11
Version 6.1See disclaimers on page 2 of this reportCopyright 2011All Rights Reserved

Sample Patient
04-Dec-15
Diet and Nutrition | Section Two
If You Wish Decrease Body Fat
1285
Daily MacronutrientTarget in Calories and Grams
Proteins FatsCarbohydrates
707 Calories 321 Calories 257 Calories
177 grams 80 grams 29 grams
Grains , Starches and Legumes Vegetables Fruit
Serving Units Per Day by Food Group
6 35 5 12
Meats and Meat Substitutes Milk
Oils and High Fat Foods
Your activity level has a very significant effect on the number of calories you can consume as part of a weight reduction program. Please use the calorie and gram recommendations which correspond most closely to your level of activity.
Activity Level 1: Sedentary
Serving units for common foods are defined onpages 15 and 16 of this report. Please keep in mind that the serving units used in this system are not necessarily equivalent to the serving or portion sizes you may already be familiar with. For example, as serving unit of meat, poulty, fish, or cheese is one ounce. This system allows for more exact recommendations for foods that have a high density of macronutrients such as fat and protein.
This section is your personalized guide to losing excess fat at a healthy rate of one to one and a half pounds per week using a combination of carbohydrates, fats, and proteins appropriate for your genotype.
Exercise Level 5
Exercise Level 4
Exercise Level 3
Exercise Level 2
Exercise Level 1
These guideline apply if you have a sedentary lifestyle and engage in little or no physical exercise.
Your genetically appropriate macronutrient proportions are expressed in calories. To make these proportions useful in everyday life, they need to be expressed in easily measured units such as grams.
Keep in mind that carbohydrates, fats and proteins have a different caloric content per gram, so their ratios will appear different when expressed as grams than they do when expressed as calories. Carbs and proteins both have approximately 4 calories per gram, while fats yield about 9 calories per gram.
2110
1803
1496
1342
Exercise Level Daily Calorie Intake
<>
Page 12
Version 6.1See disclaimers on page 2 of this reportCopyright 2011All Rights Reserved

Sample Patient
04-Dec-15
Diet and Nutrition | Section Two
1285
Daily MacronutrientTarget in Calories and Grams
Proteins FatsCarbohydrates
738 Calories 336 Calories 268 Calories
185 grams 84 grams 30 grams
Grains , Starches and Legumes Vegetables Fruit
Serving Units Per Day by Food Group
6 35 6 12
Meats and Meat Substitutes Milk
Oils and High Fat Foods
Activity Level 2: Lightly Active
Exercise Level 5
Exercise Level 4
Exercise Level 3
Exercise Level 1
These guideline apply if you engage in moderate to vigorous exercise 1-2 times per week.
2110
1803
1496
Exercise Level Daily Calorie Intake
<>
1285
Daily MacronutrientTarget in Calories and Grams
Proteins FatsCarbohydrates
823 Calories 374 Calories 299 Calories
206 grams 94 grams 33 grams
Grains , Starches and Legumes Vegetables Fruit
Serving Units Per Day by Food Group
7 35 6 22
Meats and Meat Substitutes Milk
Oils and High Fat Foods
Activity Level 3: Moderately Active
Exercise Level 5
Exercise Level 4
Exercise Level 3
Exercise Level 2
Exercise Level 1
These guidelines apply if you exercise 3 - 5 times per week at a moderate to vigorous intensity.
2110
1803
1496
1342
Exercise Level Daily Calorie Intake
<>
1285
Daily MacronutrientTarget in Calories and Grams
Proteins FatsCarbohydrates
992 Calories 451 Calories 361 Calories
248 grams 113 grams 40 grams
Grains , Starches and Legumes Vegetables Fruit
Serving Units Per Day by Food Group
10 35 8 22
Meats and Meat Substitutes Milk
Oils and High Fat Foods
Activity Level 4: Very Active
Exercise Level 5
Exercise Level 4
Exercise Level 3
Exercise Level 2
Exercise Level 1
Moderate to vigorous exercise 6-7 days per week.
2110
1803
1496
1342
Exercise Level Daily Calorie Intake
<>
Activity Level 5: Extra Active
Exercise Level 2 1342
Page 13
Version 6.1See disclaimers on page 2 of this reportCopyright 2011All Rights Reserved

Sample Patient
04-Dec-15
Diet and Nutrition | Section Two
1285
Daily MacronutrientTarget in Calories and Grams
Proteins FatsCarbohydrates
1161 Calories 528 Calories 422 Calories
290 grams 132 grams 47 grams
Grains , Starches and Legumes Vegetables Fruit
Serving Units Per Day by Food Group
13 35 10 22
Meats and Meat Substitutes Milk
Oils and High Fat Foods
Activity Level 5: Extra Active
Exercise Level 5
Exercise Level 4
Exercise Level 3
Exercise Level 2
Exercise Level 1
Very heavy daily exercise, such as vigorous exercise twice per day or a job demanding a lot of physical activity.
2110
1803
1496
1342
Exercise Level Daily Calorie Intake
<>
Page 14
Version 6.1See disclaimers on page 2 of this reportCopyright 2011All Rights Reserved
Sample Patient
04-Dec-15
Nutrition and You | Section Two
Calories
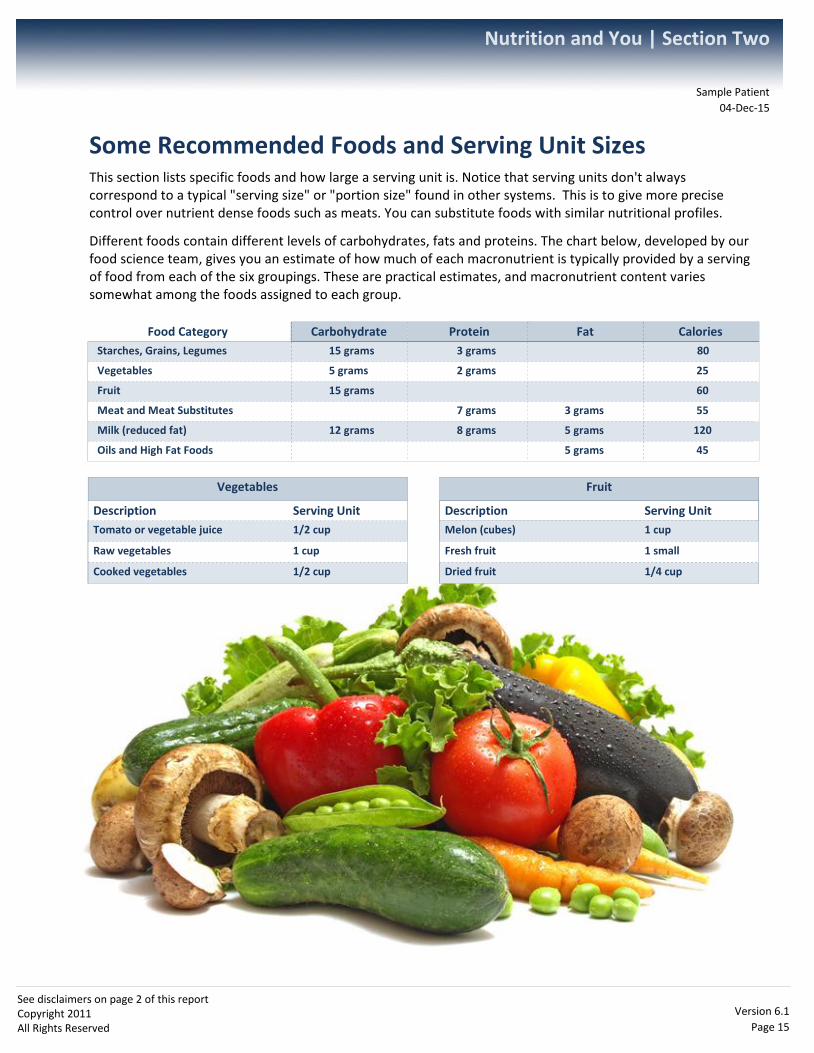
Some Recommended Foods and Serving Unit SizesThis section lists specific foods and how large a serving unit is. Notice that serving units don't always correspond to a typical "serving size" or "portion size" found in other systems. This is to give more precise control over nutrient dense foods such as meats. You can substitute foods with similar nutritional profiles.
Different foods contain different levels of carbohydrates, fats and proteins. The chart below, developed by our food science team, gives you an estimate of how much of each macronutrient is typically provided by a serving of food from each of the six groupings. These are practical estimates, and macronutrient content varies somewhat among the foods assigned to each group.
Starches, Grains, Legumes
Vegetables
Fruit
Protein FatCarbohydrate
Meat and Meat Substitutes
Milk (reduced fat)
Oils and High Fat Foods
Food Category
15 grams
5 grams
15 grams
12 grams
3 grams
2 grams
7 grams
8 grams 5 grams
3 grams
5 grams
80
25
60
55
120
45
Vegetables
Description Serving Unit
Tomato or vegetable juice 1/2 cup
Raw vegetables 1 cup
Cooked vegetables 1/2 cup
Fruit
Description Serving Unit
Melon (cubes) 1 cup
Fresh fruit 1 small
Dried fruit 1/4 cup
Page 15
Version 6.1See disclaimers on page 2 of this reportCopyright 2011All Rights Reserved

Sample Patient
04-Dec-15
Nutrition and You | Section Two
Meats and Meat Substitutes
Description Serving Unit
Tofu 4 oz (1/2 cup)
Peanut butter 1.5 Tbsp
Meat, poultry, fish 1 oz
Egg 1 each
Cottage cheese 1/4 cup
Beans, lentils (add one starch) 1/2 cup
Cheese 1 oz
Starches, Grains, Legumes
Description Serving Unit
Tortilla (whole wheat) 1 six inch
Sweet potato 1/3 cup
Squash, winter 1 cup
Rice, brown varieties 1/2 cup (cooked)
Popcorn, plain 3 cups
Whole Wheat Pasta 1/2 cup (cooked)
Dry flour or grains 3 Tbsp (uncooked)
Dry cereals, unsweetened 1/2 cup
Cooked cereals 1/2 cup (cooked)
Bread, whole wheat slice (1 oz)
Beans, peas, lentils 1/2 cup (cooked)
Milk
Description Serving Unit
Yogurt, plain 1 cup
Yogurt, Greek 2/3 cup
Milk, Reduced Fat 1 cup
Oils and High Fat Foods
Description Serving Unit
Oil-based salad dressing 1 Tbsp
Oil (grape seed, olive) 1 tsp
Nuts 10 each
Mayonnaise 1 tsp
Cream cheese 1 Tbsp
Butter or margarine 1 tsp
Page 16
Version 6.1See disclaimers on page 2 of this reportCopyright 2011All Rights Reserved

Sample Patient
04-Dec-15
Nutrition and You | Section Two
Maintaining An Ideal Weight
Small
Medium
Large
1064
1118
calories
calories
1173 calories
Approximate MacronutrientTarget in Calories (Cal) and Grams (gr)
Maintenance Calories
585 Cal 266 Cal 213 Cal146 gr 66 gr 24 gr
Proteins FatsCarbohydrates
615 Cal 280 Cal 224 Cal154 gr 70 gr 25 gr
645 Cal 293 Cal 235 Cal161 gr 73 gr 26 gr
Starches, Grains, Legumes
Vegetables
Fruit
Medium Frame Large FrameSmall Frame
3 4
3 3 3
5 5 5
4
4 5 5
1 1 1
2 2 2
Meat and Meat Substitutes
Milk
Oils and High Fat Foods
When calculating your daily calorie needs, frame size and activity level are both important. Individuals of the same height and gender may differ substantially in the mass of their bones and muscles. If you're not sure what your frame size is, your health care provider is the best source of guidance. Also, please be sure to use the guidelines which most closely match your current level of activity. If your activity level changes over time, then your calorie and serving levels should be adjusted appropriately.
Food Category
Your Frame Size
Sedentary
Lightly Active
Daily CalorieIntake
Daily Calorie Expenditure
Your genetically appropriate macronutrient levels are calculated in calories. To be useful in selecting the right foods and serving sizes, the calories need to be expressed as grams. To convert your calorie allowance to actual grams for each macronutrient, simply divide the number of calories by the calories/gram of that macronutrient. Carbohydrates and proteins have approximately 4 calories per gram, whereas fats yield about 9 calories per gram. This means that your macronutrient proportions will appear different when expressed in grams rather than calories.
Consuming the right quantity and proportion of carbohydrates, fats and proteins each day contributes to maintaining optimal weight, good overall health and high energy levels. The recommendations in this section are based on your genetic results along with your other personal information such as height, weight, gender, and age.
Page 17
Version 6.1See disclaimers on page 2 of this reportCopyright 2011All Rights Reserved

Sample Patient
04-Dec-15
Nutrition and You | Section Two
Small
Medium
Large
1277
1342
calories
calories
1407 calories
Approximate MacronutrientTarget in Calories (Cal) and Grams (gr)
Maintenance Calories
702 Cal 319 Cal 255 Cal176 gr 80 gr 28 gr
Proteins FatsCarbohydrates
738 Cal 336 Cal 268 Cal185 gr 84 gr 30 gr
774 Cal 352 Cal 281 Cal193 gr 88 gr 31 gr
Your Frame Size
Lightly Active
Small
Medium
Large
1383
1454
calories
calories
1524 calories
Approximate MacronutrientTarget in Calories (Cal) and Grams (gr)
Maintenance Calories
761 Cal 346 Cal 277 Cal190 gr 86 gr 31 gr
Proteins FatsCarbohydrates
800 Cal 364 Cal 291 Cal200 gr 91 gr 32 gr
838 Cal 381 Cal 305 Cal210 gr 95 gr 34 gr
Your Frame Size
Moderately Active
Starches, Grains, Legumes
Vegetables
Fruit
Medium Frame Large FrameSmall Frame
5 6
3 3 3
5 5 5
7
5 6 6
1 1 1
2 2 2
Meat and Meat Substitutes
Milk
Oils and High Fat Foods
Food Category
Starches, Grains, Legumes
Vegetables
Fruit
Medium Frame Large FrameSmall Frame
6 7
3 3 3
5 5 5
8
6 6 7
1 2 2
2 2 2
Meat and Meat Substitutes
Milk
Oils and High Fat Foods
Food Category
Page 18
Version 6.1See disclaimers on page 2 of this reportCopyright 2011All Rights Reserved

Sample Patient
04-Dec-15
Nutrition and You | Section Two
Small
Medium
Large
1809
1901
calories
calories
1993 calories
Approximate MacronutrientTarget in Calories (Cal) and Grams (gr)
Maintenance Calories
995 Cal 452 Cal 362 Cal249 gr 113 gr 40 gr
Proteins FatsCarbohydrates
1046 Cal 475 Cal 380 Cal261 gr 119 gr 42 gr
1096 Cal 498 Cal 399 Cal274 gr 125 gr 44 gr
Your Frame Size
Extra Active
Starches, Grains, Legumes
Vegetables
Fruit
Medium Frame Large FrameSmall Frame
10 11
3 3 3
5 5 5
12
8 8 9
2 2 2
2 2 2
Meat and Meat Substitutes
Milk
Oils and High Fat Foods
Food Category
Small
Medium
Large
1596
1677
calories
calories
1759 calories
Approximate MacronutrientTarget in Calories (Cal) and Grams (gr)
Maintenance Calories
878 Cal 399 Cal 319 Cal219 gr 100 gr 35 gr
Proteins FatsCarbohydrates
922 Cal 419 Cal 335 Cal231 gr 105 gr 37 gr
967 Cal 440 Cal 352 Cal242 gr 110 gr 39 gr
Your Frame Size
Very Active
Starches, Grains, Legumes
Vegetables
Fruit
Medium Frame Large FrameSmall Frame
8 9
3 3 3
5 5 5
10
7 7 8
2 2 2
2 2 2
Meat and Meat Substitutes
Milk
Oils and High Fat Foods
Food Category
Page 19
Version 6.1See disclaimers on page 2 of this reportCopyright 2011All Rights Reserved

Sample Patient
04-Dec-15
Nutrition and You | Section Two
Your Essential NutrientsNutrients are the components in foods that are vital to survival and growth. Macronutrients provide most of the energy and raw materials for an organism to function. Macronutrients include carbohydrates, fats, proteins, and macrominerals such as calcium which are required in relatively large quantities.
Micronutrients are nutrients required in smaller quantities to support a wide range of physiological functions. Micronutrients include vitamins, which are organic compounds required in tiny amounts by an organism. Micronutrients also include microminerals such as zinc, which are required in quantities less than 100 milligrams per day.
Nutrient Main FunctionYour Recommended
Daily IntakeBest Sources
Vitamin A
Required for normal vision, gene expression, and immune function.
5,000 IU
Sweet potato, carrots, spinach, dairy products, liver and fish oil
Vitamin B3
Assist in digestion and conversion of food into energy, aids production of cholesterol.
20 mg
Meat, fish, poultry, and whole grain breads
Vitamin B6
Assists in metabolizing proteins and sugar, coenzyme in amino acid metabolism.
2 mg
Poultry, pork, liver, eggs, beans, and sunflower seeds
Vitamin B12
Important in production of red blood cells, coenzyme in nucleic acid metabolism.
6 μg
Liver, red meat, poultry, fish, and eggs
Page 20
Version 6.1See disclaimers on page 2 of this reportCopyright 2011All Rights Reserved

Sample Patient
04-Dec-15
Nutrition and You | Section Two
Vitamin C
Antioxidant that protects cells against damage, boosts the immune system, forms collagen.
60 mg
Red or green peppers, citrus fruits, tomatoes, Brussels sprouts, strawberries, potatoes
Vitamin D
Crucial in metabolizing calcium for healthy bones.
400 IU
Milk, fish oils, and fatty fish such a tuna and salmon
Vitamin EAntioxidant that protects cells against damage.
30 IU
Corn, olives, asparagus, vegetable oils, green leafy vegetables
Vitamin KImportant in blood clotting and bone health.
80 μg
Green vegetables, cabbage, plant oils and Brussels sprouts
Calcium
Essential for bone growth, blood clotting, muscle contraction, and nerve transmission.
1000 mg
Milk, yogurt, hard cheeses, spinach, fortified cereals
FolateCoenzyme in the metabolism of nucleic and amino acids.
400 μgDark leafy vegetables, citrus fruit, avocados, whole grains, liver
Zinc
Supports immunity, nerve function, and the regulation of gene expression.
15 mg
Red meats, some seafood
Cholesterol
Necessary nerve function, sex hormone production, and the production of vitamin D.
300 mg
Eggs, beef, chicken, and shellfish.
Omega-3Lowers inflammation, controls clotting, and builds cell membranes.
~500 mgAnchovies, salmon, trout, tuna, oysters, walnuts, flaxseed oil
Page 21
Version 6.1See disclaimers on page 2 of this reportCopyright 2011All Rights Reserved

Sample Patient
04-Dec-15
Nutrition and You | Section Two
Sufficient water intake can have a significant impact on overall health and fitness. Adequate hydration contributes to a more efficient metabolism and removal of cellular waste products. Many people notice a marked improvement in their energy level when they increase their fluid intake to optimal levels. Adequate water intake can also assist in complying with a nutrition program by reducing feelings of hunger. Some people find that simply drinking recommended amounts of water makes complying with the rest of their nutrition and fitness plan much easier and more comfortable.
A well accepted minimum guideline is to drink in ounces an amount equal to approximately half your weight in pounds, up to 100 ounces of water, every day. For example, a 180 pound person would drink 90 ounces of water, or approximately twelve eight ounce glasses. This may seem like a lot of water, but studies indicate this is the optimal quantity. The following chart indicates your recommended daily water intake based on the weight you reported at the time you submitted your profile information.
100 ounces per day
Your Results: Your Minimum Recommended Daily Water Intake
100 ounces per day based on your current weight of 215 pounds
Your daily water intake is based on your current weight. Your recommended intake can be calculated as half your weight in pounds converted to ounces, up to 100 ounces of water per day.
Your current reported weight in pounds
215.0
Your recommended minimum water intake in ounces
Your Recommended Daily Water Intake
Page 22
Version 6.1See disclaimers on page 2 of this reportCopyright 2011All Rights Reserved

Sample Patient
04-Dec-15
Nutrition and You | Section Two
Alcohol and YouSome studies suggest that daily consumption of moderate levels of alcohol may have positive health effects for many people. The positive effects of alcohol may include increased levels of good cholesterol (HDL) and reduced risk of heart disease, dementia, and gallstones. The USDA defines moderate consumption as no more than two drinks per day for men and no more than one drink per day for women. Experts agree any benefits of alcohol consumption come from consistent and moderate consumption; occasional heavy drinking is not beneficial.
From a weight management perspective, alcohol has the potential to add calories and negatively effect your ability to burn fat. Here are a few examples of what you may expect from some common drinks.
Light Beer
Regular Beer
Martini
Margarita
Daiquiri
Many studies indicate alcohol has negative health effects which may offset the positive effects mentioned above. For example, alcohol interferes with the absorption of folate and can increase the risk of certain types of cancer.
12 oz.
12 oz.
3 oz.
8 oz.
20 oz.
105
140
205
200
1120
6.0 grams
13.2 grams
0.3 grams
16.8 grams
42.0 grams
Type of Drink Serving Size Calories Carbohydrates
According to your genotype:
Your genetic test results are consistent with a need to control your intake of dietary fat as part of a successful weight management regimen. You may wish to keep in mind that alcoholic beverages may decrease the efficiency of your fat metabolism even further. Alcohol is converted to acetate in the liver, which slows the metabolism of fat through oxidation. A clinical study has demonstrated that the presence of this excess acetate may decrease your body's ability to oxidize fat by up to 73%!
Your genotype indicates that you may already be at a disadvantage when metabolizing dietary fat. Adding alcohol to the equation can be expected to further decrease your ability to handle fat. You may expect to improve your success in managing your weight by limiting (or eliminating) your intake of alcohol. This is especially true during times when you may be actively trying to reduce your levels of body fat.
Wine (red/white) 5 oz. 100 0.4 - 0 .8 grams
Page 23
Version 6.1See disclaimers on page 2 of this reportCopyright 2011All Rights Reserved

Sample Patient
04-Dec-15
Your Ideal Fitness Program | Section Three
In this section you will find your individual results for each of the activity and fitness related SNPs tested in your DNA sample. You will also find a brief description of some of the effects known to be associated with your genotype for each SNP. If you want a more in depth explanation of any of these markers you can refer to the list of resources found in the final section of the report.
Your Fitness Related Results
Section 3Exercise
Gene Brief Description of EffectsSNP Your
Genotype
Please keep in mind that single genes do not provide enough information to determine the best program for you. Your entire panel of test results is used to generate the physical fitness recommendations you will find in the next section of the report. An algorithm is used to integrate the effects of each individual marker and provide you with specific recommendations for your fitness program. The next sections of your report put this information to use in optimizing your activities and fitness program based on your genetic profile.
FTO Certain variants of the FTO gene are widely recognized as being associated with a risk for being overweight. Individuals with the AA genotype may tend to have an increased BMI and a higher body fat percentage. Depending on other factors, this effect may be reduced if the individual engages in higher levels of physical activity.
AArs9939609
ADRB3 ADRB3 is important in energy metabolism and in reducing abdominal and subcutaneous body fat. Depending on other genetic and environmental factors, women with this genotype (TC) may have increased difficulty in losing weight and may benefit from vigorous physical activity to support their weight loss efforts.
TCrs4994
ACE This genotype (AG) is associated with increased expression of the ACE gene. The ACE gene has been associated with abdominal adiposity. Individuals with this genotype may (depending on other genetic and environmental factors) obtain greater weight reduction by engaging in a program of high intensity physical activity. ACE is one of the most studied and thoroughly documented SNPs related to fitness and weight maintenance.
AGrs4343
Page 24
Version 6.1See disclaimers on page 2 of this reportCopyright 2011All Rights Reserved

Sample Patient
04-Dec-15
Your Ideal Fitness Program | Section Three
eNOS eNOS, the endothelial nitric oxide synthase gene, is the key promoter for the production of nitric oxide (NO). Nitric oxide plays a major role in regulating the vascular tone and facilitates vasodilation. Studies have shown that individuals with this genotype (TT) have an increased level of nitric oxide, which facilitates vasodilation and increased blood supply to muscles during exercise. These factors are associated with increased muscle performance and, depending on other factors, may increase performance in power sports such as weightlifting or sprinting.
TTrs2070744
ACTN3 ACTN3 is involved in the formation of the major component of the z line where actin filaments are cross-linked in fast-twitch muscle fibers. These muscle fibers are responsible for generating explosive, powerful contractions needed for activities such as sprinting and weightlifting. Depending upon other factors, individuals with this genotype (TC) are equally suited for strength-oriented and endurance-oriented activities. Depending on other genetic and environmental factors, these individuals may be more likely to perform well in sports requiring all-round performance where both strength and endurance play a role. These sports include football, handball, tennis or basketball.
TCrs1815739
ADRB2 This gene is important in mobilizing stored body fat. Individuals with this genotype (CC) are likely to respond to diet and physical activities to improve their weight efforts.
CCrs1042714
ADRB2 Data published from a multicenter family clinical trial have shown that individuals with this genotype (AG) may (depending on other genetic and environmental factors) tend to demonstrate greater reductions in BMI and body fat percent in response to endurance training.
AGrs1042713
Page 25
Version 6.1See disclaimers on page 2 of this reportCopyright 2011All Rights Reserved

Sample Patient
04-Dec-15
Your Ideal Fitness Program | Section Three
Your Ideal Exercise Program
Recommended for You: Vigorous Intensity Activities
Your genetic test results indicate that your body will respond best to higher intensity activities with a MET value above 6.0. Your ulimate goal should be to accumulate 15 - 20 MET-hours of these 6.0+ MET activities each week. The following sections will explain that you calculate MET-hours by simply multiplying the MET value of your activity by the duration in hours.
MET value x duration (in hours) = MET-hours
If you're just starting out, begin your fitness program with lower intensity activities for shorter
Your DNA plays a large role in determining the intensity of activity you need to maintain a healthy weight and good overall health. Some people require a more vigorous workout regimen. Others may require a less intensive program to get the same results. From a weight management perspective, some individuals may actually do better on a more moderate activity regimen than they would on a higher intensity program. This is partly because excessively demanding regimens are more difficult to sustain over the long term.
This section of your report focuses on two main issues. The first is what types of activity will work best for you. The second is how much time you will need to invest weekly to stay fit and healthy.
Always consult your physician or qualified healthcare provider before beginning a new fitness routine. If you experience any pain or difficulties during any new activity, stop immediately and contact your qualified healthcare provider. It is always better to begin a new fitness program gradually and add exercise intensity and duration gradually.
According to your genotype:
Page 26
Version 6.1See disclaimers on page 2 of this reportCopyright 2011All Rights Reserved

Sample Patient
04-Dec-15
Your Ideal Fitness Program | Section Three
The previous section listed some of the specific effects of your genotype for the exercise-related SNPs in your genetic test. Looking at these effects individually for each SNP may not give you much insight into how you should be exercising. To determine the net effect of all of these markers, we apply an algorithm that factors in the individual effects and their interactions. This algorithm indicates that you should engage in a vigorous (as opposed to low intensity or moderate) fitness program to achieve good weight management and fitness results.
Some individuals may prefer to design a program based on activities they already enjoy such as biking, running, or swimming. You may already have a fitness program you would like to adjust based on this additional knowledge about your genetics and your metabolism. Or you may wish to design a program from scratch. Either way, this section of your report shows you how to apply the results of your genetic test to building or refining your own fitness program. If you have a fitness trainer or coach, you may wish to share the information in this part of your report with them so that they can incorporate it into your program.
The MET SystemThe MET system allows you to easily design a custom fitness program based on your own unique metabolism. MET stands for “metabolic equivalent.” Many people are familiar with METs because they often appear on the display monitors of gym equipment as an indicator of exercise intensity. Many fitness experts recommend the MET system as a way to set goals and track progress.
Activity Intensity and METsMETs are a measure of the rate at which the body expends energy. One MET is the rate at which your body expends energy while sitting at rest. MET values are usually expressed as a multiple of 1 MET, so a value of 4.5 METs would indicate that an activity uses 4.5 times as many calories as resting. One advantage of the MET system is that it is designed to be independent of the proportions of the individual.
Accurate MET values are available for a wide variety of physical activities, so they are an excellent way to build a fitness program and track your progress. The Compendium of Physical Activities is a comprehensive catalog of MET intensities first published in 1993 and updated in 2000 and 2011. The Compendium is still
Build a Fitness Program Based On Your Unique Metabolism
Page 27
Version 6.1See disclaimers on page 2 of this reportCopyright 2011All Rights Reserved

Sample Patient
04-Dec-15
Your Ideal Fitness Program | Section Three
an ongoing project and the very latest information on MET values can be found at the website: https://sites.google.com/site/compendiumofphysicalactivities/.
Activity Duration and MET HoursA good way to set activity goals is to track MET-hours per week. To calculate MET hours, you multiply the MET value of the activity by the number of hours it is performed. MET-hours for various activities can be added up through the week and compared to a goal that is based on your current level of fitness and your genotype.
MET value x Duration (in hours) = MET-hours
For example: 7.0 METs x 2.5 Hours = 17.5 MET-hours
Resting(1 MET)
Walking(3 mph)
Stationary Bike(light effort)
Jogging(general)
RopeJumping
10 METs
8 METs
6 METs
4 METs
2 METs
0 METs
MET Value: MET values can be thought of as multiples of 1 MET (resting calorie output).
Page 28
Version 6.1See disclaimers on page 2 of this reportCopyright 2011All Rights Reserved

Sample Patient
04-Dec-15
Your Ideal Fitness Program | Section Three
Analysis of your genetic markers indicates that you will respond best to activities with a higher level of intensity. These activities will have a MET value above 6. Some common forms of exercise appropriate for your genotype are found in the following table. If an activity you are interested in does not appear in your table of recommended activities, you can usually locate its MET value online. There are many good resources available. Simply search on terms such as "MET value" and "exercise."
The Best Activities for Your Genotype
Keep in mind that published MET values are obtained statistically from a sample population. Many factors may influence the amount of energy (number of calories) a specific individual will use during a particular activity. The MET system is an excellent guide to the relative energy expenditure for a wide variety of exercises and activities. Precise energy expenditures will vary somewhat from one individual to another.
Activities Recommended for Your Genotype
MET ValuesBicycling
bicycling, 10-11.9 mph, leisure, slow, light effort 6.8
bicycling, 12-13.9 mph, leisure, moderate effort 8.0
bicycling, 14-15.9 mph, racing or leisure, fast, vigorous effort 10.0
MET ValuesConditioning
bicycling, stationary, general 7.0
rowing, stationary, 100 watts, moderate effort 7.0
circuit training with minimal rest, vigorous intensity 8.0
calisthenics (e.g., pushups, sit-ups, pull-ups) vigorous effort 8.0
rowing, stationary, 150 watts, vigorous effort 8.5
bicycling, stationary, RPM/Spin bike class 8.5
MET ValuesRunning
running, 6 mph (10 min/mile) 9.8
running, 8 mph (7.5 min/mile) 11.8
Page 29
Version 6.1See disclaimers on page 2 of this reportCopyright 2011All Rights Reserved

Sample Patient
04-Dec-15
Your Ideal Fitness Program | Section Three
MET ValuesSports
basketball, general 6.5
racquetball, general 7.0
soccer, casual, general 7.0
squash, general 7.3
rollerblading, in-line skating, 14.4 km/h (9.0 mph), recreational pace 7.5
hockey, field 7.8
boxing, sparring 7.8
tennis, singles 8.0
rollerblading, in-line skating, 17.7 km/h (11.0 mph), moderate pace, ex 9.8
soccer, competitive 10.0
MET ValuesWalking
climbing hills, no load 6.3
walking, 4.5 mph, level, firm surface, very, very brisk 7.0
climbing hills with 10 to 20 lb load 7.3
backpacking, hiking or organized walking with a daypack 7.8
climbing hills with 21 to 42 lb load 8.3
walking, 5.0 mph, level, firm surface 8.3
stair climbing, fast pace 8.8
walking, for exercise, 5.0 mph, with ski poles, Nordic walking, level, fast 9.5
walking, 5.0 mph, uphill, 3% grade 9.8
MET ValuesWater Activities
swimming, sidestroke, general 7.0
swimming laps, freestyle, fast, vigorous effort 9.8
swimming, treading water, fast, vigorous effort 9.8
swimming, breaststroke, general, training or competition 10.3
canoeing, rowing, kayaking, >6 mph, vigorous effort 12.5
MET ValuesWinter Activities
skiing, cross country, 4.0-4.9 mph (moderate speed and effort) 9.0
Page 30
Version 6.1See disclaimers on page 2 of this reportCopyright 2011All Rights Reserved

Sample Patient
04-Dec-15
Your Ideal Fitness Program | Section Three
You should respond well to a vigorous fitness program consisting of activities with a MET value above 6.0. Your ultimate goal should be to acheive 15-20 MET-hours of these activities per week. You should begin your program gradually and work your way gradually to higher levels of intensity and duration.
Starting Goals: 5-10 MET-hours/weekExamples:
5 MET-hours can be acheived by 15 minutes of brisk walking (3.5 METs) 6 days per week
10 MET-hours can be acheived by 30 minutes of brisk walking 6 times per week
Intermediate Goals: 10-15 MET-hours/weekExample:
15 MET-hours acheived by swimming laps at a fast pace (9.8 METs) for 30 minutes a day, 3 days per week
Ultimate Goals: 15-20 MET-hours/weekExample:
20 MET hours acheived with a Zumba style class (7.3 METs) for 45 minutes, 4 days per week
A Program of Vigorous Intensity Activities
Based on Your Genotype Your Goal Goal Should Be..
The previous section focused on specific exercises and activities which may be most effective for you based on your genetic profile. The amount of time you spend on your fitness activities is just as important as choosing the correct activity.
The MET system offers an easy way for you to measure the fitness value of your workouts using units referred to as MET-hours. All you need to know is the MET value of your activity and the duration of your workout.
The calendar week is a natural framework for establishing goals, organizing your fitness program, and tracking your progress. Your ultimate program should consist of exercise sessions that are at least 20 minutes in duration for maximum benefit.
MET Value x Duration (in hours) = MET-hours
According to your genotype:
Page 31
Version 6.1See disclaimers on page 2 of this reportCopyright 2011All Rights Reserved

Sample Patient
04-Dec-15
Your Ideal Fitness Program | Section Three
Your Competitive EdgeEarlier in this section we discussed fitness activities and schedules which might be expected to give you the greatest weight management benefits for your genotype. Aside from weight management, your genetic makeup also predisposes you to perform better at certain types of sports and activities than at others. For example, you may be a better sprinter than distance runner based upon your proportion of fast to slow twitch muscle fibers. Your genetic profile can give you insight into your competitive strengths and weaknesses from the perspective of performance.
Keep in mind that that genetic predispositions are substantially modified by training and practice. If there is a sport or activity you particularly enjoy, you will probably be more motivated to put the effort into the preparation needed to achieve high levels of performance. However, genetics can tell you which sports may come more naturally to you. It is also true that genetics plays a large role in determining which athletes will attain elite status in various sports.
According to your genotype:
Your genetic profile is consistent with a balanced proportion of fast and slow twitch muscle fibers. Slow twitch muscle fibers play an important role in endurance activities. They contain a large number of mitochondria, which are the chemical powerhouses of cells. Mitochondria require oxygen to supply energy to the cell, so they perform best under aerobic conditions where oxygen supply can keep up with energy demands. Fast twitch muscle fibers get a large proportion of their energy from processes that do not require oxygen (anaerobic metabolism). They can exert great force, but fatigue quickly and must be rested.
Individuals with a higher proportion of slow twitch muscle fibers will perform best at activities which require long periods of sustained, aerobic activity. Such activities include jogging, distance running, cycling, step aerobics, elliptical training, and rowing. Individuals with a higher proportion of fast twitch muscle fibers will tend to perform best at activities which emphasize shorter, more intense bursts of effort such as sprinting, or power lifting. With a good balance of both fiber types, you may find that you have competitive edge in situations which call for a good balance of both endurance and bursts of high intensity. For example, you might find that you can be very competitive in a long tennis match which requires both stamina and explosive bursts of energy.
Page 32
Version 6.1See disclaimers on page 2 of this reportCopyright 2011All Rights Reserved

Sample Patient
04-Dec-15
Your Ideal Fitness Program | Section Three
Resistance Training and YouMany studies have proven that significant health and fitness benefits are achieved by including resistance training as part of any physical activity program. Your genetic profile can help you design the best program for you. Benefits will include an increase in lean muscle mass, enhanced muscle tone, and an increase in resting metabolic rate. When properly planned and executed, resistance training contributes to a fit appearance and makes other physical activities easier. It also offsets the muscle loss which usually accompanies the aging process.
The ideal approach to resistance training varies with the ratio of fast to slow twitch muscle fibers. Individuals with predominantly fast twitch fibers can expect better results from using heavier loads for shorter periods of time. Fast twitch fibers generate more force, but also fatigue more quickly. Individuals with more slow twitch fibers will generally achieve better results by using lighter loads for longer periods. A balanced proportion of fiber types calls for a middle of the road approach with moderate loads and intervals.
According to your genotype:
Your genetic profile indicates that, because you may have a balanced ratio of slow and fast twitch muscle fibers, you may benefit most from an intermediate approach which equally challenges both types of muscle fibers. You may get the best results using moderate resistance loads, moderate exertion times, a moderate number of repetitions, and moderate resting time between sets. You may wish to use the following as a general guideline for your resistance training:
2 - 6 sets
8 - 15 repetitions per set
rest periods of approximately 60 seconds between sets
heart rate at around 80 percent during your resistance training
It is very important to begin any new resistance program with lighter loads and increase them gradually. The result will be a more successful program with a lower risk of injury.
Page 33
Version 6.1See disclaimers on page 2 of this reportCopyright 2011All Rights Reserved

Sample Patient
04-Dec-15
Genetics and Healthy Behavior| Section Four
Hunger and Satiety
The tendency to develop and maintain healthy eating habits varies greatly from person to person. Genetics plays an important role in these differences. The good news is that you can always take steps to maintain healthy eating behaviors, no matter what your genetic predispositions are. Knowing your genetic tendencies can help you choose the best strategies for you.
Some individuals experience much greater difficulty choosing healthy foods, while others have more trouble controlling the quantity they consume. Some people have challenges with both quality and quantity. Individual differences in eating behavior result from a complex interaction of factors including genetics, past experience, and the present environment. One example is the FTO gene, which influences the activity of an important hunger signaling hormone known as ghrelin.
According to your genotype:
Eating for Pleasure
FTO and Ghrelin
Your genetic profile is consistent with increased activity of the hunger-stimulating hormone known as ghrelin. Increased ghrelin activity generally causes an increase in appetite and a decrease in feelings of satiety when food is consumed. The result can be a tendency to eat more often, as well as to eat more at each meal. Increased ghrelin activity also makes you more likely to prefer energy dense foods, such as those high in fat and sugar. If you find that you must struggle to resist calorie rich foods such as desserts, genetics may be part of the equation.
Fortunately, there are strategies you can use to help offset these potentially negative effects. Increasing protein and fiber intake can increase feelings of fullness while taking longer to digest than foods high in fat and processed carbohydrates. Some foods, such as soups, non-starchy vegetables, and salads take more energy and time to process and may limit the effects of this genotype. Drinking water between meals can help reduce the desire to consume excess calories in the form of snacks, while increased water intake during meals can help increase a sense of fullness. It takes time after consuming a meal for the brain to get the message that you are full, so consider taking the time to eat slowly, chew thoroughly and occasionally put the fork down. Because individuals with your genotype may experience more difficulty with portion control and eating frequency, meal planning is especially important. Pre-planned meal programs with careful attention to portion control may be helpful.
Page 34
Version 6.1See disclaimers on page 2 of this reportCopyright 2011All Rights Reserved

Sample Patient
04-Dec-15
Genetics and Healthy Behavior| Section Four
Eating for Pleasure
Eating for pleasure, in the absence of hunger, can be a real problem for many of us. The brain has "reward centers" whose purpose is to encourage us to engage in behaviors with survival benefits. Sometimes, especially in our modern world, this same circuitry can have the opposite effect, causing us to behave in ways which are harmful to our health and wellbeing.
According to your genotype:
Neurotransmitters are chemicals which carry messages from one nerve cell to another. They also regulate the overall responsiveness of various brain systems to stimulation. The neurotransmitter dopamine plays a key role in determining which activities we find pleasurable. Scientists have long known that dopamine levels are often involved in behaviors which are pleasurable, but which can also have negative consequences. Such activities include alcohol consumption, drug abuse, and binge eating. Recent research has focused on genetic differences among individuals which affect the functioning of dopamine in the brain.
DRD2 and Dopamine
Dopamine receptors play a key role in the experience of pleasure, and individuals with fewer of these receptors may be more susceptible to using food as a source of pleasure. Your genotype for this DRD2 polymorphism of the D2 dopamine receptor (CC) has been correlated with normal dopamine receptor density in the brain.
Even though your test results indicate that your version of this important gene does not increase your difficulty in managing your diet, you may still find yourself wishing you could exercise more self control. This is because there are other genetic and environmental factors which can increase or decrease your ability to exercise discretion when it comes to eating right.
Willpower and good habits play a key role in establishing and maintaining a healthy lifestyle no matter what your genotype is. Willpower is the key to avoiding bad habits and adopting good ones. Like a muscle, the strength of willpower becomes stronger the more it is used. Over time, the power of habit supplements willpower, and good decisions get easier to make with each repetition.
Page 35
Version 6.1See disclaimers on page 2 of this reportCopyright 2011All Rights Reserved

Sample Patient
04-Dec-15
Genetics and Healthy Behavior| Section Four
Appetite and Energy Output Levels
Researchers have discovered that we have internal, biochemical regulatory systems which play a role in determining and stabilizing the amount of adipose tissue we tend to accumulate. Consider that consuming a mere 100 calories a day more than you burn would result in gaining 10 pounds every year. That's about the number of calories in a slice of bread. Generally, individuals don't experience such dramatic variances in their weight, even with no conscious effort to regulate calorie intake and output.
LEPR and Leptin
Some people seem to be able to eat all they want and not gain a single pound, while others count every calorie and still struggle to maintain a healthy weight. Physical activity levels explain part of this individual variance, but it's clear that there must be other factors in the equation.
According to your genotype:
Scientists have discovered that the hormone leptin plays a key role in regulating the amount of fat that an individual carries. Leptin accomplishes this by affecting functioning of a small but important region of the brain called the hypothalamus. The hypothalamus plays a large role in regulating both hunger and energy expenditure. The receptor for leptin, a protein named LEP-R, is coded by the LEPR gene. Variations in the LEPR gene have been associated with a variety of weight related issues.
Your genotype (TT) is consistant with average levels of difficulty maintaining a healthy weight. Keep in mind that this is one of many environmental and genetic factors which affect your weight management efforts. You may still expect to benefit from developing skills to utilize in challenging situations, maintaining proper hydration, fine-tuning macronutrient levels, and establishing a regular physical fitness program. Working with a physician or dietitian to fine tune your program may be helpful.
Because you have the favorable version of the LEPR gene, you may not have to work quite as hard to keep your weight at desirable levels. Once you have established the right physical fitness regimen and your diet contains the right proportion of carbs, fats, and proteins, you will be on your way to a lifetime of healthy weight management.
Page 36
Version 6.1See disclaimers on page 2 of this reportCopyright 2011All Rights Reserved

Sample Patient
04-Dec-15
Genetics and Healthy Behavior| Section Four
Taste and Food Preference
As researchers learn more about the physiological basis of decision making, they are discovering that genetics plays an important role. Research shows that genetic differences actually cause foods to taste different to different people. The TAS2R38 gene has been shown to affect an individual's perception that certain compounds in food have a bitter taste. As a result, it affects their ability to enjoy some healthy foods, such as cruciferous vegetables, while finding sweets particularly satisfying.
According to your genotype:
Researchers are not sure about the cause, but it seems to be related to the ability to taste the chemicals PROP and PTC and perceive them as unpleasant. Certain variants of the TAS2R38 also increase the number of taste buds responsible for detecting bitter compounds. Individuals with this added sensitivity to bitter compounds are often referred to as "supertasters."
Sugar Cravings
TAS2R38 and food preferences
Your genotype for the TAS2R38 gene (TC) is associated with an intermediate sensitivity to certain bitter compounds in some foods. Sensitivity to bitter compounds can lead to avoidance of cruciferous vegetables such as broccoli, cabbage and cauliflower. Your version of the TAS2R38 gene is also associated with a somewhat increased preference for sweet foods. Both of these tendencies might contribute to making less healthy food choices.
Search for fruit and vegetable choices that are both healthy and pleasing to your palate. There is a wide variety of low calorie, nutrient dense food in this category and, with so many to choose from, you should be able to put together a diet strategy which is both healthful and sustainable in the long term. You may find that it is helpful to keep a log of fruits and vegetables that you enjoy.
If you find you have tendency to overindulge in sweets, you may want to make them less readily available. You may find it helpful to engage in activities which result in the natural release of endorphins such as light exercise and spending time with family and friends.
Page 37
Version 6.1See disclaimers on page 2 of this reportCopyright 2011All Rights Reserved

Sample Patient
04-Dec-15
Genetics and Healthy Behavior| Section Four
Sugar Cravings
Everyone does not experience the same tendency to crave sugar and sweet foods. Brain chemistry and blood sugar levels both play a major role in the desire to consume sugar in one's diet. Once again, genetics plays a big part. Certain proteins found in cell membranes are key to the movement of glucose from our blood into our cells. Because of genetic variations, some individuals have glucose transporter proteins which move glucose more efficiently. These genetic variations play a role in how likely a person is to experience sugar cravings.
The tendency to crave sugar is associated with difficulty controlling weight and maintaining overall good health. Sugar, especially refined sugar, comes with many negative effects on weight management and overall health. There is the dual problem of the calories contained in the sugar, combined with the effect sugar consumption has on insulin levels and function. To make matters worse, foods high in sugar are often low in other important nutrients and high in unhealthy saturated fats. Controlling sugar intake, especially processed sugar that is quickly absorbed, is fundamental to long term health.
GLUT2
According to your genotype:
Mood and Food Selection
A polymorphism of the gene that codes for GLUT2 transporter is associated with significantly increased cravings for sugars. Your genotype (GG) indicates that you have the form of this gene which is associated with a normal tendency to crave sugars in your diet.
Even with the more favorable form of this gene, you may still experience a challenge with craving sugars and sweet foods. Keep in mind that sugar cravings tend to increase when they are indulged. As you decrease the amount of sugar in your diet, you will probably find that the craving for sugar will soon decrease as well. Some researchers point out that dietary sugar has a powerful stimulating effect on the same brain functions involved in drug addictions and other impulsive behaviors based on acquired habits.
Another helpful strategy is to limit the availability of high sugar foods in your immediate environment. Generally, it is easier to avoid buying a box of cookies at the store than to resist them once you have them in your house. It is helpful to observe which situations trigger a craving for sugar and avoid them when possible.
Page 38
Version 6.1See disclaimers on page 2 of this reportCopyright 2011All Rights Reserved

Sample Patient
04-Dec-15
Genetics and Healthy Behavior| Section Four
Mood and Food Selection
Mood can play a significant role in your ability to make good food choices. Studies have demonstrated that individuals will tend to make healthier food choices when they are in a positive mood. We are more likely to choose indulgent foods when we are in a negative mood. There are a variety of theories as to why this is the case, and there may be more than one cause at work.
Another factor may be that mood affects our ability to think abstractly, as well as our ability to consider long term consequences. Making wise food choices often requires abstract thinking about health consequences, as well as the ability to make decisions on effects that are not as immediate as the enjoyment of the moment.
MTHFR
According to your genotype:
One mechanism may be the interaction of food and the pleasure centers in the brain. Foods high in sugar and fat may provide a temporary relief from a negative frame of mind.
Methylenetetrahydrofolate Reductase (MTHFR) is an enzyme which plays an important role in the way folate is processed. Variations in the MTHFR gene have been studied in relation to a number of important health issues, including some related to weight management.
Your genotype (CT) indicates that you have a version of the MTHFR gene which is associated with moderately reduced MTHFR activity. This can result in somewhat decreased folate activity, as well as lower levels of seratonin and dopamine, both of which play a central role in the regulation of mood. You may benefit from a diet which supports higher levels of folate, as well as activities which naturally boost levels of seratonin and dopamine. Foods which supply folate include dark green leafy vegetables, fruits, fruit juices, nuts, beans, peas, dairy products, meat, grains and eggs. A regular exercise program can be an excellent way to promote positive moods and support healthy levels of mood enhancing brain chemicals.
Practicing mindfulness in your eating habits should increase your tendency to think abstractly about the health implications of different foods. The ability to link your food choices with their health impact increases with practice, and can replace the tendency to indulge in foods high in sugars and fats because they may be a source of brief enjoyment.
Page 39
Version 6.1See disclaimers on page 2 of this reportCopyright 2011All Rights Reserved

Sample Patient
References
04-Dec-15
Ahmetov I, Rogozkin V. Genes, Athlete Status and Training-An Overview. Genetics and Sport Med Sport Sci. 2009;54:43-71. (ACE reference 1/5)
Andreasen CH, Stender-Petersen KL, Mogensen MS, Torekov SS, Wegner L, Andersen G, Nielsen AL, Albrechtsen A, Borch-Johnsen K, Rasmussen SS, Clausen JO, Sandbaek A, Lauritzen T, Hansen L, Jørgensen T, Pedersen O, Hansen T. Low physical activity accentuates the effect of the FTO rs9939609 polymorphism on body fat accumulation. Diabetes. 2008;57:95-101. (FTO reference 1/3)
Bea JW, Lohman TG, Cussler EC, Going SB, Thompson PA. Lifestyle modifies the relationship between body composition and adrenergic receptor genetic polymorphisms, ADRB2, ADRB3 and ADRA2: a secondary analysis of randomized controlled trials of physical activity among postmenopausal women. Behav Genet. 2010;40:649-59. (ADRB3 reference 1/3)
Carr MC, Brunzell JD, Deeb SS. Ethnic differences in hepatic lipase and HDL in Japanese, black, and white Americans: role of central obesity and LIPC polymorphisms. Jnl Lipd Res 2004;45:466-73. (LIPC 514 reference 1/3)
Carr MC, Hokanson JE, Deeb SS, Purnell JQ, Mitchell ES, Brunzell JD. A hepatic lipase gene promoter polymorphism attenuates the increase in hepatic lipase activity with increasing intra-abdominal fat in women. Arterioscler Thromb Vasc Biol 1999; 19: 2701-7. (LIPC 250 reference 1/3)
Comings, D.E., Gade, R., MacMurray, J.P., Muhleman, D. & Peters, W.R. Genetic variants of the human obesity (OB) gene: association with body mass index in young women, psychiatric symptoms, and interaction with the dopamine D2 receptor (DRD2) gene. Mol Psychiatry. 1996; 1: 325-35. (Behav ref)
Corella D, Arnett DK, Tsai MY, Kabagambe EK, Peacock JM, Hixson JE, Straka RJ, Province M, Lai CQ Parnell LD, Borecki I, Ordovas JM. The -256T>C polymorphism in the apolipoprotein A-II gene promoter is associated with body mass index and food intake in the genetics of lipid lowering drugs and diet network study. Clin Chem. 2007;53:1144-52. (ApoA2 reference 1/3)
Corella D, Peloso G, Arnett DK, Demissie S, Cupples LA, Tucker K, Lai CQ, Parnell LD, Coltell O, Lee YC, Ordovas JM. APOA2, dietary fat, and body mass index: replication of a gene-diet interaction in 3 independent populations. Arch Intern Med. 2009;169:1897-906. (ApoA2 reference 2/3)
de Luis DA, Aller R, Izaola O, Gonzales M, Conde R. Influence of ALA54THR polymorphism of fatty acid binding protein 2 on lifestyle modification response in obese subjects. Ann Nutr Metab. 2006;50:354-60. (FABP2 reference 1/2)
de Luis DA, Gonzalez Sagrado M, Aller R, Izaola O, Conde R. Influence of the Trp64Arg polymorphism in the beta 3 adrenoreceptor gene on insulin resistance, adipocytokine response, and weight loss secondary to lifestyle modification in obese patients. Eur J Intern Med. 2007;18:587-92. (ADRB3 reference 1/3)
Dengel DR, Brown MD, Ferrell RE, Reynolds TH 4th, Supiano MA. Exercise-induced changes in insulin action are associated with ACE gene polymorphisms in older adults. Physiol Genomics. 2002;11:73-80. (ACE reference 2/5)Gomez-Gallego F, Ruiz J, Buxens A, et al. The -786T/C polymorphism of the NOS3 gene is associated with elite performance in power sports. Eur J Appl Physiol. 2009;107:565-569. (NOS3 ref 1/3)
Di Renzo, L., Marsella, L.T., Sarlo, F., Soldati, L., et al. C677T Gene Polymorphism of MTHFR and Metabolic Syndrome: Response to Dietary Intervention. Journal of Translational Medicine. 2014; 12:329. (Behav ref )
Key Scientific References
Page 40
Version 6.1See disclaimers on page 2 of this reportCopyright 2011All Rights Reserved

Sample Patient
References
04-Dec-15
Drewnowski, A., Henderson, S.A., Shore, A.B. & Barratt-Fornell, A. Nontasters, tasters, and supertasters of 6-n-propylthiouracil (PROP) and hedonic response to sweet. Physiol Behav. 1997; 62: 649-55. (Behav ref )
Duffy, V.B. & Bartoshuk, L.M. Food acceptance and genetic variation in taste. J Am Diet Assoc. 2000; 100: 647-55. (Behav ref )
Eny, K.M., Wolever, T.M.S., Fontaine-Bisson, B., El-Sohemy, A. Genetic variant in the glucose transporter type 2 is assoicated with higher intake of sugars in two distinct populations. Physiol Genomics. 2008; 33: 355-360.Fetissov, S.O. & Meguid, M.M. On dopamine, D2 receptor, and Taq1A polymorphism in obesity and anorexia. Nutrition. 2009; 25: 132-3. (Behav ref )
Farooqi, I.S., O'Railly, S. Mutations in ligands and receptors of the leptin-melanocortin pathway that lead to obesity. Nature Online. 2008; 4. (Behav ref )
Florez, J.C. Jablonski, K.S, et al. Effects of genetic variants previously associated with fasting glucose and insulin in diabetes prevention program. PLoS ONE. 2012; 7: e44424. (Behav ref)
Frayling, T.M. et al. A common variant in the FTO gene is associated with body mass index and predisposes to childhood and adult obesity. Science. 2007; 316: 889 - 894. (Behav ref)
Goyenechea E, Dolores Parra M, Alfredo Martínez J. Weight regain after slimming induced by an energy-restricted diet depends on interleukin-6 and peroxisome-proliferator-activated-receptor-g2 gene polymorphisms. Br J Nutr. 2006;96:965-72. (IL6 reference 1/3)
Grarup N, Andreasen CH, Andersen MK, Albrechtsen A, Sandbaek A, Lauritzen T, Borch-Johnsen K, Jorgensen T, Schmitz O, Hansen T, Petersen O. The 250 G?A promoter variant in Hepatic Lipase associates with elevated fasting serum high-density lipoprotein cholesterol modulated by interaction with physical activity in a study of 16,156 Danish subjects. J Clin Endrocrinol Metab 2008; 93: 2294-9. (LIPC 250 2/3)
Guidry M, Kostek M, et al. Endothelial Nitric Oxide Synthase (NOS3) +894G>T associates with physical activity and muscle performance among young adults. ISRN Vascular Medicine. 2012; ArticleID901801: 7 pages. (NOS3 reference 2/3)
Hamada T, Kotani K, Nagai N, Tsuzaki K, Sano Y, Matsuoka Y, Fujibayashi M, Kiyohara N, Tanaka S, Yoshimura M, Egawa K, Kitagawa Y, Kiso Y, Moritani T, Sakane N. Genetic polymorphisms of the renin-angiotensin system and obesity-related metabolic changes in response to low-energy diets in obese women. Nutrition. 2011;27:34-9. (ACE reference 3/5)
Heber, D. & Carpenter, C.L. Addictive genes and the relationship to obesity and inflammation. Mol Neurobiol. 44: 160-5. (Behav ref)
Lagou V, Liu G, Zhu H, Stallmann-Jorgensen IS, Gutin B, Dong Y, Snieder H. Lifestyle and socioeconomic status modify the effects of ADRB2 and NOS3 on adiposity in European-American and African-American adolescents. Obesity 2010; [Epub ahead of print] (ADRB2 Arg16Gly reference 1/4)
Lara-Castro C, Hunter GR, Lovejoy JC, Gower BA, Fernández JR. Apolipoprotein A-II polymorphism and visceral adiposity in African-American and white women. Obes Res. 2005;13:507-12. (ApoA2 reference 3/3)
Karra, E. et al. A link between FTO, ghrelin, and impaired brain food-cue responsivity. The Journal of Clinical Investigation 123, 0-0. (Behav ref)
Page 41
Version 6.1See disclaimers on page 2 of this reportCopyright 2011All Rights Reserved

Sample Patient
References
04-Dec-15
Klipstein-Grobusch K, Mohlig M, Spranger J, Hoffmann K, Rodrugues FUS, Sharma AM, Klaus S, Pfeiffer AFH, Boeing H. Interleukin-6 g-174C promoter polymorphism is associated with obesity in the EPIC-Potsdam Study. Obesity. 2006; 14: 14-18. (IL6 reference 2/3)
Konstantinidou V, Khymenets O, Covas MI, de la Torre R, Munoz-Aguayo D, Anglada R, Farre M, Fito M. Time course of Changes in the expression of insulin sensitivity-related genes after an acute load of virgin olive oil. OMICS. 2009;13:431-8. (ADRB2 Gln/Glu reference 1/5)
Macho-Azcarate T, Marti A, González A, Martinez JA, Ibañez J. Gln27Glu polymorphism in the beta2 adrenergic receptor gene and lipid metabolism during exercise in obese women. Int J Obes Relat Metab Disord. 2002;26:1434-41. (ADRB2 Gln/Glu reference 1/3 PA)
Marini, N.J., Gin, J, et al. The Prevalence of Folate-Remedial MTHFR Enzyme Variant in Humans. PNAS. 2008; 105. (Behav ref)
Marti A, Corbalán MS, Martínez-González MA, Forga L, Martínez JA. CHO intake alters obesity risk associated with Pro12Ala polymorphism of PPARg gene. J Physiol Biochem. 2002;58:219-20. (PPARG reference 1/2)
Marti A, Corbalán MS, Martínez-Gonzalez MA, Martinez JA. TRP64ARG polymorphism of the β3-adrenergic
receptor gene and obesity risk: effect modification by a sedentary lifestyle. Diabetes ObesMetab. 2002;4:428-30. (ADRB3 reference 3/3)
Martínez JA, Corbalán MS, Sánchez-Villegas A, Forga L, Marti A, Martínez-González MA. Obesity risk is associated with carbohydrate intake in women carrying the Gln27Glu β2-adrenoceptor polymorphism. JNutr. 2003;133:2549-54. (ADRB2 Gln/Glu reference 2/5)
Masuo K, Katsuya T, Fu Y, Rakugi H, Ogihara T, Tuck ML. B₂-adrenoceptor polymorphisms relate to insulin resistance and sympathetic overactivity as early markers of metabolic disease in nonobese, normotensive individuals. Am J Hypertens. 2005a;18:1009-14. (ADRB2 Gln/Glu reference 3/5)
Masuo K, Katsuya T, Kawaguchi H, Fu Y, Rakugi H, Ogihara T, Tuck ML. Rebound weight gain as associated with high plasma norepinephrine levels that are mediated through polymorphisms in the β2-adrenoceptor. Am J Hypertens. 2005;18:1508-16. (ADRB2 Gln/Glu reference 4/5)
Meirhaeghe A, Helbecque N, Cottel D, Amouyel P. β2-adrenoceptor gene polymorphism, body weight and physical activity. Lancet. 1999;353:896. (ADRB2 Gln/Glu reference 2/3 PA)
Memisoglu A, Hu FB, Hankinson SE, Manson JE, De Vivo I, Willett WC, Hunter DJ. Interaction between a peroxisome proliferator-activated receptor g gene polymorphism and dietary fat intake in relation to body mass. Hum Mol Genet. 2003;12:2923-9. (PPARG reference 2/2)
Moran CN, Vassilopoulos C, Tsiokanos A, Jamurtas AZ, Bailey ME, Wislon RH, Pitsiladis YP. Effects of interaction between angiotensin I-Converting Enzyme polymorphisms and lifestyle on adiposity in adolescent Greeks. Obes Res 2005; 13: 1499-1504. (ACE reference 4/5)
Negrao, M.V. et al. Exercise training improves muscle vasodilatation in individuals with T786C polymorphism of endothelial nitric oxide synthase gene. Physiol Genomics. 2010;42A:71-77. (NOS3 reference 3/3)
Noble, E.P. The DRD2 gene in psychiatric and neurological disorders and its phenotypes. Pharmacogenomics. 2000; 1: 309-33. (Behav ref)
Noble, E.P. Addiction and its reward process through polymorphisms of the D2 dopamine receptor gene: a review.
Page 42
Version 6.1See disclaimers on page 2 of this reportCopyright 2011All Rights Reserved

Sample Patient
References
04-Dec-15
Eur Psychiatry. 2000; 15: 79-89. (Behav ref)
Ozkaragoz, T. & Noble, E.P. Extraversion. Interaction between D2 dopamine receptor polymorphisms and parental alcoholism. Alcohol. 2000; 22: 139-46. (Behav ref)
Ordovas JM, Corella D, Demissie S, Cupples LA, Couture P, Coltell O, Wilson PW, Schaefer EJ, Tucker KL. Dietary fat intake determines the effect of a common polymorphism in the hepatic lipase gene promoter on high-density lipoprotein metabolism: evidence of a strong dose effect in this gene-nutrient interaction in the Framingham Study. Circulation. 2002;106:2315-21. (LIPC 514 reference 2/3)
Pereira AC, Floriano MS, Mota GF, Cunha RS, Herkenhoff FL, Mill JG, Krieger JE. β2 adrenoceptor functional gene variants, obesity, and blood pressure level interactions in the general population. Hypertension. 2003;42:685-92. (ADRB2 Arg/Gly reference 2/4)
Phares DA, Halverstadt AA, Shuldiner AR, Ferrell RE, Douglass LW, Ryan AS, Goldberg AP, Hagberg JM. Association between body fat response to exercise training and multilocus ADR genotypes. Obes Res. 2004;12:807-15. (ADRB2 Gln/Glu reference 3/3 PA)
Philips C.M., et al. Dietary saturated fat, gender and genetic variation at the TCF7L2 locus predict the development of metabolic syndrome. The journal of nutritional biochemistry 23, 239-244. (TCF7L2 reference)
Qi Q., Bray G.A., Hu F.B., Sacks F.M., and Qi L. Weight loss diets modify glucose dependent insulinotropic polypeptide receptor rs2287019 genotype effects on changes in body weight, fasting glucose, and insulin resistance: the Preventing Overweight Using Novel Dietary Strategies trial. Am J Clin Nutr 95, 506-13. (GIPR reference 1/2)
Qi Q. et al. Insulin receptor substrate 1 gene variation modifies insulin resistance response to weight-loss diets in a 2-year randomized trial: the Preventing Overweight Using Novel Dietary Strategies (POUNDS LOST) trial. Circulation 124, 563-571. (IRS1 reference 1/2)
Razquin C, Martinez JA, Martinez-Gonzalez MA, Bes-Rastrollo M, Fernández-Crehuet J, Marti A. A 3-year intervention with a Mediterranean diet modified the association between the rs9939609 gene variant in FTO and body weight changes. Int J Obes (Lond). 2010;34:266-72. (FTO reference 2/3)
Répásy J., Bokor S., Erhardt É., Molnár D. Association of Gln223 Arg polymorphism of the leptin receptor gene with indicators of energy expenditure in obese children. Nutrition. 2014; 30(7-8):837-40. (Behav ref)
Rong, R. et al. Association analysis of variation in/near FTO, CDKAL1, SLC30A8, HHEX, EXT2, IGF2BP2, LOC387761, and CDKN2B with type 2 diabetes and related quantitative traits in Pima Indians. Diabetes. 2009; 58: 478-88. (Behav ref)
Ruiz JR, Larrarte E, Margareto J, Ares R, Labayen I. Role of b2-adrenergic receptor polymorphisms on body weight and body composition response to energy restriction in obese women: preliminary results. Genetics 2011; 19:212-215. (ADRB2 Gln/Gly reference 5/5)
Sesti G., et al. Defects of the insulin receptor substrate (IRS) system in human metabolic disorders. Vol 15 2099-2111. (2001) (IRS1 reference 2/2)
Sonestedt E., et al. Genetic variation in the glucose-dependent insulinotropic polypeptide receptor modifies the association between carbohydrate and fat intake and risk of type 2 diabetes in the MalmA¶diet and cancer cohort.Vol97 E810-E818. (GIPR reference 2/2)
Page 43
Version 6.1See disclaimers on page 2 of this reportCopyright 2011All Rights Reserved

Sample Patient
References
04-Dec-15
Sonestedt E, Roos C, Gullberg B, Ericson U, Wirfält E, Orho-Melander M. Fat and carbohydrate intake modify the association between genetic variation in the FTO genotype and obesity. Am J Clin Nutr. 2009;90:1418-25. (FTO reference 3/3)
Snyder EM, Johnson BD, Joyner MJ. Genetics of β2-adrenergic receptors and the cardiopulmonary response to exercise. Exerc Sport Sci Rev. 2008;36:98-105. (ADRB2 Arg16Gly reference 3/4)
Sookoian SC, Gonzales C, Pirola CJ. Meta-analysis on the G-308A Tumor Necrosis Factor a gene variant and phenotypes associated with the metabolic syndrome. Obes Res. 2005:13: 2122-31. (TNFa reference 1/2)
Stahl, Steven. L-Methlyfolate: A Vitamin for Your Monoamines. Journal of Clinical Psychiatry. 2008; 69:9. (Behav ref)
Stolarczyk, E., Guissard, C., Michau, A. Detection of extracellular glucose by GLUT2 contributes to hypothalamic control of food intake. Am J Physiol Endocrinol Metab. 2010; 298: E1078-E1087. (Behav ref)
Takakura Y, Yoshioka K, Umekawa T, Kogure A, Toda H, Yoshiskawa T, Yoshida T. Thr54 allele of the FABP2 gene affects resting metabolic rate and visceral obesity. Diabetes Res Clin Prac. 2005;67:36-42. (FABP2 reference 2/2)
Tepper, B.J. 6-n-Propylthiouracil: a genetic marker for taste, with implications for food preference and dietary habits. Am J Hum Genet. 1998; 63: 1271-6. (Behav ref)
Tepper, B.J. & Nurse, R.J. PROP taster status is related to fat perception and preference. Ann N Y Acad Sci. 1998; 855: 802-4. (Behav ref)
Todorova b, Kubaszek A, Pihlajamaki J, Lindstrom J, Eriksson J, Valle TT, Hamalainene H, Ilanne-Parikka P, Keinanen-Kiukaanniemi S, Tuomilehto J, Uusitupa M, Laakso M. The G-250A promoter polymorphism of the hepatic lipase gene predicts the converstion from impaired glucose tolerance to Type 2 Diabetes Mellitus: the Finnish Diabetes Prevention Study. J Clin Endocrin Metab. 2004; 89: 2019-23. (LIPC 250 reference 3/3)
Traurig, M.T., Perez, J.M., Ma, L., et al. Variants in the LEPR gene are norminally associated with higher BMI and lower 24-h energy expenditure in Pima Indians. Obesity. 2012; 20: 2426-2430. (Behav ref)
Wang, G.J., Volkow, N.D., Thanos, P.K. & Fowler, J.S. Similarity between obesity and drug addiction as assessed by neurofunctional imaging: a concept review. J Addict Dis. 2004; 23: 39-53. (Behav ref)
Wardle, J. et al. Obesity Associated Genetic Variation in FTO Is Associated with Diminished Satiety.2008; Vol. 93 : 3640-3643. (Behav ref)
Wernstedt I, Eriksoon AL, Berndtsoon A, Hoffstedt J, Skrtic S, HEdner T, Hutlen LM, Wiklund O, Ohlsson C, Jansson JO. A common polymorphism in the interleukin-6 promoter is associated with overweight. Int J Obes Relat Metab Disord 2004; 28:1272-79. (IL6 reference 3/3)
Wolfarth B, Rankinen T, et al. Association between a B₂-adrenergic receptor polymorphism and elite performance. Met Clin & Experimental. 2007; 56:1649-1651. (ADRB2 Arg/Gly reference 4/4)
Wybranska I, Malczewsak-Malec M, Neidbal S, Naskalski JW, Dembinsha-kiec A. The TNF-a Gene NcoI polymorphism at position -308 of the promoter influences insulin resistance and increases serum triglycerides after postprandial lipaemia in familial obesity. Clin Chem Lab Med 2003;41:501-10. (TNF reference 2/2)
Page 44
Version 6.1See disclaimers on page 2 of this reportCopyright 2011All Rights Reserved

Sample Patient
References
04-Dec-15
Yang, B., Fan, S., Zhi, X, et al. Association of MTHFR C677T and MTRR A66G Gene Polymorphisms with Metabolic Syndrome: A Case-Control Study in Northern China. International Journal of Molecular Science. 2014; 15(12): 21687. (Behav ref)
Yang, J., Liu, J., Liu, J, Li, W, et al. Genetic Association Study with Metabolic Syndrom and Metabolic-Related Traints in a Cross-Sectional Sample and a 10-Year Longitudinal Sample of Chinese Elderly Population. Public Library of Science One. 2014; 9 (6): e100548. (Behav ref)
Yang, B., Fan, S., Zhi, X., et al. Associations of MTHFR C677T and MTRR A66G Gene Polymorphisms with Metabolic Syndrome: A Case-Control Study in Northern China. Int. J. Mol. Sci. 2014; 15(12):21687-702. (Behav ref)
Zhang B, Tanaka H, Shono N. The I allele of the angiotensin-converting enzyme gene is associated with an increased percentage of slow-twitch type I fibers in human skeletal muscle. Clin Genet. 2003;63:139-144. (ACE reference 5/5)
Zhang C, Lopez-Ridaura r, Rimm EB, Rifai N, Hunter DJ, Hu FB. Interactions between the -514C>T polymorphism of the hepatic lipase gene and lifestyle factors in relation to HDL concentrations among US diabetic men. Am J Clin Nutr. 2005;81:1429-35. (LIPC 514 reference 3/3)
Testing Facility:GenoVive Laboratory250 Plauche StreetHarahan, LA 70123CLIA Number: 19D2032754CLIA Lab Director: W. Douglas Scheer, PhD
Page 45
Version 6.1See disclaimers on page 2 of this reportCopyright 2011All Rights Reserved