nutrients in an african savanna: the consequences of
TRANSCRIPT

Nutrients in an African Savanna: The consequences of supply heterogeneity
for plants and animals
Cornelis van der Waal

Thesis committee Thesis supervisors Prof. dr. H.H.T. Prins Professor of Resource Ecology Wageningen University Prof. dr. H. de Kroon Professor of Experimental Plant Ecology Radboud University Nijmegen Thesis co-supervisor Dr. ir. I.M.A. Heitkönig Assistant Professor Resource Ecology Group Wageningen University Other members Prof. Dr. P.C. de Ruiter, Wageningen University Prof. Dr. H. Olff, University of Groningen Prof. Dr. F.J.J.M. Bongers, Wageningen University Prof. Dr. S.I. Higgins, Goethe University Frankfurt, Frankfurt am Main This research was conducted under the auspices of the C.T. de Wit Graduate School of Production Ecology & Resource Conservation.

Nutrients in an African Savanna: The consequences of supply heterogeneity
for plants and animals
Cornelis van der Waal
Thesis
Submitted in fulfillment of the requirements for the degree of doctor at Wageningen University
by the authority of the Rector Magnificus Prof. dr. M.J. Kropff, in the presence of the
Thesis Committee appointed by the Academic Board to be defended in public
on Monday 27 September 2010 at 1.30 p.m. in the Aula

Cornelis van der Waal Nutrients in an African Savanna: The consequences of supply heterogeneity for plants and animals. Thesis, Wageningen University, Wageningen, NL (2010) With references, with summaries in Afrikaans, Dutch and English ISBN: 978-90-8585-674-0

Table of contents
Abstract ii
Acknowledgements iv Chapter 1 1 Introduction C. van der Waal Chapter 2 13 Water and nutrients alter herbaceous competitive effects on tree seedlings in a semi-arid savanna C. van der Waal, H. de Kroon, W.F. de Boer, I.M.A. Heitkőnig, A.K. Skidmore, H.J. de Knegt, F. van Langevelde, S.E. van Wieren, R.C. Grant, B.R. Page, R. Slotow, E. M. Kohi, E. Mwakiwa and H.H.T. Prins Chapter 3 33 Herbivores forage for plants which forage for nutrients: Scale-dependent bi-trophic interactions in a semi-arid savanna C. van der Waal, H. de Kroon, F. van Langevelde, I.M.A. Heitkönig and H.H.T. Prins Chapter 4 63 Scale of nutrient patchiness mediates resource partitioning between trees and grasses in a semi-arid savanna C. van der Waal, H. de Kroon, I.M.A. Heitkönig, W.F. de Boer, R. Slotow and H.H.T. Prins Chapter 5 83 Large herbivores alter vegetation structure through soil nutrient mediation in a semi-arid savanna: Lessons from a natural experiment with abandoned kraals C. van der Waal, A. Kool, S.S. Meijer, H. de Kroon, E. Kohi, I.M.A. Heitkönig, W.F. de Boer, F. van Langevelde, R.C. Grant, M.J.S. Peel, R. Slotow, A.K. Skidmore, H.J. de Knegt, E. Mwakiwa, Y. Pretorius, S.E. van Wieren and H.H.T. Prins Chapter 6 103 Nutrient heterogeneity in dry savannas: A synthesis C. van der Waal
References 121
Samevatting 135
Samenvatting 139
Summary 143
Affiliation of co-authors 146
Curriculum vitae 148
PE & RC Education Certificate 150


To Lizelle

ii
Abstract
The savanna biome is of great extent and a large proportion of the human population depends on its ecological services for a livelihood. In savannas the ratio between the woody (tree) and herbaceous (grass) components largely determine animal productivity, the shape of herbivore assemblages and earth-atmosphere feed backs. This thesis aimed to fill a current gap in the understanding of the role of soil nutrients as determinant of the tree-grass ratio. Apart from studying vegetation responses to added nutrients, we also looked at responses to nutrients added at different scales of nutrient patchiness. Spatial scale is potentially important where differently sized organisms share heterogeneously distributed resources, i.e., fine-grained vs. coarse-grained fertile patches. We also studied the potential feed back effects that scale of nutrient heterogeneity might have for the large herbivore assemblage in a series of field fertilization experiments situated in a semi-arid, intact savanna in South Africa. Plant and animal responses that were recorded included; tree shoot growth, herbaceous biomass, leaf N, P and condensed tannin (trees) concentrations and grazer and browser impact intensities on local vegetation. Results showed that tree seedlings competing with grasses were increasingly suppressed as soil fertility increased, apparently because of intensified competition for water by fertilized grasses. Established trees benefitted from fertilization, especially when fertilized with N and the scale of nutrient patchiness altered the partitioning of resources by favouring trees in coarse-grained and grasses in fine-grained nutrient patches. In turn, the large herbivore assemblage responded to the scale of nutrient patchiness as grazer impact on the vegetation increased at finer grain sizes than browser impact. These findings have important consequences for the management of savannas, which were discussed.

Acknowledgements This thesis was in many respects a group effort, with many individuals and organizations collaborating and, most importantly, contributing information and ideas. First of all I would like to thank my project supervisors: Herbert Prins and Hans de Kroon. Thank you for the time invested and personal interest you have taken in my life. I have learnt a lot from your somewhat divergent views on science, which in my experience complemented each other well. Herbert, you have taught me about balancing reason and intuition, science and fun. Being in the field with you was most instructive and accompanied by lots of merriment, even when the ambient temperature (not blood temperature!) soared well over 40 ºC. You also broadened my outlook on life on more philosophical topics, for which I am equally grateful. Hans, our long discussions around campfires until Lizelle urged us to bed or on long, bumpy roads in the reserves or in Kruger, could not have been more enjoyable. Highlights were discussing first responses in the various field experiments with you. As for my visits to Nijmegen, I always felt welcome in your group and our discussions were exuberant and helpful, albeit with lots to do afterwards (as expected from a good supervisor). If you camp with us again, I promise to have a new tent available. I am also much indebt to my daily supervisor, Ignas Heitkönig, for all the logistical support and your inputs in various aspects of my study. Your friendship is also greatly appreciated. I am also grateful for the help and support I received from other people associated with the TEMBO program, including Scott Ronaldson, Stefanie Freitag-Ronaldson, Mike Peel, Rina Grant and Rob Slotow while in the field, and Fred de Boer and Frank van Langevelde throughout my studies. It was also my privilege to be associated with the fellow students in the TEMBO programme: Emmanuel, Edward, Henjo, Nicky, Martijn and Yolanda. Thank you for your friendship and support. Henjo, thanks also for translating the summary into Dutch. Edward and Yolanda, I have fond memories of living and working in the bush. As for the obstinate field vehicles we had, well, they did remind us to slow down and appreciate our surroundings a bit. The following people were of great help in carrying out the various experiments in the field and in running the research camp: Floris van Beest, Tian von Wielligh, Bennie van der Waal (brother), Ig Viljoen, Ada Kool, Seline Meijer, Alex Munro, Stefan Heunis, Reis Manhique, Emma Rees, Kerri-Lee Dyer and Joel Sithole. Reis, I will miss your wisdom, humour and seemingly infinite veld knowledge. The friendship of Steve and Michele Henley, and Carl and Caroline van den Berg is also much appreciated. In the Netherlands, I would also like to thank all the fellow students in the Resource Ecology Group (Wageningen) and the Experimental Plant Ecology Group (Nijmegen) for inputs and interesting discussions. In particular, I would like to thank Farshid Ahrestani, my office companion in the Netherlands, for his valued friendship. I’ll never forget our spirited discussions during our numerous coffee breaks. I appreciate the support (and patience) of Anne-Marie van den Driessche with the chemical analyses of the large number of plant samples, the secretarial inputs by Willemien, Patricia, Margreet, Maureen and José, and Gerda for

iv
the efficient administration of my project finances. Constructive comments by Patricia Craven, who proofread a draft of this thesis, are greatly appreciated.
Many friends and family visited or supported us during my studies. In particular I am indebted to the following family members, without whom the study would have been most challenging: Willem and Karlien who unselfishly shared their house with us whenever we needed accommodation in Pretoria; my mother and mother-in-law who visited us in the Netherlands and Northern Ireland to help with house keeping; my father-in-law for visiting us every year in the APNR and who helped and provided us with so many things during our stay abroad. Dad, thanks also for correcting the Afrikaans summary. In the Netherlands, the friendships of Gerhard and Corine, and that of Jan-Lykle and Arenka were particularly valued. Arnaud le Roux kindly offered me his farm to do some writing in South Africa. I also would like to thank the church communities in Hoedspruit and Wageningen for spiritual communion and kindness shown to us.
During the fieldwork phase we enjoyed a very special time on the property of the Dr. Marie Luttig Trust where the research camp was situated. How can we forget experiences such as having the resident lion pride attacking a buffalo within meters of our unfenced tent? Or retrieving our kettle from a marauding hyena armed only with a pellet gun and headlamp? Many thanks also to the Scholtz family of the farm Sumatra (Timbavati), particularly Tokkie and Rosa, for making your comfortable camp available after Benjamin was born. I miss the camp atmosphere, not the least the sand grouse calls at dusk. Above all I would like to thank my dearest wife, Lizelle, for her unfailing support, companionship and belief in me throughout the project. Words fail me to describe what you meant to me from the start, which involved many hardships and personal challenges, but also incredibly beautiful moments and adventures we have shared on this unique journey. I feel so blessed to know you. I, for one, value the striking sketches that are included in this thesis. Benjamin, one day I would like to return to the Timbavati with you to show you not only white lion, but also fertilized Mopane.


Nutrients and savannas
0

Chapter 1
1
Chapter 1
Introduction Cornelis van der Waal
Nutrients and savannas
2
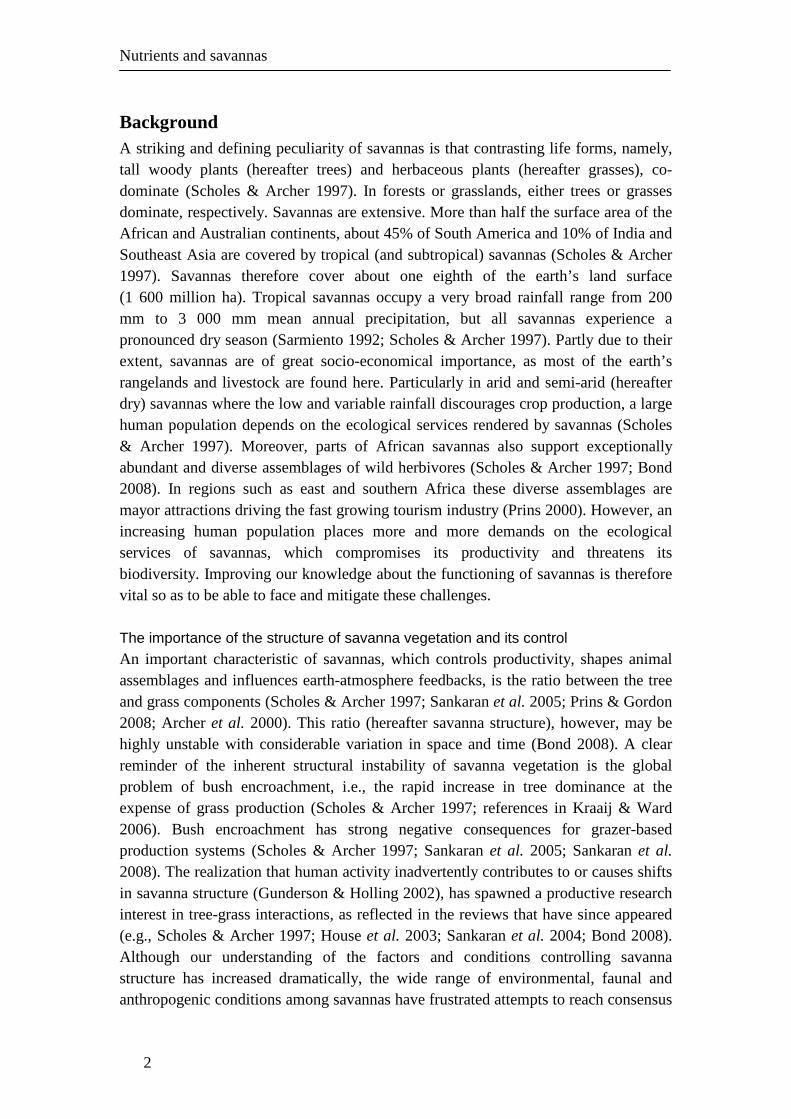
Background A striking and defining peculiarity of savannas is that contrasting life forms, namely, tall woody plants (hereafter trees) and herbaceous plants (hereafter grasses), co-dominate (Scholes & Archer 1997). In forests or grasslands, either trees or grasses dominate, respectively. Savannas are extensive. More than half the surface area of the African and Australian continents, about 45% of South America and 10% of India and Southeast Asia are covered by tropical (and subtropical) savannas (Scholes & Archer 1997). Savannas therefore cover about one eighth of the earth’s land surface (1 600 million ha). Tropical savannas occupy a very broad rainfall range from 200 mm to 3 000 mm mean annual precipitation, but all savannas experience a pronounced dry season (Sarmiento 1992; Scholes & Archer 1997). Partly due to their extent, savannas are of great socio-economical importance, as most of the earth’s rangelands and livestock are found here. Particularly in arid and semi-arid (hereafter dry) savannas where the low and variable rainfall discourages crop production, a large human population depends on the ecological services rendered by savannas (Scholes & Archer 1997). Moreover, parts of African savannas also support exceptionally abundant and diverse assemblages of wild herbivores (Scholes & Archer 1997; Bond 2008). In regions such as east and southern Africa these diverse assemblages are mayor attractions driving the fast growing tourism industry (Prins 2000). However, an increasing human population places more and more demands on the ecological services of savannas, which compromises its productivity and threatens its biodiversity. Improving our knowledge about the functioning of savannas is therefore vital so as to be able to face and mitigate these challenges.
The importance of the structure of savanna vegetation and its control
An important characteristic of savannas, which controls productivity, shapes animal assemblages and influences earth-atmosphere feedbacks, is the ratio between the tree and grass components (Scholes & Archer 1997; Sankaran et al. 2005; Prins & Gordon 2008; Archer et al. 2000). This ratio (hereafter savanna structure), however, may be highly unstable with considerable variation in space and time (Bond 2008). A clear reminder of the inherent structural instability of savanna vegetation is the global problem of bush encroachment, i.e., the rapid increase in tree dominance at the expense of grass production (Scholes & Archer 1997; references in Kraaij & Ward 2006). Bush encroachment has strong negative consequences for grazer-based production systems (Scholes & Archer 1997; Sankaran et al. 2005; Sankaran et al. 2008). The realization that human activity inadvertently contributes to or causes shifts in savanna structure (Gunderson & Holling 2002), has spawned a productive research interest in tree-grass interactions, as reflected in the reviews that have since appeared (e.g., Scholes & Archer 1997; House et al. 2003; Sankaran et al. 2004; Bond 2008). Although our understanding of the factors and conditions controlling savanna structure has increased dramatically, the wide range of environmental, faunal and anthropogenic conditions among savannas have frustrated attempts to reach consensus

Chapter 1
3
Water33%
Soil nutrients
17%
CO26%
Herbivores18%
Fire26%
on the relative importance of these factors and how the vegetation structure of savannas are controlled (Bond 2008). Nevertheless, the availability of water and nutrients (as well as CO2) are considered prime resources controlling the structure of savannas, while fire and herbivory modify the effects of resource availability (Sankaran et al. 2004). Arguably less research effort has been directed into understanding the roles of soil nutrient and herbivore control of savanna vegetation structure, compared to that of water availability and fire. For example, assuming that review articles reflect research efforts, the analysis of papers cited in four prominent reviews (i.e., Scholes & Archer 1997; House et al. 2003; Sankaran et al. 2004; Bond 2008) with regards to the factors controlling tree-grass co-existence in savannas revealed interesting results. Of the 445 non-overlapping papers cited, 172 dealt with the determinats of vegetation structure: Water, nutrients, CO2, herbivores or fire. A breakdown of these papers, classified according to topic as inferred from the titles, revealed that only 17% dealt with soil nutrients and only 18% with herbivores (Fig. 1.1). This contrasts sharply with the 33% and 26% of sources dealing with water and fire, respectively (Fig. 1.1). Moreover, of the 17% soil nutrient-related sources the majority of articles studied the effects of trees on the availability and distribution of nutrients and does not contribute directly to our understanding of the role of nutrients in determining savanna vegetation structure. Recently some advances were made with regards to the role of soil nutrients. For example, a meta-analysis of the factors controlling the tree cover in African savannas revealed that tree cover is negatively related to soil nitrogen (N) availability (Sankaran et al. 2008). Experiments with tree seedlings also showed negative effects of fertilization under certain conditions (e.g., Cohn et al. 1989; Kraaij & Ward 2006), suggesting that tree recruitment, a crucial demographic phase for trees in dry savannas (Higgins et al. 2000; Sankaran et al. 2004), might be affected by soil nutrient availability.
Figure 1.1 The composition of 172 papers cited in four prominent reviews dealing with the
factors controlling the ratio between the tree and grass components in savannas.
More articles dealt with water availability and fire, while soil nutrients and
herbivores received less attention.

Nutrients and savannas
4
Improving our understanding of how vegetation structure and large herbivore assemblages respond to changes in nutrient availability is also important in the light of global change. An estimated three- to fourfold increase in N deposition in the Kruger National Park (KNP), South Africa, has recently been reported (Scholes et al. 2003). Increased atmospheric N deposition has been shown to significantly affect plant species composition and structure in a wide range of vegetation types from forests to upland heaths and may also drive changes in savannas (van der Wal et al. 2003; Arens et al. 2008). Overall, predictions of savanna vegetation responses to changes in atmospheric N deposition are typically uncertain (Scholes et al. 2003; Dentener et al. 2006; McKeon et al. 2009). Savannas as heterogeneous systems
Savanna landscapes are heterogeneous systems and resources such as soil nutrients vary widely in space and time (du Toit et al. 2003; Jacobs et al. 2007). Soil fertility varies among geomorphological units such as footslope, midslope and crest locations, even within the same underlying geological formation, and, at smaller scales, underneath large trees and associated with termitaria compared to the open spaces between them (Treydte et al. 2007; Ludwig et al. 2001; Grant & Scholes 2006; Jacobs et al. 2007). Management of rangelands may strongly influence local nutrient availability and distribution patterns, e.g., excluding large herbivores significantly decreases N availability (Augustine & McNaughton 2006) and providing artificial water to large herbivores may result in the horizontal transport of nutrients such as phosphorous (P) from grazing areas toward watering points (Tolsma et al. 1987). Considering that N and P are generally the most limiting elements for terrestrial plant growth (Reich & Oleksyn 2004; Elser et al. 2007) and vertebrates (Prins & van Langevelde 2008), changes in the availability of these elements may have ecological cascading effects. However, it remains uncertain how savanna vegetation and subsequently herbivores may respond to changes in nutrient availability (Tolsma 1987; Augustine 2003). While it is agreed that savanna grass production is strongly co-limited by both N and P (Penning de Vries & Djitèye 1982; Donaldson et al. 1984; Fynn & O'Connor 2005), the general state of knowledge about savanna tree nutrition, let alone specific N vs. P limitation, is scant (Bond 2008). As a consequence savanna structural responses to perturbations in nutrient availability caused by, for example, increased atmospheric N deposition (Scholes et al. 2003; Dentener et al. 2006) and management interventions (Augustine 2003; Tolsma et al. 1987) are likewise unclear. Savanna trees and grasses are expected to differ in their nutrient responses, because of inherent differences in resource allocation patterns, photosynthetic pathway followed, and root architecture (Bond 2008). Improving our understanding of the ecological consequences of changes in nutrient availability may aid in mitigating ecological threats to savannas.
In this regard, it is increasingly realised that heterogeneity is an important independent factor to take into account when managing savanna systems (du Toit et al. 2003). However, operationalizing the concept of heterogeneity in ecological

Chapter 1
5
management is challenging and requires a mind shift. For example, conventional wisdom may be unable to link a loss of large trees in Tarangire National Park, Tanzania, with a loss in wildebeest habitat. After all, wildebeest are grazers. Spatial heterogeneity, however, may be the key here. Ludwig et al. (2008) calculated that maintaining scattered large trees, which create spatial heterogeneity in soil nutrient availability hence differences in grazing quality, might be critical for wildebeest nutrition. All nutritional requirements can only be satisfied when combining grazing from underneath trees with that of other sub-habitats (Ludwig et al. 2008). If trees are increasingly lost, as they are in Tarangire, then the spatial homogenization of soil nutrients might eventually marginalize the habitat for wildebeest. In a sense, heterogeneity in time and space can be viewed as the ultimate source of biodiversity (Pickett 1998). Accepting this, however, requires that we also see heterogeneity as the ultimate focus of ecological management and restoration (Pickett et al. 2003). This provides a strong impetus to improve our understanding of the role of heterogeneity in ecosystems such as savannas.
It is increasingly realised that not only the overall availability of resources (i.e., soil nutrients), but also how resources become locally available in time and space, explains resource partitioning between co-existing organisms (Ritchie & Olff 1999; Hutchings et al. 2003; Cromsigt & Olff 2006). For example, plants vary nutrient uptake, biomass accumulation and root vs. shoot allocation patterns when the same amount of nutrients is supplied, but in patches of different sizes (Hutchings et al. 2003; Kume et al. 2006). Likewise, large herbivore species in a southern African savanna preferred different grain sizes of heterogeneously distributed high-quality grazing resources (Cromsigt & Olff 2006), which resulted in resource partitioning within a grazer assemblage. In this regard, scaling theory predicts that organisms respond to different scales of resource patchiness in relation to their own size: Large organisms respond to larger scales of resource patchiness and small organisms to smaller scales of patchiness (Ritchie & Olff 1999; Hutchings et al. 2003). Scale related responses to heterogeneity may be particularly relevant in savanna systems where large trees and (small) grasses co-exist, e.g., in controlling resource partitioning between the growth forms. Differential nutrient uptake and expression by trees and grasses may, in turn, propagate to influence utilization and impact patterns of large herbivore assemblages. Selective large herbivore impact on either the tree or grass layer can result in significant structural changes in savanna vegetation (Asner et al. 2009; Sankaran et al. 2008). For example, in a meta-analysis Sankaran et al. (2008) found a trend of increasing tree cover with rising grazer pressure, but a decreasing tree cover trend as browser biomass increases (especially that of elephant). Moreover, apart from responding to nutrient heterogeneity, large herbivores may also create nutrient heterogeneity in savanna systems. For example, livestock redistributes nutrients from grazing areas to holding pen areas and impala from grazing to open overnight patches (Blackmore et al. 1990; Augustine 2003). In fact, it is likely that biotic factors such as termites and large herbivores are currently underestimated in this regard (Jacobs et al. 2007).

Nutrients and savannas
6
Study objectives and approach The overarching focus of this thesis is on how spatial and temporal heterogeneity of soil nutrients modulate the partitioning of resources between trees and grasses, as this is likely to feed back to influence the ratio between tree and grass components. We address the questions of how co-existing trees and grasses respond to an increase in nutrient availability and respond to differences in the scale of local nutrient patchiness. We expect grasses to be more responsive to a sudden increase in nutrient availability than trees (Bond 2008). In terms of spatial heterogeneity we expect grasses to respond more to small scales of nutrient patchiness and trees to larger scales of nutrient patchiness (Hutchings et al. 2003). We also consider the consequences of soil-nutrient heterogeneity for large herbivores, which, themselves, can be important agents of vegetation change in savanna systems (Sankaran et al. 2008). To study these concepts in a natural context, an experimental approach was adopted and nutrient availability in the field was manipulated using fertilizers. Manipulating soil nutrient availability using fertilizer in savannas has greatly increased our understanding of other nutrient-related aspects in savannas, e.g., how trees modify resource availability for co-existing grasses (Belsky et al. 1993; Ludwig et al. 2001) and how resource heterogeneity leads to resource partitioning between large herbivore species (Cromsigt & Olff 2006). In addition, by adopting an experimental approach, thus controlling how much nutrients were supplied, we have circumvented some of the difficulties in quantifying soil fertility in the field, and avoided the problem of soil texture co-varying with soil fertility along natural fertility gradients (Walker & Langridge 1997). Soil texture strongly modulates soil water availability, thus confounds nutrient effects per se (Walker & Langridge 1997).
The study area The study was carried out in the Associated Private Nature Reserves (APNR), which is situated in the northeastern Lowveld of South Africa. The APNR includes the Timbavati, Klaserie and Umbabat Private Nature Reserves (latitude 24°03´– 24°33´S; longitude 31°02´– 31°29´E; Fig. 1.2). Combined the reserves (including the Balule Nature Reserve) cover an area of about 2 000 km2. The APNR abuts the Kruger National Park (KNP) (Fig. 1.2, insert). Land in the APNR is privately or corporately owned, but is managed jointly in close collaboration with the Scientific Services section of the KNP. Soils in the APNR and western parts of the KNP are mainly derived from granite (Venter et al. 2003) with occasional gabbro extrusions. Soils derived from granite tend to be coarse textured and nutrient poor (i.e., low availability of N and P) on crests and mid-slopes (Treydte et al. 2007), but may be locally elevated in bottom positions in the landscape, areas associated with termitaria and underneath large Acacia trees (Grant & Scholes 2006; Treydte et al. 2007). In the study area (APNR), the mean annual precipitation ranges between 450 mm yr-1 in the northeast to 600 mm yr-1 in the southwest. About 80% of the rainfall is received in summer between

Chapter 1
7
October and the end of March. The mean maximum temperature for the Satara weather station (50 km E of the APNR) during January (hottest month) is 33.7 ºC and the mean minimum temperature for June (coolest month) is 9.4 ºC (Venter et al. 2003). Figure 1.2 A map indicating the location of the study area in the northeastern parts of South
Africa, abutting the Kruger National Park. The insert shows the layout of the
three private nature reserves (Klaserie Private Nature Reserve, Umbabat PNR and
Timbavati PNR), where the various experiments were conducted. Most of the
work was carried out in the northern parts of the Timbavati PNR.
The study area falls within the savanna biome (Rutherford & Westfall 1994) and varies structurally from open savanna in the central and southern parts to closed woodland in the northern and western parts. The woodland in the northern, drier parts, where the experiments were located, comprised a well-developed woody stratum dominated by closed Colophospermum mopane (Kirk ex Benth.) Kirk ex J. Léonard trees (<8 m height). Other trees occasionally occurring included Sclerocarya birrea (A. Rich.) Hochst., Acacia nigrescens Oliv. and Combretum apiculatum Sond. The continuous herbaceous layer was of medium height (<0.8 m) and featured species such as Urochloa mosambicensis (Hack.) Dandy, Bothriochloa radicans (Lehm.) A. Camus, Digitaria eriantha Steud., Panicum maximum Jacq. and a variety of non-graminoid herbaceous species. Annual species such as the grass Brachiaria deflexa (Schumach.) Robyns only established during favourable rainfall years.
In this study, Colophospermum mopane (Mopane) was chosen as the focal tree species, because it is a locally important tree species. C. mopane currently covers more than 500,000 km2 of southern African lowlands where livestock production, game ranching and conservation are the main forms of land use (Smit 2001;
TIM BAVATI P NRKLASERI E PNR
UMBA BAT PNR
South Africa
N
TIMBAVATI
KLASERIE UMBABAT
Kru
ger
Nat
iona
l Par
k

Nutrients and savannas
8
0
10
20
30
40
50
60
1944 1974 2000
Year
Tre
e c
ove
r (%
)
(a)
MacGregor & O’Connor 2002). Mopane is an important food source for browsing herbivores such as African elephant Loxodonta africana (Caughley 1976; Pretorius 2009), as well as for ungulates such as kudu Tragelaphus strepsiceros during the dry season (Hooijmeyer et al. 2005).
Mopane has also been implicated as a bush encroacher and its proliferation, resulting in dense monotypic stands, occurs at the expense of herbaceous production, thereby negatively affecting grazer populations (Smit 2001; MacGregor & O’Connor 2002). Indications suggest that tree cover recently expanded in the study area. I analysed a time series of aerial photographs of ten random sites (one hectare each) in a Mopane dominated area (northeastern Timbavati PNR) and found that the tree cover increased (ANOVA, F2,29=4.1, P<0.05) on average with 43% from 1944 to 2000 (Fig. 1.3a).
Figure 1.3 (a) The increase in tree cover from 1944 to 2000 in 10 one-hectare plots in the
northern parts of the Timbavati Private Nature Reserve. Tree cover was
determined from a series of aerial photographs. Means and 95% confidence
intervals are shown. (b) The relationship between tree cover and herbaceous
aboveground biomass for nine 50 x 50 ha plots (untreated) in the northern parts
of the Timbavati Private Nature Reserve (Chapter 3). A convex (logarithmic)
relationship was used following Scholes (2003). The herbaceous aboveground
biomass values are the means of three consecutive wet seasons (2005/2006,
2006/2007 and 2007/2008). Tree cover was determined in the 2006/2007 season,
also from aerial photographs.
Assuming that the relationship between tree cover and aboveground herbaceous biomass, established in the same area but different sites (Fig. 1.3b), also holds for the change in tree cover over time, it suggests that the tree increase over time resulted in a 50% decline in aboveground herbaceous biomass.
(b)
y = 2771.2e-0.0431x
R2 = 0.65
0
500
1000
1500
2000
0.0 10.0 20.0 30.0 40.0
Tree cover (%)
He
rba
ceo
us
bio
ma
ss
(kg
DM
ha-1
)

Chapter 1
9
In the APNR, commercial livestock farming (mainly cattle) was widely practiced during the first half of the 20th century, but proved uneconomical due to poor market access, predator problems (mainly lion) and the high prevalence of tick borne diseases. Around 1970, livestock ranching was finally abandoned and wildlife related enterprises, i.e., eco-tourism, became the dominant land use form. The game fences separating the individual reserves and the KNP were finally removed by 1993, enabling wildlife to move freely between the conservation areas (Bigalke 2000). Prominent large herbivore species occurring in the APNR include: African elephant, giraffe Giraffa camelopardalis, African buffalo Syncerus caffer, zebra Equus burchelli and impala Aepyceros melampus. The numbers of blue wildebeest Connochaetes taurinus has recently declined, while buffalo and elephant numbers increased. Predators include lion Panthera leo, leopard Panthera pardus and spotted hyena Crocuta crocuta.
Fires in the APNR are controlled and generally exceed a fire return period of three years. No fires occurred during the study period at any of the experimental sites. The high density and evenly distributed artificial water provision in the APNR, assures that drinking water is not limiting large animal numbers per se (Walker et al. 1987). Limited trophy hunting is practised in the reserves to fund management activities.
Layout of thesis Resource partitioning between trees and grasses in dry savannas is complexly controlled by the interplay of water, large herbivores and nutrients. In the following chapters, examples of either direct effects of nutrients on resource partitioning or interactions involving nutrients are presented, as outlined in Fig. 1.4. Chapter 2 describes a competition experiment where the competitive effects of year-old C. mopane seedlings and naturally established grasses on each other were determined under different nutrient and water availability conditions. The main aim of this experiment was to better understand how the strength of competition is affected by different resource availability regimes, as this is important to understand how tree seedling establishment success is influenced by changes in resource availability. The success of tree seedling establishment exercises large control over the relative dominance of trees in dry savannas (Higgins et al. 2000; Sankaran et al. 2008). Chapter 3 describes a large field fertilization experiment. Using fertilizer, a gradient in the scale of soil nutrient patchiness in 50 x 50 m plots was created (i.e., fertilization of either 25 2 x 2 m patches, five 10 x 10 m patches or evenly distributed over the whole 50 x 50 m plot) in such a way that the within-patch nutrient concentration varied independently from the scale of patchiness. The design allows the analyses of the effects of scale of patchiness when within-patch nutrient concentrations are controlled, as well as the effect of local nutrient concentration. Over a three-year period local tree, grass and large herbivore responses were monitored. The main aims of this experiment were to test the notion that the scale of
Nutrients and savannas
10
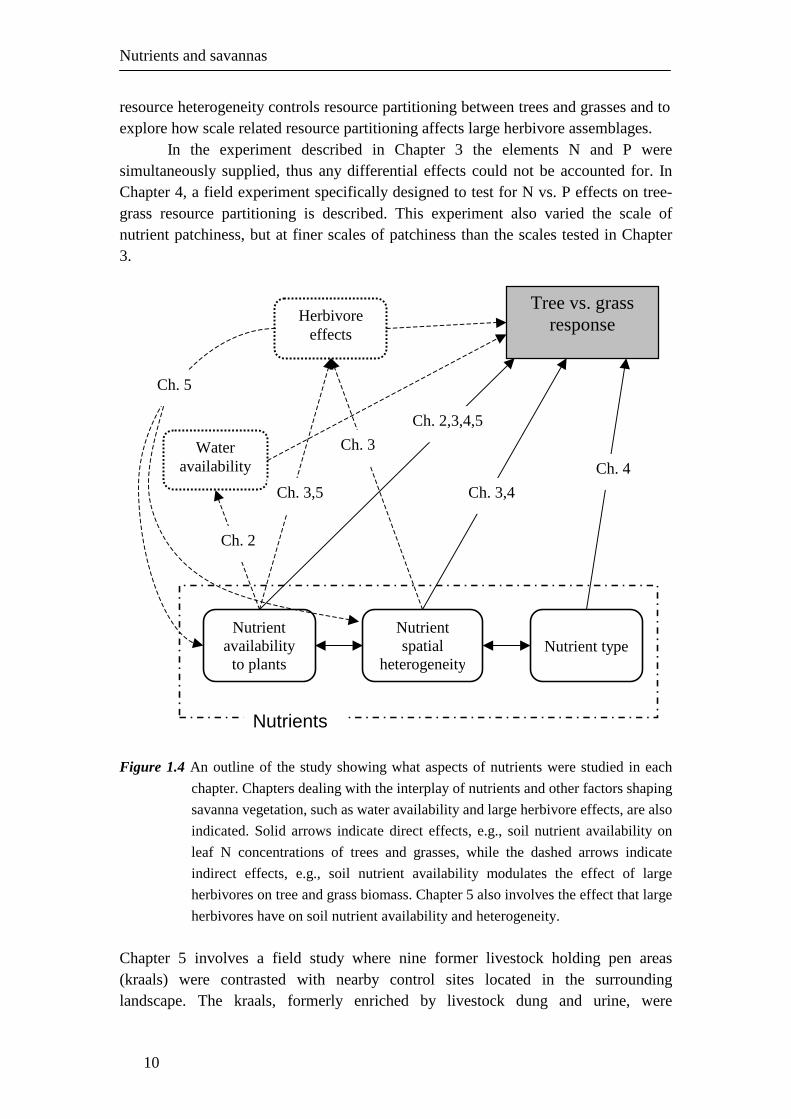
resource heterogeneity controls resource partitioning between trees and grasses and to explore how scale related resource partitioning affects large herbivore assemblages.
In the experiment described in Chapter 3 the elements N and P were simultaneously supplied, thus any differential effects could not be accounted for. In Chapter 4, a field experiment specifically designed to test for N vs. P effects on tree-grass resource partitioning is described. This experiment also varied the scale of nutrient patchiness, but at finer scales of patchiness than the scales tested in Chapter 3. Figure 1.4 An outline of the study showing what aspects of nutrients were studied in each
chapter. Chapters dealing with the interplay of nutrients and other factors shaping
savanna vegetation, such as water availability and large herbivore effects, are also
indicated. Solid arrows indicate direct effects, e.g., soil nutrient availability on
leaf N concentrations of trees and grasses, while the dashed arrows indicate
indirect effects, e.g., soil nutrient availability modulates the effect of large
herbivores on tree and grass biomass. Chapter 5 also involves the effect that large
herbivores have on soil nutrient availability and heterogeneity.
Chapter 5 involves a field study where nine former livestock holding pen areas (kraals) were contrasted with nearby control sites located in the surrounding landscape. The kraals, formerly enriched by livestock dung and urine, were
Tree vs. grass response
Nutrient spatial
heterogeneity
Nutrient type
Nutrient availability to plants
Water availability
Herbivore effects
Ch. 4
Ch. 3,4
Ch. 2,3,4,5
Ch. 2
Ch. 3,5
Ch. 3
Nutrients
Ch. 5

Chapter 1
11
abandoned around 1970 and wildlife utilization then became the predominant form of land use. Soil nutrient status, tree and grass biomass patterns and large herbivore use were contrasted. The aim of this study is to gain insight into how management-related nutrient imprints on savanna landscapes influence the vegetation structure and large herbivore assemblages afterwards. Therefore not only the effects of nutrients on savannas were considered (Chapters 2-4), but also feedbacks of large herbivores on soil nutrient availability (Chapter 5).
Finally, in Chapter 6, I synthesised what was learnt about the control of nutrient heterogeneity on savanna vegetation structure in an intact semi-arid savanna. Referring to related published work, I have attempted in this chapter to place the findings of this study in the broader context of savanna ecology in general. Lastly, the implications for the management of savannas were discussed.

Nutrients and savannas
12

Chapter 2
13
Chapter 2
Water and nutrients alter herbaceous competitive effects on tree seedlings in a semi-arid savanna
Cornelis van der Waal, Hans de Kroon, Willem F. de Boer, Ignas M.A. Heitkőnig, Andrew K. Skidmore, Henrik J. de Knegt, Frank van Langevelde, Sipke E. van Wieren, Rina C. Grant, Bruce R. Page, Rob Slotow, Edward M. Kohi, Emmanuel Mwakiwa and Herbert H.T. Prins
Published in Journal of Ecology 97, 430-439 (2009)
Nutrients and savannas
14
Abstract 1. Globally, both climatic patterns and nitrogen deposition rates show directional
changes over time. It is uncertain how woody seedlings, which co-exist with herbaceous plants in savannas, respond to concurrent changes in water and nutrient availability.
2. We investigated competition effects between herbaceous vegetation and tree seedlings (Colophospermum mopane) under changed water and nutrient (fertilized) conditions in a garden experiment situated in a semi-arid savanna.
3. Herbaceous competition significantly suppressed woody seedling growth. The effect of herbaceous competition on woody seedling growth remained constant with both increasing water and nutrient availability. However, during a wet-season drought, herbaceous competition apparently caused premature leaf senescence in non-irrigated treatments. Fertilization exacerbated negative competition effects during the drought, while irrigation prevented leaf loss of tree seedlings in spite of herbaceous competition and fertilization.
4. Based on a conceptual model, we propose that the vigorous response of herbaceous plants to increased nutrient availability leads to faster depletion of soil water, which increasingly causes water stress in woody seedlings if the interval between watering events is prolonged, e.g., during wet-season droughts.
5. Our data support the notion that changes in drought frequency are of greater importance to woody recruitment success than changes in annual rainfall amount. Based on the water and nutrient interactions observed in our experiment, we suggest that the effect of increased nitrogen deposition on woody seedling recruitment is contingent on water availability.

Chapter 2
15
Introduction The rapid increase in dominance of woody species over herbaceous plants observed in many savannas around the globe (bush encroachment) highlights the sensitivity of woody-herbaceous biomass ratios to changed environmental conditions (Scholes & Archer 1997; Sankaran et al. 2005; Sankaran et al. 2008). The ratio between tree and grass biomass is important, because it affects animal production, shapes animal assemblages and determines carbon sequestration capacities (Scholes & Archer 1997; Sankaran et al. 2005; Prins & Gordon 2008). The current understanding is that water availability primarily affects the relative proportion of woody to herbaceous vegetation of an area, and that soil factors (e.g., soil texture and fertility) and factors usch as fire and herbivory are of secondary importance (van Langevelde et al. 2003; Sankaran et al. 2005; de Knegt et al. 2008; Groen et al. 2008; Sankaran et al. 2008). Moreover, resource availability in savannas is undergoing directional changes. For instance, in an analysis of changes in soil moisture and drought between 1950 and 2000, Sheffield & Wood (2008) found a drying trend, accompanied by an increase in spatial extent of droughts in Africa, while soil moisture increased in Australia over the same period. In addition, artificially enhanced nitrogen deposition, e.g., a three- to fourfold increase in nitrogen deposition in parts of southern Africa (Scholes et al. 2003), is also occurring (Bouwman et al. 2002; Dentener et al. 2006). These trends are likely to continue into the future (Dentener et al. 2006; Sheffield & Wood 2008), but the responses of woody vs. herbaceous plants to these changes are still uncertain (Scholes & Archer 1997; House et al. 2003; Sankaran et al. 2004; Sankaran et al. 2005). Here we aim to contribute to the understanding of woody recruitment responses to changed water and nutrient availability. In savannas, woody cover generally increases with increasing mean annual precipitation (Scholes et al. 2002; Sankaran et al. 2005; Sankaran et al. 2008), therefore woody cover is expected to track changes in annual rainfall patterns (Sankaran et al. 2008). In arid and semi-arid (dry) savannas, seedling recruitment apparently regulates woody cover (Higgins et al. 2000; van Wijk & Rodriguez-Iturbe 2002; Sankaran et al. 2004), although not in all species (Seymour 2008). Woody seedlings are intolerant of wet season droughts and successful recruitment is dependent on a continuous water supply (Harrington 1991; O'Connor 1995; Wilson & Witkowski 1998; Higgins et al. 2000; Kraaij & Ward 2006), which tends to occur more frequently as mean annual precipitation increases. In addition, herbaceous plants, which coexist with woody plants in savannas, compete for water, nutrients and light and can pose an important hurdle to establishing woody seedlings (Scholes & Archer 1997; House et al. 2003). However, it is not clear how the strength of competition between herbaceous plants and woody seedlings changes with increasing water availability. We propose two scenarios for explaining the positive water-availability – woody-recruitment pattern: (1) the effect of herbaceous-species competition remains constant (additive effect) over a water-availability gradient although the net supply of water for plant use increases (Fig. 2.1a) or (2) herbaceous

Nutrients and savannas
16
plants – seedling competition relaxes with increasing water availability (Fig. 2.1b). Distinguishing between these competition scenarios has direct implications for the management of dry savannas, where disturbances such as overgrazing, which lowers the competitiveness of the herbaceous layer, has been implicated as a cause of bush encroachment (Harrington 1991; Jeltsch et al. 1997; Scholes & Archer 1997).
Figure 2.1 Hypothetical relationships between the performances of target plants growing in
the absence (solid lines) or presence (dashed lines) of competition under
increasing resource availability. The difference in performance between plants
with and without competition represents the effect of competition on target
plants. In (a) the effect of competition on target plants remains constant with
increasing resource availability, in (b) the effect of competition diminishes with
increasing resource availability, while in (c) the effect of competition increases
with increasing resource availability.
In contrast to the positive water availability – woody cover relationship, woody cover is negatively related to nutrient (e.g., nitrogen) availability in savannas (Sankaran et al. 2008), apparently because performance of woody seedlings in herbaceous swards is adversely affected by soil fertility (Cohn et al. 1989; Kraaij & Ward 2006). Woody cover is therefore predicted to be negatively affected by enhanced nitrogen deposition (Sankaran et al. 2008). Furthermore, Cohn et al. (1989) and Debain et al. (2005) demonstrated in competition experiments that the negative effect of fertilization on seedling performance is caused by the intensification of herbaceous competition on seedlings under fertile conditions (Fig. 2.1c) and not by direct effects of high nutrient availability on seedlings. Little is known, however, about the interactions between water and nutrient availability on the competitiveness of herbaceous swards and establishing woody seedlings. This knowledge gap hampers predictions of woody

Chapter 2
17
cover responses to concurrent changes in water and nutrient availability. A possibility is that the increased herbaceous competitiveness under fertile conditions is not caused by the direct pre-empting of nutrients by herbaceous plants, but indirectly by lowering the availability of an intermediary resource, which in turn limits the growth and survival of seedlings (Cohn et al. 1989). As water is a likely intermediary resource (Davis et al. 1998; Debain et al. 2005), it follows that dry conditions are expected to exacerbate negative fertilizer effects, by intensifying competition between herbaceous plants and woody seedlings. In this paper we report on the findings of an experiment conducted in a semi-arid savanna where we studied the effect of herbaceous competition on establishing woody seedlings in relation to manipulated water and nutrient conditions. For this purpose we used the model tree species, Colophospermum mopane (Kirk ex Benth.) Kirk ex J. Léonard. Colophospermum mopane (Mopane) was chosen because it currently covers more than 500 000 km2 of southern African lowlands where livestock production, game ranching and conservation are the main forms of land use (Smit 2001; MacGregor & O’Connor 2002). Mopane has also been implicated as a bush encroacher, forming dense monotypic stands, and its proliferation occurs at the expense of herbaceous production and dry season woody foliage retention, thereby negatively affecting both grazer (Smit 2001; MacGregor & O’Connor 2002) and browser populations (Smit 2001), with potential negative impacts on biodiversity.
We expressed competition in terms of the absolute effect of competitors (herbaceous plants) on target plant (woody seedling) performance, because the size of seedlings at the end of the growing season is positively correlated with their subsequent survival chances during the dry season (Poorter 2005). We tested the following hypotheses: (1) competition between herbaceous vegetation and woody seedlings relaxes with increasing water availability (Fig. 2.1b), (2) competition between herbaceous vegetation and woody seedlings intensifies with increasing nutrient availability (Cohn et al. 1989; Kraaij & Ward 2006) (Fig. 2.1c), (3) competition effects of herbaceous plants on establishing woody seedlings are greatest under low water-availability and high nutrient-availability conditions (Davis et al. 1998).
Material and methods Study site
The study was conducted in the Timbavati Private Nature Reserve in South Africa in a fenced area (24º15’02’’S, 31º23’36’’E) from where large herbivores (>5kg) were excluded. The experiment was laid out in an open, i.e., non-wooded, flat area on a crest. The area had been annually mowed in the past, and had to our knowledge not been fertilized before.
The soil at the study site is derived from granite (Venter et al. 2003). Topsoil samples (0-15 cm depth) of the study site were sent to the Agricultural Research Council’s laboratory in Nelspruit, South Africa, for standard analyses according to

Nutrients and savannas
18
procedures in the Handbook of Standard Soil Testing Methods for Advisory Purposes (Anonymous 1990). The soil is coarsely textured (88% sand: 2% silt: 10% clay) and poor in macro nutrients (e.g., 4.4-6.4 mg P (Bray 1) kg-1 soil, 457 mg Ca kg-1 soil, 131 mg K kg-1 soil). The topsoil contained total nitrogen amounts of 0.55-0.65 g N kg-1 and total carbon values of 5.8-7.0 g C kg-1 soil (C/N ratio = 10.4-10.7).
The long term mean rainfall (1983-2004) is about 450 mm (Ingwalala rainfall station 10 km N), of which 78% is received between October and end of March. The mean maximum temperature for the Satara weather station (50 km E) during January (hottest month) is 33.7 ºC and the mean minimum temperature for June (coolest month) is 9.4 ºC (Venter et al. 2003).
Experimental setup
We compared the growth response of the focal species (C. mopane) in isolation with its response in the presence of herbaceous competitors. The competition series consisted of a single Mopane seedling, herbaceous plants only and a mixture of the two, which allowed us to deduce effects of herbaceous vegetation on seedlings and, conversely, seedling effects on herbaceous swards, e.g., Cahill et al. (2005). In the single-Mopane-seedling treatment, plots were kept clear of herbaceous plants by monthly hoeing, although more frequent hoeing was necessary to keep herbaceous plants out at the start of the experiment. The first hoeing was done in December 2006. The cleared material was removed from the plots. Experimental plots (n=120) were 1.5 x 1.5 m in size. Treatments followed a two-way factorial design with two water availability levels and two fertilizer levels in a split-plot layout. The experiment was spatially divided into five blocks (7 x 10 m per block), each split in quarters. A buffer area of at least 0.5 m width separated blocks and block quarters. The four water- and nutrient-treatment combinations were randomly allocated among the block quarters with the provision that the two water addition treatments (irrigated-fertilized and irrigated-non-fertilized) were placed adjacent to each other to facilitate the irrigation process. Two single C. mopane plots, two herbaceous monoculture plots and two mixtures were randomly allocated to block quarters, which means that all competition-series treatment combinations were replicated ten times.
Pre-treatment
The study site was ploughed (about 20 cm deep) and tilled in the 2006 dry season to homogenize the soil and to give all treatments the same starting conditions. The natural establishment of herbaceous species in the new growing season was allowed, but as a precaution against poor herbaceous establishment, locally collected seeds of Urochloa mosambicensis, a locally dominant grass species, were sown into herbaceous-only and mixture plots (n=80) in November 2006 and supplied with 3 mm (7 L plot-1) water by hand. By December 2006 the herbaceous layer, comprising of different species (see result section), reached about 15 cm height and densely covered all plots. In December 2006, a single, year-old C. mopane seedling was planted in the

Chapter 2
19
centre of plots (n=80). During December 2006 an additional 38 mm (85 L plot-1) water was supplied by hand to all plots (n=120), to facilitate the establishment of both herbaceous and C. mopane seedlings.
The Mopane seedlings were earlier propagated from seeds collected in the study area and grown in a nursery in nursery bags filled with a mixture of coarse river sand and commercial potting soil. Seedlings were grouped into five size classes and randomly allocated to the five experimental blocks. At the start of the experiment the seedlings were 0.75 ± 0.02 m tall and had 39 ± 2 leaves per seedling (mean ± SE).
Irrigation and fertilizer treatments
A drip irrigation system was installed using pressure self-regulating drippers with an inline spacing of 300 mm and a supply rate of 1 L h-1 dripper-1. Three parallel dripper lines per plot ensured an even distribution of water in the irrigated plots. Low retaining walls surrounded each plot to prevent runoff water spilling over on adjacent plots. In total 13 irrigation events, each supplying about 15 mm, were supplied from the end of January to early May 2007. A locally developed water budget model (Sapwat; www.sapwat.org.za) was used to determine when to irrigate. The model predicts the soil water status over time from generalized evapotranspiration data and current rainfall and irrigation data and indicates when to irrigate to avoid water stress in plants. The scheduling of irrigation events in our experiment simulated an increase in the frequency of rainfall events, by irrigating between rainfall events, rather than increasing the intensity of rainfall events. A comparison of dry and wet rainfall seasons (seasons that deviated by more than 10% below and above, respectively, from the long-term mean) for the nearby Satara weather station in the Kruger National Park revealed that the frequency of rainfall events during wet years (52.3 ± 9.6, mean ± SD) was significantly higher than during dry years (28.5 ± 5.3; t=7.402, d.f.=20, P<0.001), while the median rainfall amount per event was not significantly different between dry and wet years (Mann-Whitney U test, Z=-0.97, P>0.05). This suggests that our manipulation of the frequency of rainfall events is more realistic than the manipulation of rainfall intensity would be. We used a commercial NPK fertilizer. The fertilizer was evenly spread by hand and a total of 22.5 g N m-2, 15 g P m-2 and 7.5 g K m-2 was supplied on two occasions, two thirds on 21 December 2006 and the remainder on 12-14 February 2007. Our nitrogen fertilizer amount was comparable to that used by Ludwig et al. (2001), and is in line with local fertilizer recommendations for commercial, irrigated summer pastures (Dickinson et al. 1990). In the Kruger National Park the annual amount of nitrogen mineralized at a site comparable to our study site, was estimated at 5.8 g N m-2 yr-1 (Scholes et al. 2003), suggesting that we increased local nitrogen availability about 4 times above background levels by fertilization. Measurements
After the seasonal senescence of the herbaceous layer, at the end of May 2007, plots were harvested with shears, once the species composition had been assessed. The

Nutrients and savannas
20
aerial cover of each individual herbaceous species (forbs as a group), was assessed in the inner 1 m2 plot area according to the Braun-Blanquet scale (Kent & Coker 1994). We clipped the herbaceous material of plants rooted within the inner 1 m2 plot area at a height of approximately 8 cm above ground level and the total biomass per plot was weighed in the field. The moisture content of sub-samples (n=20) was determined after drying sub-samples at 70 ºC for 48 hours in a drying oven. Field biomass values were adjusted accordingly. The nomenclature of grass species follows Gibbs Russel et al. (1990).
On 5 March 2007 all leaves on Mopane seedlings were counted, the plant height measured and the diameter of stems measured with callipers. Stem diameter was measured about 2 cm above ground level. Because the immature leaves that were still folded might not have matured, immature leaves were omitted from leaf counts. Following a wet season drought during February-March 2007 (Fig. 2.2a), senescing leaves were counted on 30 March 2007. Senescing leaves were defined as leaves where more than half the leaf area was necrotic (brown and crisp). Studies in both semi-arid grassland (Harrington 1991) and tropical forests (Engelbrecht et al. 2006; Engelbrecht et al. 2007; Slot & Poorter 2007) showed that visual signs of water stress are good predictors of actual water stress and subsequent survival in woody seedlings. New growing season shoot length was measured on 4 April 2007. In C. mopane a distinctive dry season scar indicates the start of new season growth. We summed the length of all new shoots per seedling.
Statistical analysis The fixed effects of competition, fertilization and irrigation were analyzed using a full factorial, three-way ANOVA for herbaceous production, and a full factorial, three-way MANOVA for C. mopane shoot growth, leaf number, plant height and stem diameter in a full-factorial design. Competition (present, absent), water (irrigated, non-irrigated) and nutrients (fertilized, non-fertilized) were treated as fixed factors. Block was included as a random factor. Untransformed herbaceous biomass data followed a normal distribution (Kolmogorov-Smirnov, P>0.05) and had equal variances (Levene’s test of equality of error variances, P>0.05). All C. mopane variables were logarithmically transformed to meet the ANOVA assumptions. A significant competition x resource interaction implies that the competition effect of the one growth form on the other was affected by the amount of resources (e.g., either Fig. 2.1b or Fig. 2.1c); an insignificant competition x resource interaction is depicted in Fig. 2.1a. Tukey’s multiple comparison tests were used to detect differences between subgroups. The proportion of leaves surviving the drought was calculated from the total number of leaves before the drought occurred, minus senesced leaves per seedling. Leaf proportion data were arcsine-transformed and subjected to a full factorial, three-way ANOVA similar to the procedures described for herbaceous production.
All tests were carried out in SPSS version 12.

Chapter 2
21
Figure 2.2 (a) Accumulative water availability (mm) for irrigated (wet) and not irrigated
(dry) treatments from November 2006 to end May 2007. Arrows indicate the
timing of fertilization. (b) The water received in controls and irrigation
treatments in relation to the ranked seasonal rainfall (November to end May;
1983 to 2004) for the Ingwalala rainfall station (10 km N), showing that
treatment values are realistic for this system.
Results Water availability
Non-irrigated plots received a total of 390 mm water (878 L plot-1) during the study period (November 2006 to end May 2007), of which 335 mm (754 L plot-1) was received as rain. The difference was supplied during the establishing phase in 2006 (about 40 mm) and in March 2007 (15 mm or 34 L plot-1) to avert seedling mortalities after extremely dry conditions during February and March 2007 (Fig. 2.2a). Irrigated treatments received in total 575 mm water (1 294 L plot-1). Compared to long-term

Nutrients and savannas
22
data for the study area, the water treatments were realistic and represented average and above-average rainfall conditions, respectively (Fig. 2.2b). Herbaceous species composition
The herbaceous cover of plots was dominated by Urochloa mosambicensis (median cover class = ‘26-50%’), while forbs as a group (median = ‘6-25%’), Melinis repens (median = ‘6-25%’) and Brachiaria deflexa (median = ‘6-25%’) were also important. Herbaceous production
Above-ground herbaceous biomass significantly increased with fertilization (P<0.001) and irrigation (P<0.001) (Table 2.1, Fig. 2.3), and these two factors significantly interacted (P<0.05) (Table 2.1, Fig. 2.3). Irrigated-only plots had on average 44% higher herbaceous biomass than controls and fertilized-only plots 64% higher biomass than controls, but differences between irrigated and fertilized biomass were not significant (Tukey, P>0.05). The mean biomass of plots both irrigated and fertilized was significantly (Tukey, P<0.001) higher than irrigated-only and fertilized-only treatments and the mean biomass was increased by 175% relative to controls.
Interestingly, the presence of a single C. mopane seedling per plot significantly suppressed herbaceous above-ground biomass (P<0.01; Table 2.1). The herbaceous biomass in the mixed plots was on average 21% lower than the biomass of herbaceous plants alone (Fig. 2.3). The nutrient x competition and water x competition interaction effects were not significant, indicating that neither fertilization nor irrigation modified the competition effect that C. mopane seedlings exercised on herbaceous biomass (Table 2.1).

Chapter 2
23
Table 2.1. Analysis of variance tests for herbaceous above-ground biomass and C. mopane shoot growth, number of leaves, plant height and stem diameter as
affected by nutrients (two levels), water (two levels) and competition (presence-absence). Absence of competition refers to situations where
herbaceous vegetation and seedlings occurred as monocultures or singly, respectively. Presence of competition refers to mixtures of herbaceous
vegetation and seedlings. Block was included as a random factor. Herbaceous above-ground biomass responses were tested with an ANOVA and C.
mopane responses with a MANOVA. The degrees of freedom, F-value and significance are indicated per factor and factor interactions.
a Significance level; ***, P<0.001; **, P<0.01; *, P<0.05; ns, not significant b Values in brackets are degrees of freedom for Multivariate test
ANOVA MANOVA
Source
Herbaceous
biomass Multivariate test Shoot length Leaf number Plant height Stem diameter
d.f. F-value F-value d.f. F-value F-value F-value F-value
Corrected Model 11 8.635 *** 8.240 *** 5.181 *** 5.640 ***
Intercept 1 281.558 ***a 30523.339(4)b *** 1 26770.254 *** 8879.738 *** 118188.866 *** 15919.821 ***
Nutrient (N) 1 55.335 *** 1.472(4) ns 1 2.068 ns 4.574 * 0.853 ns 0.035 ns
Water (W) 1 34.131 *** 6.251(4) *** 1 6.110 * 3.399 ns 9.755 ** 25.337 ***
Competition (C) 1 9.444 ** 17.987(4) *** 1 62.491 *** 58.991 *** 6.117 * 12.212 **
N x W 1 6.849 * 2.351(4) ns 1 0.001 ns 0.034 ns 9.043 ** 2.047 ns
N x C 1 1.795 ns 1.694(4) ns 1 0.643 ns 0.198 ns 1.784 ns 2.611 ns
W x C 1 0.254 ns 0.951(4) ns 1 2.113 ns 0.013 ns 0.129 ns 0.003 ns
N x W x C 1 1.798 ns 0.625(4) ns 1 0.751 ns 0.040 ns 0.354 ns 0.593 ns
Block 4 2.609 * 2.561(16) ** 4 3.972 ** 4.026 ** 5.880 *** 3.343 *
Error 61 59
R2(adjusted) 0.55 0.53 0.40 0.42

Nutrients and savannas
24
Figure 2.3 The responses of target plants growing in the absence of competition (solid
circles) and competing plants (open circles) as affected by (a) irrigation, (b)
fertilization and (c) irrigation plus fertilization. The first column depicts
herbaceous above-ground production (dry mass), the middle column leaf number
per C. mopane seedling and the last column the proportion of leaves per C.
mopane seedling that survived a mid-season drought. The ‘low’ values (x-axis) in
columns represent the same control values, and ‘high’ the response to resource
enrichment. Means ± SE are given. Statistics are also given for the main effects of
irrigation (W), fertilization (N) and their interactions with competition (C).
Superscripts denote: ***, P<0.001; **, P<0.01; *P<0.05; ns, not significant.

Chapter 2
25
Colophospermum mopane seedling growth
The above-ground growth of C. mopane seedlings (represented by shoot length, leaf number, stem diameter and plant height) was significantly increased by irrigation (MANOVA, Wilk’s Lambda, P<0.001) and decreased by herbaceous competition (Wilk’s Lambda, P<0.001), but not significantly affected by fertilization (Table 2.1). Compared to the non-irrigated seedlings, irrigated seedlings had on average more leaves (+21%, P<0.1), longer shoot lengths (+35%, P<0.05), thicker stems (+21%, P<0.05) and were taller (+16%, P<0.05) (Table 2.1). Fertilization significantly increased seedling leaf number (+23%, P<0.05), but the increases in shoot length (+21%) and stem diameter (+1%) were not statistically significant. A significant water x nutrient interaction effect on seedling height (P<0.01) indicated that nutrients mediated the effect of water on seedling height (Table 2.1). Seedlings, both fertilized and irrigated, were taller than seedlings that were only fertilized (Tukey, P<0.05), which in turn could not be statistically distinguished from either controls or watered-only seedlings (Tukey, P≥0.05).
Herbaceous swards suppressed C. mopane growth. Seedling shoot growth (-51%), leaf number (-53%; Fig 2.3), plant height (-11%) and stem diameter (-12%) were all consistently suppressed by the presence of herbaceous vegetation (P<0.01; Table 2.1). The insignificant competition x water and competition x nutrients interaction terms (Table 2.1) indicate that neither water nor nutrient availability altered the suppressing effect of herbaceous vegetation on seedling growth. Thus we fail to reject the null hypotheses 1 and 2.
Colophospermum mopane drought response
The proportion of C. mopane leaves that survived the mid-season drought, an indicator of water stress (Engelbrecht et al. 2007), varied significantly among the different combinations of competition, water and nutrient treatments (Fig. 2.3). Considering first the main effects; the surviving leaf proportion was highly significantly affected by herbaceous competition (F1,61=108.1, P<0.001) and irrigation (F1,61=223.9, P<0.001), but not fertilization. Block (random factor) was also not significant (P>0.05). Significant two-way interactions were found for competition x water (F1,61=110.9, P<0.001) and competition x nutrients (F1,61=9.9, P<0.01), but not for the water x nutrient interaction (P>0.05). A significant (F1,61=6.4, P<0.05) three-way interaction was found for competition x water x nutrients. Treatments that received water had the highest proportion of surviving leaves and were not significantly different from each other (Tukey, P>0.05). Leaf survival of single-control seedlings was lower (Tukey, P<0.05) than that of single seedlings receiving both irrigation and fertilizer, but was higher than in the two dry-mixture treatments (Tukey, P<0.001; Fig. 2.3). In turn, fertilized dry-mixture seedlings had lower surviving leaf proportions than unfertilized, dry-mixture seedlings (Tukey, P<0.01; Fig. 2.3b). We therefore conclude that: (1) Wet season leaf senescence was largely prevented either by irrigating mixtures or by eliminating grass competition (Fig. 2.3a). (2) Under dry conditions, more leaves died when C. mopane seedlings were fertilized

Nutrients and savannas
26
(Fig. 2.3b). (3) This negative effect of fertilization was reversed when water was supplied in addition to fertilizer (Fig. 2.3c). Thus the C. mopane seedling drought response supports hypothesis 3.
Discussion Response differences to water and nutrient addition between herbaceous swards
and woody seedlings
Herbaceous above-ground biomass was highly significantly affected by both fertilization and irrigation, which confirms that herbaceous production in African savannas is strongly co-limited by water and nutrients (Penning de Vries & Djitèye 1982; Donaldson et al. 1984; Snyman 2002; Fynn & O'Connor 2005). The large response of the herbaceous layer to fertilization accentuates that the low natural concentrations of the nutrients added, N, P and K, put severe constraints on herbaceous production in the study area. The interaction between water and nutrients, where the relative effect of nutrients on herbaceous biomass production was amplified when irrigated (Fig. 2.3c), is in agreement with other studies in semi-arid areas (Penning de Vries & Djitèye 1982; Snyman 2002), showing that the magnitude of a fertilizer response increases as water availability improves. The above-ground growth response of C. mopane seedlings to increasing resource availability was more subdued than the marked response of the herbaceous layer exposed to similar resource levels. Moreover, the responses of the two growth forms to resource additions were that C. mopane growth was relatively more affected by water than nutrients (leaf number is an exception), while the herbaceous vegetation responded relatively stronger to fertilization compared to irrigation. Grasses invest a higher fraction of biomass to nutrient-demanding resource-capturing tissue (e.g., photosynthetic active leaves), which feeds back to faster relative growth rates (Poorter & Nagel 2000), while trees allocate more biomass towards woody structure, which is carbon rich, but nutrient poor (Bond et al. 2003). In addition, the C-4 photosynthetic pathway followed by grasses in the study area offers higher water and nitrogen use efficiencies, compared to the less efficient C-3 photosynthetic pathway followed by C. mopane (Ehleringer & Monson 1993; Turekian et al. 1998). Thus for a unit increase in a limiting resource, more biomass is produced in C-4 plants than in C-3 plants, which presents a competitive advantage for C-4 grasses.
Competition effects of woody seedlings on herbaceous plants
The significant suppression of the herbaceous production associated with single juvenile C. mopane seedlings is surprising and demonstrates the competitive ability of C. mopane, even at a young stage. A C. mopane thinning experiment, involving mostly mature trees, showed a strong negative correlation between C. mopane density and herbaceous production in an arid savanna (Smit & Rethman 2000), apparently because the shallow rooting pattern of C. mopane (about 60% of C. mopane root mass was found in the top 40 cm soil layer) increases opportunities for below-ground

Chapter 2
27
interaction with herbaceous roots (Smit & Rethman 1998). The tendency of C. mopane to form dense monotypic stands (MacGregor & O’Connor 2002), where grasses are largely excluded (Smit 2001, 2004), suggests that C. mopane facilitate the establishment of its own seedlings by suppressing the competing herbaceous vegetation in a positive feedback loop. Our results further suggest that seedlings already contribute to this process by suppressing neighbouring herbaceous plants. The suppression of herbaceous production by mature woody plants are widely reported for other systems (references in Scholes & Archer 1997; Smit 2004), but we are unaware of other studies demonstrating self facilitation by juvenile woody plants.
Herbaceous competition effect on woody seedlings as affected by water and nutrient
availability
On account of the growth data, hypothesis 1, which states that the competition between herbaceous vegetation and woody seedlings relaxes with increasing water availability, was not supported (Fig. 2.3a). Instead we found that the effect of water availability on competition was additive. However, we have to qualify this statement. First, we only explored average and above-average water availability levels characteristic of the study area (390 vs. 575 mm yr-1). It therefore remains uncertain whether the effect of herbaceous competition will remain additive if a larger range in water availability is explored, especially towards the lower end in water availability. For example, the low availability of water during a mid-season drought strongly increased the competitiveness of swards as indexed by the premature leaf senescence of the C. mopane seedlings, which might have resulted in mortalities if the drought had persisted for a few more days. As it was, all seedlings recovered. Wet season droughts of more than 30 days, which can occur even in average years, can lead to woody seedling mortality (references in Higgins et al. 2000). To summarize, the strength of herbaceous competition on woody seedlings appears to remain constant with increasing water availability under non-drought conditions, but may intensify under drought conditions. For woody seedlings establishing in herbaceous swards this implies that the temporal distribution of watering events is more important than changes in the total amount received (Wilson & Witkowski 1998).
Moreover, although the C. mopane growth data suggest an additive effect of herbaceous competition with increasing nutrient availability (not supporting hypothesis 2; Fig. 2.1a), the leaf senescence pattern observed in our study contradictorily supports hypothesis 2, i.e., that herbaceous competition effects on seedlings increase under fertile conditions. Also, in support of hypothesis 2, the density of live C. mopane germinants (cotyledons still present), which established naturally in herbaceous swards in a concurrent field experiment during November and December 2007, was negatively affected by fertilization in spite of similar seed densities (C. van der Waal, unpublished data). For example, areas fertilized at 6 g N m-2 and 30 g N m-2 had on average 1.9 and 0.3 C. mopane germinants per 100 m2, respectively, compared to the 9.8 germinants per 100 m2 of controls. This supports the

Nutrients and savannas
28
notion that woody recruitment in fertile areas is constrained by intensified herbaceous competition (Sankaran et al. 2008). Davis et al. (1998) hypothesized that the suppressing effect of fertilization on establishing seedlings operates indirectly through the pre-empting of soil water resources by vigorous herbaceous growth. However, the nutrient x competition interaction effect in our study only emerged during a wet-season drought, suggesting that the effect of nutrients on the competitiveness of the herbaceous layer is contingent on background water supply rates. This is clearly illustrated in our study by the reversal of the negative fertilizer effect (premature leaf senescence) when additional water was supplied (Fig. 2.3a & b). We propose the following mechanism to explain these phenomena based on a conceptual model (Fig. 2.4). Herbaceous growth in fertile conditions is vigorous (e.g., Fig. 2.3b), which results in increased transpiration rates and thus faster depletion of soil water reserves
Figure 2.4. A conceptual model of the influence of fertilization of herbaceous plants –
woody seedling mixtures on plant available water (PAW) over a wet-season
drought period, illustrating the water stress consequences for establishing
woody seedlings. The solid line indicates PAW for fertilized mixtures and the
dotted line PAW for non-fertilized mixtures. Vertical arrows indicate the timing
of rainfall events (under higher rainfall conditions more rainfall events would
occur over the same time period). The horizontal dashed line shows the water
stress threshold for woody seedlings, below which seedlings experience water
stress. The illustration shows that seedlings in fertilized mixtures experience
water stress for a longer period (distance a-c) and more intensely (lower PAW)
than seedlings in non-fertilized mixtures (distance b-c, higher PAW).

Chapter 2
29
after a watering event relative to water use in infertile soils (Fig. 2.4). Fertilized swards wilted at an earlier date than controls under drying conditions (Snyman 2002) and soils of fertilized swards were significantly drier one day and 10 days after a watering event (Kraaij & Ward 2006). This, in turn, increases the period (period a-c vs. b-c in Fig. 2.4) and severity of water stress seedlings are exposed to (Wilson & Witkowski 1998; Poorter 2005). In our conceptual model more frequent watering shortens the period that seedlings experience critical water stress and thus facilitates woody seedling establishment.
Comparison of the response of C. mopane and other African woody species to
herbaceous competition and resource availability
In agreement with our results for C. mopane seedlings, other studies also found suppressing effects of herbaceous vegetation on the growth and survival of various Acacia species (Knoop & Walker 1985; Cramer et al. 2007) and Euclea divinorum (Sharam et al. 2006), although O’Connor (1995) showed that A. karroo seedlings were not negatively affected by herbaceous competition in his study.
In terms of resource availability, most studies agree with our results that savanna woody seedlings benefit from an increase in the frequency of watering and are negatively affected by wet-season droughts (Wilson & Witkowski 1998; Higgins et al. 2000; Kraaij & Ward 2006; but see Seymour 2008). However, Kraaij & Ward (2006) showed that A. mellifera seedling growth in herbaceous swards was lower when fertilized with nitrogen, even when frequently watered. This contradicts our growth data where we found additive effects of water and nutrients on C. mopane growth, but agrees with the leaf-loss patterns observed during the wet-season drought for fertilized C. mopane seedlings competing with herbaceous plants.
Implications for woody recruitment in dry savannas under changed water and nutrient
regimes
Recently, Sankaran et al. (2008) predicted that woody cover will track changes in mean annual precipitation and that woody cover will be negatively affected by increased nitrogen deposition. Our study, and others (e.g., Harrington 1991; Wilson & Witkowski 1998; Higgins et al. 2000), emphasized the importance of droughts as an obstacle for woody recruitment in arid and semi-arid areas, suggesting that changes in drought frequency, intensity and duration might be more important than changes in mean annual rainfall. Therefore predictions of recruitment responses of woody plants to climate change should include drought as a factor, especially because drought characteristics (frequency, intensity and duration) are anticipated to change relatively more than total rainfall amount (Trenberth et al. 2003). Furthermore, our data suggest that the effect of increased nitrogen deposition on establishment of woody plants is dependent on water availability; under low water availability (e.g., frequent droughts) recruitment of woody plants will be constrained, while under high, continuous water availability recruitment might be enhanced. If this holds for larger systems as well, we expect that the negative soil fertility – woody cover relationship described by

Nutrients and savannas
30
Sankaran et al. (2008), is modified by water availability; woody cover declines faster along a decreasing rainfall gradient in fertile areas compared to infertile ones.
Lastly, we found that competition effects of herbaceous vegetation on woody seedlings intensified during a wet-season drought, which occurs frequently in dry systems, even during average rainfall years (Wilson & Witkowski 1998). This suggests that disturbances (e.g., overgrazing) that reduce the competitiveness of the herbaceous layer, might lower wet-season drought constraints on seedling establishment of woody plants.
Chapter 2
31
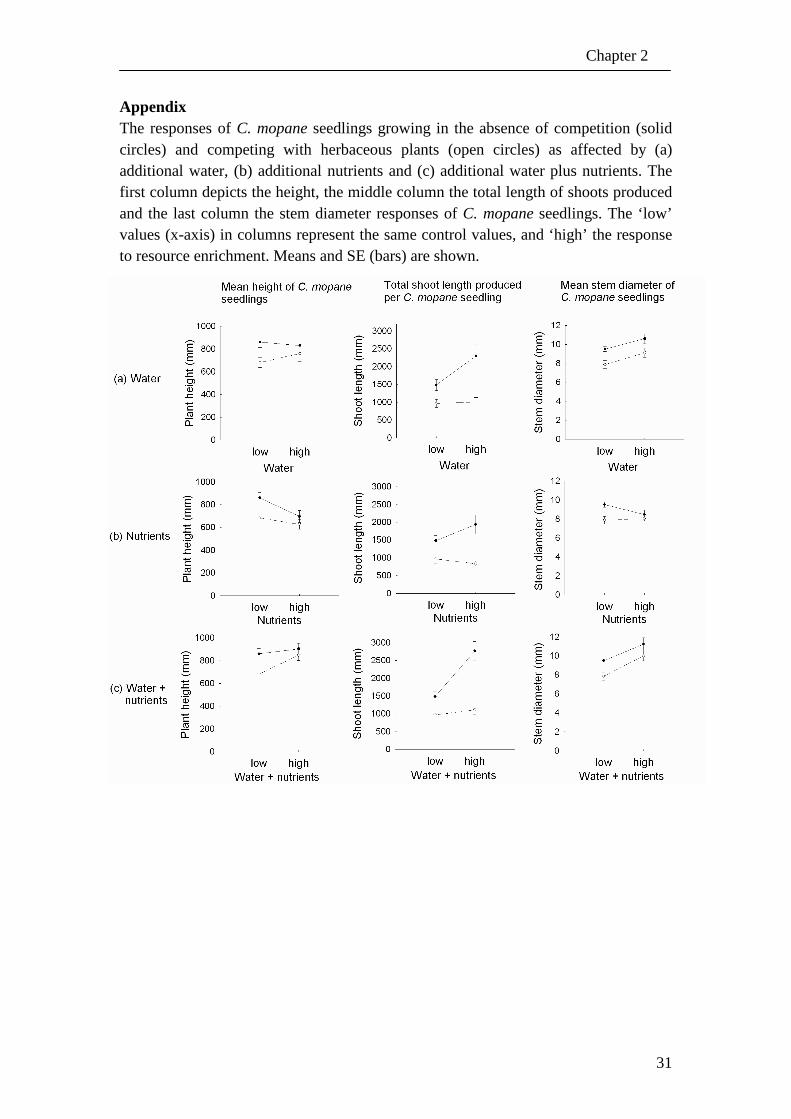
Appendix The responses of C. mopane seedlings growing in the absence of competition (solid circles) and competing with herbaceous plants (open circles) as affected by (a) additional water, (b) additional nutrients and (c) additional water plus nutrients. The first column depicts the height, the middle column the total length of shoots produced and the last column the stem diameter responses of C. mopane seedlings. The ‘low’ values (x-axis) in columns represent the same control values, and ‘high’ the response to resource enrichment. Means and SE (bars) are shown.

Nutrients and savannas
32
Acknowledgements
We are grateful towards Drs T and L Scholtz for making the study site available, the
management of the Associated Private Nature Reserves for granting us permission to carry
out the experiment and Ingwalala Game Reserve for the rainfall data and use of a water cart.
Shell-SA and the Dr. Marie Luttig Trust are thanked for logistical support. The following
people were of great help in carrying out the experiment: Floris van Beest, Tian von Wielligh,
Bennie van der Waal, Ig Viljoen, Ada Kool, Seline Meijer, Alex Munro, Stefan Heunis,
Lizelle van der Waal, Reis Manhique and Pieter Nel. An anonymous referee provided helpful
comments to an earlier draft. The research was funded by NWO - Wotro (grant no.
W01.65.216).

Chapter 3
33
Chapter 3
Herbivores forage for plants, which forage for nutrients: Scale-dependent bi-trophic interactions in a semi-arid savanna Cornelis van der Waal, Hans de Kroon, Frank van Langevelde, Ignas M.A. Heitkönig and Herbert H.T. Prins

Nutrients and savannas
34
Abstract 1. In savannas, resource partitioning between trees and grasses controls the
structure of plant communities. The scale of resource heterogeneity (e.g., fine-grained vs. coarse-grained resource patchiness) may influence how resources are locally partitioned between co-existing large and small organisms such as trees and grasses in savannas. In turn, both grazers and browsers may respond to these differences, resulting in altered impact patterns on the vegetation.
2. In a large field experiment in an intact South African savanna, fertilizer (NPK) was used to create different scales of nutrient patchiness (patch sizes 2 x 2 m, 10 x 10 m or whole-plot 50 x 50 m). Within-patch fertilizer concentration and the total fertilizer load per plot were also varied. Leaf quality, tree shoot growth and herbaceous biomass were monitored for three years as well as estimates of the grazing and browsing impact on the vegetation.
3. For the same local fertilizer concentration, trees in patches were more responsive to patch-size differences than grasses. Outside a two-meter patch buffer, neither trees nor grasses responded to fertilization. Browser impact severity was positively related to the local fertilizer concentration and was strongly affected by the scale of nutrient patchiness. Browser impact increased in the 10 x 10 m patches, which resulted in reduced local tree cover at the end of the experiment, but was unresponsive to fertilization of the 2 x 2 m scale of patchiness treatment. Grazer impact increased with local fertilizer concentration regardless of patch size, and herbaceous biomass was at times reduced below control values at the highest local fertilizer concentration.
4. At plot level, calculations suggest that the total herbaceous off-take by grazers peaked where the same fertilizer amount (15 kg N plot-1) was spread over the whole plot surface rather than concentrated in 10 x 10 m patches in this treatment.
5. In conclusion, the scale of local nutrient patchiness strongly influenced how nutrients were partitioned and locally expressed (above-ground) in trees and grasses. In turn, scale related variation in nutrient partitioning controlled where the grazers and browsers concentrated their impact, which may result in local changes in vegetation structure. The consequences for savanna management were discussed.

Chapter 3
35
Introduction In savannas contrasting life forms, trees and grasses, co-dominate (Scholes & Archer 1997; Sankaran et al. 2005). In turn, the tree and grass layers support a diverse large-herbivore assemblage, reaching a high biomass in places (Scholes & Archer 1997; Olff et al. 2002; Bond 2008). However, how resources are partitioned between co-existing trees and grasses vary widely in space and time and is complexly governed by trait differences (e.g., within-plant resource allocation, photosynthetic pathway, root architecture; Bond 2008) between the growth forms, limitations imposed by resource availability (e.g., water and nutrients) and the strength of disturbances (e.g., herbivory and fire; Scholes & Archer 1997; Sankaran et al. 2004; Sankaran et al. 2008). The relative importance of these factors and the interactions between them, are poorly understood, particularly those involving soil nutrients (House et al. 2003; Sankaran et al. 2004). Improving our understanding in this regard is important, as directional changes in nutrient availability such as increased atmospheric nitrogen (N) deposition (Scholes et al. 2003; Dentener et al. 2006) and local soil nutrient changes due to large herbivore management interventions (Augustine et al. 2003; Augustine & McNaughton 2004) are taking place. How savannas respond to these perturbations is uncertain, but is likely to affect resource partitioning between the tree and grass layers, hence may impact on the ecological services rendered by savannas upon which a large human population relies for their livelihood (Scholes & Archer 1997; Sankaran et al. 2004).
In the study of ecology it is increasingly realised that not only the overall availability of resources, but also how resources become spatially available is important in explaining resource partitioning between organisms (Ritchie & Olff 1999; Hutchings et al. 2003; Cromsigt & Olff 2006). Consider for example the scenario where nutrients become available at increasing scales of patchiness in similarly vegetated savannas; from scales where nutrient patch sizes are much smaller than the root system size of adult trees, but comparable to individual grass root system sizes (i.e., fine-grained), to scales where patches encompass entire tree root systems (i.e., coarse-grained; Fig. 3.1). It follows, that in fine-grained nutrient environments, trees rooted in patches ‘perceive’ only a small increase in nutrient availability, while grasses, whose root system match the size of patches, ‘perceive’ a relatively much higher nutrient availability. As the scale of patchiness increases, trees rooted in patches ‘perceive’ increasingly more nutrients, while grasses mostly experience homogeneous high (within-patch) or low (outside-patch) nutrient availability (Hutchings et al. 2003). Therefore, the scale of resource heterogeneity (e.g., fine-grained vs. coarse-grained patchiness) may influence how resources are locally partitioned between co-existing large and small organisms such as trees and grasses in savannas. In addition, many plant species exhibit strong physiological or morphological responses, e.g., root proliferation in nutrient-rich patches, to patchy soil nutrient environments (Hutchings et al. 2003; Kembel & Cahill 2005; de Kroon & Mommer 2006), which may depend on the scale of heterogeneity. Consequently,
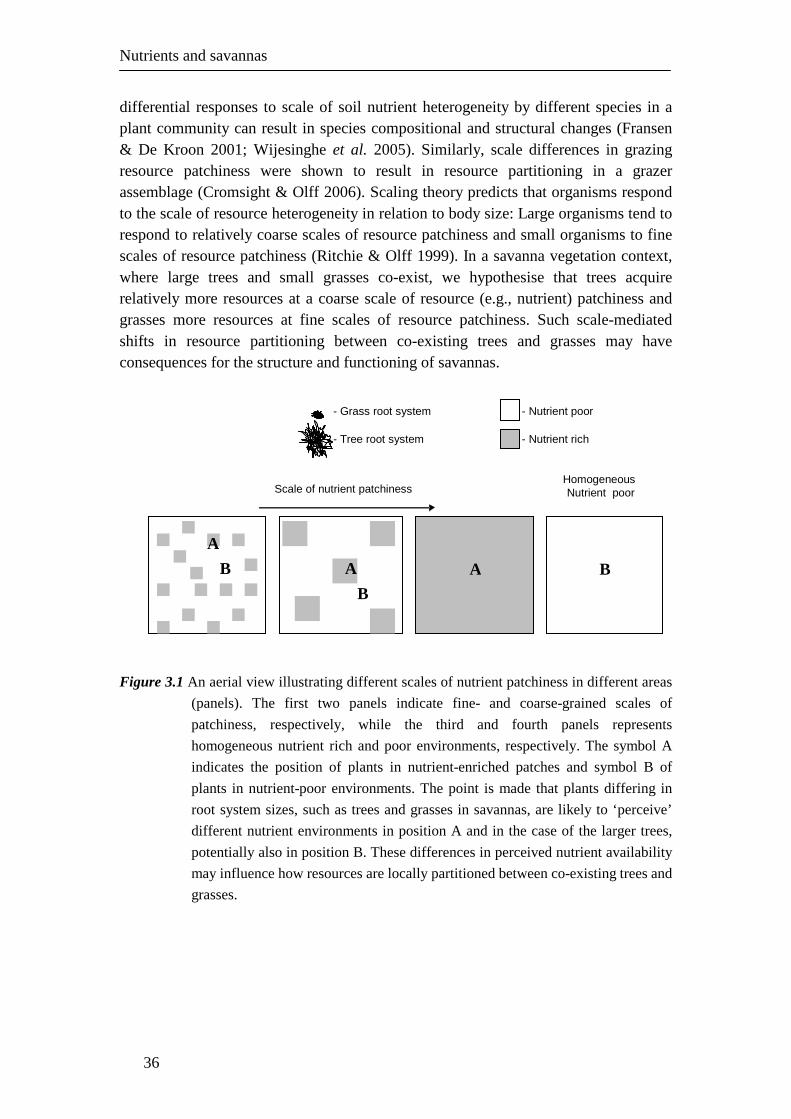
Nutrients and savannas
36
differential responses to scale of soil nutrient heterogeneity by different species in a plant community can result in species compositional and structural changes (Fransen & De Kroon 2001; Wijesinghe et al. 2005). Similarly, scale differences in grazing resource patchiness were shown to result in resource partitioning in a grazer assemblage (Cromsight & Olff 2006). Scaling theory predicts that organisms respond to the scale of resource heterogeneity in relation to body size: Large organisms tend to respond to relatively coarse scales of resource patchiness and small organisms to fine scales of resource patchiness (Ritchie & Olff 1999). In a savanna vegetation context, where large trees and small grasses co-exist, we hypothesise that trees acquire relatively more resources at a coarse scale of resource (e.g., nutrient) patchiness and grasses more resources at fine scales of resource patchiness. Such scale-mediated shifts in resource partitioning between co-existing trees and grasses may have consequences for the structure and functioning of savannas.
Figure 3.1 An aerial view illustrating different scales of nutrient patchiness in different areas
(panels). The first two panels indicate fine- and coarse-grained scales of
patchiness, respectively, while the third and fourth panels represents
homogeneous nutrient rich and poor environments, respectively. The symbol A
indicates the position of plants in nutrient-enriched patches and symbol B of
plants in nutrient-poor environments. The point is made that plants differing in
root system sizes, such as trees and grasses in savannas, are likely to ‘perceive’
different nutrient environments in position A and in the case of the larger trees,
potentially also in position B. These differences in perceived nutrient availability
may influence how resources are locally partitioned between co-existing trees and
grasses.
Homogeneous Nutrient poor
Scale of nutrient patchiness
- Grass root system - Tree root system
B B
A B
- Nutrient poor - Nutrient rich
A
A

Chapter 3
37
The availability of soil nutrients can be a strong regulator of where large herbivores concentrate their impact on savanna vegetation. For example, large herbivore use and subsequently their impact on the vegetation, often increase in nutrient-rich areas (Augustine et al. 2003; Grant & Scholes 2006; Fornara & du Toit, 2008; Asner et al. 2009). Differential disturbances on the tree and grass layers, respectively, potentially can result in shifts in the dominance of either the tree or grass layer (Sankaran et al. 2008). Suppression of the herbaceous layer, for example by grazers (mainly forage from the grass layer), may result in increased tree growth, while tree biomass removal, for example by browsers (mainly forage from the tree layer), may increase grass growth (Roques et al. 2001; van Langevelde et al. 2003; Riginos 2009). If the scale of nutrient patchiness does control the partitioning of nutrients between co-existing trees and grasses as hypothesized, browsers and grazers may track subsequent forage quality changes in the vegetation on offer. In turn, differential browser vs. grazer responses may feed back to influence the structure of the vegetation. We hypothesize that grazers will respond selectively to fine-grained nutrient environments, advancing tree dominance, and browsers to respond to coarse-grained nutrient environments, advancing grass dominance. These ideas have to our knowledge not yet been studied in a savanna context. In this paper we report on a large field experiment where the effects of scale differences in nutrient patchiness on the vegetation and its use by the large herbivore assemblage were followed. Improving our knowledge in this regard is relevant, as it is increasingly realised that heterogeneity and scale are important ecological properties to take into account when managing complex, heterogeneous systems such as savannas (du Toit et al. 2003; Cromsigt et al. 2009). The experiment was conducted in a nutrient-poor, semi-arid savanna open to an intact large herbivore assemblage. Using fertilizer, a gradient in the scale of soil nutrient patchiness in 50 x 50 m plots was created in such a way that the within-patch nutrient concentration and the total nutrient load that plots received were varied independently from the scale of patchiness (Table 3.1). This design allows the analyses of the effects of scale of patchiness when within-patch nutrient concentration is controlled (within-row comparisons, Table 3.1) and when the total nutrient load per plot is controlled (diagonal comparisons, Table 3.1). We predict that (1) in terms of nutrient partitioning (e.g., leaf nutrient concentrations) that grasses profit more at fine scales and trees at coarse scales of nutrient patchiness (Fig. 3.2); (2) the impact of the grazer guild increases at fine scales of nutrient patchiness and the impact of the browser guild at coarse scales of nutrient patchiness (Fig. 3.2); and (3) that the respective browser and grazer responses to scale favour trees at fine scales, because grass competition is reduced by grazers, and favour grasses at coarse scales of nutrient patchiness, because tree competition is reduced by browsers (Fig. 3.2).

Nutrients and savannas
38
Table 3.1 The fertilization treatments applied in a field fertilization experiment. The
experiment involved the treatment of 50 x 50 m plots (n=30). The treatments
consisted of three different scales of fertilizer patchiness (columns), four different
within-patch fertilizer concentrations (rows) and three fertilizer loads per plot
(diagonals). Two treatment combinations were not executed in the experiment due
to either very low or very high within-patch fertilizer concentrations.
Material and methods Study area
The experiment was conducted in the Timbavati Private Nature Reserve (TPNR), which is situated in northeastern South Africa. The TPNR borders the Kruger National Park’s western boundary and fences between the game sanctuaries were removed by 1993, which enabled wildlife unhindered movement between the sanctuaries (Bigalke 2000). The woodland in the north-eastern part of the TPNR, where the experiment was conducted (24˚14’12”S; 31˚22’32”E), comprised a well developed woody stratum dominated by short Colophospermum mopane trees (<8 m height) and a continuous herbaceous layer of medium height (<1 m) featuring species such as Urochloa mosambicensis, Bothriochloa radicans, Digitaria eriantha, Brachiaria deflexa, Panicum maximum (in order of dominance) and a variety of non-graminoid herbaceous species.
The shallow soil of the study area is derived from granite (Venter et al. 2003). Topsoil samples (0-15 cm depth) collected at the study site and analysed by the Agricultural Research Council’s laboratory in Nelspruit, South Africa (Anonymous, 1990), revealed that the soils are nutrient poor and coarsely textured. The mean maximum temperature for the Satara weather station (50 km E) during January (hottest month) is 33.7 ºC and the mean minimum temperature for June (coolest month) is 9.4 ºC (Venter et al. 2003).
Scale of patchiness (patch size & number per plot) Local N concentration
(g N m-2) 2 x 2 m
n=25
10 x 10 m
n=5
50 x 50 m
n=1
Control 0 0 0
1.2 g m-2 - 0.6 kg N plot-1 3 kg N plot-1
6 g m-2 0.6 kg N plot-1 3 kg N plot-1 15 kg N plot-1
30 g m-2
Plot fertilizer
load
(kg N plot-1)
3 kg N plot-1 15 kg N plot-1 -

Chapter 3
39
Figure 3.2 A hypothetical model indicating that scale differences in the patchiness of soil
nutrients may influence plant-herbivore interactions, which feed back to influence
the structural balance between co-existing trees and grasses in savannas.
The long term mean rainfall (1983-2004) is about 450 mm (Ingwalala rainfall station 5 km N), of which 78% is received between October and the end of March. The total annual (July to end June) rainfall over the study period varied: 351 mm during the 2004/2005 season, 433 mm during the 2005/2006 season, 393 mm during the 2006/2007 season and 273 mm during the 2007/2008 season.
Large herbivore species commonly found in the study area include elephant Loxodonta africana, buffalo Syncerus caffer, impala Aepyceros melampus, zebra Equus burchelli, warthog Phacochoerus aethiopicus, duiker Sylvicapra grimmia and steenbok Raphicerus campestris. Grazers like blue wildebeest Connochaetes taurinus and white rhinoceros Cerathorium simum, and browsers like kudu Tragelaphus strepsiceros and giraffe Giraffa camelopardalis occurred at low densities in the study
Spatial scale of nutrient patchiness
Grasses acquire relatively more nutrients than trees
Grass quality increases
Fine-grained
Grazers increasingly attracted, resulting in
increased grass impact
Tree-grass competition balance shifts towards
increased tree dominance
Tree quality increases
Coarse-grained
Browsers increasingly attracted, resulting in increased tree impact
Tree-grass competition balance shifts towards
increased grass dominance
Trees acquire relatively more nutrients than grasses

Nutrients and savannas
40
area. Large predators included lion Panthera leo, spotted hyena Crocuta crocuta and leopard Panthera pardus.
Fire in the TPNR is controlled and the last fire at the study site occurred before 2004. Experimental setup
The experiment was laid out in an area of about 1 by 1.5 km. We followed a randomized block design consisting of thirty 50 m x 50 m plots. A buffer area of 25 m surrounded plots, meaning that plots were at least 50 m apart. Blocks, consisting of ten plots each, represented different topographical positions in the gently undulating landscape. Treatments followed an incomplete factorial design consisting of three factors: the scale of patchiness in which fertilizer was delivered to plots (three levels, Table 3.1), the within-patch fertilizer concentration (four levels) and the total fertilizer load plots received (four levels). The three scale treatments consisted of different spatial configurations of fertilized patches: namely, the fertilizer distributed over the whole 50 x 50 m plot area, or concentrated in either five 10 x 10 m patches or 25, 2 x 2 m patches. Patches were randomly allocated in the plot area, provided that a patch width always separated adjacent patches. The within-patch fertilizer concentration levels were: nil (control), 1.2 g N m-2, 6.0 g N m-2 and 30 g N m-2. Treatment levels were chosen to yield similar total fertilizer loads per plot along the diagonal formed by a scale of patchiness – within-patch fertilizer concentration table. This resulted in the following fertilizer plot loads: 0 (controls), 0.6 kg plot-1, 3.0 kg N plot-1 and 15 kg N plot -1 (Table 3.1). A full factorial design would have resulted in very low and super-high local fertilizer concentration treatments. Therefore these extreme treatments were not executed (Table 3.1). A commercial 3 N: 2 P: 1 K fertilizer was used, but for convenience concentrations are expressed in terms of N concentrations in this paper. Fertilization, spread by hand, was initiated in December 2004 and the same within-plot areas (patches) were re-fertilized in December 2006. Plot corners and patches were permanently marked using capped iron pegs. Tree measurements
Because of its local dominance, C. mopane was chosen as focal tree species. In each plot 20 C. mopane trees, over one metre in height, were selected and marked with aluminium tags. In controls and whole-plot fertilizer treatments, C. mopane trees closest to twenty points (flags) stratified over the plot area were selected. In heterogeneous treatments, 10 trees with stems within 2 m distance of fertilized patches were randomly selected and ten trees stratified over the unfertilized plot area (> 2m distance from fertilized patches). On marked trees, four shoots were randomly selected per tree by selecting the closest shoot tip to the top-end of an iron rod (1.35 m height) held to the canopy perimeter in the four wind directions around the canopy. Branches were marked with coded aluminium rings, which were positioned on shoots to include at least the 2004/2005 season’s growth increment. A thickened growth

Chapter 3
41
girdle on C. mopane shoots facilitated the identification of transitions between previous growing seasons. The current season’s shoots are reddish or greenish in colour, pliable and carry the new leaves, thus is easily distinguished from the previous year’s growth. At the end of the experiment in 2008, all marked trees were visually assessed for the severity of large herbivore (mainly elephant) impact on canopies, using the eight-point scale of Walker (1976). This scale ranges from no large herbivore impact (score 0) to complete destruction of the tree canopy (score 7). In 2006 the height of marked trees was calculated from digital photographs. At the end of the experiment in 2008, a selection of trees was re-measured to determine tree height changes in relation to canopy impact scores. In addition, the projected tree cover per plot was determined from digital aerial photographs taken from a microlight aircraft during the 2006/2007 growing season. The outline of tree canopies in plots was mapped from the photographs with the aid of GIS software (ArcView 3.3) and was expressed as the percentage tree canopy cover per plot. Herbaceous aboveground biomass
The above ground biomass of the herbaceous layer in the 30 plots was assessed following the Dry-Weight-Rank method combined with the Comparative-Yield-Method (Friedel 1988; Dekker et al. 2001). The herbaceous standing crop was assessed in quadrates, 0.25 m2 (0.5 x 0.5 m) in size, in hundred quadrates per plot. These quadrates were stratified over nine evenly spaced transects stratified over the plot surface to cover the inner 50 x 50 m area of each of the 30 plots. In the 10 x 10 m and 2 x 2 m patchy treatments, 25 quadrates were allocated to the fertilized patches and the remaining 75 quadrates were stratified between the fertilized patches, but allowing for a 2 m buffer around the fertilized patches. In the 2 x 2 m and 10 x 10 m patches, quadrates were assessed in the middle of the subplot, while in 10 x 10 m patches four estimates were also recorded approximately 1 m inside of patch corners. For calibration purposes (Comparative-Yield-Method), the herbaceous aboveground biomass in seven quadrates per plot was clipped close to the ground (±2 cm height) after visually estimating aboveground biomass. The clipped material was contained in paper bags, dried to constant weight at 70oC and weighed. The actual weights were regressed against the visual scores, and the calibration curves were used to calculate plot biomass from the visual scores obtained in plots. The calibration dataset per sample year consisted of more than 200 data points and were separately calculated per observer and when several days passed between consecutive assessments. This resulted in nine calibration (power) functions with R2 values ranging from 0.90-0.96. Together these techniques yield standing crop estimates per species per plot, and are expressed as kg dry material per hectare per species. During the herbaceous biomass estimations in quadrates (n=3 000 per sample yr), the presence or absence of grazing signs and presence or absence of uprooted tuft remains, a sign of elephant grazing, were recorded.

Nutrients and savannas
42
Chemical analyses of leaves
Leaf samples were collected during the growing seasons of 2005/2006, 2006/2007 and 2007/2008 for C. mopane, and the two most prominent grass species, namely, U. mosambicensis and B. radicans, and were analysed for N, P, and condensed tannin concentration (C. mopane). For C. mopane, five fully expanded leaves were randomly collected from the canopies of the marked trees. For U. mosambicensis and B. radicans, sub-samples were collected from mature plants nearest to 20 points stratified over four transects dissecting the plot area. In homogeneous treatments, two pooled samples were analysed per species per plot. In heterogeneous treatments, samples were pooled for leaves collected from the plants in and outside fertilized patches. This resulted in sixty samples per species per year, except for B. radicans, which were absent in some plots. Leaf samples were air dried in paper bags in a well ventilated, shaded room before analyses. Prior to milling (1 mm sieve), C. mopane leaves were dried to constant weight at 600C and weighed. After destruction with a mixture of H2SO4, Se and salicylic acid (Novozamsky et al. 1983), the N and P concentration of samples were measured with a Skalar San-plus autoanalyzer. The condensed tannin concentration in C. mopane leaf samples were determined following the proanthocyanidin method using purified Quebracho tannin as a standard (Waterman & Mole 1994). The chemical analyses were performed at the laboratory of the Wageningen University (The Netherlands). Exclosure experiment
The herbaceous off-take by large herbivores in relation to fertilizer concentration was determined by using the movable cage method (Ydenberg & Prins 1981; Prins & Beekman 1989; McNaughton et al. 1996). This part of the experiment was carried out within 500 m distance of the large experiment in a comparable environment. Cages (1.0 m x 1.5 m x 0.6 m) were constructed from welded steel mesh and the tops were covered with wire netting. Treatments consisted of the fertilization of 10 x 10 m plots in January 2006, using the same fertilizer stock and local fertilizer concentrations used in the large experiment. Treatments were replicated three times and treatments randomly allocated to plots. Cages were first installed on treatment areas in February 2006, after which the aboveground biomass was regularly determined inside and outside grazer cages from six readings with a standard Disc Pasture Meter (Waldram et al. 2008). The calibration by Zambatis et al. (2006) was used to convert disc settling height readings to biomass (kg DM ha-1). During the growing season, measurements were taken and cages subsequently moved every 4 to 6 weeks depending on the growth rate of the herbaceous layer, while the time interval between readings was relaxed during the dry season when growth seized. Off-take was calculated from the differences between the biomass inside and outside cages per plot. In calculations, missing values resulting from animals occasionally overturning cages were replaced by same-treatment means for the corresponding measuring period.

Chapter 3
43
Statistical analysis Mixed linear models were used to test for plant response differences, because linear mixed models allow the inclusion of both random factors (block) and repeated measures (yearly measurements). As a first step we tested for overall effects of within-patch fertilizer concentration and scale of patchiness (patch size) on the responses of focal tree or grass species in fertilized patches. Leaf quality response variables for C. mopane, U. mosambicensis and B. radicans consisted of leaf N and P concentrations as well as condensed tannin concentrations for C. mopane. Growth response measures in the marked C. mopane trees consisted of the average annual shoot length increase per tree, as well as the average annual leaf mass produced per marked shoot (leaf number x mean leaf mass). Average values did not account for the fact that shoots were increasingly lost as the study progressed. Therefore, net shoot length and net leaf mass per shoot were also calculated by totalling shoot lengths and leaf numbers per tree divided by four (initial number of shoots marked). The net tree growth measures were tested against treatment factors in the same way as average growth measures. As a second step, plot-level responses in herbaceous biomass and net tree shoot growth were calculated by correcting for the different fertilized and non-fertilized surface areas in heterogeneous treatments. Subsequently, we tested for fertilizer plot load and the scale of patchiness effects on these tree and herbaceous biomass parameters.
Leaf N and P concentrations were arcsine transformed prior to analyses. Condensed tannin concentrations and herbaceous biomass data were logarithmically transformed and C. mopane shoot data were square root transformed. In linear mixed models, an auto-regressive co-variance structure was used with yearly repeated measurements. Separate values were calculated for fertilized and non-fertilized areas per plot in heterogeneous treatments. For the tree data, trees were nested under plots, and plots under experimental blocks. In all models, block was treated as a random factor. To test whether tree cover affected herbaceous biomass, tree cover was entered as a covariate in the herbaceous model.
Proportion data were analyzed (untransformed data) using Generalized Linear Models, assuming a binomial distribution and an identity link function. Response variables consisted of the shoots lost per tree at the end of the experiment, trees impacted by elephant from 2006 to 2008 (logit link function), quadrates showing grazing impact, and the proportion of quadrates with uprooted tuft remains. Within-patch fertilizer concentration and scale of patchiness were treated as factors in the models. For the estimation of the local severity of elephant impact on tree canopies a Poisson distribution (many trees were not impacted) and a log link function was used. Separate tests were conducted for treated (e.g., trees in fertilized patches) and untreated trees. The proportion of trees utilized since 2006, was analyzed assuming a binomial distribution. Fertilizer concentration was treated as a fixed factor. Trees were nested under block (random term) for the utilization score analyses, but for the binomial data (elephant impact present or absent over study period), block was entered as a random factor without nesting. In addition, the mean percentage tree

Nutrients and savannas
44
canopy removed by browsers were calculated per plot by using the midpoints of percentage canopy removed classes of the Walker tree utilization scale, corrected for the area fertilized and not fertilized in heterogeneous treatments. An ANOVA test was used to test for the plot level canopy impact as affected by the fertilizer plot load and scale of patchiness variables. Experimental block was entered as random variable.
Where significant within-subject interactions emerged in linear mixed models, follow-up ANOVAs were performed on yearly data, respectively. Bonferroni multiple comparisons were used to differentiate between group means. ANOVAs were also used to test for fertilization effects in the exclosure experiment. Spearman correlations were performed to describe relationships between elephant impact scores, number of shoots lost per tree and shoot growth.
All statistical analyses were performed in SPSS v. 15.
Results The effect of sample year, fertilizer concentration and scale of patchiness on leaf N
concentration
The leaf N concentration of C. mopane trees varied between the sample years and increased with an increase in local fertilizer concentration. Leaf N concentrations were also affected by the size of fertilized patches. In C. mopane trees in fertilized patches, leaf N concentrations showed a steady increase over time (Table 3.2) with on average 6% higher concentrations in the 2006/2007 than the 2006/2007 season (Bonferroni, P=0.001), increasing with another 11% to peak in 2008 (Bonferroni, P<0.001). The leaf N concentration of C. mopane trees in fertilized patches, responded to the fertilizer concentration within patches, as well as the scale of patchiness (Table 3.2; Fig. 3.3). The leaf N concentration of trees in the 30 g N m-2 fertilizer concentration treatments was on average 17% (22.8 vs. 19.5 mg N g-1 leaf) higher than that of control leaves (Bonferroni, P<0.001), while 10% higher (20.8 vs. 19.5 mg N g-1 leaf) in the 6 g N m-2 fertilizer concentration patches compared to controls (Bonferroni, P=0.010). Trees in the 10 x 10 m patches had on average higher (Bonferroni, P<0.001) leaf N concentrations than trees in either the 2 x 2 m (19.8 mg N g-1 leaf) or 50 x 50 m patches (20.4 mg N g-1 leaf). For example, the leaf N concentration of C. mopane in the 30 g N m-2 within-patch concentration treatments was 20% higher in the 10 x 10 m patches (25.0 mg N g-1 leaf) than the 2 x 2 m patches (21.0 mg N g-1 leaf; Fig. 3.3).
The leaf N concentration of the grass U. mosambicensis varied greatly between sampling years (Table 3.2). The leaf N concentration of grasses in fertilized patches also varied with fertilizer concentration, which also interacted with patch size (Table 3.2). Leaf N concentrations increased on average from 13.8 mg N g-1 leaf in the 2005/2006 season to 19.9 mg N g-1 leaf in the 2006/2007 season (Bonferroni, P<0.001), but decreased to their lowest concentration (10.3 mg N g leaf-1) in the 2007/2008 season (Bonferroni, P<0.001). The leaf N concentration of U. mosambicensis was strongly influenced by fertilizer concentration and the effect of fertilization differed between the study years (year x fertilizer concentration; Table

Chapter 3
45
3.2, Fig. 3.3). The main effect of fertilizer concentration was that U. mosambicensis leaf N concentration in the 30 g N m-2 fertilizer concentration treatment was increased on average by 59% (20.4 vs. 12.8 mg N g leaf-1; Bonferroni, P<0.001), while leaf N concentrations in the lower fertilizer concentration treatments did not differ from controls (P>0.1). The year x fertilizer concentration interaction was related to a stronger leaf N concentration response in the 6 and 30 g N m-2 fertilizer concentration treatments in the 2006/2007 than in 2005/2006 or 2007/2008 seasons. For example, U. mosambicensis leaf N concentration in the 30 g N m-2 treatment was on average 31.6 mg N g leaf-1 in the 2006/2007 season, compared to 18.0 mg N g leaf-1 and 13.4 mg N g leaf-1 in the 2005/2006 and 2007/2008 seasons, respectively. The leaf N concentration of U. mosambicensis was only affected by patch size in the highest 30 g N m-2 fertilizer concentration treatment (patch size x fertilizer concentration, Table 3.2). Leaf N concentration of U. mosambicensis was on average 19% higher in plants in the 10 x 10 m patches, compared to the 2 x 2 m patches fertilized at 30 g N m-2 (Table 3.2, Fig. 3.3). The leaf N concentration of the grass B. radicans differed between years and the leaf N concentration of plants in fertilized patches was affected by both fertilizer concentration and the size of patches (Table 3.2, Fig. 3.3). Leaf N concentrations were higher in the 2006/2007 season (13.2 mg N g leaf-1) than in either the 2005/2006 (11.1 mg N g leaf-1) or 2007/2008 seasons (11.0 N mg N g leaf-1; Bonferroni, P<0.001). For the fertilizer concentrations, leaf N concentration was only significantly increased in the 30 g N m-2 treatment relative to control concentrations (13.7 vs. 10.6 mg N g leaf-
1; Bonferroni, P<0.001). For the scale of patchiness, leaf N concentrations were higher in the 10 x 10 m patches compared to the 50 x 50 m patches (Bonferroni, P=0.021; Fig. 3.3). In the heterogeneous treatments, the leaf N concentration of both trees and grasses outside fertilized patches was unrelated (linear mixed models, P>0.05) to fertilizer treatments. The effect of sample year, fertilizer concentration and scale of patchiness on leaf P
concentration
The leaf P concentration of C. mopane trees fertilized with the NPK fertilizer differed between seasons and was affected by the local concentration of fertilizer. Leaf P concentrations of trees in patches was lower in the 2005/2006 season (1.2 mg P g leaf-1) than either the 2006/2007 (1.3 mg P g leaf-1) or 2007/2008 seasons (1.3 mg P g leaf-1; Bonferroni, P<0.001). The leaf concentration of trees in fertilized patches increased with fertilization (Table 3.2), but the effect was only significantly increased in the 30 g N m-2 treatment relative to control leaf P concentrations (1.4 vs. 1.2 mg P g leaf-1; Bonferroni, P<0.001; Fig. 3.3). The size of patches, modestly affected C. mopane leaf P concentrations (Table 3.2) and concentrations of trees in the 10 x 10 m patches were higher than in the 2 x 2 m or 50 x 50 m patches (Fig. 3.3).

Nutrients and savannas
46
Table 3.2 Linear Mixed Model tests for leaf N, leaf P and leaf condensed tannin
concentrations of C. mopane trees, and U. mosambicensis and B. radicans grasses
in fertilized patches (dependent variables) as affected by within-patch fertilizer
concentration and fertilizer patch size (fixed factors) Sampling was repeated in
2006, 2007 and 2008 (within-subjects factor).
*P<0.05; **P<0.01; ***P<0.001
Source of variation C. mopane leaf
N U. mosambicensis
leaf N B. radicans leaf N
d.f. F d.f. F d.f. F Leaf nitrogen (arcsine transformed) Within subjects Year 2,43 51.8 2,44 163.6*** 2,25 22.9*** Year * Concentration 6,43 0.9 6,44 8.1*** 6,24 1.0 Year * Patch size 4,43 1.5 4,44 0.8 4,25 0.6 Year * Conc. * Patch 8,43 0.5 8,44 1.0 7,24 1.2 Between subjects Concentration 3,26 21.9*** 3,25 66.2*** 3,15 12.1*** Patch size 2,25 18.1*** 2,25 2.2 2,16 6.0* Conc. * Patch size 4,25 3.2* 4,25 2.9* 4,15 1.1 Leaf phosphorous (arcsine transformed) Within subjects Year 2,45 12.4*** 2,41 18.5*** 2,32 16.8*** Year * Concentration 6,45 0.2 6,41 5.1** 6,30 2.3 Year * Patch size 4,44 0.4 4,41 3.0* 4,30 1.3 Year * Conc. * Patch 8,45 0.3 8,41 2.2* 7,30 0.8 Between subjects Concentration 3,28 9.7*** 3,24 49.1*** 3,23 12.2*** Patch size 2,27 3.6* 2,24 0.6 2,25 2.1 Conc. * Patch size 4,27 1.0 4,24 0.1 4,22 6.1** Leaf condensed tannin concentration (logarithmically transformed) Within subjects Year 2,42 21.2*** Year * Concentration 6,42 0.5 Year * Patch size 4,42 0.3 Year * Conc. * Patch size 8,42 0.3
Between subjects Concentration 3,25 6.5** Patch size 2,24 2.6 Conc. * Patch size 4,24 2.1

Chapter 3
47
Figure 3.3 The leaf N and P concentration responses of the tree, C. mopane, and grasses, U.
mosambicensis and B. radicans, to different scales of nutrient patchiness (i.e.,
patch sizes 2 x 2 m, 10 x 10 m and 50 x 50 m) fertilized at different within-patch
concentrations (i.e., 0, 1.2, 6, and 30 g N m-2). The responses are for plants in
fertilized patches and outside patches (>2 m distance from patch edges). Back
transformed means and 95% confidence intervals are given. Asterisks above bars
indicate least square differences from control values, * P<0.05, ** P<0.01, ***
P<0.001.
In U. mosambicensis, the leaf P concentration differed between sample years and was highly responsive to fertilization (Table 3.2). U. mosambicensis leaf P concentrations was on average lower in the 2007/2008 (1.6 mg P g leaf-1) compared to 2005/2006 (2.2 mg P g leaf-1) and 2006/2007 seasons (2.0 mg P g leaf-1; Bonferroni, P<0.001). The leaf P concentrations of U. mosambicensis was increased on average by 83% in the 6 g N m-2 and, remarkably, by 300% in the 30 g N m-2 fertilizer concentration treatment (Bonferroni, P<0.001; Fig. 3.3).
In B. radicans, the leaf P concentration also differed between years, but responses to fertilization was less pronounced than that of U. mosambicensis (Table 3.2). Leaf P concentrations were higher in the 2006/2007 (1.1 mg P g leaf-1) than in

Nutrients and savannas
48
either 2005/2006 (1.3 mg P g leaf-1) or 2006/2007 seasons (1.0 mg P g leaf-1; Bonferroni, P<0.01. The leaf P concentration differed depending on fertilizer concentration (Table 3.2) and was 25% and 31% higher in the 6 and 30 g N m-2 treatments, respectively (Bonferroni, P<0.001). The fertilizer rate x patch size interaction (Table 3.2) indicated that leaf P concentrations were affected by patch sizes at certain within-patch fertilizer concentration levels. For example, in patches fertilized at a concentration of 30 g N m-2 (ANOVA contrast, F1,3=57.8, P=0.003), B. radicans plants in the 10 x 10 m patches had 44% higher leaf P concentrations (0.15 vs. 0.10% P) than in the 2 x 2 m patches (Fig. 3.3).
In the heterogeneous treatments, the leaf P concentration of plants outside fertilized patches was, similar to leaf N responses, unrelated (linear mixed models, P>0.05) to fertilizer treatments in both trees and grasses (Fig. 3.3).
Condensed tannin in C. mopane trees
The condensed tannin concentration (quebracho equivalents) of C. mopane trees differed between sample years and decreased with increasing soil fertility. Leaf condensed tannin concentrations decreased with 7% from the 2005/2006 to 2006/2007 season (Bonferroni, P=0.006), but increased thereafter with 17% to peak in the 2007/2008 season (Bonferroni, P=0.004; Table 3.2).
The condensed tannin concentration of C. mopane trees in fertilized patches responded to fertilization (Table 3.2) and was decreased by 10% in the 30 g N m-2 treatment (Bonferroni, P=0.010). In the heterogeneous treatments, C. mopane condensed tannin concentrations of plants outside fertilized patches were not related to fertilization treatments (linear mixed model, P>0.1). The effect of sample year, fertilizer concentration and scale of patchiness on
C. mopane tree growth
The mean annual shoot length of C. mopane increased over the study period and was affected by fertilization (Table 3.3). The mean annual shoot length increased on average from the 2005/2006 season (193 mm shoot-1) to the 2007/2008 season (344 mm shoot-1). Mean annual shoot length increased with increasing within-patch fertilizer concentration (Table 3.3) and the mean shoot length in the 30 g N m-2 fertilizer treatments was 24% longer (Bonferroni, P=0.029) than the average control shoot length (236 vs. 294 mm shoot-1).
The mean leaf mass per shoot of C. mopane trees in fertilized patches also increased over time (Table 3.3) and increased with increasing within-patch fertilizer concentration (Table 3.3), as the leaf mass per shoot was 24% higher in the 30 g N m-2 fertilizer concentration treatment compared to controls (35 vs. 29 g shoot-1; Bonferroni, P=0.035). An increasing number of marked shoots were lost since the first measurements in the 2005/2006 season and the number of shoots lost per tree by 2008 differed between treatments (Wald Chi-square=25.2, n=600, P<0.032). By 2008 the trees in

Chapter 3
49
the 10 x 10 m patches fertilized at 30 g N m-2 lost on average 1.8 out of four marked shoots per tree compared to only 0.9 shoots lost on average per control tree (Bonferroni, P<0.001). Consequently, the net annual shoot growth per tree, which takes shoot losses into account, showed different patterns to the average shoot growth patterns. For example, the net annual shoot length increase of trees, in fertilized patches, was affected differently by within-patch fertilizer concentration between years (year x fertilizer concentration, Table 3.3). The interaction effect was most notable in the 30 g N m-2 fertilizer concentration treatment, where net shoot growth was increased on average by 24% in the 2005/2006 season, but suppressed on average by 10% by 2008, relative to control net shoot length (Fig. 3.4). The year x patch size interaction (Table 3.3) was related to a relative larger increase in net shoot length in the 50 x 50 m patches in the 2005/2006 season, while the net shoot length was relatively longer in the 2 x 2 m patches in the 2007/2008 season (Fig. 3.4).
Table 3.3 Linear Mixed Model tests for mean annual shoot length increase and leaf mass per
shoot of C. mopane and herbaceous aboveground biomass in fertilized patches
(dependent variables) as affected by within-patch fertilizer concentration and
fertilizer patch size (fixed factors). Sampling was repeated in 2006, 2007 and
2008 (within-subjects factor). Tree cover (% of plot surface) was entered as a
covariate in the herbaceous biomass model, while block was entered as a random
factor in the C. mopane growth models.
*P<0.05; **P<0.01; ***P<0.001
Source of
variation
C. mopane annual
shoot length
C. mopane annual
leaf mass per
shoot
Herbaceous
aboveground
biomass
d.f. F d.f. F d.f. F
Year 2,388 109.4*** 2,391 96.6*** 2,39 39.3***
Year *
Concentration 6,388 0.8
6,392 1.0
6,39 4.4**
Year * Patch size 4,387 8.3*** 4,390 1.3 4,39 0.4
Year * Conc. *
Patch 8,387 1.2
8,390 1.4
8,39 0.3
size
Between subjects
Concentration 3,297 4.2** 3,298 3.9* 3,21 1.3
Patch size 2,297 1.2 2,297 0.4 2,21 1.9
Conc. * Patch size 4,297 0.7 4,297 0.4 4,21 3.2*
Tree cover
(covariate) - - - -
1,21
18.6***

Nutrients and savannas
50
The net leaf mass changed over time (mixed linear model, F2,395=11.5, P<0.001) and increased on average from the 2005/2006 to 2006/2007 season (Bonferroni, P<0.001), but the 2007/2008 values were not significantly different from the 2006/2007 season values (Bonferroni, P>0.05; Fig. 3.4). The net leaf mass of trees in fertilized patches was not affected by within-patch fertilizer concentration (linear mixed model, P>0.10), but a year x fertilizer concentration x patch size interaction emerged (F8,395= 2.2, P=0.029). The interaction was strongly influenced by growth patterns of trees in the 10 x 10 m - 30 g N m-2 treatments, where the growth of trees declined from above-control values in the 2005/2006 season to below-control values in the 2007/2008 season (Fig. 3.4).
In the heterogeneous treatments, both mean shoot length (F4,326=3.1, P=0.015) and leaf mass per shoot (F4,320=3.2, P=0.013) of trees outside fertilized patches showed an interaction between year and the scale of patchiness. These interactions were strongly influenced by an increase in the growth of trees outside fertilized patches in the 2 x 2 m scale of patchiness – 30 g N m-2 treatment in the 2005/2006 seasons, which diminished in later years. If the loss of shoots were taken into account, the interaction effect was only evident for net shoot length (year x scale of patchiness interaction; F4,320=2.4, P=0.050; Fig. 3.4) and not for the net leaf mass per shoot (P>0.05). Plot level estimates of the net shoot length and leaf mass per shoot were not related to the fertilizer load (mixed linear model, P>0.1) or scale of patchiness treatments (P>0.1).
The effect of sample year, fertilizer concentration and scale of patchiness on
herbaceous aboveground biomass
The herbaceous aboveground biomass (kg DM ha-1) of unfertilized swards was affected by the percentage tree cover of plots. Negative relationships between herbaceous aboveground biomass and tree cover emerged for the 2005/2006 season (biomass = 1864.2 - 26.8*tree cover; F1,23=12.3, P=0.002) and 2006/2007 season (biomass = 1326.3 – 17.3*tree cover; F1,23=5.7, P=0.025), but not for the 2007/2008 season (linear regression; P>0.05). The negative relationships mean that on average 26.8 and 17.3 kg less herbaceous aboveground biomass were produced per hectare per percentage increase in tree cover in the 2005/2006 and 2006/2007 seasons, respectively.
Including tree cover as a covariate in models, the aboveground biomass of the herbaceous layer differed between years and was affected by fertilization (Table 3.3). The herbaceous biomass production was higher in the 2005/2006 season (1176 kg DM ha-1) than in either 2006/2007 (734 kg DM ha-1) or 2007/2008 seasons (821 kg DM ha-1; Fig. 3.4). The effect of within-patch fertilizer concentration on herbaceous biomass within patches varied between years (year x fertilizer concentration interaction; Table 3.3) and was lower in the 30 g N m-2 fertilizer concentration treatment than in controls (486 vs. 839 kg DM ha-1) in the 2006/2007 season, but not in other years (Fig. 3.4). Fertilizer concentration also interacted with patch size (Table

Chapter 3
51
3.3) and herbaceous biomass increased in the 50 x 50 m – 6 g N m-2 treatment, while decreased in the 2 x 2 m – 30 g N m-2 treatment (Fig. 3.4).
Figure 3.4 (a) The net shoot length and (b) leaf mass per marked C. mopane tree and (c)
aboveground herbaceous biomass responses to different scales of nutrient
patchiness (i.e., patch sizes 2 x 2 m, 10 x 10 m and 50 x 50 m) fertilized at
different within-patch concentrations (i.e., 0, 1.2, 6, and 30 g N m-2). The
responses for plants in fertilized patches and outside patches (not fertilized) are
given. Back transformed means and 95% confidence intervals are given.
Asterisks above bars indicate least square differences from control values,
* P<0.05, ** P<0.01, *** P<0.001.
Nutrients and savannas
52
In the heterogeneous treatments, the herbaceous biomass outside fertilized patches was unrelated (linear mixed models, P>0.05) to fertilizer concentrations or scale of patchiness, suggesting that the influence of fertilization in heterogeneous treatments had little influence on above ground biomass production beyond the 2 m buffer around patches (Fig. 3.4). Plot level estimates of the aboveground herbaceous biomass was not related to the fertilizer load per plot (mixed linear model, P>0.1) or the scale of patchiness treatments (P>0.1), but were negatively related to the percentage tree cover of plots (F1,19=17.9, P<0.01).
Browser impact in relation to fertilizer concentration and scale of patchiness
Local fertilizer concentration and the scale of patchiness affected the impact of browsers on the tree layer. The proportion of marked trees that showed browser (e.g., elephant) impact during the study period differed between treatments (Wald Chi-square = 293.7, n=600, P<0.001), as 87% of the marked C. mopane trees in the 10 x 10 m patches, fertilized at a rate of 30 g N m-2, showed browser impact compared to the 18% impact of control trees (Bonferroni, P<0.001; Fig. 3.5). The proportion of impacted trees in other treatments, including non-fertilized trees in heterogeneous treatments, was not different from that of controls (Bonferroni, P>0.05; Fig. 3.5). Similarly, the estimates of impact severity on tree canopies were affected by the fertilizer-scale treatments (Wald Chi-square = 293.7, n=600, P<0.001) and was also higher in the 10 x 10 m patch – 30 g N m-2 treatment than in controls (median class, 1 vs. 0; Bonferroni, P<0.001), while other treatment combinations, including non-treated trees in heterogeneous treatments, did not differ from controls (Bonferroni, P>0.05). In addition, 20% of the trees in the 10 x 10 m – 30 g N m-2 patches was estimated to have more than 25% of the canopy volume removed by browsers, compared to only 1% of trees in control plots, indicating that not only the frequency of trees impacted by browsers increased, but also the intensity of utilization. The re-measurement of C. mopane canopy dimensions at the end of the study period indicated that the percentage change in tree height between 2006 and 2008 was negatively correlated with the impact severity scores (Spearman, r=-0.49, n=44, P=0.001). Trees not impacted or lightly impacted by browsers showed on average little height change over the study period, while tree canopies with high browser impact scores decreased in canopy height. The number of shoots lost per marked tree was also positively correlated with the browser impact severity scores (Spearman, r=0.17, n=600, P<0.001), suggesting that browser impact was at least partially responsible for the decline in marked shoots. Plot level estimates of the percentage canopy volume removed by browsers was related to the fertilizer load plots received (mixed linear model, F3,16=3.8, P<0.05). According to the estimates, plots that received 15 kg N plot-1 lost (Bonferroni, P<0.05) more canopy volume than control plots.

Chapter 3
53
Figure 3.5 The proportion (± 95% confidence intervals) of (a) C. mopane trees in fertilized
patches (and controls) impacted by elephant from 2006 to 2008 and (b) the
proportion of quadrates in fertilized patches (and controls) showing signs of
grazing at the end of the 2006/2007 growing season in relation to patches of
varying size (i.e., 2 x 2 m, 10 x 10 m and 50 x 50 m) fertilized at different
concentrations (i.e., 0, 1.2, 6, and 30 g N m-2).
The mean shoot length increase and leaf mass per shoot were not related (Spearman, P>0.05) to the browser severity scores in 2008, suggesting that elephant impact did not significantly affect the growth of the remaining shoots of impacted trees.
Grazer impact and utilization patterns in relation to fertilizer concentration and scale
of patchiness
The estimated intensity of grazing was only related to the within-patch fertilizer concentration and was not affected by the size of patches. Grazing intensity was related to local fertilizer concentration in all three years, respectively (2005/2006 season, Wald Chi-square=102.0, n=1125, P<0.001; 2006/2007 season, Wald Chi-square=139.5, n=1125, P<0.001; 2007/2008 season, Wald Chi-square=76.8, n=1125, P<0.001; Fig. 3.5). The proportion of quadrates showing recent grazing signs in the 2005/2006 season was only higher in the 30 g N m-2 treatments relative to controls (0.2 vs. 0.6; Bonferroni, P<0.001). In the 2006/2007 season, grazing frequency was higher in both the 6 g N m-2 (0.6) and 30 g N m-2 (0.7) treatments compared to

Nutrients and savannas
54
controls (0.3; Bonferroni, P<0.001), but did not differ between each other (Bonferroni, P>0.05). In the 2007/2008 season, the grazing frequency was increased in both the 6 g N m-2 (0.49) and 30 g N m-2 (0.68) treatments (control=0.33, Bonferroni, P<0.001), which was higher in the 30 g N m-2 than 6 g N m-2 treatment (Bonferroni, P<0.001). For the same within-patch fertilizer concentration, utilization scores were unaffected by the different scale treatments.
In heterogeneous treatments, the grazing intensity in the non-fertilized areas only differed from control grazing frequencies in the 2007/2008 season (Wald Chi-square=8.7, n=1575, P=0.034), when the grazing intensity in the non-fertilized 1.2 g N m-2 treatments tended to be lower than controls. This indicates that fertilized patches were selectively grazed and that grazing patterns beyond 2 m from patches were little affected by grazers. Grazer exclosures
The herbaceous off-take by large herbivores for the period March 2006 – March 2007, estimated with movable exclosures, was affected by fertilization (ANOVA, F3,8=4.3, P=0.044). Accordingly, the off-take was increased 3-fold in the 1.2 g N m-2, 7-fold in the 6 g N m-2 and 6-fold in the 30 g N m-2 treatment compared to controls (Fig. 3.6). Figure 3.6 Results of a movable exclosure experiment showing (a) the estimated annual
herbaceous off-take by large herbivores and (b) the above ground biomass
measured at the end of the study (April 2007) in relation to 10 x 10 m plots
fertilized at different concentrations (i.e., 0, 1.2, 6, and 30 g N m-2). Back
transformed means and 95% confidence intervals are given. Asterisks above
bars gives least square differences from control values, * P<0.05, ** P<0.01,
*** P<0.001.

Chapter 3
55
In contrast to off-take amounts, the aboveground biomass in March 2007 outside exclosure cages, differed between fertilizer treatments (ANOVA, F3,8=13, P=0.002) and was on average 64% lower in the 30 g N m-2 treatment compared to control biomass (Fig. 3.6). This corresponds with the biomass patterns observed in the large field fertilization experiment during the 2006/2007 season (Fig. 3.4). No differences (P>0.05) between fertilizer treatments in herbaceous off-take by large herbivores were detected in the period April 2007 to March 2008.
Discussion Local bi-trophic responses to spatial scale differences in nutrient heterogeneity
Our data demonstrated how local scale differences in nutrient heterogeneity affected resource partitioning between co-existing trees and grasses, and, importantly, how these effects cascaded to modulate large herbivore impact patterns on the structure of savanna vegetation. As hypothesised, fine scales of nutrient patchiness, i.e., nutrient-enriched patches are smaller than tree root-system size, resulted in grasses responding in terms of leaf quality (N and P concentrations), while tree leaf quality was unaffected. Where the local nutrient concentration was high (i.e., 30 g N m-2), grazer impact on herbaceous plants increased and even resulted in the suppression of the aboveground biomass below control biomass values. For the tree layer in the 2 x 2 m patches, neither tree quality nor browser impact increased. A probable consequence of the selective, intense grazing in 2 x 2 m patches (30 g N m-2) was that the competiveness of the herbaceous layer was compromised, resulting in stimulated tree growth of trees in the 2 x 2 m patches. Thus the balance between trees and grasses shifted locally in favour of trees, as predicted (Fig. 3.2). In support, the removal of co-existing grasses also resulted in growth stimulation of savanna trees in other studies (Knoop & Walker 1985; Stuart-Hill & Tainton 1989; Riginos 2009). Besides, a high grazing pressure is considered one of the primary causes of bush encroachment (Scholes & Archer 1997; Roques et al. 2001; Sankaran et al. 2008). Against expectations, our data suggest that trees were not more efficient in acquiring nutrients at the coarser scale (10 x 10 m) of nutrient patchiness than grasses, as both tree and grass leaves had their highest N and P concentrations at this scale if the within-patch fertilizer concentration was held constant. This synchronized response in quality of both trees and grasses caused both grazers and browsers to respond in concert to the increased forage quality, with a correspondingly high impact on both vegetation layers. Subsequently, grasses did not benefit from the increased tree impact as grass biomass was simultaneously suppressed by an increase in grazing pressure.
In summary, the scale of nutrient patchiness controlled tree vs. grass quality responses, which, in turn, controlled browser vs. grazer impact patterns. Subsequently, selective grazer impact in fine scale of patchiness treatment apparently resulted in a release of herbaceous competition, resulting in local tree growth stimulation.

Nutrients and savannas
56
Mechanisms underlying plant responses to heterogeneity
In the 10 x 10 m patches a large proportion of tree roots presumably overlapped with fertilized patches, resulting in enhanced nutrient uptake (Fig. 3.1). In the 2 x 2 m patches, root exposure to the added nutrients was probably not enough to elicit a leaf quality response. It is, however, possible that trees also responded to the scale of patchiness, i.e., proliferation of roots or increases in the physiological capacity to take up nutrients (Hutchings et al. 2003; Hodge 2004), in the 10 x 10 m patch trees, but not in the 2 x 2 m patch trees, which contributed to the scale-related responses. The strong herbivore response to the nutrient additions, however, confounded the separation of plant responses to scale from passive uptake means in the present study. In a concurrent field experiment (Chapter 4), we tested spatial scale effects on isolated C. mopane trees by supplying the same fertilizer amount, either in a single large patch or in 52 small patches covering the same total area (a third of a 5 m radius area). We found in the second year after fertilization that growth in the large-scale fertilizer treatments was stimulated and condensed tannin concentrations decreased (indicating increased resource availability; Bryant et al. 1992; Haukioja et al. 1998), while in the small-scale treatments, leaf N concentration was decreased and condensed tannin concentrations increased (Chapter 4). These responses suggest that C. mopane trees were responding to the scale of nutrient patchiness. This might have contributed to the observed resource partitioning patterns observed in the current study.
For grasses, the lower leaf nutrient concentration response to the same within-patch fertilizer concentration in the small patches compared to the larger 10 x 10 m patches does not support the idea that grasses are superior competitors under fine scales and trees under coarse scales of nutrient patchiness (Fig. 3.2). It is possible, however, that this is largely a sampling artefact. In the 2 x 2 m patches, a greater proportion of the randomly sampled grass plants probably had roots extending outside fertilized patches, resulting in a lower nutrient uptake, even if plants responded to the nutrient heterogeneity encountered in their root systems (along patch edges). In the 10 x 10 m patches, where the edge effect was relatively smaller, a greater proportion of sampled plants experienced homogeneous high nutrient availability, as reflected in the higher leaf nutrient concentrations (Hutchings et al. 2003). The stronger scale effect of B. radicans than U. mosambicensis, may indicate root system size differences between the species, with the larger sizes of B. radicans penalizing plants in small patches, or may indicate a greater plastic nutrient acquisition response, e.g., root proliferation in nutrient-rich patches, in U. mosambicensis compared to B. radicans. Nevertheless, scale related responses to nutrient patchiness was probably not an important factor in the study, perhaps because the 2 x 2 m patches were large relative to individual grass root system sizes.
We assumed that the trees in our study had much wider ranging root systems than grasses. It was therefore unexpected that the C. mopane trees outside fertilized patches were unresponsive to the nutrient additions in nearby patches. This suggests that the effective horizontal nutrient uptake capacity of C. mopane trees in our system was limited to only a few meters from stems and probably reflected the short stature

Chapter 3
57
of C. mopane in the study area. The only response of trees (increase in shoot length) outside fertilized patches (i.e., stems more than 2 m distance from patch edges) was observed in the fine scale of patchiness treatment (30 g N m-2, 2005/2006 season). It is likely that the more fragmented patch configuration of this treatment, which resulted in shorter between-patch distances, resulted in these trees having on average more access to the fertilizer than in the 10 x 10 m scale treatment, where patches were at least 10 m apart.
Herbivore responses to scale of resource heterogeneity
We propose that large herbivores closely tracked the forage quality changes brought about by tree vs. grass responses to scale differences in nutrient heterogeneity. The accumulation of nutrients in excess of plant growth demands (luxury nutrient uptake) is probably a key process regulating local herbivore distributions and subsequent impact patterns in the study area. Browsers in the fine scale of nutrient patchiness treatments did not respond, because tree quality was unaffected by the nutrient additions in this treatment, while grass quality did respond (increase), hence grazer impact intensified. However, the differential impacts on the tree and grass layers in our study may also reflect scale-related differences in forage selection between differently sized herbivore species (Ritchie & Olff 1999; Cromsigt & Olff 2006). In the study area, the structural impact on tree canopies was primarily attributed to the feeding actions of elephant (Pretorius 2009). According to scaling theory (Ritchie & Olff 1999), browsing elephant in our study are expected to respond to resources at coarser resource grain sizes, because of their large body size. The high grazer impact in the fine scale treatment might have been caused by the relative (compared to elephant) small-bodied grazers such as impala and zebra, being able to respond to fine scales of resource patchiness. However, elephant are mixed feeders (Pretorius 2009) and we found comparable high densities of uprooted tuft remnants, an indicator of elephant grazing, in both the 2 x 2 m and 10 x 10 m patches fertilized at 30 g N m-2. This suggests that elephant were capable of selecting high quality resources at the fine scale of patchiness, but chose not to respond to trees in the 2 x 2 m patches, where tree leaf quality was unresponsive.
Large herbivore impact on the vegetation in relation to soil nutrient availability
Top down herbivore effects strongly influenced local vegetation patterns in this study. Herbivore impact intensified in nutrient-rich areas, which in some instances resulted in reduced aboveground biomass. This has also been observed in other studies (e.g., Augustine et al. 2003; Loveridge & Moe 2004; Grant & Scholes 2006; Asner et al. 2009). In the study area, the impact on trees and grasses peaked at the highest local soil nutrient concentration. For example, net shoot length of C. mopane trees decreased in the 10 x 10 m - 30 g N m-2 treatment and the intense browser impact that trees in this treatment attracted, was linked to a decrease in tree height over the study period. Similarly, the herbaceous aboveground biomass was also locally reduced in

Nutrients and savannas
58
fertile patches (i.e., 30 g N m-2) in both the large experiment (2006/2007 season) and in the exclosure experiment.
The strong increase in top-down herbivore control with rising nutrient availability might have been partly due to the limited availability of water for plant growth in the semi-arid study area. Water limitations on plant growth mean that plant growth is easier to control by herbivores, because regrowth rates following herbivory is suppressed (Pringle et al. 2007; Guldemond & van Aarde 2008). In addition, grass growth is relatively less responsive to increases in nutrient availability under dry compared to wet conditions (Penning de Vries & Djitèye 1982; Donaldson et al. 1984; Snyman 2002; Fynn & O'Connor 2005; van der Waal et al. 2009), which might, in turn, reinforce herbivore control over the vegetation. In trees, the lack of stimulated growth in the remaining shoots of impacted trees indicates that compensatory growth did not take place, as was found in intensely browsed Acacia nigrescens trees (Du Toit et al. 1990). Instead, new shoots resprouted from growth points close to branch and stem breaks in impacted C. mopane trees, but not vigorously so. The result was that these trees adopted a hedged appearance (Smallie & O’Connor 2000).
In addition, limitations on plant growth imposed by limited water availability are likely to lower the threshold in soil nutrient availability where ‘luxury’ uptake of nutrients takes place, which subsequently accumulates in organs such as leaves, feeding back to increased palatability (Breman & de Wit 1983). Other changes such as relaxed defences, e.g., reduced condensed tannin concentrations in trees, might reinforce these patterns. Conversely, in mesic areas herbivore top down effects may peak in areas of intermediate fertility (van de Koppel et al. 1996). In areas with a high production potential, e.g., fertile mesic savannas, efficient use of nutrients by plants may result in the dilution of absorbed nutrients over a greater biomass and fast recovery of plants following herbivore impact (Pringle et al. 2007). Plants in productive environments also tend to invest more in structural tissue, which further lowers its attractiveness to herbivores. In conclusion, the effect of herbivores on the vegetation may not only dependent on soil nutrient availability, but may be co-dependent on other growth limiting factors such as water availability. Consequences of scale of nutrient patchiness for large herbivore assemblages and
savanna vegetation structure
How the same total amount of nutrients is spatially distributed in an area may significantly change the forage landscape for grazers and browsers, both locally and scaled-up to a landscape level. The visual grazing intensity estimates suggested that grazers were responding to the local fertilizer concentration, and not to the size of patches. Assuming that the grazing intensity estimates correspond with herbaceous biomass off-take measured in the exclosure experiment, whole-plot calculations corrected for fertilized and non-fertilized area size, would suggest that herbaceous off-take by grazers in the 50 x 50 m - 6 g N m-2 treatment was three times higher than in the 10 x 10 m – 30 g N m-2 treatment, in spite of receiving the same total amount of nutrients per plot (15 kg N plot-1, Table 3.4). However, in spite of the high herbaceous

Chapter 3
59
off-take in the 50 x 50 m – 6 g N m-2 treatment, the plot level herbaceous biomass was not suppressed in this treatment. In fact, there was a tendency towards increased herbaceous biomass (Table 3.4). This is supported by the fact that the herbaceous biomass at the end of the growing season was higher than controls in the 6 g N m-2 treatment, while suppressed below controls in the 30 g N m-2 treatment (Fig. 3.6). Probably the intermediate grazing quality response in the 6 g N m-2 local fertilizer concentration treatment prevented overgrazing, resulting in optimal productivity, while overgrazing caused sub-optimal herbaceous production in the 30 g N m-2 fertilizer concentration treatment.
The scale of nutrient patchiness strongly influenced the concentration of nutrients in tree and grass leaves, which largely regulated herbivore distribution and impact patterns in the study area. Given the same total fertilizer load, leaf nutrient concentrations in the 50 x 50 m treatments were diluted, while increasingly concentrated in the 10 x 10 m scale treatment in both trees and grasses and only in grasses in the 2 x 2 m scale treatment. Spatially, nutrient hotspots may exert a disproportionate large influence on herbivore nutrition, by providing scarce nutrients in concentrated form to herbivore species with high or specific nutrient requirements, e.g., small bodied species or lactating animals (Grant & Scholes 2006; Prins & van Langevelde 2008). While the estimated tree canopy volume removed from the heterogeneous – high fertilizer load treatment (10 x 10 m patches – 15 kg N plot-1) was not significantly higher than that of the 50 x 50 m - 15 kg N plot-1 treatment (although there was such a tendency, Table 3.4), the quality of the material removed was much higher as shown by the higher leaf nutrient and lower condensed tannin concentrations, because the material was mostly removed from the high-quality 10 x 10 m patches.
In our study, we could not demonstrate that the scale of patchiness resulted in structural vegetation changes at plot level if the fertilizer load per plot was kept constant, probably because the analyses lacked statistical power (increased chance of a Type II error). Nevertheless, the greatest biomass differences were evident between the 10 x 10 m and 50 x 50 m scale treatments, fertilized at 15 kg N plot-1, for the tree and grass layers, respectively (Table 3.4). In addition, the impact on the tree layer in nutrient rich patches accumulated over the study period, thus scale related effects on tree biomass may become significant in future, if tree stands in the 10 x 10 m patches are continuously reduced. In conclusion, our data demonstrated that not only resource heterogeneity matters in a savanna system, but also the local scale at which it occurs. Instead of scale of nutrient patchiness determining whether the respective grass-grazer or tree-browser subsystems responded (Fig. 3.2), the scale of nutrient patchiness rather acted as a filter, where the tree-browser subsystem did not respond at fine scales of nutrient patchiness, while at coarser scales of patchiness, both tree-browser and grass-grazer subsystems responded. When promoting a high spatial heterogeneity in savanna-grassland systems, as is currently encouraged in biodiversity conservation (du Toit et al. 2003; Cromsigt & Olff 2006), managers should take into account that subtle

Nutrients and savannas
60
changes in the scale of local resource patchiness (e.g., density changes in large vs. small trees, changes in termite mound size and densities and changes in dung midden forming vs. randomly excreting herbivore species) can have far reaching ecological consequences for herbivore assemblages, which may have cascading effects on system properties such as secondary productivity and local changes in vegetation structure. Table 3.4 Summary table showing treatment averages for herbaceous aboveground biomass,
herbaceous biomass off take by grazers, tree leaf biomass per tree and the estimated
percentage of tree canopies removed by browsers in relation to the total amount of
fertilizer plots received and the scale of patchiness at which fertilizer were supplied.
The values in brackets indicate the percentage change from control values.
Fertilizer
load per plot
(kg N plot-1)
Scale of
patchiness
(fertilized
patch size)
Average
herbaceous
biomass per
plot
(kg DM ha-1)
Herbaceous
off take by
grazers (kg
DM ha-1 yr-1)
Tree leaf
mass (g
DM/tree)
Tree
canopy
volume
removed
per plot
(%)
0 control 973 317 21.1 1.5
2 x 2 m 1042 (+7) 358 (+13) 22.3 (+6) 4.8 (+224) 0.6
10 x 10 m 942 (-3) 524 (+65) 20.9 (-1) 5.3 (+254)
2 x 2 m 1097 (+13) 412 (+30) 22.8 (+8) 3.6 (+139)
10 x 10 m 1080 (+11) 791 (+149) 22.2 (+5) 5.2 (+251) 3.0
50 x 50 m 978 (+1) 1354 (+327) 19.7 (-7) 4.6 (+209)
10 x 10 m 913 (-6) 698 (+120) 21.9 (+4) 7.0 (+367) 15.0
50 x 50 m 1278 (+31) 2222 (+601) 26.4 (+25) 4.9 (+226)
Chapter 3
61
Acknowledgements We would like to express our gratitude to Drs T and L Scholtz for making the study site
available; the management of the Associated Private Nature Reserves for granting us
permission to carry out the experiment and Scott Ronaldson for unwavering support as
warden of the Timbavati PNR. The following people were of great help in the field and
laboratory: Tian von Wielligh, Martijn Slot, Floris van Beest, Alex Munro, Stefan Heunis,
Joel Sithole, Lizelle and Bennie van der Waal, Ig Viljoen, Ada Kool, Seline Meijer, Emma
Rees, Kerri-Lee Dyer, Reis Manhique and Anne-Marie van den Driessche. Heidrun Huber
and Liesje Mommer helped with the statistics and Claudius van de Vijver with data
interpretation. The research was funded by NWO - Wotro (grant no. W01.65.216). Omnia
South Africa kindly donated fertilizer.

Nutrients and savannas
62

Chapter 4
63
Chapter 4 Scale of nutrient patchiness mediates resource partitioning between trees and grasses in a semi-arid savanna
Cornelis van der Waal, Hans de Kroon, Ignas M.A. Heitkönig, Willem F. de Boer, Rob Slotow and Herbert H.T. Prins

Nutrients and savannas
64
Abstract 1. Plants respond to nutrient heterogeneity encountered in root zones and are
affected by the scale of patchiness at which nutrients are supplied. In plant communities made up of plants varying in size, differences in the scale (grain size) of nutrient patchiness may result in species composition and structural changes. We tested the hypothesis that the scale of soil nutrient patchiness mediates resource partitioning between co-existing large trees and grasses in a semi-arid savanna.
2. In a crossover field experiment in a semi-arid savanna, focal trees and associated grasses were supplied with N, P or N+P fertilizers at two grain sizes of nutrient patchiness. The growth of marked tree shoots, herbaceous biomass and leaf N and P concentrations were monitored for two years following fertilization.
3. Tree leaf N concentration and shoot length was increased by N fertilization, especially when supplied at a large scale. Tree leaf mass and leaf N concentration were negatively affected when P was supplied in a fine-grained configuration. Condensed tannin concentrations were generally lower in the fine-grained compared to coarse-grained treatment. Condensed tannin concentrations responded idiosyncratically to fertilizer type.
4. N fertilization increased grass leaf N concentration, but the response of grass leaf P concentration to P fertilization was far greater. Herbaceous aboveground biomass in a 5 m radius around focal trees was more suppressed by tree size when fertilized by N, probably reflecting increased tree competitiveness.
5. In conclusion, our data suggest that both the scale of nutrient patchiness and type of nutrients supplied provide axes along which resources may be partitioned between co-existing trees and grasses in savannas.

Chapter 4
65
Introduction Savanna landscapes are heterogeneous systems presenting a patchy distribution of resources in both space and time (Levick & Rogers 2008). It is now realised that not only the overall availability of resources, but also how resources become locally available over time and in space, explains resource partitioning between organisms (Ritchie & Olff 1999; Hutchings et al. 2003; Cromsigt & Olff 2006). For example, plants vary nutrient uptake, biomass accumulation and root vs. shoot allocation patterns when the same amount of nutrients is supplied, but in patches of different sizes (Hutchings et al. 2003; Kume et al. 2006). Scaling theory predicts that organisms respond to different scales of resource patchiness in relation to their own size: Large organisms respond more to larger scales of resource patchiness and small organisms to smaller scales of patchiness (Ritchie & Olff 1999; Hutchings et al. 2003). However, these ideas have seldom been experimentally tested under field conditions (Cromsigt & Olff 2006). Moreover, the new ‘heterogeneity paradigm’ in biodiversity conservation entails that managers should promote a high spatial heterogeneity in savanna-grassland systems to maintain a high species richness and herbivore biomass (du Toit et al. 2003; Cromsigt et al. 2009). If the scale of resource patchiness controls resource partitioning between co-existing trees and grasses, managing for heterogeneity should also take this into account.
Savannas, which cover up to an eight of the earth’s land surface, consist of a continuous layer of small herbaceous plants (mainly grasses) interspersed by large woody plants (hereafter trees) (Scholes & Archer 1997; Sankaran et al. 2004). The partitioning of resources such as water and nutrients between trees and grasses affects important ecological services such as primary and secondary productivity and carbon sequestration (Sankaran et al. 2005; Sankaran et al. 2008). However, in spite of considerable research effort, the factors and mechanisms governing resource partitioning between trees and grasses are still poorly understood in a savanna context (Scholes & Archer 1997; House et al. 2003; Sankaran et al. 2004; Bond 2008). Models explaining tree-grass co-existence based on spatial partitioning of soil resources between trees and grasses has been invoked in the past (Walter 1971; van Wijk & Rodriguez-Iturbe 2002; van Langevelde et al. 2003; Sankaran et al. 2004). However, we are unaware of studies specifically exploring scale differences in resource patchiness as a potential axis for resource partitioning in savanna vegetation. We expect that trees will increasingly benefit from coarse grained (large scale) and grasses from fine grained (small scale) resource patchiness (Ritchie & Olff 1999). However, savanna trees and grasses not only differ in stature, but also differ in growth strategy, investment in chemical deterrents (e.g., condensed tannins) and photosynthetic pathway, which may influence tree vs. grass responses to scale and how acquired resources are used. In a nutrient poor savanna, we experimentally created different scales in nutrient patchiness and subsequently monitored aboveground responses in co-existing trees and grasses.

Nutrients and savannas
66
Nitrogen (N) and phosphorus (P) are generally the most limiting elements for plant growth (Reich & Oleksyn 2004; Elser et al. 2007). The local availability of N and P in soils are controlled by different factors, thus its relative availability in space and time might vary considerably. In addition, plants vary in their absolute and relative requirements of N and P (Kerkhoff et al. 2006), and changes in the relative availability of N and P can alter vegetation composition and structure, potentially affecting higher tropic levels (Elser et al. 2007). If trees and grasses differ in N and P requirements, the supply of different nutrient types might confound responses to scale in heterogeneity or, alternatively, may provide insight into the source of tree vs. grass responses to scale. Grasses, thought to be more responsive to increases in nutrient availability than trees (Bond 2008), are strongly co-limited by N and P in savannas (Penning de Vries & Djitèye 1982; Donaldson et al. 1984; Snyman 2002; Fynn & O'Connor 2005; Craine et al. 2008). In contrast, the state of knowledge of nutrient limitation and use in savanna trees is far from clear (Sankaran et al. 2004; Bond 2008; Sankaran et al. 2008). This limits our understanding of savanna system responses (both vegetation and herbivore) to perturbations in nutrient availability such as increased atmospheric N deposition (Scholes et al. 2003; Dentener et al. 2006). Nevertheless, trees are expected to be generally less dependent on P than grasses, because the higher biomass allocation to structural tissue prohibits a fast relative growth rate in trees. To reach the potential offered by a fast relative growth rate, which presumably feeds back to increased competitiveness against slow growing species, a high P supply is required to sustain rapid protein synthesis (Elser et al. 2007). We therefore expect trees to be relatively insensitive to P additions, while grasses respond to both N and P.
Here we report on the findings of a field experiment in an open Colophospermum mopane savanna where scale (small vs. large enriched patches) and nutrient type (N vs. P) availability were manipulated. In the experiment, scale treatments differed in that the same amount of nutrients were supplied in either one large patch (large scale) or several small patches (small scale), which collectively cover the same area as large patches, thus the local rate of fertilization was kept constant (Fig. 4.1). We expected the following treatment responses: (1) In terms of aboveground growth and leaf nutrient concentrations, trees respond stronger to soil nutrients supplied at the large scale of patchiness and, conversely, grasses respond stronger to nutrients supplied at a small scale of patchiness (Ritchie & Olff 1999; Hutchings et al. 2003). (2) Grasses respond to a combination of N and P fertilization while trees respond mainly to N (Elser et al. 2007).
Study area The study was conducted in the Klaserie Private Nature Reserve (KPNR), situated in the southeastern Lowveld of South Africa. The KPNR is part of the Greater Kruger system, which includes the Kruger National Park (KNP). The woody stratum at the study site is dominated by the tree-form of Colophospermum mopane, while a mixture of grass species including Urochloa mosambicensis, Bothriochloa radicans, Digitaria

Chapter 4
67
eriantha, Panicum maximum and various non-graminoid herbaceous species dominated the continuous herbaceous layer of medium height. The woody component at the study site was selectively thinned in 1989 by cutting trees with chainsaws and treating stumps with a target-selective arboricide. Thus, open woodland with scattered mature C. mopane trees was created in an attempt to improve habitat conditions for sable antelope (Colin Rowles, personal communication). This created a unique opportunity to study tree-grass interactions, as competition between trees was largely eliminated and probably enough time lapsed for enhanced nutrient availability under removed (dead) trees to dissipate (Ludwig et al. 2004).
The soil in the study area is derived from granite-gneiss and is nutrient poor (Venter et al. 2003). This was confirmed by chemical analysis of topsoil (0-15 cm depth) samples analysed according to standard methods by the laboratory of the Agricultural Research Council in Pretoria, South Africa. The topsoil in the study area contained on average (±SE) 0.084±0.004% total N (n=20), 1.11±0.07% total C (n=20) and 5.26±0.52 mg kg-1 extractable P (n=20). The C: N ratio of soils was on average 13.1±0.5. The topsoil pH (water) in similar vegetation (<5 km S) ranged between 6.2 and 6.3 and the aluminium availability between 7 and 8 mg Al kg soil-1, therefore phosphorous immobilization by precipitation is unlikely (Brady & Weil 2002).
Figure 4.1 An illustration of the differences between large-scale (a) and small-scale (b)
nutrient heterogeneity treatments to which mature C. mopane trees were
subjected. The fertilized areas (grey) in large and small scales cover a third of a 5
m radius area around tree stems, respectively. Small-scale patches (n=52) were
approximately 0.8 m in diameter.
The longterm (1997-2007) mean annual rainfall in the study area is 460 mm yr-1. The rainfall received during the study period was; 469 mm during the 2005/2006 season (July to end June), 328 mm during the 2006/2007 season and from July 2007 to end February 2008 (when last measurement was taken), 348 mm, which represents
Large scale
Small scale

Nutrients and savannas
68
average conditions for this period. Large herbivore species occurring in the KPNR includes; African elephant Loxodonta africana, giraffe Giraffa camelopardis, African buffalo Syncerus caffer, zebra Equus burchelli, blue wildebeest Connochaetes taurinus, kudu Tragelaphus strepsiceros, waterbuck Kobus ellipsiprymnus and impala Aepyceros melampus. Herbivore densities at the study site were low, in spite of the open habitat.
Methods Treatments
Eighty C. mopane trees were selected in a 0.5 by 2 km area and were allocated to five geographic blocks. The blocks corresponded to subtle differences in topography (crest and mid slope positions) along the long axis of the study site. The size of tree canopies, determined from scaled photographs, ranged in height from 4.2 to 8.6 m and in diameter from 2.3 to 9.2 m. The horizontal canopy cover calculated from the diameter measurements, ranged from 7 to 66 m2 (5-84% of the 5 m radius treatment area).
A three-way factorial design was followed with N and P fertilization (present vs. absent) and the spatial scale (small vs. large) at which nutrients were supplied as factors. Nutrient treatments consisted of the following: (1) control, (2) fertilization with 785 g N tree-1, (3) fertilization with 523 g P tree-1 and (4) fertilization with 785 g N and 532 g P tree-1. Nitrogen was supplied as a commercial ammonium nitrate fertilizer (28% N) and P as super phosphate (10.5% P). The spatial scale treatments consisted of two different patch configurations in which nutrients were supplied. In both cases a third of the surface area covered in a 5 m radius around tree stems were fertilized, with the difference that in the large-scale treatment one pie-shaped patch was fertilized and in the small-scale treatment 52 evenly spaced circular patches with a diameter of 80 cm were fertilized (Fig. 4.1). Therefore local N and P fertilizer concentrations were the same in both scale treatments, namely, 30 g N m-2 and 20 g P m-2. The fertilizer was applied in December 2005 through early January 2006. Respective controls were assigned to large- and small-scale treatments. Two replications were allocated per block, which yields a total of ten replications (total n=80). Measurements
At the start of the experiment, four shoots per C. mopane tree were selected in the 1.5 to 2.5 m height stratum and marked with aluminium rings. During the mid (January to March) growing seasons of 2006/2007 and 2007/2008, the length of all newly produced twigs were measured and totalled per shoot. Distinctive dry season growth scars, which mark the proximate end of new shoots and the lighter colour of new growth, facilitated clear identification. All leaves produced per shoot were counted. C. mopane are deciduous and new leaves are formed on new-season shoots. During the 2006/2007 season, C. mopane flowered and trees which produced pods were subsequently recorded.

Chapter 4
69
The herbaceous aboveground biomass was determined in the 5 m radius area around focal tree species during the mid growing seasons of 2006/2007 and 2007/2008. Herbaceous biomass was determined with a standard disc pasture meter (DPM) (Bransby & Tainton 1977; Zambatis et al. 2006). Thirty readings were stratified around focal tree stems. For large-scale treatments, ten readings were taken in the fertilized third and twenty readings in the remaining untreated area. The calibration curve of Zambatis et al. (2006), determined for similar swards in the Kruger National Park (boundary ≈50 km E), was used to convert average DPM readings to aboveground herbaceous biomass (kg DM ha-1).
For leaf quality determination of C. mopane trees, ten fully expanded leaves were randomly plucked from the 1.5 – 2.5 m height stratum per tree, excluding marked shoots, during the wet seasons of 2006/2007 and 2007/2008. Leaf samples were contained in open paper bags and kept in the shade in a well ventilated room until further processing. Subsequently, samples were dried to constant weight at 60 ºC, weighed and ground through a 1 mm sieve. For grass leaf N and P concentration measurements, dominant grass species contributing ≈30% or more of the total herbaceous biomass were sampled during the 2006/2007 wet season for a subset of trees. A random selection of tufts was clipped close to the ground with shears and the material contained in open paper bags per species. For large-scale treatments, the dominants in both treated and untreated fractions were sampled and separately analysed. This allowed the calculation of an area-corrected response in leaf N and P concentration for large-scale treatments. In total 90 grass samples were sampled. Both C. mopane and grass leaf samples were analysed at the Wageningen University, The Netherlands. After destruction with a mixture of H2SO4, Se and salicylic acid, N and P concentrations were measured with a Skalar San-plus auto-analyser (Novozamsky et al. 1983). Condensed tannin in C. mopane leaves were analysed according to the Proanthocyanidin method (Waterman & Mole 1994). Given the problems of applying an appropriate standard for the proanthocyanidin method (Waterman & Mole 1994), the data are presented as final absorbance at 550 nm following du Toit et al. (1990).
Statistical analyses Before fieldwork commenced during the 2006/2007 season, five trees selected for the experiment were pushed over by elephants and were subsequently not further considered. For the tree data, linear mixed models with N-fertilization, P-fertilization and scale as fixed factors in a full factorial design were used with the year of measurement as the repeated effect and trees as subjects. An autoregressive covariance matrix was assumed for the repeated measures. To test if tree responses were related to tree size, tree cover was entered as covariate in models. Response variables consisted of leaf N and P concentrations (arcsine transformed), leaf condensed tannin absorbance values, annual shoot length increment, number of leaves per shoot and shoot diameter of marked shoots and mean leaf mass (logarithmically transformed). Geographic block was entered as a random effect in models.

Nutrients and savannas
70
Herbaceous aboveground biomass data were significantly related to tree cover in both years. However, a significant N*Tree cover interaction (linear mixed model, F2,73=3.7, P=0.029) indicated that the assumption of homogeneous regression slopes were violated (Field 2005). Therefore, Pearson correlation analyses were used to describe the tree cover-grass biomass relationships for the different treatment groups. Bonferroni corrections were used to detect significant differences between groups. A Generalized Linear Model was used to relate patterns in seed bearing (presence-absence) in C. mopane trees to treatment factors (N, P and scale). A binomial distribution and identity link function were used in the model. All analyses were performed in SPSS v. 15.
Results Chemical response of C. mopane leaves to treatments
The concentration of N in C. mopane leaves differed between the study years (linear mixed model, F1,67=27.3, P<0.001; Table 4.1) and decreased on average with 7% from the 2006/2007 season to the 2007/2008 season (2.31 vs. 2.13%). Of the main factors, C. mopane leaf N concentration was affected by both N fertilization (F1,66=6.0, P=0.017) and the scale of patchiness (F1,66=4.3, P=0.042) (Table 4.1). On average N fertilization increased leaf N concentration with 5%, while concentrations in large-scale treatments were 4% higher than in the small-scale treatments (Fig. 4.2). However, the leaf N concentration of C. mopane responded to fertilizer type in complex ways between years (Year x N x P interaction effect; F1,67=7.3, P=0.009) (Table 4.1). Compared to controls, N fertilization increased the leaf N concentrations of the N-only and N + P treatments in the 2006/2007 season, but not in the 2007/2008 season, while, the leaf N concentration in the P-only treatment was on average reduced with 10% in 2008 (Fig. 4.2).
On average the concentration of P in C. mopane leaves did not differ between the two sample years (linear mixed model, P>0.05), but responded differently to P-fertilization between years (Year x P interaction; F1,8=11.4, P=0.001) (Table 4.1). Accordingly, P-fertilized trees had relatively higher leaf P concentrations in 2007, but relatively lower leaf P concentrations in 2008 than non-P treatments (Fig. 4.2).
Condensed tannin concentrations (absorbance) in C. mopane leaves increased on average with 17% from the 2006/2007 to the 2007/2008 season (F1,64=24.1, P<0.001). Of the main effects only the scale of patchiness affected condensed tannin concentrations (F1,60=13.0, P=0.001; Table 4.1), which tended to be higher in small-scale than large-scale treatments. The Year x P x Scale interaction (F1,64=8.3, P=0.005) indicates that condensed tannin concentrations were strongly affected by the scale of P-fertilization in the 2007/2008 season, but not in the 2006/2007 season. In the P-fertilized treatments in the 2007/2008 season, condensed tannin values increased in small-scale treatments, while decreasing in large-scale treatments relative to controls (Fig. 4.2). In addition, in C. mopane leaves in the 2006/2007 season, condensed tannin values were negatively correlated with leaf P concentration (Pearson, r=-0.28, P=0.017) and trees with green (immature) pods
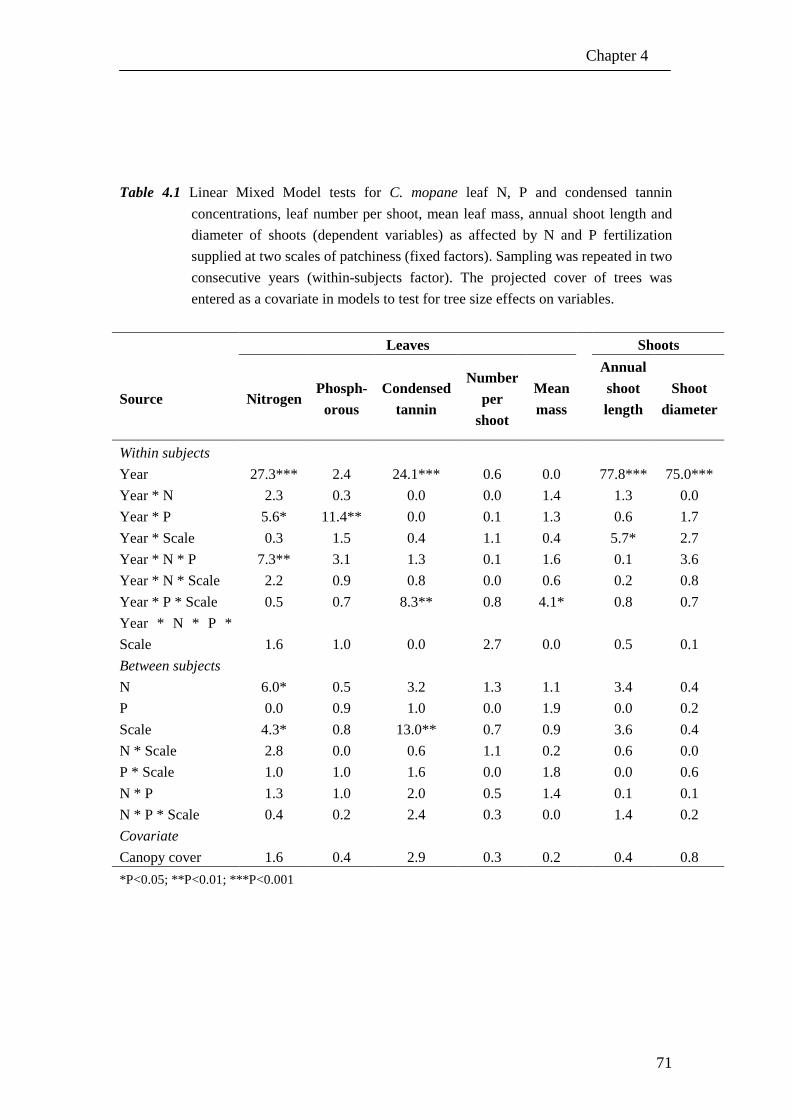
Chapter 4
71
Table 4.1 Linear Mixed Model tests for C. mopane leaf N, P and condensed tannin
concentrations, leaf number per shoot, mean leaf mass, annual shoot length and
diameter of shoots (dependent variables) as affected by N and P fertilization
supplied at two scales of patchiness (fixed factors). Sampling was repeated in two
consecutive years (within-subjects factor). The projected cover of trees was
entered as a covariate in models to test for tree size effects on variables.
*P<0.05; **P<0.01; ***P<0.001
Leaves Shoots
Source Nitrogen Phosph-
orous
Condensed
tannin
Number
per
shoot
Mean
mass
Annual
shoot
length
Shoot
diameter
Within subjects
Year 27.3*** 2.4 24.1*** 0.6 0.0 77.8*** 75.0***
Year * N 2.3 0.3 0.0 0.0 1.4 1.3 0.0
Year * P 5.6* 11.4** 0.0 0.1 1.3 0.6 1.7
Year * Scale 0.3 1.5 0.4 1.1 0.4 5.7* 2.7
Year * N * P 7.3** 3.1 1.3 0.1 1.6 0.1 3.6
Year * N * Scale 2.2 0.9 0.8 0.0 0.6 0.2 0.8
Year * P * Scale 0.5 0.7 8.3** 0.8 4.1* 0.8 0.7
Year * N * P *
Scale 1.6 1.0 0.0 2.7 0.0
0.5 0.1
Between subjects
N 6.0* 0.5 3.2 1.3 1.1 3.4 0.4
P 0.0 0.9 1.0 0.0 1.9 0.0 0.2
Scale 4.3* 0.8 13.0** 0.7 0.9 3.6 0.4
N * Scale 2.8 0.0 0.6 1.1 0.2 0.6 0.0
P * Scale 1.0 1.0 1.6 0.0 1.8 0.0 0.6
N * P 1.3 1.0 2.0 0.5 1.4 0.1 0.1
N * P * Scale 0.4 0.2 2.4 0.3 0.0 1.4 0.2
Covariate
Canopy cover 1.6 0.4 2.9 0.3 0.2 0.4 0.8

Nutrients and savannas
72
Figure 4.2 Responses of C. mopane trees not fertilized (C) or fertilized in December 2005
with N, P or a combination of N and P (NP). Fertilizer was supplied either in a
single patch (large scale) or distributed over 52 small patches (small scale).
Response variables, measured in two consecutive years (2006/2007 and 2007/2008)
during the wet season, consisted of: Leaf N and P concentrations, condensed tannin
concentration (absorbance values), annual shoot length increment per tree and the
mean leaf mass per tree. Back transformed means and 95% confidence limits are
given. The variation attributed to a random block factor has been accounted for
(marginal means). Asterisks above bars indicate significant Least Square
Differences from control values: * P<0.05, ** P<0.01, *** P<0.001.

Chapter 4
73
present had on average 9% higher (t-test, t=-2.2, d.f.=73, P=0.031) condensed tannin levels relative to trees without pods. In the 2007/2008 season, when no pods were produced, leaf condensed tannin values were negatively correlated with leaf N concentration (Pearson, r=-0.36, P=0.001) and aboveground herbaceous biomass (r=-0.23, P=0.049). In neither year were leaf condensed tannin concentration correlated with branch-level tree growth measurements such as annual shoot length increase, leaf number per shoot or mean leaf mass produced per shoot nor by the height (size) of trees (Pearson, P>0.10). To summarize, the concentrations of the nutrients N and P, and the deterrent, condensed tannin in C. mopane leaves mostly showed inter-annual variation and responded in complex ways to the scale and fertilizer type treatments. Generally, scale responses followed predictions with higher nutrient concentrations and lower condensed tannin concentrations in the large- compared to small-scale of patchiness treatments, although these responses only emerged during the 2008 season. There was also a tendency for P fertilization, especially the P-only treatment, to negatively affect foliar quality, e.g., lower leaf N and higher condensed tannin concentrations, particularly when supplied in a fine-grained configuration.
Mopane growth and reproduction response
Growth of C. mopane trees at a shoot level was affected by the fertilizer and scale treatments. The annual shoot length increment, across all treatments, differed between years (linear mixed model; F1,66=77.8, P<0.001) and strongly increased from the 2006/2007 to the 2007/2008 season (333 vs. 570 mm shoot-1)(Fig. 4.2) . While not significantly related to either N or P fertilization per se, the significant year x scale interaction (F1,66=5.7, P=0.020) indicated that shoot growth was affected by the scale of nutrient patchiness (Table 4.1). The interaction indicate that the annual shoot length per shoot in large scale treatments were 35% longer than shoot lengths in small scale treatments, while no scale-related differences occurred during the 2006/2007 season (Fig. 4.2). The mean leaf mass of C. mopane trees did not differ between the sample years (P>0.05) or between the main fertilizer type or scale treatments. However, the significant Year x P x Scale interaction (F1,67=4.1, P=0.047) means that the leaf mass in P-fertilized, small-scale treatments were lower than the leaf mass of P-fertilized, large scale treatments in the 2006/2007 season, while, conversely, in non-P treatments the mean leaf mass was increased in the small scale relative to the large scale treatment (Fig. 4.2). This pattern disappeared in the 2007/2008 season when treatments were indistinguishable (Fig. 4.2). Neither the number of leaves per shoot nor the diameter of shoots differed between the study years or between treatments (P>0.1), indicating that these measures were unresponsive to fertilization and the spatial configuration of nutrients (Table 4.1). Only during the 2006/2007 season were C. mopane trees reproducing. Fewer trees produced pods in N-fertilized trees (Wald Chi-square=4.5, n=75, P=0.034) than

Nutrients and savannas
74
control or P-fertilized trees. Tree reproduction was unaffected by P-fertilization or the scale of fertilization (P>0.1).
Herbaceous chemical response
The concentration of N and P in grass leaves was affected by the treatments. The leaf N concentration of grasses responded to N fertilization (Anova, F1,11=10.2, P=0.009; Table 4.2) and was on average increased by 23% compared to grasses not fertilized with N (1.89 vs. 1.53%; Fig. 4.3). Grass leaf P concentration was highly responsive to P fertilization (F1,11=57.2, P<0.001; Table 4.2) and was on average increased by 120% in P-fertilized grasses compared to grasses not fertilized with P (0.31 vs. 0.14; Fig. 4.3). In addition, the P x Scale interaction (F1,11=5.2, P=0.042; Table 4.2) indicate that the leaf P concentration of grasses growing within large-scale fertilized patches were relatively more increased by P fertilization than that of grasses in the small-scale – P fertilizer treatment (Fig. 4.3). However, if responses are scaled up to the whole 5 m radius study area (by correcting the leaf P concentration values from grasses in large scale patches and those in paired non-fertilized areas for the relative area covered), the interaction effect of scale and P fertilization was not significant (F1,11=0.5, P>0.2). This suggests that the high leaf P response of grasses in large patches covering only a third of the focal area did not offset the lower, but widespread response of grasses in small-scale treatments. The leaf P concentration of grasses was decreased by N fertilization (F1,11=4.8, P=0.051). To summarize, grasses appeared to be highly responsive to P fertilization but only moderately responsive to N fertilization. Furthermore, N fertilization resulted in decreased leaf P concentrations. The scale of nutrient patchiness had strong local effects, especially with regards to leaf P concentrations, but appears to have little influence on whole-plot responses in leaf N and P during the 2006/2007 season. Table 4.2 ANOVA tests for mean leaf N and P concentrations of dominant grasses associated
with C. mopane trees (dependent variables) as affected by different type of fertilizer
(N, P or N+P) supplied at two spatial scales of patchiness (fixed factors). The
projected tree cover of trees was included as a covariate in the analyses.
*P<0.05; **P<0.01; ***P<0.001
Leaf concentration
Source Nitrogen Phosphorous
N 10.2** 4.8
P 0.0 57.2***
Scale 0.3 0.2
N * Scale 2.3 1.2
P * Scale 0.4 5.2*
N * P 0.4 4.2
N * P * Scale 0.4 0.0
Canopy cover (covariate) 4.7 1.1

Chapter 4
75
Herbaceous biomass response
The aboveground herbaceous biomass was negatively correlated with C. mopane canopy cover for both the 2006/2007 (Pearson, r=-0.29, n=74, P=0.014) and 2007/2008 (r=-0.30, n=74, P=0.010) seasons, meaning that lower herbaceous biomass was associated with larger trees. However, the relationship between tree cover and herbaceous biomass was influenced by N fertilization. In both seasons herbaceous biomass was negatively correlated with tree cover in the N fertilizer treatments (2006/2007, r=-48, n=37, P=0.003; 2007/2008, r=-48, n=36, P=0.003) and not significantly correlated in non-N treatments (P>0.1; Fig. 4.4). This suggests that herbaceous biomass was increasingly suppressed as tree size increase, but only when fertilized with N. If the data was split according to scale, negative relationships between herbaceous biomass and tree cover emerged in both years in large-scale treatments (2006/2007, r=-0.34, n=38, P=0.034; 2008, r=-0.35, n=38, P=0.034), but not in small-scale treatments (P>0.1). This suggests that herbaceous biomass was more suppressed with increasing tree size if fertilized at a large scale, although this effect was not strong (Fig. 4.4).
Figure 4.3 Responses of (a) leaf N concentration and (b) leaf P concentration of grass
swards associated with single C. mopane trees in relation to fertilization with nitrogen (N) or phosphorous (P), which were supplied either in a single patch (large scale) or distributed over 52 small patches (small scale). The leaf N and P concentrations represent mean values of the dominant grass species sampled per tree. In large-scale treatments, values represent only grasses within fertilized patches, while a random sample was taken in the small-scale treatments. Back transformed (marginal) means and 95% confidence limits are given. Means were evaluated at a tree cover of 14.6 m2. Asterisks above bars indicate significant Least Square Differences from control values: * P<0.05, **P<0.01, P<0.001.

Nutrients and savannas
76
Figure 4.4 The relationships between C. mopane tree canopy cover and the aboveground
biomass of herbaceous plants in a 5 m radius area around tree stems for trees not
fertilized and fertilized with nitrogen (N) for the 2006/2007 and 2007/2008
seasons. The data show that herbaceous biomass is increasingly suppressed when
trees (and swards) are fertilized with N.
Discussion Spatial scale influences nutrient expression in savanna plants
Our data support the predictions by Ritchie & Olff (1999) and Hutchings et al. (2003) that the scale of resource patchiness has important consequences for resource partitioning between co-existing organisms encountering patchy resources at different scales. Accordingly, trees responded more to the same amount of nutrients added in a single large patch than supplied in many small patches during the second year after fertilization, when average rainfall conditions prevailed. Drought in the first sample year probably obscured the scale effects. In the second year scale effects emerged: Leaf N concentrations were higher, shoot length increased more and condensed tannin concentrations were lower in large-cale vs. small-cale treatments. In woody plants, condensed tannin concentrations typically decrease with increasing nutrient availability (Haukioja et al. 1998; but see Ferwerda et al. 2005). In the large-cale treatment receiving both N and P, trees were the superior competitors, which resulted

Chapter 4
77
in stimulated growth and subsequently lower investment in condensed tannin production (cf. Bryant et al. 1992; Herms & Mattson 1992). Therefore the lower condensed tannin concentration in large-scale trees corroborates the notion that trees benefited more if the same amount of nutrients is supplied at a relative large scale than at a small scale. Different explanations, acting alone or in concert, may account for the scale-mediated response observed in C. mopane trees. First, several experiments have demonstrated that individual plants benefit more from the same amount of nutrients supplied in appropriately scaled (usually larger) patches, rather than scattered over many small patches (Hutchings et al. 2003) or homogeneously distributed (Birch & Hutchings 1994; Fransen et al. 1998). Decreased performance in small-scale (relative to plant root system size) nutrient environments may be related to the inability of plant root responses to accurately match the fragmented spatial configuration of nutrient-rich patches, with subsequent additional costs involved for responding plants (Hutchings et al. 2003; Kume et al. 2006).
Second, in the small-scale treatments more grasses probably experienced heterogeneous soil nutrient conditions, compared to large-scale treatments where most grasses experienced either a high or a low homogeneous soil nutrient supply. It follows that if grasses responded (enhanced nutrient uptake) to soil heterogeneity, which is expected in fast growing plants with high tissue turn-over rates (Fransen & De Kroon 2001; Kembel & Cahill 2005; de Kroon & Mommer 2006), then total nutrient uptake should be higher in the small-scale relative to large-scale treatments (Birch & Hutchings 1994; Hutchings et al. 2003). If so, increased resource acquisition by grasses in the small-scale treatments results in less resources available for trees in small-scale relative to large-scale treatments. However, the herbaceous data failed to show a significant response to the scale of nutrient patchiness, at least in aboveground parts.
Indirect evidence suggests that the effect of grass competition in the small-scale treatments intensified relative to large-scale treatments under specific conditions. During the first year after fertilization, the mean leaf mass of C. mopane trees decreased and, in the second year, leaf condensed tannin concentration dramatically increased in the small-scale, P-fertilized treatment, which might be an indication of decreased resource availability for trees (Bryant et al. 1992; Stamp 2003). As grasses were shown to be highly responsive to P fertilization in our study, a possibility is that the competitiveness of grasses in this treatment interfered with the resource supply (e.g., water and nutrients) to trees (Knoop & Walker 1985; Stuart-Hill & Tainton 1989; Riginos 2009), resulting in stunted leaf development and increased leaf tannin concentrations in C. mopane. In the large scale treatment, herbaceous competitiveness probably intensified locally in the fertilized portion (1/3 of area) with trees able to acquire resources through other modules in the remainder unchallenged (de Kroon et al. 2005).
To summarize, our data suggest that not only soil resource heterogeneity in the vertical dimension can have important implications for resource partitioning between

Nutrients and savannas
78
trees and grasses (Knoop & Walker 1985; Scholes & Archer 1997; Sankaran et al. 2004), but also heterogeneity in the horizontal dimension (see also Jeltsch et al. 1998). Differential responses of trees and grasses to N and P additions
Co-existing grasses and trees appeared to be affected differently by N and P additions. The data suggest that trees were positively affected by N addition, but not by P addition alone. The negative relationship between tree cover and herbaceous biomass when fertilized with N, suggests that the competitiveness of trees increased with N fertilization, but that the magnitude of this effect depended on tree size (Stuart-Hill & Tainton 1989). In the N-only treatment, the delayed or suppressed reproduction in C. mopane trees probably reinforced the positive N growth response, as more resources were available for growth in non-reproducing trees, while resources were shared between growth and pod production in reproducing trees. While C. mopane trees responded positively to N additions, trees tended to respond negatively to P-only additions, apart from an increase in leaf P concentrations during the 2006/2007 season. In the P-only, small-scale of patchiness treatment, C. mopane trees had reduced individual leaf mass and decreased leaf N concentrations during the 2007/2008 season, indicating negative responses to P additions. In contrast to trees, grasses showed a remarkable capacity to take up P as inferred from the strong leaf P response, lthough no biomass response was observed. The classical interpretation of nutrient limitation focuses on biomass responses only. Two lines of evidence, however, suggest that P fertilization intensified the competiveness of grasses, thereby negatively affecting trees. First, tree leaf N concentrations were reduced in the P-only fertilizer treatment, especially where supplied in a small-scale configuration (2007/2008 season). Coincidently, grass leaf P concentrations peaked in this treatment. Second, the mean leaf mass of C. mopane decreased in the P-only fertilized (small-scale) treatment in the 2006/2007 season. Ludwig et al. (2001) demonstrated that grasses are relatively more P-limited under the canopies of large trees, where soil N accumulate (Treydte et al. 2008), while relatively more N limited in open sub-habitats. This suggests that grass nutrition mediates competitive effects on adult trees (Knoop & Walker 1985; Riginos 2009) and that soil P availability play an important role in this process. Taken together, we propose that the C. mopane had relatively greater N than P requirements under the prevailing study conditions, which increased its competitiveness with grasses, especially where N was supplied in a single large patch. In agreement, Ferwerda et al. (2005) found in a pot experiment that C. mopane seedling growth was unresponsive to P fertilization, in spite of very low P background levels in the growth medium (i.e., 2.1 g P m-3). These seedlings were responsive to N additions. Conversely, co-existing grasses in our experiment were more limited by P availability and P additions apparently increased their competitiveness with regards to trees, especially where P was supplied in a small-scale configuration.

Chapter 4
79
It is possible that savanna trees generally have lower P requirements than grasses. In savannas, grasses are known to be strongly co-limited by both N and P. Data across marine, freshwater and terrestrial systems suggest that rapidly growing organisms commonly have relatively high P requirements to sustain rapid protein synthesis (Elser et al. 2007). Grasses generally have higher relative growth potentials than trees. Trees allocate substantial biomass towards woody structure instead of resource-capturing tissue (Bond et al. 2003; Bond 2008). In addition, the grasses in the study area follow the C-4 photosynthetic pathway, while C. mopane follows the C-3 pathway (Turekian et al. 1998). The nitrogen-use efficiency of C-4 plants is higher than that of C-3 plants (Ehleringer & Monson 1993; Craine et al. 2008). This lowers a plant’s relative dependency on N. Mantlana et al. (2008), for instance, found closer correlations between photosynthetic rates and leaf P than with leaf N in herbaceous C-4 plants in Botswana. Lastly, that P is particularly valuable for savanna (C-4) grasses is also suggested by the higher leaf P resorption efficiency, relative to broadleaf (non-N2 fixing) trees in the KNP (Ratnam et al. 2008). However, N2 fixing trees (e.g., members of Fabaceae) might have high P requirements, as N2 fixation demands a high P supply. It should also be borne in mind that grass species vary substantially in their absolute and relative requirements for N and P (Snyman 2002; Fynn & O'Connor 2005), which might well be the case for trees as well. For example, in forestry P fertilization increases the growth rate of Eucalyptus species (e.g., Campion & Scholes 2007). Lack of herbaceous biomass response to fertilization
Fertilization did not increase herbaceous aboveground biomass in the nutrient-poor study area. In related studies Belsky (1994) did not find a fertilizer effect below large-tree crowns, and Ludwig et al. (2001) found only a modest herbaceous biomass response to P fertilization below crowns. In our experiment a substantial proportion of the 5 m radius area, in which biomass was estimated, occurred below tree crowns. This may partly account for the insignificant response to fertilization. In addition, the low mean rainfall in the study area probably prevented a strong herbaceous response to nutrient additions (Penning de Vries & Djitèye 1982; Donaldson et al. 1984; Snyman 2002; Fynn & O'Connor 2005; van der Waal et al. 2009). Lastly, we did not quantify the impact of herbivores on the herbaceous layer, and it is possible that grazer effects confounded herbaceous biomass responses to fertilization. In fact, in semi-arid savannas herbaceous biomass can be reduced in nutrient hotspot areas frequented by grazers (Augustine et al. 2003; Grant & Scholes 2006). Implications for savanna systems
Our results suggest that the scale of nutrient patchiness provides an additional axis for resource partitioning between co-existing trees and grasses. This, in turn, may influence various ecological services. First, the decomposition rate of leaf litter is largely influenced by litter quality, which, in turn, depends on leaf N concentrations (closely correlated with C: N ratio) and condensed tannin concentrations. Condensed

Nutrients and savannas
80
tannin immobilise N, hence slows down decomposition rates. Nutrient cycling through tree leaf litter (C. mopane is deciduous) might have been enhanced by a presumably higher leaf litter quality in the large-scale, N fertilized treatments. In the small-scale, P-only fertilized treatment, nutrient cycling was probably decreased. Second, leaf N, P and condensed tannin concentrations largely determined the nutritional quality of forage for large herbivores. Differential changes in the leaf quality of trees and grasses may influence the selection patterns of the browsing and grazing guilds, respectively. Lastly, the ultimate regulatory role of scale of nutrient heterogeneity on the ratio of the tree and grass components in semi-arid savannas probably also depend on interactions with other factors such as fire and water availability, which were not considered in this study. If trees indeed benefit from a high soil N availability as the data suggest, we would expect trees to dominate N-rich savannas. This is clearly not the case. In a recent meta-analysis, Sankaran et al. (2008) showed that tree cover in savannas across Africa declined with increasing soil N availability. Reconciling these ideas, we propose that mature trees benefit from N additions (especially if supplied at scales of patchiness relevant to trees), but that recruitment during the establishment phase may be increasingly constrained under fertile (e.g., high N) conditions, which, over time, might feed back to reduce tree cover (Kraaij & Ward 2006; Sankaran et al. 2008; van der Waal et al. 2009). If correct this suggests that established trees benefit from increased atmospheric N deposition in the short term, but tree cover may be negatively affected over the long term as recruitment fails to offset adult tree mortality, resulting in a more open state. Atmospheric N deposition has increased over the last decades in South Africa due to large-scale power generation from coal (Scholes et al. 2003). In conclusion, our data provide field support for the notion that local changes in resource heterogeneity influence resource partitioning between different sized plants (Hutchings et al. 2003). This study and the recent studies by Cromsigt & Olff (2006, 2008) and Cromsigt et al. (2009) suggest that local differences in resource heterogeneity may be an important factor mediating resource partitioning between plants and animals in savanna systems. This study also proposes that the scale of resource patchiness should be considered when promoting a high spatial heterogeneity to conserve biodiversity (du Toit et al. 2003; Cromsigt et al. 2009). Small changes in the scale of resource patchiness can have far reaching repercussions for savanna processes, which may influence its functioning.

Chapter 4
81
Acknowledgements We are grateful to the owners and management of the Senalala Estate for making the study
site and rainfall data available, to the research steering committee of the Associated Private
Nature Reserves for granting us permission to carry out the research and to Colin Rowles,
warden of the KPNR, for unwavering support. The following people were of great help in
carrying out the experiment; Tian von Wielligh, Alex Munro, Stefan Heunis, Emma Rees,
Joel Sithole, Kerri-Lee Dyer, Lizelle van der Waal, Wynand Buys, Anne-Marie van den
Driessche and Reis Manhique. The work benefitted greatly from discussions with Elmar
Veenendaal and Lourens Poorter. The research was financially supported by NWO - WOTRO
(grant no. W01.65.216).

Nutrients and savannas
82

Chapter 5
83
Chapter 5
Large herbivores alter vegetation structure through soil nutrient mediation in a semi-arid savanna: Lessons from a natural experiment with abandoned kraals Cornelis van der Waal*, Ada Kool*, Seline S. Meijer*, Hans de Kroon, Edward Kohi, Ignas M.A. Heitkönig, Willem F. de Boer, Frank van Langevelde, Rina.C. Grant, Mike J.S. Peel, Rob Slotow, Andrew K. Skidmore, Henrik J. de Knegt, Emmanuel Mwakiwa, Yolanda Pretorius, Sipke E. van Wieren and Herbert H.T. Prins * Authors contributed equally

Nutrients and savannas
84
Abstract 1. In savannas, the tree-grass balance largely governs plant and animal
productivity. In this paper we show how herbivores may indirectly influence vegetation structure through soil nutrient mediation.
2. We studied the current soil nutrient status, tree and grass biomass patterns and large herbivore use of nine former livestock holding pen areas (kraals) in a semi-arid, nutrient-poor savanna and contrasted these with nearby control sites located in the surrounding landscape. The kraals, formerly enriched by livestock dung and urine, were abandoned around 1970 and wildlife utilization became the predominant form of land use since.
3. We found that around 40 years later, kraal sites still qualified as nutrient hotspots, with high concentrations of inorganic N, extractable P, K, Ca and Mg in the soil. The high nutrient availability was related to high plant production potential and high quality forage. Intense grazing and high large herbivore dung and urine rates apparently accelerated local nutrient cycling rates in kraal sites.
4. Structurally, kraal sites had very low tree densities compared to control sites. Experimental evidence suggests that the tree seedling recruitment was increasingly constrained when competing with grasses under fertile conditions, which might explain the low tree recruitment in kraal sites.
5. The improved visibility offered by structurally open patches, such as abandoned kraal sites, probably offer improved predator detection for large herbivores. By spending non-foraging time on kraal sites, more nutrients are deposited as dung and urine than taken up and exported, which might explain the persistence of high concentrations of mobile nutrients in kraal soils.
6. Large herbivores may indirectly keep nutrient hotspot areas structurally open by maintaining high local soil fertility, which constrains woody recruitment in a positive feedback loop. In turn the maintenance of nutrient hotspots by large herbivores may have important consequences for the habitat quality of herbivores in nutrient-poor savannas.

Chapter 5
85
Introduction An important theme in savanna ecology is how resources, such as water and nutrients, as well as disturbances, such as fire and herbivory, determine the balance between woody and herbaceous components (Scholes & Archer 1997; Sankaran et al. 2004, 2005, 2008). Variation in the tree-grass balance largely determines savanna functioning, because it affects animal production, shapes animal assemblages and determines carbon sequestration capacities (Scholes & Archer 1997; Sankaran et al. 2004, 2005). Direct effects of herbivores on savanna structure (e.g., browsers reducing woody cover) are well documented (Scholes & Archer 1997; van Langevelde et al. 2003). However, indirect effects of herbivores, such as herbivory reducing grass fuel loads which in turn suppresses the impact of fire on the tree layer (van Langevelde et al. 2003; Holdo et al. 2007; but see Hanan et al. 2008), are less well studied in spite of their potentially large impact on savanna structure (e.g., Waldram et al. 2008). Potentially herbivores can change the availability of soil nutrients in an area which, in turn, alters the competitive balance between functionally different growth forms (Wilson & Tilman 1993; Bokdam 2001). Such an indirect effect has to our knowledge not yet been demonstrated for trees and grasses in savanna-grassland systems, in spite of reports of strong herbivore effects on local soil nutrient availability (Bardgett & Wardle 2003; Augustine et al. 2003). In this paper we address the question whether the effects of large herbivores on soil nutrient availability have consequences for the tree-grass balance in a semi-arid savanna. To test this we propose that two requirements should be met: (1) it should be shown that large herbivores significantly change local soil nutrient availability and (2) that the vegetation structure (i.e., tree-grass biomass ratio) is significantly altered by local nutrient availability.
First, large herbivores alter soil nutrient availability for plants through changes in soil nutrient cycling rates and spatial redistribution of soil nutrients (Ritchie et al. 1998; Bardgett & Wardle 2003). In a comprehensive review, Bardgett & Wardle (2003) concluded that differences in soil fertility determine the direction of nutrient-mediated herbivore effects on nutrient cycling rates and plant productivity; positive net effects occur under fertile soil conditions and negative net effects under infertile soil conditions. Enhanced local nutrient cycling by large herbivores has been invoked as a mechanism explaining the formation and maintenance of grazing lawns in African savannas (McNaughton et al. 1997). In addition, animals spatially redistribute nutrients if they take in nutrients in one area, but excrete nutrients in resting or sleeping areas (Singer & Schoenecker 2003; Moe & Wegge 2008). Substantial amounts of nutrients can be redistributed by large herbivores in this way (Jewell et al. 2007). In a modelling study, de Mazancourt et al. (1998) showed that although enhanced nutrient cycling contributes to short-term positive herbivore-soil nutrient feedbacks, a net import of nutrients is crucial for the long-term maintenance of locally nutrient-rich, productive grazing areas. However,

Nutrients and savannas
86
apart from East African studies (e.g., McNaughton et al. 1997; Augustine et al. 2003), information about the mechanisms underlying soil nutrient-large herbivore feedbacks in an African savanna context is scant (Jacobs et al. 2007).
Second, Sankaran et al. (2008) found that tree cover in African savannas was negatively correlated with N availability. A mechanism proposed to explain the nutrient-woody cover relationship is that the co-existing grasses increasingly outcompete woody seedlings under fertile conditions, which results in a more open vegetation structure (Sankaran et al. 2008). In arid and semi-arid savannas tree cover is presumably determined by tree seedling establishment success (Higgins et al. 2000). Therefore, if herbivores change local soil nutrient availability and tree seedling establishment is affected by these changes, the structure of savanans may be indirectly altered.
To address these issues we studied a ‘natural’ experiment in a semi-arid savanna, where commercial livestock (mainly cattle) ranching was practiced from the early 1900’s until about 1970. Since then wildlife has been the dominant land use form. During the livestock era, livestock was kept in enclosures (locally known as ‘kraals’) at night to safeguard the animals against predators and theft. The outcome was that nutrients accumulated in kraals as a result of the high deposition of nutrients (taken up while grazing during the day) in the form of dung and urine (Blackmore et al. 1990; Augustine 2003). After the change in land-use, the former kraal sites remained as nutrient hotspots in the landscape (see also Augustine 2003). In this paper we compare the current soil nutrient status and vegetation structure of kraal sites with control sites located in the surrounding landscape. The main objectives were to test (1) whether the effects of nutrient enrichment created by large herbivores (managed livestock) were still detectable in the soil and vegetation decades after abandonment, (2) if wild large (i.e., > 5 kg) herbivores accelerate local soil nutrient availability in abandoned kraal sites, (3) if wild large herbivores maintain a high local soil nutrient status by importing nutrients into abandoned kraal sites, (4) if woody plant have invaded kraal sites after the kraals were abandoned and (5) if tree seedling recruitment in grass swards is constrained under fertile conditions (Sankaran et al. 2008).
Methods Study area and selection of study sites
The study was carried out in the Associated Private Nature Reserve (APNR), consisting of the Timbavati, Klaserie, and Umbabat Private Nature Reserves and the Balule Nature Reserve (latitude 24°03´– 24°33´S; longitude 31°02´– 31°29´E), which combined covers an area of more than 1 700 km2. The APNR is situated in the South African Lowveld and abuts the Kruger National Park (KNP) in the east. In the APNR, commercial livestock farming (mainly cattle) was widely practiced during the first half of the 20th century, but proved uneconomical due to limited market access, predator problems (mainly lion) and the high prevalence of tick

Chapter 5
87
borne diseases. Around 1970, livestock ranching was finally abandoned and wildlife related enterprises became the dominant landuse form. Game fences separating individual reserves and the KNP were removed by 1993, enabling wildlife to move freely between the conservation areas (Bigalke 2000). Soils in the APNR are predominantly derived from weathered granite and gneiss (Venter et al. 2003) and the availability of nutrients such as N and P are generally low (Treydte et al. 2007), but heterogeneously distributed in the landscape (Grant & Scholes 2006; Treydte et al. 2007). In the study area, the mean annual precipitation ranges between 450 mm and 600 mm. Fires in the APNR are controlled and generally exceed a fire return period of three years A well developed woody layer includes species such as Sclerocarya birrea, Acacia nigrescens, Combretum apiculatum and Colophospermum mopane. The herbaceous layer includes grass species such as Urochloa mosambicensis, Bothriochloa radicans, Digitaria eriantha, Panicum maximum, Heteropogon contortus and a wide variety of forb species. Plant nomenclature follows Gibbs-Russel (1990) for grasses and Coates Palgrave et al. (2002) for trees.
Large herbivore species occurring in the APNR includes: African elephant Loxodonta africana, giraffe Giraffa camelopardalis, African buffalo Syncerus caffer, zebra Equus burchelli, blue wildebeest Connochaetes taurinus, kudu Tragelaphus strepsiceros, waterbuck Kobus ellipsiprymnus and impala Aepyceros melampus. Predators include lion Panthera leo, leopard Panthera pardus and spotted hyena Crocuta crocuta. Mammal nomenclature follows Kingdon (1997).
Nine deserted kraal sites with paired controls were selected in the APNR. Kraal sites (range, 10-30 m diameter) were identified in the field by residents with knowledge of the layout of former farming infrastructures. The presence of old fencing material such as posts and wire, confirmed the locations of kraal sites. The midpoints of control sites were located at a 200 m distance from kraal midpoints and were chosen at the same topographical position in the landscape as kraal sites to minimize the confounding effect of topography on kraal-control comparisons. The study was conducted during the wet season from November 2006 to March 2007.
Soil collection and analysis
To contrast the fertility of kraal soils with that of the surrounding soils, we analyzed soils sampled in kraal and control sites. At each site, about 30 kg topsoil (0-15 cm depth) was collected at six random locations per site, pooled, sieved and thoroughly mixed. Sub-samples were chemically analyzed by the Agricultural Research Council in Nelspruit, using standard procedures (Anonymous 1990). For the analyses, cations were extracted with ammonium acetate, aluminium was extracted with KCL and available P was determined according to the Bray 1 method. The pH of soils was measured according to the water method (Anonymous 1990). The soil nitrogen mineralization rates were determined in only eight kraal– control pairs over a 28 day period in the wet season. We used a field incubation method to quantify the in situ net N mineralization rate (Robertson et al. 1999;

Nutrients and savannas
88
Grant & Scholes 2006; Coetsee et al. 2008). For this purpose, six stainless steel pipes (length 15 cm; diameter 5 cm) were implanted per site so that 10 cm pipe length was buried. The pipe tops were covered and a side hole aboveground allowed gas exchange. Net mineralization rates were calculated as the difference between nitrate and ammonium concentrations at the start and end of the incubation period, after correcting for soil moisture (Robertson et al. 1999; Coetsee et al. 2008). Start-incubation soil samples were taken within 30 cm radius of implanted incubation pipes. Soil samples were pooled per site and 10 g sub-samples, contained in plastic bags, were kept on ice until extraction with KCL (Robertson et al. 1999; Grant & Scholes 2006; Coetsee et al. 2008). Extracts were analyzed for nitrate and ammonium concentration by the Institute for Soil, Climate and Water of the Agricultural Research Council in Pretoria, South Africa (Coetsee et al. 2008). The texture of soil sub samples was determined following Sammis (1996).
A bio-assay with maize Zea mays was carried out to validate the findings of the soil chemical analysis. Soil sub-samples of that collected in kraal and control sites (n=18) were contained in nursery bags, and five maize seeds (commercial supply) were planted per bag. The maize plants were kept in a nursery and rainfall was supplemented with frequent watering. After two months the above ground phytomass was harvested, dried (70 °C) to constant mass and weighed. Plant mass was taken as an indicator of soil nutrient status.
Vegetation biomass and forage quality
The aboveground herbaceous biomass of kraal and control sites was estimated by taking 100 readings per site with a standard Disc Pasture Meter during February 2007 (Bransby & Tainton 1977; Waldram et al. 2008). We used the disc settling height – herbaceous biomass calibration curve, derived for swards in the KNP, of Zambatis et al. (2006). Herbaceous swards in the study area have rather similar species composition and biomass as swards in the KNP (10-60 km E).
The woody layer was assessed in 200 m² plots, or in the case of smaller kraal sites the largest plot area that fitted into kraal sites (minimum, 60 m2). Live woody plants rooted within survey areas were counted and canopies measured according to the BECVOL method (Smit 1989a, 1989b). Canopy measurements consisted of tree height, maximum canopy diameter, height of maximum canopy diameter, height of lowest leaves and canopy diameter at lowest leaves. We calculated the dry leaf mass of tree canopies by using the allometric regressions between canopy measurements and leaf biomass calibrated for individual species provided in the BECVOL software (Smit 1996).
To determine if forage quality was higher in kraal sites than in control sites, we analyzed leaf samples of the common grass Urochloa mosambicensis, which occurred on all sites except one control site. Leaf material from a random selection of U. mosambicensis tufts were collected per site, pooled, dried to constant weight at 70 0C and milled through a 1 mm sieve. N, P, Ca, Mg, Na and K content were measured with a Skalar San-plus autoanalyzer at the laboratory of the Wageningen

Chapter 5
89
University (the Netherlands) after destruction with a mixture of H2SO4, Se and salicylic acid (Novozamsky et al. 1983).
Herbivore use of kraal sites
The use of kraal and control sites by large herbivores was assessed by (1) calculating dung accumulation rates in marked plots (Augustine 2003), (2) using exclosure cages to assess consumption (Ydenberg & Prins 1981; McNaughton et al. 1996) and (3) assessing the frequency of herbaceous tuft use (Grant & Scholes 2006). First, dung piles were counted in rectangular plots. For kraal sites, the maximum area that fitted within kraal sites were used, while a default of 20 x 50 m plot size was used for control sites. Dung piles were marked with small painted stones at the beginning of the study period (December 2006). After a 33 to 45 day period, new dung piles (unmarked) were counted per species. The identification of dung was aided by experienced field rangers. Second, grazer exclosures (n = 16), 1 m x 1.5 m in size (wire netted cage), were installed in December 2006. After eight weeks the herbaceous vegetation in two 0.5 m x 0.5 m quadrates were clipped close to the ground inside the grazer protected cage and two quadrates alongside cages (controls). The cuttings from cages and controls were separately pooled, dried and weighed. Third, at each site we assessed the closest herbaceous plant to 100 points spaced 1 m apart for presence or absence of recent grazing signs following Grant & Scholes (2006). Plant utilization was expressed as the percentage of tufts that was utilized per site. Woody seedling recruitment
To test the hypothesis that herbaceous competition intensifies to the detriment of tree seedling establishment, we conducted two experiments using the tree species C. mopane. It was chosen because it dominates large parts of the study area and has been implicated as a bush encroacher (Smit 2001; MacGregor & O’Connor 2002). We therefore expected C. mopane to be a likely candidate to invade abandoned kraal sites within its distribution range. In support, re-measurement of woody transects originally conducted in 1980 in the study area (Witkowski & O'Connor 1996) revealed that C. mopane increased in density and expanded its distribution range in the study area (G. Roux, unpublished data).
In the first experiment we tested the effects of soil fertility and seedling predation by large herbivores on the survival rate of tree seedlings co-existing with herbaceous vegetation in the field. Increased seedling predation by large herbivores might also cause reduced tree recruitment in areas of high herbivore densities, such as found on nutrient hotspots (Grant & Scholes 2006). This might also explain lower tree recruitment in fertile areas. The experiment was conducted in the Timbavati Pivate Nature Reserve in an area open to wildlife. In this experiment we transplanted pre-grown C. mopane seedlings (van der Waal et al. 2009) into field plots (size = 5 x 10 m) that were fertilized at increasing rates: 0 (control), 1.2 g N m-
2, 6 g N m-2 and 30 g N m-2. The fertilizer was spread by hand in December 2006,

Nutrients and savannas
90
using a commercial NPK fertilizer (element ratio = 3 N: 2 P: 1 K). The experiment was replicated three times (total n = 12). In December 2006, two groups, consisting of six C. mopane seedlings each, were transplanted into each plot (total n=144). Per plot, one seedling group of six seedlings was protected against large herbivore use in wire exclosures, while the second group of six seedlings was not protected. The exclosures (4 m in diameter) were constructed from standard fence poles, with 1.8 m high wire netting and effectively excluded herbivores the size of hares and larger. Seedlings were transplanted after 54 mm of rain was received. No extra water was given during the experiment. Four months after transplantation, the seedlings were scored as ‘alive’ (green leaves or buds present) or ‘dead’ (green leaves and buds absent).
The second experiment tested the hypothesis that the effect of herbaceous competition on tree seedlings intensifies with increasing soil fertility (Sankaran et al. 2008). For this purpose a pot experiment with the topsoil collected in kraal and control sites, for which the inorganic N and extractable P concentrations were determined as described above, was conducted. For each of the kraal and control sites (n=2 x 9), three pots were filled with the soil collected from kraal and control sites (see soil collection and analyses section). Per site, one pot was allocated a single grass seedling (U. mosambicensis or U. panicoides, which could not be distinguished at the seedling stage), the second pot had a single C. mopane seedling and in the third pot a mixture of a grass and a C. mopane seedling was planted. Grass seedlings were grown in seedling trays before transplantation into pots. The C. mopane seedlings were obtained from a site where run-off water from buildings collected after rains and where a large number of seedlings germinated, which probably originated from the same nearby tree. C. mopane seedlings were allowed to establish in pots before grasses were planted into the mixture treatments. During the experiment, rainfall was supplemented with irrigation. After three months, seedling height, number of leaves, stem diameter and aboveground dry mass of C. mopane seedlings and above ground grass biomass (dried at 70ºC to constant weight) were measured per pot. For the C. mopane seedlings, the relative competition index (RCI) was calculated for seedling height, leaf number, stem diameter and above ground biomass following Davis et al. (1998):
Where X is the larger value of either single-plant performance (Performancesingle) or mixture-plant performance (Performancemixture). A RCI value of zero indicates that competitors had no effect on target plant performance and a RCI value of one indicates maximum competition intensity (competitive exclusion).
Performancesingle – Performancemixture RCI = X

Chapter 5
91
Data analyses Paired t-tests were used for kraal-control comparisons of soil properties, the bio-assay and herbaceous biomass. Because of the collinearity between soil texture classes, only differences between the sand fractions were tested. All percentage and concentration data were arcsine transformed to improve the distribution of data. The herbaceous biomass and the bio-assay data were logarithmically transformed, except for the exclosure cage biomass data that was not transformed. The pH data was exponentially transformed. Wilcoxon signed-rank tests were used to test for differences in woody density and leaf mass.
The difference between kraal and control sites for dung pile densities was tested with a generalized linear model. Since most species data were over dispersed (variance>mean), a negative binomial distribution was assumed. A logarithmic link function was used and transect size was entered as an offset-variable to account for the smaller transect sizes in some kraal sites.
A logistic regression analysis was used to test whether fertilizer (4 levels) and herbivore exclusion (open vs. protected) treatments affected C. mopane seedling survival patterns in a full factorial model. In a control plot and a 1.2 g N m-
2 fertilizer treatment plot, four and five seedlings respectively, were dug out within weeks after transplantation, presumably by honey badgers Mellivora capensis. These data were omitted from the analysis. All statistical analyses were done in SPSS (v. 15).
Results Soil characteristics
All sites had sandy top soils (Table 5.1). There was no difference in the percentage sand (t8 = -1.551, P>0.05) between controls and kraals (87 vs. 92%; Table 5.1). Given that paired control sites were selected at the same topographical positions, the similar sand fractions between kraals and controls suggest that the soils of kraals and the nearby controls were subjected to the same geomorphologic processes. This implies that differences between kraal and control sites were caused by cattle management and subsequent environmental and biotic influences.
The concentrations of the following elements were on average higher in kraal top soils compared to control top soils: inorganic N (8.1 vs. 2.6 mg N kg soil-1; t7 = -3.268, P < 0,05; Table 5.1), extractable P (144.9 vs. 5.6 mg P kg soil-1; t8 = -7.225, P<0.001), Ca (2794 vs. 847 mg Ca kg soil-1; t8 = -5.423, P < 0.01), K (643 vs. 290 mg K kg soil-1; t8 = -3.799, P < 0.01) and Mg (498 vs. 226 mg Mg kg soil-1; t8 = -3.284, P < 0.05; Table 5.1). Na and Al concentrations were not statistically different (paired t-test, P > 0.05) between kraal and control soils (Table 5.1). The mean pH of kraal soils was higher than the mean pH of control soils (7.6 vs. 6.3; t = -7.43, df = 8, P < 0.001; Table 5.1).

Nutrients and savannas
92
Table 5.1 A comparison of the textural and chemical properties of the top soil (0-15 cm
depth) of abandoned kraal sites and nearby control sites in a semi-arid savanna. The
results of a bio-assay with standard maize are also indicated. Back transformed
means and 95% confidence limits are given.
Trait n Units Mean (95% CL) P
Control Kraal
Texture Sand
fraction 18 %
87
(80-92)
92
(85-97) ns
Chemical Inorganic N 16 mg kg-1 2.6
(0.7-5.7)
8.1
(2.5-16.9) *
N min.
(all sites) 16
mg N
kg-1 day-
1
0.21
(0.05-0.37)
0.33
(-0.08-0.73) ns
N min. (dry
sites
excluded)
12
mg N
kg-1 day-
1
0.18
(-0.02-0.38)
0.55
(0.26-0.84) *
P 18 mg kg-1 5.6
(2.2-10.5)
144.9
(79.2-230.2) **
Ca 18 mg kg-1 847
(616-1115)
2794
(1935-3810) **
Mg 18 mg kg-1 226
(143-328)
498
(365-651) *
K 18 mg kg-1 290
(217-374)
643
(462-854) **
Na 18 mg kg-1 11
(7-15)
16
(10-26) ns
Al 18 mg kg-1 7.5
(7.1-8.0)
7.9
(6.4-9.5) ns
pH (water) 18 mg kg-1 6.3
(6.2-6.4)
7.6
(7.3-7.9) ***
Bio-assay (Zea mays) 16 g pot-1 3.9
(2.7-5.8)
9.5
(6.7-13.5) *
Significance level: *** < 0.001, ** < 0.01, * <0.05, ns ≥ 0.05
Differences in the net nitrogen mineralization rate between kraal and control sites were not significant (0.33 vs. 0.21 mg N kg soil-1 d-1; P>0.05; Table 5.1). However, two sites received less than 38 mm rain during February (≈incubation period), compared to 80 to 121 mm rain received at the remaining sites (n=6). If the two dry sites are omitted, the net N mineralization rate in kraal sites was on average higher

Chapter 5
93
than for control sites (0.55 vs. 0.18 mg N kg soil-1 d-1; t5 = 3.794, P < 0.05; Table 5.1).
Maize grown in kraal soils produced on average 9.5 g per pot, which is significantly more (t7 =3.14, P < 0.05) than the 3.9 g per pot of plants grown in control soils (Table 5.1). Plant quality and quantity
Concentrations in U. mosambicensis leaves were higher in kraal sites compared to control sites for N (2.89 vs. 1.6%; t7 = 4.733, P < 0.01), P (0.46 vs. 0.13%; t7 = 5.292, P < 0.01) and K (3.6 vs. 2.2%; t7 = 3.608, P < 0.01; Table 5.2). Differences in Ca, Mg and Na concentrations between kraal and control sites were not significant.
The woody density of kraal sites was much lower than the density of control sites (Z = -3.684, P < 0.001). Only three woody plants were encountered in the nine kraal transects with the result that the median woody density of kraal sites was 0 trees ha-1 (range, 0-100 plants ha-1), which contrasts sharply with the median density of 1700 plants ha-1 (range, 200 – 3000 plants ha-1) of control sites. Similarly, the median woody leaf biomass was lower (Z = -3.686, P < 0.001) on kraal sites (median = 0 kg DM ha-1; range, 0 - 2 kg DM ha-1) than control sites (median = 734 kg DM ha-1; range, 107 - 1553 kg DM ha-1). The above ground herbaceous biomass on kraal sites was not significantly different from the control site biomass (781 vs. 928 kg DM ha-1; t8 = 1.007, P > 0.05, Table 5.2). Consequently, the woody leaf-herbaceous biomass ratios in kraal sites (range, 0.000 - 0.006) were much lower than ratios of control sites (range, 0.106 - 3.107). Herbivory
The mean herbaceous biomass inside grazer cages after eight weeks was 1108 kg DM ha-1, which is significantly higher than the 621 kg DM ha-1 measured outside cages at kraal sites (t7 = 4.31, P < 0.01). At control sites the difference between the herbaceous biomasses inside and outside of grazer cages was not significant (P > 0.05), indicating that grazers significantly reduced swards at kraal sites but not at control sites. The frequency of herbaceous plant utilization was also higher on kraal sites than control sites (45 vs. 12%; t8 = -6.409, P<0.01; Table 5.2). Dung accumulation and herbivore species composition
The density of all large herbivore dung piles combined was higher in kraal sites than control sites (Wald Chi Square = 22.9, P < 0.001). Individual species with significantly higher average dung accumulation rates on kraal sites were impala (24.7 vs. 1.2 piles ha-1 d-1; Wald Chi Square = 28.6, P < 0.001), duiker Sylvicapra grimmia (4.4 vs. 0.2 piles ha-1 d-1; Wald Chi Square = 18.9, P < 0.001), waterbuck (1.9 vs. 0.1 piles ha-1 d-1; Wald Chi Square = 12.7, P < 0.001) and steenbok Raphicerus campestris (0.9 vs. 0.1 piles ha-1 d-1; Wald Chi Square = 5.5, P = 0.019). The densities of buffalo, elephant, giraffe and warthog Phacochoerus africanus

Nutrients and savannas
94
were not higher (P>0.05) on kraals compared to controls (Table 5.3). No dung of kudu or wildebeest were found in control transects (Table 5.3). Table 5.2 A comparison between control and kraal sites in terms of the leaf chemistry of
Urochloa mosambicensis leaves sampled in control and kraal sites, the
herbaceous above ground biomass and the percentage of herbaceous plants
grazed. The sampling and measurements were done in February 2007. Back
transformed means, 95% confidence limits and the significance level of group
differences are given.
Characteristic n Unit Mean (95% CL) P
Control Kraal
Leaf N 17 % 1.6
(0.8-2.6)
2.8
(2.2-3.3) **
chemistry P 17 % 0.13
(0.06-0.23)
0.46
(0.33-0.61) **
K 17 % 2.15
(1.1-3.6)
3.58
(2.96-4.27) **
Ca 17 % 0.57
(0.28-0.95)
0.73
(0.67-0.79) ns
Mg 17 % 0.26
(0.13-0.44)
0.39
(0.29-0.49) ns
Na 17 % 0.24
(0.11-0.42)
0.20
(0.12-0.31) ns
Biomass Herbaceous 18
kg
DM
ha-1
928
(562-1532)
781
(494-1233) ns
Utilization Herbaceous
plants 18 %
12
(6-21)
45
(29-62) **
Significance level: *** < 0.001, ** < 0.01, * <0.05, ns ≥ 0.05
Using mean dung pile dry mass (C.C. Grant, unpublished data; Table 5.3) and the mean faecal N and P content values (Grant et al. 1995, 2000), the N inputs by individual species were calculated (Table 5.3). The N deposition rate through large herbivore dung at kraal sites was calculated as 1.2 g N m2 yr-1, compared to only 0.1 g N m2 yr-1 for control sites. At kraal sites, impala deposited the most N via dung (on average 40% of all species), followed by elephant (31%) and giraffe (8%; Table 5.3). Conversely, at control sites elephants deposited the most N in dung (on average 53% of all species), followed by giraffe (18% of total) and impala (16% of total; Table 5.3).

Chapter 5
95
Soil fertility, herbivory and C. mopane recruitment
In the field fertilization and exclosure experiment, the establishment success (survival rate) of transplanted C. mopane, after four months in the field, was significantly related to fertilizer treatments (Wald = 13.981, d.f. = 3, P < 0.01; Fig. 5.1), but was not related to herbivore exclusion (Wald = 0.448, d.f. = 1, P > 0.05). The fertilizer x exclosure interaction was also not significant (Wald statistic = 5.104, d.f. = 3, P > 0.05). In the fertilizer treatments, the establishment success was lower in the 6 g N m-2 (Wald = 5.320, d.f. = 1, P < 0.05) and 30 g N m-2 (Wald = 10.607, d.f. = 1, P < 0.01) treatments compared to controls, but the establishment success of seedlings in the 1.2 g N m-2 treatments was not different from controls (Wald = 0.002, d.f. = 1, P > 0.05; Fig. 5.1). Table 5.3 A comparison of control (n=9) and kraal sites (n=9) of dung pile and N
deposition rates of large-herbivore species occurring in the study area. Dung N
deposition was calculated from mean dung pile weights and mean dung N
concentrations. Animal census numbers for a total helicopter count in 2006 of
the Klaserie PNR, where most study sites were located, are also depicted. Means
± SE are given.
* na - data not available
Species Num
bers
Dung pile deposition
rate
(piles ha-1 d-1)
Mean
dung
pile
mass
% N
in
dung
Dung N deposition
rate (g N ha-1 d-1)
Control Kraal (g) Control Kraal
Impala 7649 1.2 ± 1.5 24.7 ±
20.1
28.8 1.73 0.61 12.36
Steenbok na* 0.1 ± 0.1 0.9 ± 1.2 6.6 2.27 0.01 0.14
Duiker na 0.2 ± 0.1 4.4 ± 3.2 9.6 2.30 0.04 0.97
Kudu 385 0.0 0.1 ± 0.2 172.9 1.84 0.00 0.35
Giraffe 320 0.1 ± 0.1 0.4 ± 0.6 289.5 2.08 0.68 2.66
Warthog 163 <0.1 ±
0.1
<0.1 ± 0.1 116.3 1.66 0.05 0.09
Elephant 569 0.5 ± 0.3 2.2 ± 1.9 384.0 1.17 2.01 9.81
Buffalo 1657 0.1 ± 0.1 0.3 ± 0.5 221.2 1.15 0.21 0.67
Wildebeest 102 0.0 <0.1 ± 0.1 186.0 1.24 0.00 0.10
Waterbuck 95 0.1 ± 0.1 1.9 ± 2.2 199.8 1.16 0.18 4.39
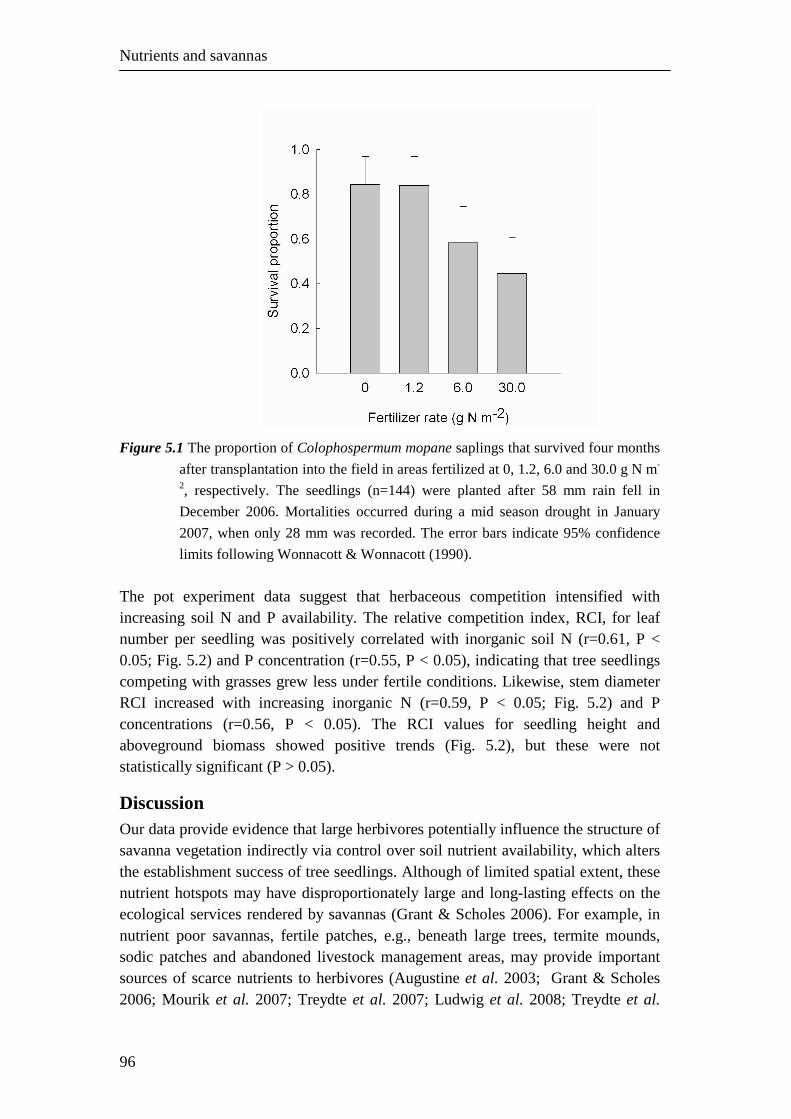
Nutrients and savannas
96
Figure 5.1 The proportion of Colophospermum mopane saplings that survived four months
after transplantation into the field in areas fertilized at 0, 1.2, 6.0 and 30.0 g N m-
2, respectively. The seedlings (n=144) were planted after 58 mm rain fell in
December 2006. Mortalities occurred during a mid season drought in January
2007, when only 28 mm was recorded. The error bars indicate 95% confidence
limits following Wonnacott & Wonnacott (1990).
The pot experiment data suggest that herbaceous competition intensified with increasing soil N and P availability. The relative competition index, RCI, for leaf number per seedling was positively correlated with inorganic soil N (r=0.61, P < 0.05; Fig. 5.2) and P concentration (r=0.55, P < 0.05), indicating that tree seedlings competing with grasses grew less under fertile conditions. Likewise, stem diameter RCI increased with increasing inorganic N (r=0.59, P < 0.05; Fig. 5.2) and P concentrations (r=0.56, P < 0.05). The RCI values for seedling height and aboveground biomass showed positive trends (Fig. 5.2), but these were not statistically significant (P > 0.05).
Discussion Our data provide evidence that large herbivores potentially influence the structure of savanna vegetation indirectly via control over soil nutrient availability, which alters the establishment success of tree seedlings. Although of limited spatial extent, these nutrient hotspots may have disproportionately large and long-lasting effects on the ecological services rendered by savannas (Grant & Scholes 2006). For example, in nutrient poor savannas, fertile patches, e.g., beneath large trees, termite mounds, sodic patches and abandoned livestock management areas, may provide important sources of scarce nutrients to herbivores (Augustine et al. 2003; Grant & Scholes 2006; Mourik et al. 2007; Treydte et al. 2007; Ludwig et al. 2008; Treydte et al.

Chapter 5
97
2008). In fact, Ludwig et al. (2008) calculated that wildebeest nutrition in the Tarangire National Park depends on the inclusion of the high quality grazing found underneath large trees. If the heterogeneity in grazing resource quality created by large trees is lost, e.g., trees increasingly destroyed, then wildebeest nutrition may fall below maintenance levels. Our data indicate how resource heterogeneity is created and maintained and how this affects savanna functioning in the study area (du Toit et al. 2003). Herbivore control over local nutrient availability
While P is relatively immobile and therefore has a long residence time in soils (Blackmore et al. 1990; Augustine 2003), which might explain its high concentrations in kraal soils, inorganic N is potentially rapidly lost from topsoil through volatilization, denitrification, fire and leaching (Augustine 2003; Hejcman et al. 2007). Thus the high inorganic N concentrations in kraal soils after almost half a century suggest that nutrient attrition by these abiotic processes were counteracted, presumably by biotic ones. Figure 5.2 Relative Competition Index (RCI) values of C. mopane seedling leaf number,
stem diameter, seedling height and biomass (above ground) in relation to
inorganic soil N concentration (a-d) and extractable soil P concentration (e-h).
RCI values greater than 0 indicate that C. mopane seedlings were relatively
suppressed if grown with grasses. Values below 0 indicate facilitation of
seedlings by grasses. The soils used in the experiment were collected from
abandoned kraal and control sites in the study area.

Nutrients and savannas
98
Large herbivores probably accelerated nutrient cycling in kraal sites. Our data for the kraal sites thus fits the accelerated nutrient cycling scenario originally proposed by Ritchie et al. (1998), which appears to be characteristic of fertile systems (Bardgett & Wardle 2003). We found that herbivores consumed substantial amounts of the above ground biomass, while depositing large amounts of nutrients through dung (and urine) at kraals sites, probably because kraals offered high quality grazing. For example, P concentrations in U. mosambicensis leaves found in kraals (0.46%) were on average more than 3.5 times higher than the P in control U. mosambicensis leaves (0.13%; Table 5.2), and in the foliage of browse species such as Acacia nigrescens (0.10%), Combretum apiculatum (0.09%) and C. mopane (0.12%) in the study area (Kos et al., submitted). Through these actions, large herbivores provide a shortcut to the slow nutrient release from plant litter through decomposition, by rapidly processing vegetation and depositing nutrients in plant-available forms (Bardgett & Wardle 2003). In addition, the higher mineralization rates of kraal sites (provided that enough rain fell), might be due to the stimulation of soil biota by animal excreta, as well as the higher litter quality (Bardgett & Wardle 2003) suggested by the high leaf nutrient concentrations of U. mosambicensis in our study. In the absence of herbivory, nutrient cycling rates at kraal sites are likely to slow down as a greater proportion of nutrients is immobilized in plant and organic tissue and thus rendered temporarily unavailable for plant uptake.
It seems likely that wild large herbivores in the study area subsidized kraal nutrient pools by importing nutrients from the surrounding landscape (Blackmore et al. 1990; Augustine 2003, 2004). De Mazancourt et al. (1998) showed that a continuous nutrient influx is required for the long-term maintenance of fertile areas in infertile grazing systems. Large herbivores have been shown to redistribute substantial amounts of nutrients if daily behavioural activities are spatially separated, e.g., feeding vs. resting or bedding places (Bokdam 2001; Juchnowicz-Bierbasz & Rakusa-Suszczewski 2002; Singer & Schoenecker 2003; Augustine 2004; Moe & Wegge 2008). It is important to note that herbivore responses to high forage quality alone is unlikely to create strong nutrient redistribution effects, because the high nutrient intake will be largely offset by nutrient excretion while grazing. Spending non-foraging time in an area is required for significant nutrient redistribution to occur.
Predator mediated herbivore soil nutrient distribution
In our study area, a likely cause for the redistribution of nutrients by large herbivores to kraal sites may be anti-predator behaviour displayed by savanna ungulate species (Augustine 2004; Riginos & Grace 2008). Riginos & Grace (2008) recently found that savanna herbivores (except species immune to wild predators, e.g., elephants) prefer open areas with unobstructed visibility, apparently to improve predator detection (Riginos & Grace 2008). In Laikipia, Kenya, impala prefer to spend time in structurally open boma sites, even during the dry season when forage

Chapter 5
99
resources were depleted (Augustine 2004). As a result impala imported substantial amounts of nutrients from the surrounding bushland areas into the boma sites (Augustine 2003, 2004). In our study area, it is likely that abundant species such as impala, played similar roles in maintaining the nutrient status of the open kraal sites. Preliminary data of a habitat manipulation experiment in the general study area indicate that impala visitation (track density in spoor plots and dung accumulation) increased in two out of three patches (30 m diameter) where woody plants were removed, relative to undisturbed, nearby controls (E. Kohi, unpublished data). This implies that impala were attracted to the openness of the habitat, a preference also noted by Estes (1992), which subsequently resulted in an influx of nutrients. Bush encroachment, which affects large parts of the study area, might inadvertently facilitate this process by decreasing overall visibility, thus reducing the number of areas of perceived safety. The point is that in dense woodland areas, such as the study area, patches offering good visibility stand out as safe havens for herbivores dependent on vigilance to avoid predation. In turn, the increasing proportion of non-foraging time spent in open areas causes an inward flux of nutrients, which influences the resources available to plants. Soil fertility effects on tree recruitment
Our data clearly showed that woody recruitment was more constrained under fertile conditions than infertile ones, if competing with herbaceous plants. Woody plants failed to re-colonize kraal sites since their abandonment, while evidence of bush encroachment in the general study area prevailed (G. Roux, unpublished data), a trend also observed for woody cover in the nearby Kruger National Park’s granitic areas (Eckhardt et al. 2000). The results of our experiments suggest that the effect of herbaceous competition on tree seedlings intensifies under fertile conditions. This was also found in other experiments with tree seedlings and grasses (Cohn et al. 1989; Debain et al. 2005; Kraaij & Ward 2006; van der Waal et al. 2009) and suggests that the openness of kraal sites might be at least partially explained by the suppressing effects of herbaceous competition on tree recruitment (Sankaran et al. 2008).
An alternative explanation for the low tree establishment success in fertile patches might be that fertile areas attract more herbivores, which may cause higher woody seedling predation (and trampling) rates (Augustine & McNaughton 2004). For example, our dung data suggest that impala occupied kraal sites on average 20 times more often than the control sites. Since impala are known seedling predators (Prins & van der Jeugd 1993; Sharam et al. 2006) their increased presence could translate into higher seedling predation rates in fertile areas. However, the data of the exclosure experiment, conducted in an area where impala were common, did not support this although we acknowledge that the short study period prevent firm conclusions in this regard. Nevertheless, Augustine & McNaughton (2004) concluded after a two year herbivore exclusion experiment, that tree seedling predation by large herbivores was not higher on fertile bomas, in spite of

Nutrients and savannas
100
significantly higher herbivore densities (especially that of impala) on boma sites (Augustine et al. 2003; Augustine & McNaughton 2004). In fact, Goheen et al. (2004) found that large herbivores facilitated tree seedling survival in a Kenyan savanna by suppressing rodent and invertebrate predation of seedlings, which were not considered in our study. Likewise, Fornara & du Toit (2008) found higher Acacia sapling densities in a high-herbivory area compared to a low-herbivory area in the KNP, suggesting that tree seedling recruitment was at least not suppressed in areas frequented by large herbivores. However, while the interplay between seedling predation by large herbivores and soil fertility on tree seedling establishment appears to be unimportant, herbivores occurring at high densities, such as in fertile areas, can have strong direct effects on tree cover by suppressing the recruitment of saplings into larger size classes (e.g., Augustine & McNaughton 2004; Fornara & du Toit 2008). In conclusion, we propose that two linked large herbivore–soil-nutrient feedback loops explain the observed patterns in abandoned kraal sites. First, the structurally open kraal sites were preferred by predator-avoiding large herbivores, which caused a net influx of nutrients into these sites (Fig. 5.3, feedback loop A). Figure 5.3 A hypothetical model showing how anti-predator behaviour of herbivore species
may drive a positive feedback loop (A) by increasing the soil nutrient
availability through nutrient importation, which, in turn, constrains woody
recruitment thus keeping patches in a structurally open state. Simultaneously
the higher nutrient availability attracts herbivores (also those participating in
A), which speed up nutrient cycling, thus reinforcing high soil nutrient
availability (feedback loop B).
Structurally open patches preferred
by herbivores
Nutrient influx
Increased nutrient
availability
Constrained woody recruitment
Predators
Accelerated nutrient cycling
A
B
Increased herbivory
High forage quality and production

Chapter 5
101
In turn the high soil nutrient availability constrained woody recruitment, which was feeding back to keep these sites structurally open (Fig. 5.3, feedback loop A). Simultaneously, the high local soil nutrient availability, resulting in suppressed woody establishment, was reinforced as the high quality and productivity of herbaceous swards attracted intense grazing, which accelerated nutrient cycling rates, thus increased nutrient availability (Fig. 5.3, feedback loop B). If correct this is an example of a top-down cascading effect where predators affect consumers, which feed back to primary producers via control over a limiting soil resource.

Nutrients and savannas
102
Acknowledgements We are grateful to the management of the APNR for allowing us to work in the reserves and
the Dr. Marie Luttig Trust for providing accommodation. We particularly thank Colin
Rowles, Mrs. S. Blatherwick, Carl van den Berg, and Marius Fuls for logistical assistance
during the project. Moagi Keretetse, Wim Braakhekke, Jan Bokdam and Claudius van de
Vijver are thanked for useful scientific input. Many thanks to Reis Manhique, Floris van
Beest and Lemson Monareng for their help in the field. We also thank Shell–SA for a fuel
donation and Omnia for donating fertilizer. The research was funded by NWO-WOTRO
(grant no. W01.65.216, CvdW) and the DELTA fund (AK). AK is also indebt to Peter Kool
and Carin van Drunen for financial support. Financial support to SM was provided by a
grant from the Stichting Dr. Hendrik Muller’s Vaderlandsch Fonds.

Chapter 6
103
Chapter 6 Nutrient heterogeneity in dry savannas: A synthesis
Cornelis van der Waal

Nutrients and savannas
104
Introduction In savannas, the ratio between the tree and grass components controls productivity, shapes animal assemblages and influences earth-atmosphere feedbacks. Augmenting what we know about the factors that govern savanna vegetation structure is important. The vegetation structure of many savannas is inherently unstable and easily disturbed, e.g., bush encroachment (Scholes & Archer 1997; Sankaran et al. 2004). Land-use changes and predicted changes in resource availability (e.g., nutrients) require that both scientists and managers improve their understanding: Not only of the direct effects of nutrient availability on co-existing trees and grasses, but also the interaction of nutrients with other factors such as water availability and disturbances caused by large herbivores (Prins & Gordon 2008). The latter is of great importance, as large herbivores, both domestic and wild, play important roles in local economies.
Central to this thesis is how nutrient heterogeneity, in time and in space, influence savanna vegetation structure and its functioning. I have asked the questions: How nutrients are partitioned between trees and grasses following an increase in soil nutrient availability? What are the consequences of this for the tree-grass and grazer-browser sub-systems? And, how is the structure of the vegetation and large herbivore assemblages affected by patchily distributed nutrients?
This thesis reveals new empirical information on how an increase in nutrient availability and differences in its spatial distribution influence the structure of the vegetation, as well as the consequences this may have for large herbivore assemblages. I synthesize here what was learnt from several field experiments where the soil nutrient status was manipulated using fertilizer or in previously managed areas where nutrients were redistributed by large herbivores. Throughout I attempt to place it in the broader context of dry savannas in general, although the focus remains in Africa.
First, I examine the ecological consequences of a sudden increase in nutrient availability (heterogeneity in time) for the vegetation structure. Second, I focus on the effect that differences in the local scale of nutrient patchiness (heterogeneity in space) has on savanna vegetation structure and its consequences for large herbivores. Using the outline presented in Fig. 6.1 (introduced in Chapter 1), the following subsections focus either on the direct consequences of nutrient heterogeneity for savanna vegetation structure or focus on the interacting effects of nutrients with other factors such as water availability or large herbivore disturbances in shaping the structure of savanna vegetation. Lastly, some practical applications for dry savanna management are discussed.
I anticipate that the work presented here will fulfil at least two important functions: (1) drawing attention to the current gaps in our understanding of the role of nutrients in savanna systems and (2) generate nutrient-related working hypotheses, to stimulate further research.

Chapter 6
105
Figure 6.1 An outline of the study showing what aspects of nutrients were studied in each
chapter. Chapters dealing with the interplay of nutrients and other factors shaping
savanna vegetation, such as water availability and large herbivore effects, are also
indicated. Solid arrows indicate direct effects, e.g., soil nutrient availability on
leaf N concentrations of trees and grasses, while the dashed arrows indicate
indirect effects, e.g., soil nutrient availability modulates the effect of large
herbivores on tree and grass biomass.
Nutrient heterogeneity in time Tree recruitment and increased soil nutrient availability in dry savannas
The success of tree seedling recruitment is believed to exercise large control over the relative dominance of trees in dry savannas. More successful establishment feeds back to a higher tree cover and vice versa (Sankaran et al. 2004; Bond 2008). My data unambiguously indicate that an increase in soil fertility, as indexed by N and P availability, leads to more constrained seedling establishment of the focal tree species, C. mopane, in the study area (Chapters 2 & 5). For example, in the large
Tree vs. grass response
Nutrient spatial
heterogeneity
Nutrient type
Nutrient availability
Water availability
Herbivore effects
Ch. 4
Ch. 3,4
Ch. 2,3,4,5
Ch. 2
Ch. 3,5
Ch. 3
Nutrients
Ch. 5

Nutrients and savannas
106
field experiment (Chapter 3) the density of live C. mopane germinants (cotyledons still present), which established naturally in herbaceous swards, was negatively affected by fertilization. Older seedling (<0.5 m height) densities were also reduced in the 6 and 30 g N m-2 fertilizer concentration treatments, suggesting that not only the current season’s seedlings are affected, but also older seedlings. In Chapter 5 I showed that woody plants failed to re-colonize nutrient-rich kraal sites that had not been used for almost half a century. Furthermore, in controlled experiments the fertilization of grass-tree seedling mixtures resulted in poorer tree seedling performance compared to unfertilized controls (Chapters 2 & 5). Studies conducted elsewhere corroborate this: more constrained tree seedling establishment when competing with grasses under fertile conditions (Cohn et al. 1989; Kraaij & Ward 2006), suggesting that it may be a widespread phenomenon. In fact, adding nutrients to Pinus invader seedlings in grasslands in southern France also caused a shift from facilitation to competition by grasses with regards to Pinus seedling establishment (Debain et al. 2005). In savannas, poorer tree seedling establishment in fertile, dry savannas may therefore be a contributing factor explaining the relatively more open vegetation structure often observed in dry, fertile savannas in comparison to nutrient-poor counterparts, e.g., basalt vs. granite derived soils in the KNP (Scholes 1990).
What might be the mechanism underlying constrained tree seedling recruitment in fertile environments? Sankaran et al. (2008) proposed that intensification of grass competition may reduce tree seedling recruitment in fertile environments. This hypothesis was tested in several experiments with C. mopane seedlings (Chapters 2 & 5). In the field experiment described in Chapter 2, I found that while grasses strongly suppressed year-old seedling growth, adding nutrients did not result in a greater suppression of seedlings, which counters the expectations. However, using recently germinated seedlings in a pot experiment (Chapter 5), we found that grass competition intensified with increasing nutrient availability, perhaps because the growth of smaller seedlings was more reduced by competition than larger seedlings with more developed root systems. Moreover, in the garden experiment (Chapter 2) pre-mature leaf senescence during a mid-season drought, a sign of severe water stress, was most intense in seedlings in fertilized tree seedling-grass plant mixtures. Tree seedlings in a similar treatment, but receiving additional water, were unaffected by the mid-season drought. This result indicates that the suppressing effect of increased nutrient availability on seedlings operates indirectly through the pre-empting of soil water resources by vigorous herbaceous growth under fertile conditions. Since woody seedlings are well known to be vulnerable to water stress during midseason droughts (Higgins et al. 2000), increased nutrient-induced water stress probably translates into higher mortality rates and suppressed growth of tree seedlings in fertile swards prone to seasonal droughts. This was clearly demonstrated in Chapter 5 where transplanted C. mopane seedling mortality increased during a mid-season drought as local fertilizer concentration increased. In

Chapter 6
107
conclusion, increased grass competition following an increase in soil nutrient availability reduces tree seedling recruitment success in savannas.
Several other factors may, however, interact with soil fertility to reduce, or help reduce, tree recruitment under fertile soil conditions. Examples include reduced tree seed production and increased seed and seedling predation in fertile areas. For example, I found in a field experiment that fewer adult C. mopane trees reproduced when fertilized with N (Chapter 4). For species with short-lived seeds such as C. mopane (personal communication, D. Wessels) this can be a limiting factor. Tree seedling predation by herbivores can also have strong regulatory effects on the tree dominance (and species composition) of an area (e.g., Prins & van der Jeugd 1993). In Chapter 5 I described that impala visitation increased on average 20-fold in the fertile kraal sites compared to the nutrient-poor surrounding study area. Impala in particular have been shown to be important tree seedling predators elsewhere (Prins & van der Jeugd 1993; Sharam et al. 2006; Moe et al. 2009), thus intensified seedling predation would be expected in fertile areas where impala tend to congregate (Augustine & McNaughton 2004). I did not find evidence of this in a short-term (one year) field experiment with transplanted C. mopane seedlings (Chapter 5), nor did Augustine & McNaughton (2004) in a two-year exclosure study in East Africa. This raises doubts that increased seedling predation (and trampling) is the primary cause of poor tree seedling recruitment in highly fertile soils. Put into perspective, multiple factors may cause reduced tree seedling recruitment in fertile areas. Intensified herbaceous competition appears to be a good candidate in areas experiencing frequent mid-season droughts, and thus seems an important mechanism explaining poor tree seedling recruitment under fertile soil conditions.
Tree seedling establishment and the interplay between soil nutrient and water
availability in dry savannas
In Chapter 2, the data suggest that the effect of nutrient availability on establishment of woody plants co-depends on water availability (Fig. 6.1): Under low water availability (e.g., frequent droughts) recruitment of woody plants is constrained, while frequent watering may enhance recruitment. As the incidence of droughts is expected to increase with decreasing average annual rainfall (Sheffield & Wood 2008), one consequence would be that woody cover declines faster along a decreasing rainfall gradient in fertile areas compared to infertile ones (Fig. 6.1). These patterns, while proposed for dry savannas, may not hold for mesic savannas (e.g., rainfall >650 mm yr-1). In mesic savannas, seedling recruitment is often not the limiting demographic phase. Instead, a high grass production in fertile areas may sustain intense, tree-damaging fires, which primarily control tree cover (van Langevelde et al. 2003).
The effect of increased soil nutrient availability on established trees
Unlike establishing tree seedlings, established trees in dry savannas may benefit from increased nutrient availability. Established trees, with larger reserves for bridging unfavourable periods induced by a competitive grass layer, are expected to be less

Nutrients and savannas
108
vulnerable to short-term water shortages, which apparently harms establishing seedlings (Chapters 2 & 5). In the study area, C. mopane trees fertilized with N (large scale treatment; Chapter 4) showed stimulated shoot growth. Shoot growth was also initially stimulated in the large field experiment, before browser impact intensified (Chapter 3). Nutrient additions to diverse plant communities elsewhere typically result in vegetation dominance by taller species, which out-shade shorter plants (Wilson & Tilman 1993; Fynn & O'Connor 2005), especially if the taller species have dense foliage and extended leaf retention over the year (Aerts et al. 1990). C. mopane trees display both these traits in the study area, which might explain the growth increase following fertilization. Figure 6.2 Hypothetical relationships between tree cover and average annual rainfall in dry
savannas for fertile (solid line) and nutrient poor (intermitted line) soils.
Taken together, we predict, in the absence of fire and herbivory, that tree cover may initially expand following nutrient enrichment. In the long-term, however, tree cover is expected to decline to below pre-enrichment values, because of constrained tree recruitment (see discussion above).
N: P stoichiometry and vegetation structure of savannas
In the emerging field of element stoichiometry, it is becoming increasingly clear that system properties such as species composition and productivity are determined not only by the absolute availability of growth limiting nutrients, such as N and P, but also by the relative availability of these nutrients with respect to each other. What constitutes ideal concentrations and proportions of elements in a growth medium for one plant may be sub-optimal for another. Data discussed in Chapter 4 suggest that trees appear to benefit more from N-rich and grasses from P-rich environments. For example, C. mopane trees were positively affected by N (and N + P) additions, but not
Rainfall
Tree cover
Fertile
Nutrient-poor

Chapter 6
109
by P supplied alone (Chapter 4). This accords with a pot experiment with C. mopane, where it was shown that above-ground growth was responsive to N fertilization, but unresponsive to P fertilization, in spite of very low P background levels in the growth medium (i.e., 2.1 g P m-3; Ferwerda et al. 2005). This suggests that C. mopane has relatively low P requirements. Conversely, in Chapter 4, in the small-scale, P-only treatment, grass leaf P concentrations peaked, while C. mopane trees had decreased leaf mass and leaf N concentrations compared to controls. These decreases may have been caused by the intensification of grass competition under P-rich conditions, thereby interfering with resource uptake of co-existing trees. That P is valuable for savanna C-4 grasses (the most common photosynthetic pathway) relative to C-3 trees is also suggested by the higher leaf P resorption efficiency relative to broadleaf (non-N2 fixing) trees found in the KNP (Ratnam et al. 2008). N2 fixing trees (e.g., members of Fabaceae such as acacias), however, may have high P requirements (Aerts & Chapin 2000). Moreover, Mantlana et al. (2008) found a closer correlation between photosynthetic rate and leaf P, than with leaf N in herbaceous C-4 plants in dystrophic soils in Botswana, suggesting that P limits photosynthesis more than N in their study system. Most studies involving C-3 plants report strong correlations between photosynthetic rate and leaf N, not leaf P concentrations (Aerts & Chapin 2000). Taken together, the relative availability of N and P may therefore offer an additional axis governing resource partitioning between trees and grasses in savanna systems (Fig. 6.1).
Growth strategy differences, which affect the relative growth rate of plants, may account for the differences in N vs. P requirements observed between trees and grasses. Data across marine, freshwater and terrestrial systems suggest that rapidly growing organisms commonly have relatively high P requirements to sustain rapid protein synthesis (Elser et al. 2007). Since grasses tend to have higher relative growth potentials than trees, which allocate substantial biomass towards woody structure instead of resource-capturing tissue (Bond et al. 2003; Bond 2008), we would expect grasses to have relatively high P requirements and trees to be relatively more limited by N availability. In tropical savannas, this distinction may be reinforced as most grasses follow the C-4 photosynthetic pathway, which has a higher nitrogen-use efficiency than C-3 plants (e.g., most trees in savannas including C. mopane) (Ehleringer & Monson 1993; Craine et al. 2008). High nitrogen-use efficiency lowers a plant’s relative dependency on N, which means that grasses will be relatively less dependent on N compared to P than trees, as was observed in Chapter 4. If correct, changes in the ratio of N to P availability in savanna systems potentially can drive structural vegetation shifts in savannas (Fig. 6.1). Increased nutrient availability modulates the impact of large herbivores on the
vegetation in conservation areas
Even in large conservation areas such as the KNP, directional (man-made) changes in nutrient availability have been reported. This begs the question how large herbivore impact patterns respond to changes in nutrient availability. In the study area, the

Nutrients and savannas
110
availability of soil nutrients strongly mediates where large herbivores concentrate their impact: herbivore impact intensified as the local nutrient availability increased (Chapter 3 & 5). These responses were surprisingly precise and grazing intensity, for example, accurately (within decimetres) matched fertilized patch boundaries (personal observation). I also observed that grazers responded quicker to nutrient additions than browsers such as elephants, whose impact progressively intensified over the study period. Furthermore, in some instances the aboveground vegetation biomass in fertile patches, e.g., tree canopies and herbaceous biomass in the high local fertilizer concentration treatment (Chapter 3), was reduced below values of controls, indicating that top-down herbivore effects potentially can override bottom-up nutrient effects. In both the tree and grass layers, top-down control (biomass reduced below control values) was only realised in the highest fertilizer concentration treatments (Chapter 3). For example, the exclosure experiment demonstrated that the aboveground biomass in the 6 g N m-2 fertilizer concentration treatment was increased in spite of substantial herbaceous off-take by grazers, while, at the highest 30 g N m-2 fertilizer concentration, grazers suppressed the vegetation locally (Chapter 3). Other changes such as relaxed defenses, e.g., reduced condensed tannin concentrations in trees (Chapter 3), may reinforce these patterns. Increased large herbivore use in nutrient-hotspots, which in some cases resulted in shorter or sparser vegetation, has also been observed in other savanna studies (e.g., Augustine et al. 2003; Loveridge & Moe 2004; Grant & Scholes 2006; Asner et al. 2009).
The relative increase of top-down herbivore effects at high nutrient availability levels in dry savannas probably has its origin in the fact that aboveground grass growth is relatively unresponsive to increases in nutrient availability under low water availability (Chapter 2 and references therein). In nutrient rich areas this has the effect that (i) nutrients accumulate in organs such as leaves (luxury uptake), which raises its palatability, feeding back to increased herbivory and (ii) the recovery rate following herbivory is slower, and the vegetation therefore easier controlled by herbivores. In areas where the climate allows high vegetation productivity, such as in fertile, mesic savannas, efficient use of nutrients by plants may result in the dilution of absorbed nutrients over a greater biomass, lowering its attractiveness for herbivores (Olff et al. 2002). Also, fast recovery of plants following herbivore impact reduces the net impact of herbivores on the vegetation (Pringle et al. 2007). Consequently, increased herbivore impact on the vegetation in mesic areas may be greatest in areas of intermediate productivity, i.e., areas of intermediate nutrient availability (van de Koppel et al. 1996) or strongly dependent on the facilitative effects of, for instance, mega-herbivores to maintain plants in a short attractive state, i.e., grazing lawns (e.g., Verweij et al. 2006; Waldram et al. 2008). Lastly, because tree growth may not show the strong interaction effect between nutrients and water as was found in savanna grasses, tree leaf quality in fertile areas may decline less with increasing water availability compared to grasses. Therefore trees in fertile areas may remain relatively more palatable along a rising water availability gradient. In support, tree leaf N and P concentrations showed little

Chapter 6
111
variation between dry and wet years relative to responsive grasses such as U. mosambicensis (Chapter 3). The recent finding that tree cover reductions by mega-herbivores in the KNP was more closely correlated with soil nutrient status than either long-term annual rainfall amount or vegetation productivity (Asner et al. 2009), points also in this direction.
In summary, nutrient availability in dry savannas potentially exerts large control over where in the landscape large herbivores concentrate their impact. This appears to be true for both grass-grazer and tree-browser systems. In dry savannas, the relative control of large herbivores over aboveground plant biomass appears to monotonically increase along a rising soil nutrient gradient (Fig. 6.1).
Scale of nutrient heterogeneity and savanna vegetation structure In the foregoing section the effects of an increase in nutrient availability on savanna vegetation structure was discussed: Both direct effects of nutrients per se and the interacting effects of nutrients with water and large herbivores on the tree and grass layers, respectively (Fig. 6.1). Here I synthesize what was learned about the effects of differences in the scale of nutrient heterogeneity. The subsections to follow either focus on the direct consequences of scale differences in nutrient heterogeneity for resource partitioning between trees and grasses, or focus on how scale effects modulate larger herbivore impact patterns on vegetation structure, i.e., indirect effects on vegetation structure (Fig. 6.1). Both local effects, i.e., within patches, and scaled up effects, i.e., at a plot level, are discussed. Local responses of trees and grasses to scale differences in nutrient patchiness
It is increasingly realized that it is not only the availability of nutrients, but also how nutrients become spatially available that matters to individual plants and plants in communities. In natural systems, resources are probably always heterogeneously distributed. Different responses to nutrient heterogeneity (Fransen et al. 2001), resulting in varied resource partitioning between co-existing plants, subsequently lead to structural shifts in the vegetation (Hutchings et al. 2003). This is of particular importance in savannas where the vegetation structure strongly controls important ecological services (Chapter 1). One aspect of heterogeneity that has recently attracted attention is how differences in the scale (grain size) of resource patchiness influence co-existing organisms differing in size. Scaling theory predicts that organisms ‘perceive’ their resource environment in relation to their own size (Richie & Olff 1999). As trees and grasses require the same basic resources, but differ largely in size, scale differences in resource heterogeneity may modulate resource partitioning between them, both locally and at larger scales. Indeed, the data showed that the scale of nutrient heterogeneity importantly affects the partitioning of resources between co-existing trees and grasses (see also Box 1). In Chapter 3, where both the scale of patchiness (2 x 2 m, 10 x 10 m and 50 x 50 m patch sizes) and the local fertilizer concentration were varied, we found that trees in the intermediate 10 x 10 m patches had much higher leaf nutrient concentrations than trees in the small 2 x 2 m patches

Nutrients and savannas
112
enriched to the same local nutrient concentration. Grasses within patches showed the same trend, but the magnitude of the effect was less marked than in trees (Chapter 3). In other words, locally trees were more sensitive to variation in patch size than grasses. The implication is that given the same within-patch soil nutrient concentration, the size of patches (i.e., scale of heterogeneity) regulates in part how nutrients are locally expressed in co-existing trees and grasses. Smaller plants, e.g., grasses, appear to gain relatively more nutrients under fine scales of nutrient patchiness (patch sizes <<< tree root system size) than trees. This potentially has important repercussions for savanna functioning and structure, e.g., large herbivore use and impact, which are discussed in more detail below (Box 1). The mechanisms underlying the local responses of trees and grasses with regard to scale in patchiness is unclear. Intuitively one would expect that nutrient uptake would be a function of the degree of exposure of a plant’s roots to nutrients. A large plant associated with a relatively small enriched patch is not expected to show the same magnitude of response to the added nutrients as a small plant where the root range matches the patch. In the study area such passive nutrient uptake differences between (large) trees and (small) grasses may explain the local response differences between local trees and grasses with varying patch size. However, plants are well known to respond (take up more nutrients than is expected from solely passive means) to heterogeneous nutrient supplies, e.g., by proliferating roots or by increasing the nutrient uptake capacity per unit root length in nutrient-rich patches (Fransen et al. 1999; Hodge 2004). Experimentation with single plants has revealed that plants often benefit more where nutrients are supplied in a large patch relative to a plant’s root system, rather than the same amount of nutrients distributed over many small patches (e.g., Hutchings et al. 2003; Hodge 2004; Kume et al. 2006). Therefore the increased nutrient accumulation in trees in the intermediate sized patches described in Chapter 3 might be partly due to the increased nutrient acquisition of responding trees in large compared to non-responding trees in small patches and vice versa for grasses (Fig. 6.1). Some evidence suggests that the scale of patchiness may regulate nutrient partitioning between co-existing trees and grasses in the study system. In a concurrent field experiment (Chapter 4), the same amount of nutrients was supplied to single C. mopane trees and grasses in a 5 m radius area around focal tree stems. The nutrients were either supplied in a single large patch or in 52 small patches in such a way that the same total area (one-third) was fertilized per tree. In this experiment, nutrient type (N, P or N+P) was also varied (see below). We found that trees benefited where N was supplied at a large scale. For example, two years after fertilization, large-scale fertilized trees showed increased shoot growth and increased leaf N concentrations compared to small-scale fertilized trees, receiving the same N amount. Conversely, trees fertilized in a small-scale configuration with P alone showed negative responses compared to large-scale counterparts. A possibility is that the co-existing grasses, which showed a very high P uptake capability, were most competitive under these conditions (Chapter 4). Apart from possibly differential N vs. P use, which will be discussed in more detail below, these results suggest that differences in the local scale

Chapter 6
113
grasses trees
Small scale
grasses trees
Large scale
Box 1: Do sorting machines and scaling theory in ecology have anything in common? Sorting machines are commonly used to separate differently sized objects. In a fruit processing plant, for example, oranges are sorted to separate small ones from bigger counterparts, which may reach different markets. Quarried gravel may be filtered or sifted according to grain size, because the size or scale of these objects influence subsequent use in the construction industry. The principle is that assorted objects are partitioned with the aid of a filtering system. In the illustration, the container below the small-diameter chute fills up when small objects are supplied, which tips the balance in that direction. Conversely, if larger objects are supplied, the small-chute opening is bypassed and the other container fills up, tipping the balance in the opposite direction. Similarly, in a savanna context the size of patches in which resources such as nutrients are supplied may influence how resources are partitioned between competing trees and grasses. The evidence presented in Chapter 4 suggests that nutrients supplied in patches much smaller than the area covered by a tree’s root system, may be increasingly shunted towards grasses, while nutrients supplied in large patches, for example, corresponding with the area covered by a tree’s root system, may shift the balance of resource uptake in favor of larger trees. In turn, these scale dependent partitioning of resources between co-existing trees and grasses may influence tree-grass competition and may modulate browser vs. grazer impact patterns, feeding back to structural vegetation changes (Chapter 3).

Nutrients and savannas
114
of nutrient patchiness (and nutrient type) may influence how nutrients are partitioned between co-existing trees and grasses. This is likely to affect the biomass balance between trees and grasses, although this could not be clearly demonstrated in the current experimental setup. Scale of nutrient patchiness regulates local grazer-browser impact patterns
In the foregoing section we showed that the scale of nutrient patchiness modulated how nutrients were locally expressed in trees and grasses. Grasses for example showed increased leaf nutrient concentrations at finer scales of patchiness than trees. These responses to scale can have repercussions beyond mere plant-to-plant competition. For example, we found that the scale of nutrient patchiness influenced browser vs. grazer impact patterns. In fact, the data suggest that the scale of patchiness modulated the impact patterns of the large herbivore community in such a way that trees, paradoxically, were favored at fine scales of patchiness. In Chapter 3 we found that browser impact on trees only intensified in the larger 10 x 10 m (30 g N m-2) patches, while the impact of grazers on the herbaceous layer was evident in both the smaller 2 x 2 m and larger 10 x 10 m patches (30 g N m-2). In other words, the scale of nutrient patchiness modulated the relative responses of the browser or grazer guilds, and hence their differential impact on vegetation structure. Local grazer impact on the vegetation was elicited at finer grain sizes than browser impact responses, while both grazers and browsers responded to coarse-grained nutrient patchiness. Experiments elsewhere have established that the selective removal of grasses in savannas can result in growth stimulation of the remaining trees (Knoop & Walker 1985; Stuart-Hill & Tainton 1989; Riginos 2009). Also, over-grazing, which reduces the competitiveness of grasses, is considered one of the primary causes of bush encroachment (Scholes & Archer 1997; Roques et al. 2001; Sankaran et al. 2008). In Chapter 3 it was shown that tree shoot length locally increased in the heavily grazed 2 x 2 m patches, while it decreased in 10 x 10 m patches, which were both heavily grazed and browsed. One possibility is that tree growth was stimulated in the 2 x 2 m patches, because grazers selectively impacted the herbaceous layer, lowering its competitiveness, while trees were only lightly utilized (similar to control trees). If so, scale differences in nutrient patchiness interacted with the large herbivore assemblage, thereby influencing the ratio between the tree and grass components. In the absence of an intact large herbivore assemblage, the small-scale configuration of nutrient supply benefits grasses more than trees as suggested in Chapter 4. In the presence of large herbivores, however, grasses in a fine-grained environment are suppressed by grazers, releasing trees from herbaceous competition.
The most likely explanation for the browser vs. grazer response to scale is that the scale of nutrient patchiness determined the quality of local trees and grasses and that grazers and browsers tracked these changes, thereby differentially impacting trees and grasses. An opposing explanation, however, states that the browser guild, dominated by large elephants, respond themselves to the scale of resource patchiness. Being large, elephants avoided fine grained resources, while the grazing guild,

Chapter 6
115
dominated by smaller species such as impala and zebra, responded to the fine-scale treatment. I found, however, clear signs (uprooted grass tuft remains) that elephants, which are mixed feeders, responded to the high quality grazing of both 2 x 2 m and 10 x 10 m patches, while avoiding low quality browse associated with the small patches. Cromsigt & Olff (2006) also found that although different resource grain sizes resulted in resource partitioning between grazer species, this was unrelated to body size. The idea that resource partitioning between African large herbivore species scales with herbivore body size, therefore is not supported (Chapter 3; Cromsigt & Olff 2006). Our findings support the new idea that the scale of resource heterogeneity influence resource partitioning within large herbivore assemblages (Cromsigt et al. 2006, 2008), although this appear to be unrelated to body size. While Cromsigt & Olff (2006) showed resource partitioning between grazer species, the current study illustrates, using fertilizer, that resource grain size differences affect resource partitioning between large herbivore guilds; namely, grazers vs. browsers. In conclusion, this study provides an example of how the scale of soil nutrient heterogeneity modulates the interplay between trophic levels (plants and herbivores) to affect the structure of savanna vegetation (Fig.6.1). Scaled-up responses: Plant and large herbivore community responses to scale of
nutrient patchiness
So far I have discussed the local responses with regard to differences in the scale of nutrient patchiness. But what are the consequences of scale of patchiness at the community, i.e., whole-plot, level? In Chapter 3 it was shown that how the same total amount of nutrients is spatially distributed in an area may significantly change the forage landscape for grazers and browsers. Whole-plot calculations corrected for fertilized and non-fertilized area size, suggest that herbaceous off-take by grazers in the 50 x 50 m – 15 kg N plot-1 treatment was three times higher than in the 10 x 10 m – 15 kg N plot-1 treatment, in spite of receiving the same total amount of nutrients per plot. In spite of the high suggested herbaceous off-take in the 50 x 50 m – 15 kg N plot-1 treatment, the herbaceous biomass was not suppressed in this treatment, but locally suppressed below control values in the 10 x 10 m – 15 kg plot-1 treatment. Apparently, the intermediate grazing quality in the former treatment (in response to the intermediate local fertilizer concentration), prevented overgrazing, which, in turn, optimized productivity. In the latter, local overgrazing in response to the high quality forage on offer here, resulted in sub-optimal herbaceous production in the 10 x 10 m patches.
In Chapter 3 the scale of nutrient patchiness strongly influenced the concentration of nutrients in tree and grass leaves, which largely regulated herbivore distribution and impact patterns in the study area. Given the same total fertilizer load, leaf nutrient concentrations in the 50 x 50 m treatments were diluted, while increasingly concentrated in the 10 x 10 m scale treatment in both trees and grasses and only in grasses in the 2 x 2 m scale treatment. Spatially, nutrient hotspots may

Nutrients and savannas
116
exert a disproportionate large influence on herbivore nutrition, by providing scarce nutrients in concentrated form to herbivore species with high or specific nutrient requirements, e.g., small bodied species or lactating animals (Grant & Scholes 2006; Prins & van Langevelde 2008). For the tree layer, the estimated tree canopy volume removed from the heterogeneous – high fertilizer load treatment (10 x 10 m patches – 15 kg N plot-1) was not significantly higher than that of the 50 x 50 m - 15 kg N plot-1 treatment (although there was such a tendency, Table 3.4). The quality of the material removed from 10 x 10 m patches, however, was higher than material removed from the 50 x 50 m treatment plots, because browsers concentrated their feeding in the high-quality 10 x 10 m patches.
In our study, we could not demonstrate that the scale of patchiness resulted in structural vegetation changes at plot level if the fertilizer load per plot was kept constant, probably because the analyses lacked statistical power (increased chance of a Type II error). Nevertheless, the greatest biomass differences were evident between the 10 x 10 m and 50 x 50 m scale treatments, fertilized at 15 kg N plot-1, for the tree and grass layers, respectively (Table 3.4). In addition, the effects of browser impact on the tree layer in nutrient rich patches progressively increased over the study period, thus scale related effects on tree biomass may become significant in future, if this trend continues.
Predicted responses of tree recruitment to increased atmospheric nitrogen deposition Increased atmospheric N deposition has brought about dramatic changes in vegetation species composition and structure in other biomes (van der Wal et al. 2003). In these systems graminoids tend to increasingly dominate. The response of savanna vegetation to increased atmospheric N deposition is, however, uncertain. How savannas respond to increased N availability is of particular relevance in the case of the Kruger National Park, where elevated atmospheric N deposition rates were recorded (Scholes et al. 2003). The increased atmospheric N deposition here has been linked to the concentration of coal-burning electricity generators to the west of the Kruger National Park (Scholes et al. 2003). Nonetheless, Sankaran et al. (2008) predicted that woody cover would be negatively affected by increased atmospheric nitrogen deposition and, presumably, that grasses will benefit in savannas (see also Prins & Gordon 2008). This study, where nitrogenous fertilizer was supplied to natural savanna vegetation, can make some contributions in this regard. First, the data suggest that the cover of established trees may initially expand with an increase in N availability, while, in the long-term, may decline as tree seedling establishment is increasingly constrained. However, the growth stimulation effect of the established trees was only significant at the highest fertilizer level (30 g N m-2 biannually), which is more than an order of magnitude larger than the measured N deposition rate (2.1 g N m-2yr-1) reported for the Kruger system (Scholes et al. 2003). Thus the effect size of increased atmospheric N deposition may be insignificant if compared to, for instance, changes in CO2, climate and land use. Second, in contrast to established tree

Chapter 6
117
responses to increase N deposition, the possibility that tree seedlings competing with grasses are negatively affected by N deposition seems more probable. Field fertilization (NPK) data (Chapter 3) suggest that C. mopane seedling densities, which established after favourable rains, were significantly reduced at biannual fertilization supply rates as low as 6 g N m-2, although not at 1.2 g N m-2. This indicates that significant seedling reductions were initiated somewhere between 1.2 and 6 g N m-2, which is within reach of the reported N deposition rate for the KNP in 2000 (Scholes et al. 2003) and well within range of N deposition hotpots in areas of the northern hemisphere (Dentener et al. 2006). However, a confounding factor might have been the addition of P (and K) in this experiment, which, as indicated in Chapter 4, may influence the competitiveness of the grass layer. Nevertheless, other experiments using only N, found suppressing effects on tree seedlings competing with grasses, suggesting that N is a prime actor with regards to tree seedling establishment (Cohn et al. 1989; Kraaij & Ward 2006). Third, our data suggest that the effect of increased nitrogen deposition on the establishment of woody plants may depend on water availability; under dry conditions (e.g., frequent droughts) recruitment of woody plants may be constrained, while under high, uninterrupted water availability, recruitment may be enhanced. Thus, concomitant changes in climate (e.g., changed drought frequency) may either dampen or enhance increased N deposition effects. For Africa, which is predicted to become more drought prone (Sheffield & Wood 2008), increased atmospheric N effects may therefore be enhanced, resulting in poorer tree establishment.
In summary, it seems plausible that increased atmospheric N deposition in dry savannas may lead to shifts in favour of grasses in the long run. Nevertheless, further experimentation simulating different N deposition scenarios is, for example, urgently required to establish how sensitive savanna systems are to increased atmospheric N deposition and to further explore the hypothesis that responses co-depend on water availability. Implications for the management of savanna systems This thesis provides new information on nutrient-plant-herbivore interactions (Fig. 6.1) in a dry savanna setting, which have potentially important implications for the management of savannas.
(i) Large herbivore management can drastically alter the nutrient landscape, both in time and space, thus may indirectly affect savanna functioning and structure as highlighted in this thesis. Artificial water provisioning (Tolsma et al. 1987; Thrash et al. 1995; Turner 1998; du Toit et al. 2003) and livestock management practises (Chapter 5) tend to concentrate nutrients in patches of limited extent. Tolsma et al. (1987) estimated, for example, that the horizontal transport of P by livestock towards watering points has led to an average decline of P in outer-area topsoil by as much as 17%, which caused P deficiency in cattle. Proximate to watering points, high local soil P concentrations accumulated, but the high impact here probably prevent P becoming available to animals via the grazing. In fact, apart from water provisioning,

Nutrients and savannas
118
probably all the limited tools available to ecological managers, i.e., fire, animal population control, fencing and fertilization, impact in one way or another on an area’s temporal and spatial nutrient availability. In my experience, managers of rangelands and conservation areas in African savannas, seldom if ever, incorporate nutrient dynamics per se in management or monitoring plans. It is perhaps time to heed to calls to include the quantification of fluxes, including that of soil nutrients, into ecological monitoring plans (Rogers 2003).
(ii) Historically, savanna management has been dominated by stable state concepts with little regard for scale (Rogers 2003). This study, and recently that of Cromsigt et al. (2009), clearly illustrated that the scale of resource patchiness potentially have significant local effects on resource partitioning among members of plant communities and animal assemblages. It is likely that management interventions alter the scale of heterogeneity. For example, large trees and termites create landscapes where nutrients are patchily distributed at specific scales of patchiness. Changes in the density of large trees or termite mounds, which have been shown to be functionally of great importance in savanna systems (e.g., Grant & Scholes 2006; Treydte et al. 2007, 2008; Ludwig et al. 2001, 2004, 2008), and large herbivore management interventions changing the relative proportion of dung-midden forming (e.g., territorial white rhino and impala) vs. randomly excreting large herbivore species (Cromsigt & Olff 2006) may in time change the scale of nutrient patchiness. It follows that scale should be explicitly incorporated in management processes when, for example, resource heterogeneity is promoted as a means of biodiversity conservation (du Toit et al. 2003; Cromsigt et al. 2009).
(iii) The suppression of competing tree seedlings in fertile conditions raises questions about the reverse process: Where soil nutrient availability decreases such as in the grazing ranges away from drinking water sources in the Tolsma et al. (1987) example. If an increase in nutrient availability negatively influences tree seedling establishment, then a decline in nutrient availability may facilitate tree seedling establishment. To my knowledge this has rarely, if ever, been considered as a contributing factor in the bush encroachment problem.
(iv) Lastly, can fertilizer be used as a management tool, e.g., to manage large herbivores for tourism purposes (E. Mwakiwa, unpublished manuscript)? This study certainly demonstrated that in a semi-arid savanna, added nutrients powerfully transformed the quality of the vegetation on offer, which significantly altered large herbivore use and impact patterns. Nevertheless, an important message (Chapter 5) was that nutrient effects could have long-lasting, seemingly irreversible effects on the soil, vegetation and herbivore assemblages, calling for great caution in its use. In conclusion, my data provide field support for the notion that local change in resource heterogeneity influence resource partitioning between different sized plants. It shows that both increases in soil nutrient availability and differences in the scale of nutrient patchiness potentially modulate resource partitioning between co-existing trees and grasses and, subsequently, grazers and browsers in savanna systems. Lastly, when promoting a high spatial heterogeneity in structurally diverse systems to

Chapter 6
119
conserve biodiversity (du Toit et al. 2003; Cromsigt et al. 2009), managers should take cognizance of the possibility that small changes in the local scale of resource patchiness can have far reaching consequences for ecosystem processes and functioning. Considering the large potential role that nutrients play in savanna systems, savanna managers and scientists are urged to incorporate nutrients as factor in their thinking when studying or managing savannas. In this regard it is important to not only consider direct nutrient effects, but also the indirect, interacting effects of soil nutrients with factors such as water and herbivores (Fig. 6.1).

Savannas and nutrients
120

References
121
References Aerts, R., Berendse, F., Decaluwe, H. & Schmitz, M. (1990) Competition in heathland
along an experimental gradient of nutrient availability. Oikos, 57, 310–318. Aerts, R. & Chapin, F.S. (2000) The mineral nutrition of wild plants revisited: A re-
evaluation of processes and patterns. Advances in Ecological Research, 30, 1–67.
Anonymous (1990) Handbook of standard soil testing methods for advisory purposes Soil Science Society of South Africa, Pretoria.
Archer, S., Boutton, T.W. & Hibbard, K.A. (2000) Trees in grasslands: Biogeochemical consequences of woody plant expansion. Global Biogeochemical Cycles in the Climate System (eds E.-D. Schulze, S. Harrison, M. Heimann, E. A. Holland, J. Lloyd, I. C. Prentice & D. Schimel), pp. 146. Academic Press, San Diego.
Arens, S.J.T., Sullivan, P.F. & Welker, J.M. (2008) Nonlinear responses to nitrogen and strong interactions with nitrogen and phosphorus additions drastically alter the structure and function of a high arctic ecosystem. Journal of Geophysical Research-Biogeosciences, 113, 1–10.
Asner, G.P., Levick, S.R., Kennedy-Bowdoin, T., Knapp, D.E., Emerson, R., Jacobson, J., Colgan, M.S. & Martin, R.E. (2009) Large-scale impacts of herbivores on the structural diversity of African savannas. Proceedings of the National Academy of Sciences of the United States of America, 106, 4947–4952.
Augustine, D.J. (2003) Spatial heterogeneity in the herbaceous layer of a semi-arid savanna ecosystem. Plant Ecology, 167, 319–332.
Augustine, D.J. (2004) Influence of cattle management on habitat selection by impala on central Kenyan rangeland. Journal of Wildlife Management, 68, 916–923.
Augustine, D.J. & McNaughton, S.J. (2004) Regulation of shrub dynamics by native browsing ungulates on East African rangeland. Journal of Applied Ecology, 41, 45–58.
Augustine, D.J. & McNaughton, S.J. (2006) Interactive effects of ungulate herbivores, soil fertility, and variable rainfall on ecosystem processes in a semi-arid savanna. Ecosystems, 9, 1242–1256.
Augustine, D.J., McNaughton, S.J. & Frank, D.A. (2003) Feedbacks between soil nutrients and large herbivores in a managed savanna ecosystem. Ecological Applications, 13, 1325–1337.
Bardgett, R.D. & Wardle, D.A. (2003) Herbivore-mediated linkages between aboveground and belowground communities. Ecology, 84, 2258–2268.
Belsky, A.J. (1994) Influences of trees on savanna productivity – tests of shade, nutrients, and tree-grass competition. Ecology, 75, 922–932.
Belsky, A.J., Mwonga, S.M., Amundson, R.G., Duxbury, J.M. & Ali, A.R. (1993) Comparative effects of isolated trees on their undercanopy environments in high-rainfall and low-rainfall savannas. Journal of Applied Ecology, 30, 143–

Savannas and nutrients
122
155. Bigalke, R.C. (2000) Functional relationships between protected and agricultural
areas in South Africa and Namibia. Wildlife conservation by sustainable use (eds H. H. T. Prins, J. G. Groothuis & T. T. Dolan), pp. 169–202. Kluwer Academic Publishers, Boston.
Birch, C.P.D. & Hutchings, M.J. (1994) Exploitation of patchily distributed soil resources by the clonal herb Glechoma hederacea. Journal of Ecology, 82, 653–664.
Blackmore, A.C., Mentis, M.T. & Scholes, R.J. (1990) The origin and extent of nutrient-enriched patches within a nutrient-poor savanna in South-Africa. Journal of Biogeography, 17, 463–470.
Bokdam, J. (2001) Effects of browsing and grazing on cyclic succession in nutrient-limited ecosystems. Journal of Vegetation Science, 12, 875–886.
Bond, W.J. (2008) What limits trees in C-4 grasslands and savannas? Annual Review of Ecology Evolution and Systematics, 39, 641–659.
Bond, W.J., Midgley, G.F. & Woodward, F.I. (2003) The importance of low atmospheric CO2 and fire in promoting the spread of grasslands and savannas. Global Change Biology, 9, 973–982.
Bouwman, A.F., Van Vuuren, D.P., Derwent, R.G. & Posch, M. (2002) A global analysis of acidification and eutrophication of terrestrial ecosystems. Water Air and Soil Pollution, 141, 349–382.
Brady, N.C. & Weil, R.R. (2002) The nature and properties of soils. Prentice Hall, Upper Saddle River, NJ.
Bransby, D.I. & Tainton, N.M. (1977) The disc pasture meter: Possible applications in grazing management. African Journal of Range and Forage Science, 12, 115–118.
Breman, H. & de Wit, C.T. (1983) Rangeland productivity and exploitation in the Sahel. Science, 221, 1341–1347.
Bryant, J.P., Reichardt, P.B. & Clausen, T.P. (1992) Chemically mediated interactions between woody-plants and browsing mammals. Journal of Range Management, 45, 18–24.
Cahill, J.F., Kembel, S.W. & Gustafson, D.J. (2005) Differential genetic influences on competitive effect and response in Arabidopsis thaliana. Journal of Ecology, 93, 958–967.
Campion, J.M. & Scholes, M.C. (2007) Diagnosing foliar nutrient dynamics of Eucalyptus grandis in KwaZulu-Natal, South Africa, using optimal element ratios and the diagnosis and recommendation integrated system (DRIS) Southern Hemisphere Forestry Journal, 69(3):137–150.
Caughley, G. (1976) Elephant problem - alternative hypothesis. East African Wildlife Journal, 14, 265–283.
Coates Palgrave, K., Coates Palgrave, M., Drummond, R.B. & Moll, E.J. (2002) Trees of Southern Africa. Struik Publishers, Cape Town.
Coetsee, C., February, E.C. & Bond, W.J. (2008) Nitrogen availability is not affected

References
123
by frequent fire in a South African savanna. Journal of Tropical Ecology, 24, 647–654.
Cohn, E.J., van Auken, O.W. & Bush, J.K. (1989) Competitive interactions between Cynodon dactylon and Acacia smallii seedlings at different nutrient levels. American Midland Naturalist, 121, 265–272.
Craine, J.M., Morrow, C. & Stock, W.D. (2008) Nutrient concentration ratios and co-limitation in South African grasslands. New Phytologist, 179, 829–836.
Cramer, M.D., Chimphango, S.B.M., Van Cauter, A. & Bond, W.J. (2007) Grass competition induces N2 fixation in some species of African Acacia. South African Journal of Botany, 73, 283–284.
Cromsigt, J. & Olff, H. (2006) Resource partitioning among savanna grazers mediated by local heterogeneity: An experimental approach. Ecology, 87, 1532–1541.
Cromsigt, J. & Olff, H. (2008) Dynamics of grazing lawn formation: An experimental test of the role of scale-dependent processes. Oikos, 117, 1444–1452.
Cromsigt, J., Prins, H.H.T. & Olff, H. (2009) Habitat heterogeneity as a driver of ungulate diversity and distribution patterns: Interaction of body mass and digestive strategy. Diversity and Distributions, 15, 513–522.
Davis, M.A., Wrage, K.J. & Reich, P.B. (1998) Competition between tree seedlings and herbaceous vegetation: Support for a theory of resource supply and demand. Journal of Ecology, 86, 652–661.
de Knegt, H.J., Groen, T.A., van de Vijver, C., Prins, H.H.T. & van Langevelde, F. (2008) Herbivores as architects of savannas: Inducing and modifying spatial vegetation patterning. Oikos, 117, 543–554.
de Kroon, H., Huber, H., Stuefer, J.F. & van Groenendael, J.M. (2005) A modular concept of phenotypic plasticity in plants. New Phytologist, 166, 73–82.
de Kroon, H. & Mommer, L. (2006) Root foraging theory put to the test. Trends in Ecology & Evolution, 21, 113–116.
de Mazancourt, C., Loreau, M. & Abbadie, L. (1998) Grazing optimization and nutrient cycling: When do herbivores enhance plant production? Ecology, 79, 2242–2252.
Debain, S., Curt, T. & Lepart, J. (2005) Indirect effects of grazing on the establishment of Pinus sylvestris and Pinus nigra seedlings in calcareous grasslands in relation to resource level. Ecoscience, 12, 192–201.
Dekker, B., Kirkman, K.P. & du Plessis, S.I. (2001) Use of the dry-weight-rank method of botanical analysis in semi-arid savanna communities. African Journal of Range & Forage Science, 18, 63–66.
Dentener, F., Stevenson, D., Ellingsen, K., Vannoije, T., Schultz, M., Amann, M., Atherton, C., Bell, N., Bergmann, D., Bey, I., Bouwman, O.L., Butler, T., Cofala, J., Collins, B., Drevet, J., Doherty, R., Eickhout, B., Eskes, H., Fiore, A., Gauss, M., Hauglustaine, D., Horowitz, L., Isaksen, I.S.A., Josse, B., Lawrence, M., Krol, M., Lamarque, J.F., Montanaro, V., Muller, J.F., Peuch, V.H., Pitar, I.G., Pyle, J., Rast, S., Rodriguez, J., Sanderson, M., Savage, N.H., Shindell, D., Strahan, S., Szopa, S., Sudo, K., Vandingenen, R., Wild, O. &

Savannas and nutrients
124
Zeng, G. (2006) The global atmospheric environment for the next generation. Environmental Science and Technology, 40, 3586–3594.
Dickinson, E.B., Hyam, G.F.S. & Breytenbach, W.A.S. (1990) Die Kynoch weidingshandleiding. CTP Press, Cape Town.
Donaldson, C.H., Rootman, G. & Grossman, D. (1984) Long term nitrogen and phosphorous application to veld. Journal of the Grassland Society of southern Africa 1, 27–32.
du Toit, J.T., Biggs, H.C. & Rogers, K.H. (2003) The Kruger experience: Ecology and management of savanna heterogeneity. Island Press, Washington.
du Toit, J.T., Bryant, J.P. & Frisby, K. (1990) Regrowth and palatability of Acacia shoots following pruning by African savanna browsers. Ecology, 71, 149–154.
Eckhardt, H., van Wilgen, B.W. & Biggs, H.C. (2000) Trends in woody vegetation cover in the Kruger National Park, South Africa, between 1940 and 1998 African Journal of Ecology, 38, 108–115.
Ehleringer, J.R. & Monson, R.K. (1993) Evolutionary and ecological aspects of photosynthetic pathway variation. Annual Review of Ecological Systems, 24, 411–439.
Elser, J.J., Bracken, M.E.S., Cleland, E.E., Gruner, D.S., Harpole, W.S., Hillebrand, H., Ngai, J.T., Seabloom, E.W., Shurin, J.B. & Smith, J.E. (2007) Global analysis of nitrogen and phosphorus limitation of primary producers in freshwater, marine and terrestrial ecosystems. Ecology Letters, 10, 1135–1142.
Engelbrecht, B.M.J., Dalling, J.W., Pearson, T.R.H., Wolf, R.L., Galvez, D.A., Koehler, T., Tyree, M.T. & Kursar, T.A. (2006) Short dry spells in the wet season increase mortality of tropical pioneer seedlings. Oecologia, 148, 258–269.
Engelbrecht, B.M.J., Tyree, M.T. & Kursar, T.A. (2007) Visual assessment of wilting as a measure of leaf water potential and seedling drought survival. Journal of Tropical Ecology, 23, 497–500.
Estes, R.D. (1992) The behavior guide to African mammals. The University of California Press, Los Angeles.
Ferwerda, J.G., van Wieren, S.E., Skidmore, A.K. & Prins, H.H.T. (2005) Inducing condensed tannin production in Colophospermum mopane: Absence of response to soil N and P fertility and physical damage. Plant and Soil, 273, 203–209.
Field, A. (2005) Discovering statistics using SPSS. Sage, London. Fornara, D.A. & du Toit, J.T. (2008) Community-level interactions between ungulate
browsers and woody plants in an African savanna dominated by palatable-spinescent Acacia trees. Journal of Arid Environments, 72, 534–545.
Fransen, B. & de Kroon, H. (2001) Long-term disadvantages of selective root placement: root proliferation and shoot biomass of two perennial grass species in a 2-year experiment. Journal of Ecology, 89, 711–722.
Fransen, B., de Kroon, H. & Berendse, F. (1998) Root morphological plasticity and nutrient acquisition of perennial grass species from habitats of different

References
125
nutrient availability. Oecologia, 115, 351–358. Friedel, M.H. (1988) The use of comparative yield and dry-weight-rank techniques
for monitoring rangeland. Journal of Range Management, 41 430–435 Fynn, R.W.S. & O'Connor, T.G. (2005) Determinants off community organization of
a South African mesic grassland. Journal of Vegetation Science, 16, 93–102. Gibbs Russell, G.E., Watson, L., Koekemoer, M., Smook, L., Barker, N.P., Anderson,
H.M. & Dallwitz, M.J. (1990) Grasses of southern Africa. Memoirs of the Botanical Survey of South Africa, 58, 1–437.
Goheen, J.R., Keesing, F., Allan, B.F., Ogada, D.L. & Ostfeld, R.S. (2004) Net effects of large mammals on Acacia seedling survival in an African savanna. Ecology, 85, 1555–1561.
Grant, C.C., Meissner, H.H. & Schultheiss, W.A. (1995) The nutritive value of veld as indicated by faecal phosphorous and nitrogen and its relation to the condition and movement of prominent ruminants during the 1992-1993 drought in the Kruger National Park. Koedoe, 38, 17–31
Grant, C.C., Peel, M.J.S., Zambatis, N. & van Ryssen, J.B.J. (2000) Nitrogen and phosphorus concentration in faeces: An indicator of range quality as a practical adjunct to existing range evaluation methods. African Journal of Range and Forage Science, 17, 81–92.
Grant, C.C. & Scholes, M.C. (2006) The importance of nutrient hot-spots in the conservation and management of large wild mammalian herbivores in semi-arid savannas. Biological Conservation, 130, 426–437.
Groen, T.A., van Langevelde, F., van de Vijver, C.A.D.V., Govender, N. & Prins, H.H.T. (2008) Soil clay content and fire frequency affect clustering in trees in South African savannas. Journal of Tropical Ecology, 24, 269–279.
Guldemond, R. & Van Aarde, R. (2008) A meta-analysis of the impact of African elephants on savanna vegetation. Journal of Wildlife Management, 72, 892–899.
Gunderson, L.H. & Holling, C.S. (2002) Panarchy: Understanding transformation in human and natural systems. Island Press, Washington DC.
Hanan, N.P., Sea, W.B., Dangelmayr, G. & Govender, N. (2008) Do fires in savannas consume woody biomass? A comment on approaches to modeling savanna dynamics. American Naturalist, 171, 851–856.
Harrington, G.N. (1991) Effects of soil-moisture on shrub seedling survival in a semi-arid grassland. Ecology, 72, 1138–1149.
Haukioja, E., Ossipov, V., Koricheva, J., Honkanen, T., Larsson, S. & Lempa, K. (1998) Biosynthetic origin of carbon-based secondary compounds: Cause of variable responses of woody plants to fertilization? Chemoecology, 8, 133–139.
Hejcman, M., Klaudisova, M., Stursa, J., Pavlu, V., Schellberg, J., Hejcmanova, P., Hakl, J., Rauch, O. & Vacek, S. (2007) Revisiting a 37 years abandoned fertilizer experiment on Nardus grassland in the Czech Republic. Agriculture Ecosystems & Environment, 118, 231–236.

Savannas and nutrients
126
Herms, D.A. & Mattson, W.J. (1992) The dilemma of plants - to grow or defend. Quarterly Review of Biology, 67, 283–335.
Higgins, S.I., Bond, W.J. & Trollope, W.S.W. (2000) Fire, resprouting and variability: A recipe for grass-tree coexistence in savanna. Journal of Ecology, 88, 213–229.
Hodge, A. (2004) The plastic plant: Root responses to heterogeneous supplies of nutrients. New Phytologist, 162, 9–24.
Holdo, R.M., Holt, R.D., Coughenour, M.B. & Ritchie, M.E. (2007) Plant productivity and soil nitrogen as a function of grazing, migration and fire in an African savanna. Journal of Ecology, 95, 115–128.
Holdo, R.M. & McDowell, L.R. (2004) Termite mounds as nutrient-rich food patches for elephants. Biotropica, 36, 231–239.
Hooimeijer, J.F., Jansen, F.A., de Boer, F.W., Wessels, D., van der Waal, C., de Jong, C.B., Otto, N.D. & Knoop, L. (2005) The diet of kudus in a mopane dominated area, South Africa. Koedoe, 48, 93–102.
House, J.I., Archer, S., Breshears, D.D., Scholes, R. & Participants, N.T.G.I. (2003) Conundrums in mixed woody-herbaceous plant systems. Journal of Biogeography, 30, 1763–1777.
Hutchings, M.J., John, E.A. & Wijesinghe, D.K. (2003) Toward understanding the consequences of soil heterogeneity for plant populations and communities. Ecology, 84, 2322–2334.
Jacobs, S.M., Bechtold, J.S., Biggs, H.C., Grimm, N.B., Lorentz, S., McClain, M.E., Naiman, R.J., Perakis, S.S., Pinay, G. & Scholes, M.C. (2007) Nutrient vectors and riparian processing: A review with special reference to African semiarid Savanna ecosystems. Ecosystems, 10, 1231–1249.
Jeltsch, F., Milton, S.J., Dean, W.R.J. & Van Rooyen, N. (1997) Analysing shrub encroachment in the southern Kalahari: A grid-based modelling approach. Journal of Applied Ecology, 34, 1497–1508.
Jeltsch, F., Milton, S.J., Dean, W.R.J., van Rooyen, N. & Moloney, K.A. (1998) Modelling the impact of small-scale heterogeneities on tree-grass coexistence in semi-arid savannas. Journal of Ecology, 86, 780–793.
Jewell, P.L., Kauferle, D., Gusewell, S., Berry, N.R., Kreuzer, M. & Edwards, P.J. (2007) Redistribution of phosphorus by cattle on a traditional mountain pasture in the Alps. Agriculture Ecosystems & Environment, 122, 377–386.
Juchnowicz-Bierbasz, M. & Rakusa-Suszczewski, S. (2002) Nutrients and cations content in soil solutions from the present and abandoned penguin rookeries (Antarctica, King George Island). Polish Journal of Ecology, 50, 79–91.
Kembel, S.W. & Cahill, J.F. (2005) Plant phenotypic plasticity belowground: A phylogenetic perspective on root foraging trade-offs. American Naturalist, 166, 216–230.
Kent, M. & Coker, P. (1994) Vegetation description and analysis – a practical approach. John Wiley and Sons, Chichester.
Kerkhoff, A.J., Fagan, W.F., Elser, J.J. & Enquist, B.J. (2006) Phylogenetic and

References
127
growth form variation in the scaling of nitrogen and phosphorus in the seed plants. American Naturalist, 168, 103–122.
Kingdon, J. (1997) The Kingdon field guide to African mammals. Academic Press, London.
Knoop, W.T. & Walker, B.H. (1985) Interactions of woody and herbaceous vegetation in a southern African savanna. Journal of Ecology, 73, 235–253.
Kos, M., Hoetmer, A.J., Pretorius, Y., De Boer, W.F., De Knegt, H.J. & Grant, C.C. (submitted) Seasonal diet switch in elephant and impala in a Mopane woodland.
Kraaij, T. & Ward, D. (2006) Effects of rain, nitrogen, fire and grazing on tree recruitment and early survival in bush-encroached savanna, South Africa. Plant Ecology, 186, 235–246.
Kume, T., Sekiya, N. & Yano, K. (2006) Heterogeneity in spatial P-distribution and foraging capability by Zea mays: Effects of patch size and barriers to restrict root proliferation within a patch. Annals of Botany, 98, 1271–1277.
Levick, S. & Rogers, K. (2008) Patch and species specific responses of savanna woody vegetation to browser exclusion. Biological Conservation, 141, 489–498.
Loveridge, J.P. & Moe, S.R. (2004) Termitaria as browsing hotspots for African megaherbivores in Miombo woodland. Journal of Tropical Ecology, 20, 337–343.
Ludwig, F., de Kroon, H., Berendse, F. & Prins, H.H.T. (2004) The influence of savanna trees on nutrient, water and light availability and the understorey vegetation. Plant Ecology, 170, 93–105.
Ludwig, F., De Kroon, H. & Prins, H.H.T. (2008) Impacts of savanna trees on forage quality for a large African herbivore. Oecologia, 155, 487–496.
Ludwig, F., de Kroon, H., Prins, H.H.T. & Berendse, F. (2001) Effects of nutrients and shade on tree-grass interactions in an East African savanna. Journal of Vegetation Science, 12, 579–588.
MacGregor, M.D. & O’Connor, T.G. (2002) Patch dieback of Colophospermum mopane in a dysfunctional semi-arid African savanna. Austral Ecology, 27, 385–395.
Mantlana, K.B., Arneth, A., Veenendaal, E.M., Wohland, P., Wolski, P., Kolle, O., Wagner, M. & Lloyd, J. (2008) Photosynthetic properties of C-4 plants growing in an African savanna/wetland mosaic. Journal of Experimental Botany, 59, 3941–3952.
McKeon, G.M., Stone, G.S., Syktus, J.I., Carter, J.O., Flood, N.R., Ahrens, D.G., Bruget, D.N., Chilcott, C.R., Cobon, D.H., Cowley, R.A., Crimp, S.J., Fraser, G.W., Howden, S.M., Johnston, P.W., Ryan, J.G., Stokes, C.J. & Day, K.A. (2009) Climate change impacts on northern Australian rangeland livestock carrying capacity: A review of issues. Rangeland Journal, 31, 1–29.
McNaughton, S.J., Banyikwa, F.F. & McNaughton, M.M. (1997) Promotion of the cycling of diet-enhancing nutrients by African grazers. Science, 278, 1798–

Savannas and nutrients
128
1800. McNaughton, S.J., Milchunas, D.G. & Frank, D.A. (1996) How can net primary
productivity be measured in grazing ecosystems? Ecology, 77, 974–977. Moe, S.R., Rutina, L.P., Hytteborn, H. & du Toit, J.T. (2009) What controls woodland
regeneration after elephants have killed the big trees? Journal of Applied Ecology, 46, 223–230.
Moe, S.R. & Wegge, P. (2008) Effects of deposition of deer dung on nutrient redistribution and on soil and plant nutrients on intensively grazed grasslands in lowland Nepal. Ecological Research, 23, 227–234.
Mourik, A.A., van Langevelde, F., van Tellingen, E., Heitkönig, I.M.A. & Gaigher, I. (2007) Stability of wooded patches in a South African nutrient-poor grassland: Do nutrients, fire or herbivores limit their expansion? Journal of Tropical Ecology, 23, 529–537.
Novozamsky, I., Houba, V.J.G., Vaneck, R. & Vanvark, W. (1983) A novel digestion technique for multi-element plant analysis. Communications in Soil Science and Plant Analysis, 14, 239–248.
O'Connor, T.G. (1995) Acacia karroo invasion of grassland: Environmental and biotic effects influencing seedling emergence and establishment. Oecologia, 103, 214–223.
Olff, H., Ritchie, M.E. & Prins, H.H.T. (2002) Global environmental controls of diversity in large herbivores. Nature, 415, 901–904.
Penning de Vries, F.W.T. & Djitèye, A.M. (1982) La Productivité des Paturages Sahëliéns. Wageningen, The Netherlands: Centre for Agricultural Publishing and Documentation, 525 pp.
Pickett, S.T.A. (1998) Natural processes. Status and trends of the nation's biological resources (ed M. J. Mac), pp. 11–19. US Geological Survey, Reston.
Pickett, S.T.A., Cadenasso, M.L. & Benning, T.L. (2003) Biotic and abiotic variability as key determinants of savanna heterogeneity at multiple spatiotemporal scales. The Kruger Experience: Ecology and management of savanna heterogeneity (eds J. T. du Toit, K. H. Rogers & H. C. Biggs), pp. 22–40. Island Press, Washington.
Poorter, H. & Nagel, O. (2000) The role of biomass allocation in the growth response of plants to different levels of light, CO2, nutrients and water: A quantitative review. Australian Journal of Plant Physiology, 27, 595–607.
Poorter, L. (2005) Resource capture and use by tropical forest seedlings and their consequences for competition. Biotic Interactions in the Tropics: Their role in the Maintenance of Species Diversity (eds D. F. R. P. Burslem, M. A. Pinard & S. E. Hartley), pp. 35–64. Cambridge University Press, New York.
Pretorius, Y. (2009) Satisfying giant appetites: Mechanisms of small scale foraging by large African herbivores. PhD thesis, Wageningen University, Wageningen.
Pringle, R.M., Young, T.P., Rubenstein, D.L. & McCauley, D.J. (2007) Herbivore-initiated interaction cascades and their modulation by productivity in an African savanna Proceedings of the National Academy of Sciences of the

References
129
United States of America, 104, 193–197. Prins, H. & Gordon, I. (2008) Introduction: Grazers and browsers in a changing world
The Ecology of Browsing and Grazing, (eds I. Gordon & H.H.T. Prins), pp. 1-20. Ecological Studies Vol. 195. Springer, Berlin.
Prins, H.H.T. & Beekman, J.H. (1989) A balanced diet as a goal for grazing: The food of the Manyara buffalo. African Journal of Ecology, 27, 241–259.
Prins, H.H.T., Grootenhuis, J.G. & Dolan, T.T. (2000) Conservation of Wildlife by Sustainable Use. Kluwer Academic, Boston.
Prins, H.H.T. & van der Jeugd, H.P. (1993) Herbivore population crashes and woodland structure in East Africa. Journal of Ecology, 81, 305–314.
Prins, H.H.T. & van Langevelde, F. (2008) Assembling a diet from different places. Resource Ecology: Spatial and Temporal Dynamics of Foraging (eds H. H. T. Prins & F. van Langevelde), pp. 129–155. Springer.
Ratnam, J., Sankaran, M., Hanan, N.P., Grant, R.C. & Zambatis, N. (2008) Nutrient resorption patterns of plant functional groups in a tropical savanna: Variation and functional significance. Oecologia, 157, 141–151.
Reich, P.B. & Oleksyn, J. (2004) Global patterns of plant leaf N and P in relation to temperature and latitude. Proceedings of the National Academy of Sciences of the United States of America, 101, 11001–11006.
Riginos, C. (2009) Grass competition suppresses savanna tree growth across multiple demographic stages. Ecology, 90, 335–340.
Riginos, C. & Grace, J.B. (2008) Savanna tree density, herbivores, and the herbaceous community: Bottom-up vs. top-down effects. Ecology, 89, 2228–2238.
Ritchie, M.E. & Olff, H. (1999) Spatial scaling laws yield a synthetic theory of biodiversity. Nature, 400, 557–560.
Ritchie, M.E., Tilman, D. & Knops, J.M.H. (1998) Herbivore effects on plant and nitrogen dynamics in oak savanna. Ecology, 79, 165–177.
Robertson, G.P., Coleman, D.C., Bledsoe, C.S. & Sollins, P. (1999) Standard soil methods for long-term ecological research. Oxford University Press, New York.
Rogers, K. (2003) Adopting a heterogeneity paradigm: Implications for mangement of protected savannas. The Kruger Experience: Ecology and management of savanna heterogeneity (eds J. T. du Toit, K. H. Rogers & H. C. Biggs), pp. 41–58. Island Press, Washington.
Roques, K.G., O'Connor, T.G. & Watkinson, A.R. (2001) Dynamics of shrub encroachment in an African savanna: Relative influences of fire, herbivory, rainfall and density dependence. Journal of Applied Ecology, 38, 268–280.
Rutherford, M.C. & Westfall, R.H. (1994) Biomes of Southern Africa: An objective categorization Memoir of the National Botanical Institute, Pretoria.
Sammis, T. (1996) Soil texture analysis hhtp://weather.nmsu_edu/teaching_Material /soil456/soiltexture/soiltext.htm.
Sankaran, M., Hanan, N.P., Scholes, R.J., Ratnam, J., Augustine, D.J., Cade, B.S., Gignoux, J., Higgins, S.I., Le Roux, X., Ludwig, F., Ardo, J., Banyikwa, F.,

Savannas and nutrients
130
Bronn, A., Bucini, G., Caylor, K.K., Coughenour, M.B., Diouf, A., Ekaya, W., Feral, C.J., February, E.C., Frost, P.G.H., Hiernaux, P., Hrabar, H., Metzger, K.L., Prins, H.H.T., Ringrose, S., Sea, W., Tews, J., Worden, J. & Zambatis, N. (2005) Determinants of woody cover in African savannas. Nature, 438, 846–849.
Sankaran, M., Ratnam, J. & Hanan, N. (2008) Woody cover in African savannas: The role of resources, fire and herbivory. Global Ecology and Biogeography, 17, 236–245.
Sankaran, M., Ratnam, J. & Hanan, N.P. (2004) Tree-grass coexistence in savannas revisited – insights from an examination of assumptions and mechanisms invoked in existing models. Ecology Letters, 7, 480–490.
Sarmiento, G. (1992) Adaptive strategies of perennial grasses in South-American savannas. Journal of Vegetation Science, 3, 325–336.
Scholes, M.C., Scholes, R.J., Otter, L.B. & Woghiren, A.J. (2003) Biogeochemistry: The cycling of elements. The Kruger Experience (eds J. T. du Toit, K. H. Rogers & H. C. Biggs), pp. 130–148. Island Press, Washington.
Scholes, R.J. (1990) The influence of soil fertility on the ecology of southern African dry savannas. Journal of Biogeography, 17, 415–419.
Scholes, R.J. (2003) Convex relationships in ecosystems containing mixtures of trees and grass. Environmental & Resource Economics, 26, 559–574.
Scholes, R.J. & Archer, S.R. (1997) Tree-grass interactions in savannas. Annual Review of Ecological Systems, 28, 517–544.
Scholes, R.J., Dowty, P.R., Caylor, K., Parsons, D.A.B., Frost, P.G.H. & Shugart, H.H. (2002) Trends in savanna structure and composition along an aridity gradient in the Kalahari. Journal of Vegetation Science, 13, 419–428.
Seymour, C.L. (2008) Grass, rainfall and herbivores as determinants of Acacia erioloba (Meyer) recruitment in an African savanna. Plant Ecology, 197, 131–138.
Sharam, G., Sinclair, A.R.E. & Turkington, R. (2006) Establishment of broad-leaved thickets in Serengeti, Tanzania: The influence of fire, browsers, grass competition, and elephants. Biotropica, 38, 599–605.
Sheffield, J. & Wood, E.F. (2008) Global trends and variability in soil moisture and drought characteristics, 1950-2000, from observation-driven simulations of the terrestrial hydrologic cycle. Journal of Climate, 21, 432–458.
Singer, F.J. & Schoenecker, K.A. (2003) Do ungulates accelerate or decelerate nitrogen cycling? Forest Ecology and Management, 181, 189–204.
Slot, M. & Poorter, L. (2007) Diversity of tropical tree seedling responses to drought. Biotropica, 39, 683–690.
Smallie, J.J. & O'Connor, T.G. (2000) Elephant utilization of Colophospermum mopane: Possible benefits of hedging. African Journal of Ecology, 38, 352–359.
Smit, G.N. (1989) Quantitative description of woody plant communities: Part I. An approach. African Journal of Range and Forage Science, 6, 186–191.

References
131
Smit, G.N. (1989) Quantitative description of woody plant communities: Part II. Computerized calculation procedures. African Journal of Range and Forage Science, 6, 192–194.
Smit, G.N. (1996) BECVOL: Biomass Estimates from Canopy Volume (version 2) - Users Guide. Unpublished manual, University of the Free State, South Africa.
Smit, G.N. (2001) The influence of tree thinning on the vegetative growth and browse production of Colophospermum mopane. South African Journal of Wildlife Research, 31, 99–114.
Smit, G.N. (2004) An approach to tree thinning to structure southern African savannas for long-term restoration from bush encroachment. Journal of Environmental Management, 71, 179–191.
Smit, G.N. & Rethman, N.F.G. (1998) Root biomass, depth distribution and relations with leaf biomass of Colophospermum mopane. South African Journal of Botany, 64, 38–43.
Smit, G.N. & Rethman, N.F.G. (2000) The influence of tree thinning on the soil water in a semi-arid savanna of southern Africa. Journal of Arid Environments, 44, 41–59.
Snyman, H.A. (2002) Short-term response of rangeland botanical composition and productivity to fertilization (N and P) in a semi-arid climate of South Africa. Journal of Arid Environments, 50, 167–183.
Stamp, N. (2003) Out of the quagmire of plant defense hypotheses. Quarterly Review of Biology, 78, 23–55.
Stuart-Hill, G.C. & Tainton, N.M. (1989) The competitive interaction between Acacia karroo and the herbaceous layer and how this is influenced by defoliation. Journal of Applied Ecology, 26, 285–298.
Thrash, I., Theron, G.K. & Bothma, J.D. (1995) Dry season herbivore densities around drinking troughs in the Kruger-National-Park. Journal of Arid Environments, 29, 213–219.
Tolsma, D.J., Ernst, W.H.O. & Verwey, R.A. (1987) Nutrients in soil and vegetation around 2 artificial waterpoints in eastern Botswana. Journal of Applied Ecology, 24, 991–1000.
Trenberth, K.E., Dai, A.G., Rasmussen, R.M. & Parsons, D.B. (2003) The changing character of precipitation. Bulletin of the American Meteorological Society, 84, 1205–1217.
Treydte, A.C., Heitkönig, I.M.A., Prins, H.H.T. & Ludwig, F. (2007) Trees improve grass quality for herbivores in African savannas. Perspectives in Plant Ecology Evolution and Systematics, 8, 197–205.
Treydte, A.C., van Beeck, F.A.L., Ludwig, F. & Heitkönig, I.M.A. (2008) Improved quality of beneath-canopy grass in South African savannas: Local and seasonal variation. Journal of Vegetation Science, 19, 663–670.
Turekian, V.C., Macko, S., Ballentine, D., Swap, R.J. & Garstang, M. (1998) Causes of bulk carbon and nitrogen isotopic fractionations in the products of vegetation burns: laboratory studies. Chemical Geology, 152, 181–192.

Savannas and nutrients
132
Turner, M.D. (1998) Long-term effects of daily grazing orbits on nutrient availability in Sahelian West Africa: I. Gradients in the chemical composition of rangeland soils and vegetation. Journal of Biogeography, 25, 669–682.
van de Koppel, J., Huisman, J., Van der Wal, R. & Olff, H. (1996) Patterns of herbivory along a productivity gradient: An empirical and theoretical investigation. Ecology, 77, 736–745.
van der Waal, C., de Kroon, H., de Boer, W.F., Heitkönig, I.M.A., Skidmore, A.K., de Knegt, H.J., van Langevelde, F., van Wieren, S.E., Grant, R.C., Page, B.R., Slotow, R., Kohi, E.M., Mwakiwa, E. & Prins, H.H.T. (2009) Water and nutrients alter herbaceous competitive effects on tree seedlings in a semi-arid savanna. Journal of Ecology, 97, 430–439.
van der Wal, R., Pearce, I., Brooker, R., Scott, D., Welch, D. & Woodin, S. (2003) Interplay between nitrogen deposition and grazing causes habitat degradation. Ecology Letters, 6, 141–146.
van Langevelde, F., van de Vijver, C., Kumar, L., van de Koppel, J., de Ridder, N., van Andel, J., Skidmore, A.K., Hearne, J.W., Stroosnijder, L., Bond, W.J., Prins, H.H.T. & Rietkerk, M. (2003) Effects of fire and herbivory on the stability of savanna ecosystems. Ecology, 84, 337–350.
van Wijk, M.T. & Rodriguez-Iturbe, I. (2002) Tree-grass competition in space and time: Insights from a simple cellular automata model based on ecohydrological dynamics. Water Resources Research, 38, 1179–1193.
Venter, F.J., Scholes, R.J. & Eckhardt, H.C. (2003) The abiotic template and its associated vegetation pattern. The Kruger Experience (eds J. T. du Toit, K. H. Rogers & H. C. Biggs), pp. 83–129. Island Press, Washington.
Verweij, R.J.T., Verrelst, J., Loth, P.E., Heitkönig, I.M.A. & Brunsting, A.M.H. (2006) Grazing lawns contribute to the subsistence of mesoherbivores on dystrophic savannas. Oikos, 114, 108–116.
Waldram, M.S., Bond, W.J. & Stock, W.D. (2008) Ecological engineering by a mega-grazer: White rhino impacts on a South African savanna. Ecosystems, 11, 101–112.
Walker, B.H. (1976) An approach to the monitoring of changes in the composition and utilization of woodland and savanna vegetation. Southern African Journal of Wildlife Research, 6, 1–32.
Walker, B.H., Emslie, R.H., Owen-Smith, R.N. & Scholes, R.J. (1987) To cull or not to cull - lessons from a southern African drought. Journal of Applied Ecology, 24, 381–401.
Walker, B.H. & Langridge, J.L. (1997) Predicting savanna vegetation structure on the basis of plant available moisture (PAM) and plant available nutrients (PAN): A case study from Australia. Journal of Biogeography, 24, 813–825.
Walter, H. (1971) Ecology of Tropical and Subtropical Vegetation. Oliver and Boyd, Edinburgh.
Waterman, P.G. & Mole, S. (1994) Analysis of phenolic plant metabolites Blackwell, Oxford.

References
133
Wijesinghe, D.K., John, E.A. & Hutchings, M.J. (2005) Does pattern of soil resource heterogeneity determine plant community structure? An experimental investigation. Journal of Ecology, 93, 99–112.
Wilson, S.D. & Tilman, D. (1993) Plant competition and resource availability in response to disturbance and fertilization. Ecology, 74, 599–611.
Wilson, T.B. & Witkowski, E.T.F. (1998) Water requirements for germination and early seedling establishment in four African savanna woody plant species. Journal of Arid Environments, 38, 541–550.
Witkowski, E.T.E. & O'Connor, T.G. (1996) Topo-edaphic, floristic and physiognomic gradients of woody plants in a semi-arid African savanna woodland. Vegetation description and analysis - a practical approach, 124, 9–23.
Wonnacott, T.H. & Wonnacott, R.J. (1990) Introductory Statistics. John Wiley & Sons, New York.
Ydenberg, R.C. & Prins, H.H.T. (1981) Spring grazing and the manipulation of food quality by barnacle geese. Journal of Applied Ecology, 18, 443–453.
Zambatis, N., Zacharias, P.J.K., Morris, C.D. & Derry, J.F. (2006) Re-evaluation of the disc pasture meter calibration for the Kruger National Park, South Africa. African Journal of Range and Forage Science, 23, 85–97.

Savannas and nutrients
134

Samevatting
135
Samevatting In savannas leef bome en grasse saam en deel hulpbronne soos water en voedingstowwe. Die verhouding tussen die boom- en graskomponente (plantegroei-struktuur) speel ‘n belangrike rol in die beheer van produktiwiteit, dieresamestelling en land-atmosfeer koppeling. Omrede die struktuur van savannaplantegroei inherent onstabiel en maklik versteurbaar is, is dit van groot belang om uit te vind hoe plantegroeistruktuur beheer word vir veldbestuur- en bewaringsdoeleindes. Tans word aanvaar dat vier faktore die plantegroeistruktuur van savannas beheer, naamlik: water, voedinsgstowwe, beweiding en vuur. Alhoewel die water- en vuurfaktore intense studie geniet het, is die rolle van voedingstowwe en beweiding minder bekend. Die uitbreiding van ons kennis oor die rol van voedingstowwe in savannas is relevant, aangesien daar toenemend verstaan word dat globale verandering ook die beskikbaarheid van voedingstowwe beïnvloed, bv. verhoogde stikstofdeponering. Hoe savannas reageer op voedingstof-skommelinge, is egter onseker. Veranderinge in grond-voedingstofbeskikbaarheid sal ook moontlik veranderinge in weidingskwalitetit te weeg bring, wat grootherbivoor benutting en impakpatrone op plantegroei kan beïnvloed en daardeur indirek die plantegroeistruktuur verander. Dit word ook toenemend aanvaar dat nie net die beskikbaarheid van voedingstowwe die plantegroei, en gevolglik herbivore beïnvloed nie, maar ook hoe voedingstowwe ruimtelik beskikbaar raak. Om die waarheid te sê, nuwe idees suggereer dat verskille in die skaal van ruimtelike hulpbronheterogeniteit, die verdeling van hulpbronne tussen saamwonende organismes beheer. Byvoorbeeld, groot bome wat saam met klein grasse bestaan in savannasisteme. Om te toets hoe veranderinge in voedingstofbeskikbaarheid en die ruimtelike konfigurasie daarvan savanna sisteme beïnvloed, is verskeie veldeksperimente uitgevoer in ‘n semi-ariede savanna in Suid-Afrika. In die studiegebied het ons m.b.v. bemestingseksperimente gevind dat voedingstofbeskikbaarheid (N, P en K), boomsaailing (Colophospermum mopane) vestiging negatief beïnvloed. Ook het bome nie daarin geslaag om vrugbare beeskraal-gebiede, wat omtrent ‘n half eeu gelede in onbruik geraak het, te her-koloniseer nie. Dit word nou aanvaar dat die sukses van boomsaailing-vestiging ‘n groot invloed uitoefen op die relatiewe dominansie van bome in droë savannas. Dus kan ‘n toename in voedingstowwe aanleiding gee tot ‘n oper plantegroei-struktuur. Verskillende verklarings kan vir die beperkte saailingvestiging onder vrugbare grondtoestande geformuleer word. Ons het die hipotese getoets dat ‘n verhoging van graskompetisie in vrugbare omgewings die vestiging van boomsaailinge beperk. In gekontroleerde kompetisie-eksperimente is aangetoon dat negatiewe voedingstof-effekte op boomsaailinge slegs voorkom wanneer saailinge met grasse in kompetisie was. Voorts het ons ook gevind dat die voorsiening van beide water en voedingstowwe aan mengsels van boomsaailinge en grasse die negatiewe voedingstof-effekte op boomsaailinge omgekeer het. Dus blyk dit dat die onderdrukkende effek van hoër voedingstof-beskikbaarheid op boomsaailinge indirek veroorsaak word deurdat grondwater deur die sterkgroeiende grasse voortydig opgebruik word. Aangesien boomsaailinge kwesbaar is vir droogtestres, beteken ‘n toename in voedingstof-geïnduseerde droogte ‘n verhoging in die mortaliteite en onderdrukte groei van boomsaailinge in vrugbare gebiede. Ter ondersteuning het die

Savannas and nutrients
136
mortaliteitstempo van uitgeplante boomsaailinge gedurende ‘n midseisoendroogte verhoog soos lokale kunsmiskonsentrasie verhoog het. Die voorgestelde meganisme dat graskompetisie verhoog onder hoë voedingstoestande tot nadeel van boomsaailinge, blyk daarom ‘n lewensvatbare hipotese te wees wat die onderdrukte boomsaailing-aanwas onder vrugbare grondtoestande verklaar. Terwyl vestigende boomsaailinge swaarkry onder vrugbare toestande, suggereer ons data dat gevestigde (volwasse) bome voordeel trek uit ‘n verhoogde voedingstofbeskikbaarheid in terme van groei, veral as N-beskikbaarheid verhoog. Met betrekking tot verhoogde N-deponering voorspel ons dat boomuitgestrektheid aanvanklik sal uitbrei met ‘n verhoging in voedingstofbesikbaarheid in droë savannas, alhoewel boombedekking onsensitief mag wees vir huidige vlakke van N-deponering. Ons verwag egter dat boomuitgestrektheid in die lang termyn sal afneem as gevolg van onderdrukte boomaanwassing, wat meer sensitief blyk te wees vir klein N beskikbaarheidsveranderinge.
Die relatiewe beskikbaarheid van voedingstowwe soos N en P kan ook die verdeling van hulpbronne tussen saamlewende bome en grasse beïnvloed. In ‘n veldeksperiment is bewyse gevind dat bome relatief meer beperk is deur N-beskikbaarheid as P-beskikbaarheid. ‘n Studie in Oos-Afrika het getoon dat grasse onder boomkruine meer P- as N-beperk is en ons het weer gevind dat die kompeteervermoë van onderkruin-grasse verhoog indien slegs P voorsien word. Daarom is dit moontlik dat die relatiewe beskikbaarheid van N teenoor P ‘n addisionele verklaring bied vir hulpbronverdeling tussen bome (nie-N-bindend) en grasse in savannasisteme. Dit ondersteun die idee dat organismes met ‘n hoë groeipotensiaal, ooglopend grasse in savannas, ‘n relatiewe hoë P-behoefte het om vinnige proteïnsintese vol te hou, terwyl stadiger groeiende organismes soos bome meer beperk word deur N-beskikbaarheid.
Die beskikbaarheid van grondvoedingstowwe het ‘n aansienlike invloed op die lokaliteite in die landskap waar groot herbivore hul impak konsentreer. Beide gras- en blaarvreters het positief reageer op bemesting, waarskynlik deur die beheer wat grondvoeding uitoefen op weidingskwaliteit. Boom- en grasblare se N- en P- konsentrasies het toegeneem en gekondenseerde tanniene in bome het afgeneem met bemesting. In vrugbare lokaliteite is die plantegroeibiomassa in sommige gevalle tot benede kontrole-biomassa verlaag deur herbivore. Dit dui aan dat top-bodem (“top-down”) herbivoor-effekte potensieël bodem-na-bo (“bottom-up”) effekte kan oorskrei onder vrugbare toestande.
In ekologie word dit toenemend aanvaar dat dit nie net die beskikbaarheid van voedingstowwe is wat ‘n rol speel nie, maar ook hoe voedingstowwe ruimtelik beskikbaar raak. In ‘n groot veldeksperiment is ‘n gradiënt in die skaal van voedingstof- kolverspreidheid geskep (bv. bemeste kol grein-groottes wissel van 2 x 2 m, 10 x 10 m tot 50 x 50 m). Data van hierdie eksperiment dui daarop dat die skaal van voedingstof-kolverspreidheid (“patchiness”) die verdeling van hulpbronne tussen saamlewende bome en grasse beheer. Vir dieselfde lokale bemestingkonsentrasie het die kwaliteit van boomblare nie reageer in klein kolle wat bemes is nie, maar wel in groot kolle. Grasblaarkwaliteit het egter verbeter soos die lokale bemestingkonsentrasie verhoog het, ongeag die grootte van die kolle wat bemes is. Die verskillende reaksies van bome en grasse op skaal-verskille het gevolglik die

Samevatting
137
onderskeie reaksies van blaar- en grasvretergroepe beïnvloed. Vir dieselfde hoë lokale bemestingkonsentrasie het grasvreters op beide die fyn en growwe skaal van voedingstof-kolverspreidheid reageer, terwyl blaarvreters slegs op die growwe skaal van voedingstof-kolverspreidheid reageer het. Op sy beurt het die selektiewe beweiding in die fyn skaalbehandeling waarskynlik boomgroei bevorder. Dus beheer die skaal van voedingstof-kolverspreidheid die wyse van voedingstofverdeling tussen bome en grasse. Dié verskille word dan deur die grootherbivoorgemeenskap gevolg, wat kan lei tot verskillende lokale impakte op die boom- en graslae.
Behalwe lokale effekte, kan die skaal van voedingstof-verspreidheid ook die benutting en kwaliteit van weidingshulpbronne by groter (bv. landskap) skale beheer. In die groot veldbemestingseksperiment toon berekeninge aan dat die totale grasbenutting deur grasvreters hoër was waar dieselfde bemestingshoeveelheid (15 kg N perseel-1) versprei is oor die hele proefperseeloppervlak, teenoor gekonsentreerd in 10 x 10 m kolle. Dus beheer die wyse van voedingstofverspreiding in ‘n gebied sekondêre produksie, asook waar herbivore se impak gekonsentreer word. Die skaal-verwante patrone wat waargeneem is in die groot bemestingseksperiment kan versterk word deur plastiese reaksies op heterogene voedingstofbeskikbaarheid (bv. fyn-wortel vermeerdering in vrugbare kolle). Hiervolgens kon bome op die growwe-skaalbehandelings en grasse op die fyn-skaalbehandelings plasties reageer het. Om dit te toets is dieselfde hoeveelheid bemesting verskaf aan bome en geassosiëerde grasse by twee skale van voedingstof-kolverspreidheid. Twee jaar na bemesting het die growwe-skaal-bemeste bome verhoogde lootgroei en hoër blaar-N konsentrasies in vergelyking met klein-skaal-bome wat dieselfde totale N hoeveelheid ontvang het, vertoon. In teenstelling hiermee het bome bemes met P in ‘n klein-skaal konfigurasie negatief reageer in vergelyking met groot-skaal bome. Hierdie resultate toon aan dat verskille in die lokale skaal van voedingstof-kolveranderlikheid ook die verdeling van voedingstowwe tussen bome en gras kan beïnvloed.
Herbivore reageer nie net op grondvrugbaarheids-heterogeniteit nie, maar kan ook ruimtelike heterogeniteit in voedingstof-verspreiding skep. Op sy beurt kan dit die struktuur van plantegoei dan verander. In ‘n semi-ariede, onvrugbare savanna het ons die huidige grondvrugbaarheidsstatus, boom- en grasbiomassa-patrone en benutting deur grootherbivore in nege verlate veekrale bestudeer. Die krale is vergelyk met nabygeleë kontrolepersele in die omringende landskap. Die krale, wat aanvanklik verryk is deur veemis en -uriene, het ongeveer sedert 1970 in onbruik verval toe vee deur wild vervang is in die studiegebeid. Na ongeveer 40 jaar het ons gevind dat kraalgrond steeds verhoogde konsentrasies anorganiese N, ekstraheerbare P, K, Ca en Mg bevat vergeleke met die kontrolepersele. Dit het verhoogde weidingskwaliteit in krale tot gevolg. Bome het ook nie daarin geslaag om die krale binne te dring nie, sodat krale as strukturele oop kolle in die andersins digte savanna vertoon. Wilde grootherbivore onderhou skynbaar die hoë vrugbaarheidstatus van krale deur voedingstowwe in krale in te voer, en deur lokaal die sirkulasie van voedingstowwe te bespoedig. Op sy beurt verhoed die verhoogde gondvrugbaarheid dat boomsaailinge vestig onder die vrugbare toestande. Ten slotte, hierdie studie voorsien bewyse dat veranderinge in die beskikbaarheid van voedingstowwe die sukses van boomsaailingvestiging beïnvloed, wat veranderinge in die relatiewe proporsies van bome en grasse in droë savannas kan

Savannas and nutrients
138
bewerkstellig. Verder ondersteun hierdie studie nuwe idees wat stel dat die skaal van hulpbronheterogeniteit die wyse van hulpbronverdeling tussen saamwonende bome en grasse beïnvloed. Op sy beurt bepaal dit die patrone van blaarvreter- teenoor grasvreterbenutting asook die impak van diere op die plantegroei. Gevolglik voorsien hierdie studie nuwe inligting oor voedingstof-plant-herbivoor wisselwerking in ‘n droë savanna en het potensiëel vêrrykende implikasies vir die bestuur van droë savannas in die algemeen.

Samenvatting
139
Samenvatting In savannes komen bomen en grassen samen voor en delen hulpbronnen zoals water en nutriënten. De verhouding tussen bomen en grassen (d.w.z. de vegetatiestructuur), heeft een belangrijke invloed op productiviteit, diergemeenschappen en aard- atmosfeer terugkoppelingen. Omdat de structuur van savannevegetatie inherent onstabiel en gemakkelijk te verstoren is, is het voor het beheren en beschermen van weidegebieden van groot belang te begrijpen hoe de vegetatiestructuur wordt beïnvloed. Momenteel worden vier factoren als belangrijk gezien bij het reguleren van de vegetatiestructuur van savannes, namelijk: water, nutriënten, herbivoren en vuur. Terwijl de factoren water en vuur al intensief bestudeerd zijn, is de invloed van nutriënten en herbivoren minder bekend. Omdat men in toenemende mate beseft dat klimaatverandering ook de beschikbaarheid van nutriënten verandert, bv. een verhoogde stikstofdepositie, is het relevant om ons inzicht in de rol van nutriënten in savannes te vergroten. Hoe savannesystemen reageren op een verstoring van de nutriëntenbeschikbaarheid is onduidelijk. Veranderingen in de beschikbaarheid van bodemnutriënten zullen waarschijnlijk ook verband houden met veranderingen in voedselkwaliteit. Dit kan de foerageerpatronen van grote herbivoren, en dus indirect de vegetatiestructuur, beïnvloeden. Bovendien realiseert men zich in toenemende mate dat niet alleen veranderingen in nutriëntenbeschikbaarheid de planten en daarmee herbivoren beïnvloeden, maar ook de mate waarin nutriënten ruimtelijk beschikbaar komen. Nieuwe ideeën suggereren in feite dat een verschil in schaalniveau van de ruimtelijke heterogeniteit van hulpbronnen kan bepalen hoe deze hulpbronnen worden verdeeld tussen samenlevende soorten van verschillende grootte, bv. grote bomen die in savannesystemen samenleven met kleine grassen. Om te testen hoe veranderingen in de beschikbaarheid en ruimtelijke rangschikking van nutriënten savannesystemen beïnvloeden, zijn verscheidene veldexperimenten uitgevoerd in een halfdroge savanne in Zuid Afrika.
In het studiegebied vonden wij dat de nutriëntbeschikbaarheid (N, P en K) een negatieve invloed heeft op de vestiging van boomzaailingen (Colophospermum mopane) in bemestingsexperimenten. Bovendien faalden bomen in het herkolonialiseren van nutriëntrijke kralen die bijna een halve eeuw geleden verlaten zijn. In droge savannes denkt men tegenwoordig dat het succes van de vestiging van boomzaailingen van grote invloed is op de relatieve overheersing van bomen. Een verhoging van de nutriëntenbeschikbaarheid kan dus zorgen voor een structureel meer open vegetatie. Verschillende redeneringen kunnen verklaren waarom de vestiging van boomzaailingen wordt beperkt op vruchtbare grond. Wij testten de hypothese dat een toename van grasconcurrentie in een vruchtbare omgeving de boomverjonging verminderd. In gecontroleerde concurrentie-experimenten werd aangetoond dat de negatieve effecten van nutriënten op boomzaailingen alleen voorkomen wanneer deze zaailingen in concurrentie zijn met grassen. Bovendien vonden wij dat het toevoegen van zowel water en voedingsstoffen aan bomen en grassen de negatieve effecten van het toevoegen van voedingsstoffen op zaailingen tenietdoet. Het onderdrukkende effect van een toegenomen nutriëntenbeschikbaarheid op zaailingen blijkt een indirecte werking te hebben via de afname van de watervoorraden door de sterke groei van grassen onder vruchtbare omstandigheden. Vanwege de gevoeligheid van

Savannas and nutrients
140
zaailingen voor watertekorten vertaalt een door nutriënten veroorzaakte verhoging van het watertekort zich in een hogere mortaliteit en onderdrukte groei van boomzaailingen in vruchtbare gebieden. De mortaliteit van verplante boomzaailingen werd hoger gedurende een droge periode in het groeiseizoen als lokaal de bemestingsconcentratie werd verhoogd. Een verhoging van de grasconcurrentie op een vruchtbare bodem lijkt dus een reëel mechanisme waarmee een slechte boomverjonging op een vruchtbare bodem kan worden verklaard.
Hoewel vestigende boomzaailingen lijden onder vruchtbare omstandigheden suggereren onze gegevens dat de groei van al gevestigde (oude) bomen hoger is bij een toename van de nutriëntenbeschikbaarheid, vooral bij een stijging van de N- beschikbaarheid. Met betrekking tot een verhoogde atmosferische stikstofdepositie voorspellen wij dat de boombedekking in eerste instantie zal toenemen na verrijking met voedingsstoffen in droge savannes, hoewel de respons van bomen ongevoelig kan zijn voor het huidige niveau van stikstofdepositie. Echter, op de lange termijn verwachten wij dat de boombedekking afneemt als gevolg van een beperking van de boomverjonging welke gevoeliger lijkt te zijn voor kleine stijgingen in de N- beschikbaarheid.
De relatieve beschikbaarheid van nutriënten zoals N en P kan ook van invloed zijn op de mannier waarop voedselbronnen worden verdeeld tussen de naast elkaar levende bomen en grassen. In een veldexperiment vonden wij aanwijzingen dat bomen relatief meer beperkt worden door de N- dan de P- beschikbaarheid. Een studie in oost Afrika heeft aangetoond dat grassen onder een boom meer N- dan P- gelimiteerd zijn. Wij vonden bewijs dat het concurrentievermogen van grassen onder bomen verhoogd wordt wanneer alleen P wordt toegevoegd. De relatieve beschikbaarheid van N vs. P kan daarom een extra dimensie zijn voor de verdeling van hulpbronnen tussen bomen (niet N- fixerend) en grassen in savannesystemen. Dit ondersteunt het idee dat organismen met een hoog groeipotentieel, blijkbaar grassen in savannes, een relatief hoge P-behoefte hebben om een snelle eiwitsynthese in stand te houden, terwijl trager groeiende organismen, zoals bomen, meer beperkt zijn door de beschikbaarheid van N.
De beschikbaarheid van de bodemnutriënten heeft een sterke invloed op waar grote grazers hun impact in het landschap concentreerden. Zowel grazers en browsers reageerden positief op bemesting, waarschijnlijk via de invloed die de nutriëntenbeschikbaarheid in de bodem heeft op de kwaliteit van voedsel. De N- en P- concentraties in de bladeren van bomen en grassen steeg, en de gecondenseerde tannineconcentratie in bomen verminderde als gevolg van bemesting. Bij hoge plaatselijke bodemnutriëntenconcentraties werd de vegetatiebiomassa in sommige gevallen door herbivoren verlaagd tot onder de vegetatiebiomassa in controle plots, wat aangeeft dat herbivoor effecten (top-down) mogelijk nutriënt effecten (bottom-up) kunnen opheffen onder gunstige omstandigheden.
In de ecologie beseft men steeds meer dat niet alleen de beschikbaarheid van voedingsstoffen, maar ook de wijze waarop deze voedingsstoffen ruimtelijk beschikbaar komen van belang is. Gegevens uit een groot veldexperiment waarbij een gradiënt in de schaal van nutriëntenpatchiness (d.w.z. patches van 2 x 2 m, 10 x 10 m of 50 x 50 m) werd opgericht, suggereren dat de schaal van nutriëntenpatchiness de verdeling van hulpbronnen tussen samenlevende bomen en grassen stuurt. Bij een

Samenvatting
141
gelijke lokale nutriëntenconcentratie was de kwaliteit van boomblad ongevoelig voor bemesting in kleine patches, maar gevoelig voor bemesting in de grotere patches. De kwaliteit van het blad van grassen werd verhoogd door lokale bemesting ongeacht de ruimtelijke schaal van bemesting. Het verschil in reactie van bomen en grassen op verschillen in de schaal van nutriëntpatchiness had ook gevolgen voor de browser- en grazer- gemeenschappen. Bij dezelfde hoge lokale concentratie van meststoffen reageerden grazers zowel op een fijne en grove schaal van nutriëntenpatchiness, terwijl browsers alleen op de grove schaal van nutriëntenpatchiness reageerden. De selectieve begrazing in fijnschalige nutriënten patches stimuleerde kennelijk de boomgroei. Bij een grovere schaal van nutriënt patchiness werd de impact van zowel browsers als grazers lokaal versterkt. De schaal van nutriëntenpatchiness bepaalde dus de verdeling van nutriënten tussen bomen en grassen, hetgeen blijkbaar gevolgd werd door de grote herbivoren, wat resulteerde in gedifferentieerde lokale effecten op bomen en grassen. Naast de lokale effecten kan de schaal van nutriëntenpatchiness ook het gebruik en de kwaliteit van voedsel op grotere (landschap-) schalen beïnvloeden. In het grote bemestingveldexperiment suggereren berekeningen dat de totale grasconsumptie door grazers het hoogste was waar dezelfde hoeveelheid meststof (15 kg N per perceel) werd uitgespreid over de oppervlakte van het gehele perceel in plaats van geconcentreerd in 10 x 10 m patches. Hoe voedingsstoffen worden verdeeld in een gebied heeft daarom invloed op de secundaire productiviteit en de locaties waar herbivoren hun impact concentreren.
De schaalgerelateerde verbanden die zijn waargenomen in het grote bemestingexperiment kunnen versterkt zijn door plastische reacties (bv. de proliferatie van fijne wortels in een voedselrijke bodem) op heterogene nutriëntenlevering aan respectievelijk bomen op een grove schaal en grassen op een fijne schaal. Om dit te testen werd dezelfde hoeveelheid nutriënten toegevoegd op twee verschillende schalen van patchiness aan specifieke bomen met de bijbehorende grassen. Twee jaar na de bemesting lieten de op grote schaal bemeste bomen een toename van de groei van scheuten zien en een toegenomen N-concentratie in blad ten opzichte van de kleinschalige maar met een zelfde hoeveelheid N bemeste bomen. Omgekeerd lieten bomen in een kleinschalige met P bemeste configuratie negatieve reacties zien in vergelijking met grootschalige tegenhangers. Deze resultaten suggereren dat verschillen in de lokale schaal van nutriëntenpatchiness ook invloed heeft op de wijze waarop voedingsstoffen worden verdeeld tussen samenlevende bomen en grassen.
Herbivoren reageren niet alleen op heterogeniteit in voedingsstoffen, ze kunnen ook ruimtelijke heterogeniteit in de beschikbaarheid van voedingsstoffen creëren, wat weer de structuur van de vegetatie in savannes kan beïnvloeden. Wij bestudeerden de huidige status van bodemnutriënten, patronen in boom- en grasbiomassa en het gebruik van vegetatie door grote herbivoren in 9 voormalige kralen in een halfdroge en voedselarme savanne. Deze gebieden werden vergeleken met nabijgelegen controlegebieden in het omringende landschap. De kralen, voorheen verrijkt door dierlijke mest en urine, werden verlaten rond 1970 en sindsdien gebruikt door wilde dieren. Wij vonden dat de bodem van de kraal, ongeveer 40 jaar na dato, verhoogde concentraties van anorganische N, extraheerbaar P, K, Ca en Mg heeft in vergelijking met de controlegebieden, hetgeen resulteerde in een hoge voedselkwaliteit in kraalgebieden. Bomen faalden om zich te vestigen in deze

Savannas and nutrients
142
gebieden, waardoor de kralen structureel open plekken in de overigens dichte savanne bleven. Blijkbaar onderhielden de grote grazers de hoge nutriëntenbeschikbaarheid van kraalgebieden, waarschijnlijk door het importeren van voedingsstoffen in deze sites en door de versnelling van de lokale nutriëntencycli. De toegenomen lokale beschikbaarheid van voedingsstoffen verhindert weer de vestiging van zaailingen in deze vruchtbare omstandigheden.
Deze studie levert dus bewijs dat een verandering in de nutriëntenbeschikbaarheid invloed heeft op het succes van zaailingen om zich vestigingen, wat terug kan koppelen naar veranderingen in het relatieve aandeel van bomen en grassen in droge savannes. Bovendien ondersteunt deze studie het idee dat de schaal van heterogeniteit in voedselbronnen invloed heeft op de wijze waarop voedselbronnen worden verdeeld tussen de samenlevende bomen en grassen, wat weer het gebruik en de impact van browsers vs. grazers op de vegetatie beïnvloedt.
Concluderend levert dit onderzoek nieuwe informatie over voedingsstoffen-plant-herbivoor interacties in een droge savanne met potentieel belangrijke gevolgen voor het beheer van de droge savannen in het algemeen.

Summary
143
Summary In savannas, trees and grasses co-exist and share resources such as water and nutrients. The ratio between the tree and grass components (i.e., vegetation structure) importantly controls productivity, animal assemblages and earth-atmosphere feedbacks. As the structure of savanna vegetation is inherently unstable and easily disturbed, finding out how the vegetation structure is controlled is of great importance for rangeland management and conservation. Currently four factors are believed to control the vegetation structure in savannas; namely, water, nutrients, herbivory and fire. While the water and fire factors have been intensely studied, the roles of nutrients and herbivores as factors are less well known. Improving our understanding of the role of nutrients in savannas is relevant, because it is increasingly realised that global change also alter the availability of nutrients, e.g., increased nitrogen deposition. How savanna systems respond to nutrient perturbations is uncertain. Changes in soil nutrient availability are also likely to feed back to changes in forage quality, which may influence large herbivore use and vegetation impact patterns, thus indirectly influencing vegetation structure. Moreover, it is increasingly realised that not only changes in the availability of nutrients influence plants and subsequently herbivores, but also how nutrients become spatially available. In fact, new ideas suggest that differences in the scale of spatial resource heterogeneity may control how resources are partitioned between co-existing species differing in size, e.g., large trees co-existing with small grasses in savanna systems. To test how changes in nutrient availability and spatial configurations influence savanna systems, several field experiments were conducted in a semi-arid savanna in South Africa.
In the study area we found that nutrient (N, P and K) availability negatively affected tree (Colophospermum mopane) seedling establishment in fertilization experiments. Also, trees failed to re-colonize nutrient-rich kraal sites that were abandoned almost half a century ago. In dry savannas, it is currently believed that the success of tree seedling establishment exercises large control over the relative dominance of trees, thus an increase in nutrient availability may feed back to a structurally more open vegetation state. Different explanations may account for constrained tree seedling establishment under fertile soil conditions. We tested the hypothesis that the intensification of grass competition reduces tree seedling recruitment in fertile environments. In controlled competition experiments it was shown that negative nutrient effects on tree seedlings only occur when seedlings were competing with grasses in mixtures. Furthermore, we found that adding both water and nutrients to tree seedling-grass plant mixtures cancelled the negative effects of added nutrients on tree seedlings. Thus the suppressing effect of increased nutrient availability on seedlings appears to operate indirectly through the pre-empting of soil water resources by vigorous herbaceous growth under fertile conditions. Since woody seedlings are vulnerable to water stress, increased nutrient-induced water stress translates into higher mortality rates and suppressed growth of tree seedlings in fertile areas. In support, transplanted tree seedling mortality increased during a mid-season drought as local fertilizer concentration increased. In conclusion, intensified herbaceous competition under fertile soil conditions appears to be a viable mechanism explaining poor tree seedling recruitment under fertile soil conditions.

Savannas and nutrients
144
While establishing tree seedlings suffer under fertile conditions, our data suggest that established (mature) tree growth benefitted from an increase in nutrient availability, especially following an increase in N availability. With regards to increased atmospheric N deposition, we predict that tree cover may initially expand following nutrient enrichment in dry savannas, although tree cover responses may be insensitive to current levels of N deposition. However, in the long-term tree cover is expected to decline, because of constrained tree recruitment that appears to be more sensitive to small increases in N availability.
The relative availability of nutrients such as N and P may also influence how resources are partitioned between co-existing trees and grasses. In a field experiment we found evidence that trees were relatively more limited by N than P availability. An East African study has shown that grasses underneath trees are more P than N limited and we found evidence that the competiveness of sub-canopy grasses in our study increased when only P was supplied. The relative availability of N vs. P may therefore offer an additional axis governing resource partitioning between trees (non N-fixing) and grasses in savanna systems. This supports the idea that organisms with a high growth potential, apparently grasses in savannas, have relatively high P requirements to sustain rapid protein synthesis, while slower growing organisms such as trees are more limited by the availability of N.
The availability of soil nutrients strongly mediated where large herbivores concentrated their impact in the landscape. Both grazers and browsers responded positively to fertilization, apparently via the control that soil nutrient availability has on forage quality. Tree and grass leaf N and P concentrations increased and condensed tannin concentrations in trees decreased following fertilization. Under high local soil nutrient concentrations the vegetation biomass was in some instances reduced below control biomass by herbivores, indicating that top-down herbivore effects potentially override bottom-up nutrient effects under fertile conditions.
In ecology, it is increasingly realized that it is not only the availability of nutrients, but also how nutrients become spatially available that matters. Data from a large field experiment where a gradient in the scale of nutrient patchiness (i.e., patch grains sizes 2 x 2 m, 10 x 10 m or 50 x 50 m) was created, suggested that the scale of nutrient patchiness controlled the partitioning of resources between co-existing trees and grasses. For the same local fertilizer concentration, tree leaf quality was unresponsive to fertilization in small patches, but responded in the larger patches. Grass leaf quality increased with local fertilizer concentration regardless of patch size. The differential responses of trees and grasses to scale differences subsequently modulated the responses of the browser and grazer guilds. For the same high local fertilizer concentration, grazers responded to both fine and coarse scales of nutrient patchiness, while browsers responded only to the coarse scale of nutrient patchiness. In turn, the selective grazing in the fine scale of nutrient patchiness treatment, apparently stimulated tree growth. In the coarser scale of patchiness treatment both browsers and grazer impact intensified locally. Thus the scale of nutrient patchiness controlled nutrient partitioning between trees and grasses, which was apparently closely tracked by the large herbivore assemblage, resulting in differential local impacts on the tree and grass layers. Apart from local effects, the scale of nutrient patchiness may also regulate the use and quality of forage resources at larger (e.g.,

Summary
145
landscape) scales. In the large field fertilizer experiment, calculations suggest that the total herbaceous off-take by grazers peaked where the same fertilizer amount (15 kg N plot-1) was spread over the whole plot surface area rather than concentrated in 10 x 10 m patches. Thus, how nutrients are distributed in an area controls secondary productivity and where herbivores concentrate their impact.
The scale related patterns observed in the large fertilizer experiment may have been reinforced by plastic responses (e.g., fine root proliferation in nutrient-rich soil) to heterogeneous nutrient supplies of trees in the coarse scale treatments and grasses in the fine scale treatments, respectively. To test this, the same nutrient amount was supplied at two different scales of patchiness to focal trees with their associated grasses. Two years after fertilization, large-scale fertilized trees showed increased shoot growth and increased leaf N concentrations compared to small-scale fertilized trees receiving the same N amount. Conversely, trees in a small-scale configuration fertilized with P showed negative responses compared to large-scale counterparts. These results suggest that differences in the local scale of nutrient patchiness also influence how nutrients are partitioned between co-existing trees and grasses.
Herbivores not only respond to nutrient heterogeneity, but may also create spatial heterogeneity in nutrient availability, which, in turn, may influence the vegetation structure of savannas. We studied the current soil nutrient status, tree and grass biomass patterns and large herbivore use of nine former livestock holding pen areas (kraals) in a semi-arid, nutrient poor savanna. These were contrasted with nearby control sites located in the surrounding landscape. The kraals, formerly enriched by livestock dung and urine, were abandoned around 1970 and since then wildlife replaced livestock in these parts. We found that around 40 years later, kraal soil had elevated concentrations of inorganic N, extractable P, K, Ca and Mg compared to control sites, which resulted in high quality forage in kraal sites. Trees also failed to invade these sites, thus kraals remained as structurally open patches in the otherwise dense savanna. Evidently, wild large herbivores maintain the high nutrient status of kraal sites, probably by importing nutrients into these sites and by accelerating local nutrient cycling. In turn, the increased local nutrient availability prevents tree seedlings from establishing under these fertile conditions. Finally, this study provided evidence that changes in the availability of nutrients influenced the success of woody seedling establishment, which may feed back to changes in the relative proportions of trees and grasses in dry savannas. Furthermore, this study supports the new idea that the scale of resource heterogeneity influences how resources are partitioned between co-existing trees and grasses, which, in turn, modulated browser vs. grazer use and impact patterns on the vegetation. In conclusion, this study provides new information on nutrient-plant-herbivore interactions in a dry savanna with potentially important implications for the management of dry savannas in general.
146
Affiliation of co-authors ADA KOOL, Resource Ecology Group, Wageningen University, P.O. Box 47, 6700AA
Wageningen, The Netherlands
ANDREW K. SKIDMORE, International Institute for Geo-information Science and Earth
Observation, P.O. Box 6, 7500 AA Enschede, The Netherlands
BRUCE R. PAGE, Biological and Conservation Sciences, Westville Campus, University of
KwaZulu-Natal, Private Bag X54001, Durban 4000, South Africa
EDWARD M. KOHI, Resource Ecology Group, Wageningen University, P.O. Box 47,
6700AA Wageningen, The Netherlands
EMMANUEL MWAKIWA, Resource Ecology Group, Wageningen University, P.O. Box 47,
6700AA Wageningen, The Netherlands
FRANK VAN LANGEVELDE, Resource Ecology Group, Wageningen University, P.O. Box
47, 6700AA Wageningen, The Netherlands
HANS DE KROON, Department of Experimental Plant Ecology, Radboud University
Nijmegen, P.O. Box 9010, 6500 GL Nijmegen, The Netherlands
HENRIK J. DE KNEGT, Resource Ecology Group, Wageningen University, P.O. Box 47,
6700AA Wageningen, The Netherlands
HERBERT H.T. PRINS, Resource Ecology Group, Wageningen University, P.O. Box 47,
6700AA Wageningen, The Netherlands
IGNAS M.A. HEITKŐNIG, Resource Ecology Group, Wageningen University, P.O. Box 47,
6700AA Wageningen, The Netherlands
MIKE J.S. PEEL, Agricultural Research Council - Range and Forage Institute, PO Box
13054, Nelspruit 1200, South Africa
RINA C. GRANT, Scientific Services, Kruger National Park, Private Bag X402, Skukuza
1350, South Africa
ROB SLOTOW, Biological and Conservation Sciences, Westville Campus, University of
KwaZulu-Natal, Private Bag X54001, Durban 4000, South Africa
SELINE S. MEIJER, Resource Ecology Group, Wageningen University, P.O. Box 47,
6700AA Wageningen, The Netherlands

Co-authors
147
SIPKE E. VAN WIEREN, Resource Ecology Group, Wageningen University, P.O. Box 47,
6700AA Wageningen, The Netherlands
WILLEM F. DE BOER, Resource Ecology Group, Wageningen University, P.O. Box 47,
6700AA Wageningen, The Netherlands
YOLANDA PRETORIUS, Resource Ecology Group, Wageningen University, P.O. Box 47,
6700AA Wageningen, The Netherlands

148
Curriculum Vitae Cornelis van der Waal was born on 1 August 1970 in South Africa, and grew up in South Africa and Namibia. After high school he joined the national service of South Africa where he qualified as a horse-riding instructor. He enrolled for a pasture science degree at the University of Pretoria, which was completed in 1994. Before starting with a BSc honours course in Wildlife Management, he worked as a farm manager for a year. As part of the wildlife management course he contributed to the formulation of a rehabilitation plan for the Quissama National Park in Angola, which subsequently resulted in the re-introduction of game animals into a section of the former park. After completing the honours programme he worked as a rangeland scientist for the Department of Agriculture in South Africa, where his work included research and advising farmers on best rangeland management practises.
During this period he also enrolled for a part-time MSc. For his MSc he quantified the forage resources on several game ranches and nature reserves and related these to demographic and nutritional characteristics of greater kudu (Tragelaphus strepsiceros) populations. The aim of the study was to identify the forage components that avert kudu population crashes during droughts. In 2005, Cornelis joined the TEMBO (The Elephant Movement and Bio-Optimization programme as one of six PhD candidates. The TEMBO programme is a multi-disciplinary endeavour that aims to contribute to wise elephant management, and uses the Kruger system in southern Africa as a case study. The results of his research conducted within the TEMBO programme culminated in this thesis.
Cornelis is married to Lizelle and currently they live in Namibia with their son, Benjamin.

149
List of publications Knox NM, Skidmore AK, Schlerf M, de Boer WF, van Wieren SE, van der Waal C,
Prins HHT & Slotow R (2010) Nitrogen prediction in grasses: Effect of bandwidth and plant material state on absorption feature selection. International Journal of Remote Sensing 31:691-704
de Knegt HJ, van Langevelde F, Coughenour M, Skidmore AK, de Boer, WF, Heitkönig IMA, Knox N, Slotow R, van der Waal C & Prins HHT (2010) Spatial autocorrelation and the scaling of species-environment relationships. Ecology 91(8): 2455-2465
Kohi EM, de Boer WF, Slot M, van Wieren SE, Ferwerda JG, Grant RC, Heitkönig IM, de Knegt HJ, Knox N, van Langevelde F, Peel M, Slotow R, van der Waal C & Prins HHT (2009) Effects of simulated browsing on growth and leaf chemical properties in Colophospermum mopane saplings. African Journal of Ecology 48:190-196
van der Waal C, de Kroon H, de Boer, WF, Heitkönig IMA, Skidmore AK, de Knegt HJ, van Langevelde F, van Wieren SE, Grant RC, Page BR, Slotow R, Kohl EM, Mwakiwa E & Prins HHT (2009) Water and nutrients alter herbaceous competitive effects on tree seedlings in a semi-arid savanna. Journal of Ecology 97:430-439
Wessels DCJ, van der Waal C & de Boer WF (2007) Induced chemical defences in Colophospermum mopane trees. African Journal of Range and Forage Science 24:141–147
du Plessis I, van der Waal C, van Wyk RR, Webb EC, Kritzinger B & van den Berg J (2006) Regional differences in growth parameters between two impala populations. South African Journal of Animal Sciences 35:90-94
van der Waal C (2005) Kudu foraging behavior: influenced by animal density? African Journal of Range and Forage Science 22:11-16
Hooimeijer JF, Jansen FA, de Boer FW, Wessels D, van der Waal C, de Jong CB, Otto ND & Knoop L (2005) The diet of kudus in a mopane dominated area, South Africa. Koedoe 48:93-102
du Plessis I, van der Waal C & Webb EC (2004) A comparison of plant form and browsing height selection of four small stock breeds - Preliminary results. South African Journal of Animal Sciences 34:31-34
van der Waal C, Smit GN & Grant CC (2003) Faecal nitrogen as an indicator of the nutritional status of kudu in a semi-arid savanna. South African Journal of Wildlife Research 33:33-41
van der Waal C & Dekker B (2000) Game ranching in the Northern Province of South Africa. South African Journal of Wildlife Research 30:151-156

150
PE&RC PhD Education Certificate With the educational activities listed below the PhD candidate has complied with the educational requirements set by the C.T. de Wit Graduate School for Production Ecology and Resource Conservation (PE&RC) which comprises of a minimum total of 32 ECTS (= 22 weeks of activities) Review of Literature (5.6 ECTS)
o The effect of differential nutrient acquirement capacities in savanna grass-tree dynamics (2005)
Post-Graduate Courses (7.5 ECTS)
o Survival statistics (2005) o Plant ecophysiology (2005) o Art of modeling (2006) o Introduction for R for statistics (2008) o Principles of Remote Sensing (2010)
Laboratory training and working visits (0.9)
o Sample processing, ARC lab., South Africa (2006 & 2007) Deficiency, Refresh, Brush-up Courses (2.8 ECTS)
o Ecological methods (2005) Competence Strengthening / Skills Courses (3.1 ECTS)
o Art of writing (2005) o Scientific writing (2008) o Interpersonal communication for PhD students (2008)
Discussion Groups / Local Seminars and Other Scientific Meetings (6.2 ECTS)
o Forest and conservation (2005 & 2008) o APNR joined management meetings: research session (2005 - 2008) o Lowveld Ecological Research Group meetings (2007) o Experimental Plant Ecology Group, Radboud University Nijmegen (2005 &
2008) PE&RC Annual Meetings, Seminars and the PE&RC Weekend (2.1 ECTS)
o PE&RC Introduction weekend (2005) o PE&RC one-day symposium (2005) o Multiple views on scales and scaling (2007) o PE&RC day (2008)
International Symposia, Workshops and Conferences (6.8 ECTS)
o SANPARKS Network meeting, Skukuza, South Africa (2007) o Elephant management and owner’s association (EMOA), Orpen, South Africa
(2008) o Sustainable Land Management in the Dry Lands of southern Africa: the
practicalities, Windhoek, Namibia (2009)

151
Sketches: Lizelle van der Waal Cover design: Cornelis van der Waal The research described in this thesis was financially supported by WOTRO (Foundation for the Advancement of Tropical Research, The Netherlands) grant # W01.65.216. Financial support from WOTRO and Wageningen University for printing this thesis is gratefully acknowledged.