nutrient load estimation and reporting · pdf file4/7/2017 · nutrient load...
TRANSCRIPT

Nutrient Load Estimation and Reporting
Loading Calculations Technical SymposiumNOAA GLIER, Ann ArborAlice Dove and Sean BackusWater Quality Monitoring & SurveillanceIsaac Wong and Phil FongWatershed Hydrology and Ecosystem Research DivisionApril 6, 2017
Contents
• Whole Lake Loads• Tributary Monitoring
– Sampling Methods and Load Estimation Methods
• Connecting Channel Monitoring– Unique opportunity to validate corridor estimates– Overview of St. Clair, Detroit and Niagara Loads
• Loading Estimate Decision Support System

Mean TP Loads to Lake Erie, 2003-2013 (MTA)
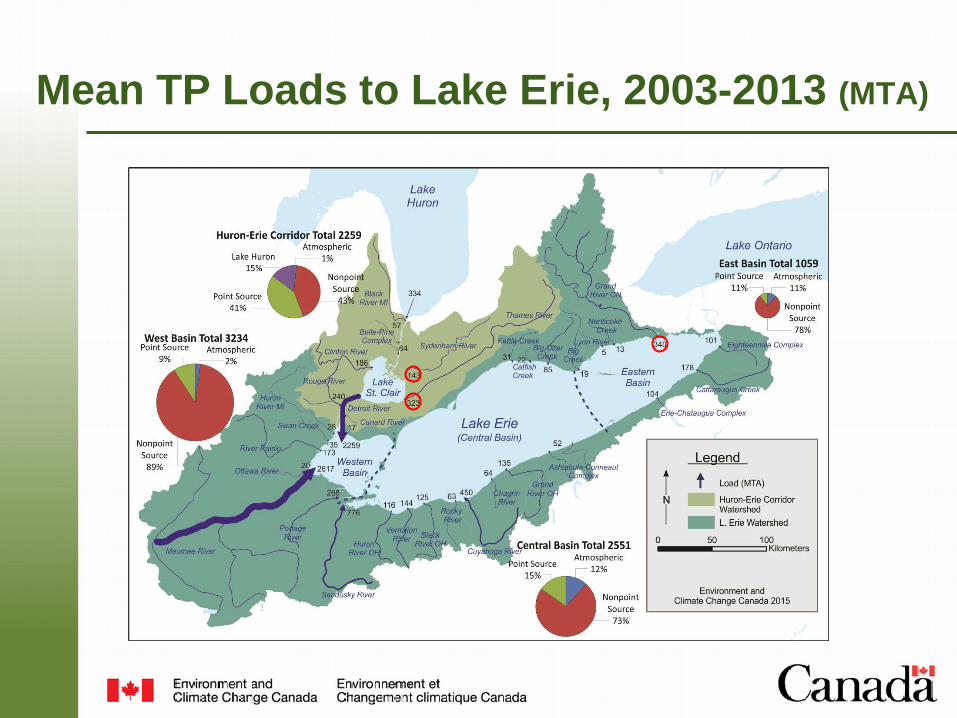
Mean TP Loads to Lake Erie, 2003-2013 (MTA)
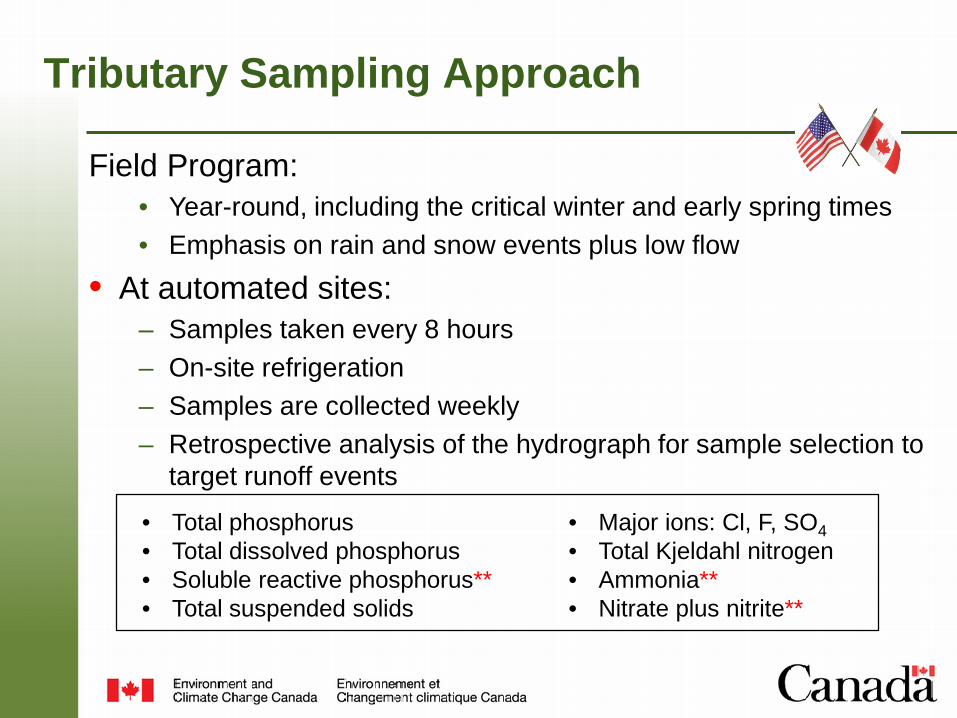
Tributary Sampling Approach
Field Program:• Year-round, including the critical winter and early spring times• Emphasis on rain and snow events plus low flow
• At automated sites:– Samples taken every 8 hours – On-site refrigeration– Samples are collected weekly– Retrospective analysis of the hydrograph for sample selection to
target runoff events
• Total phosphorus• Total dissolved phosphorus• Soluble reactive phosphorus**• Total suspended solids
• Major ions: Cl, F, SO4• Total Kjeldahl nitrogen• Ammonia**• Nitrate plus nitrite**

All Season Stations
Grand River
Thames River

In-River Pumps
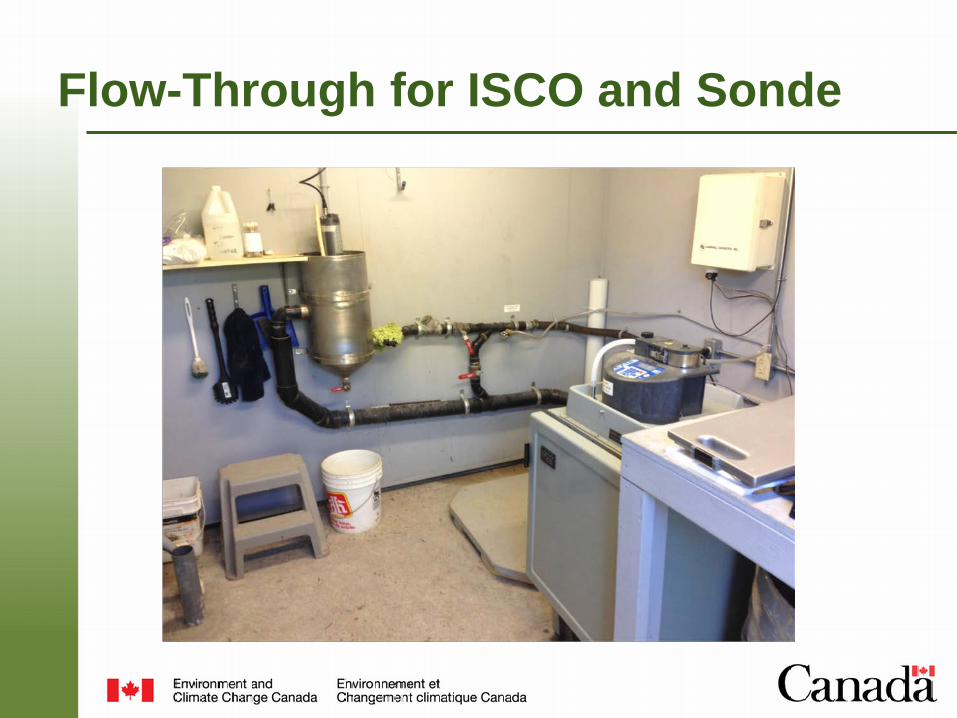
Flow-Through for ISCO and Sonde
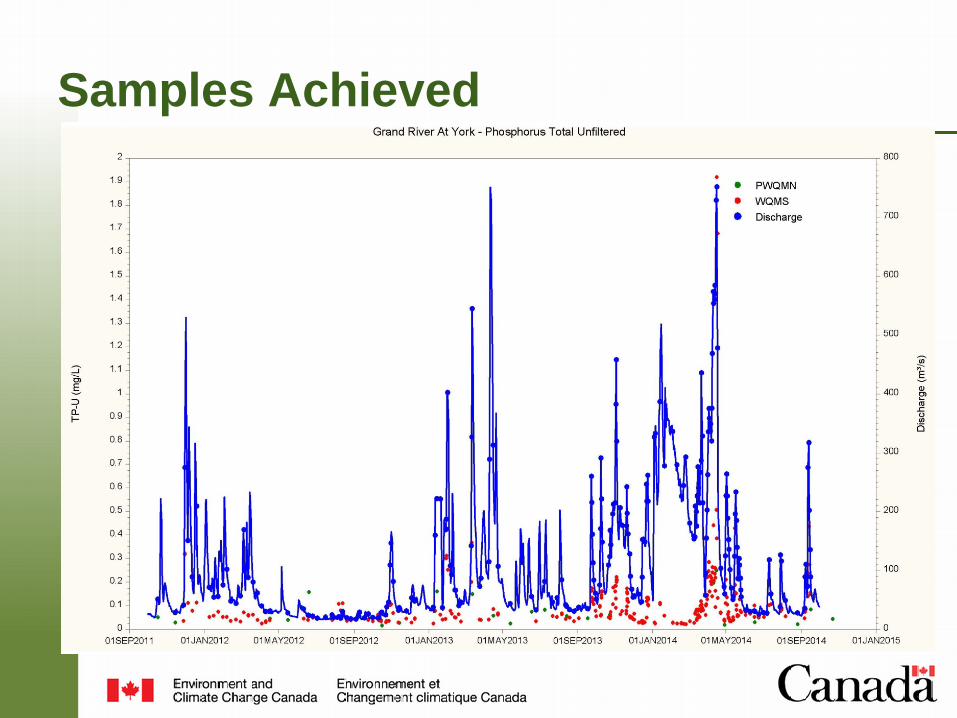
Samples Achieved
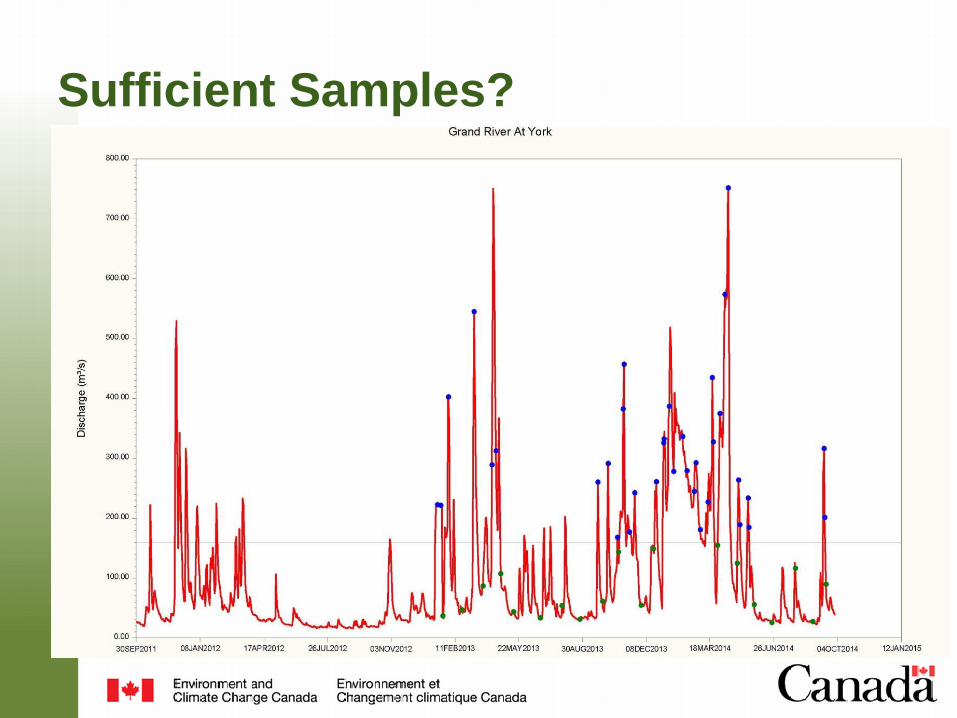
Sufficient Samples?

Sample Selection Protocol
Example - Thames River at Thamesville:• For runoff events >200 m3/s – three samples will be
analyzed (rising limb, peak, falling limb) • For runoff events >100 m3/s up to 200 m3/s – two
samples will be analyzed (rising limb, peak) • For runoff events >80 m3/s up to 100 m3/s – one sample
will be analyzed (peak) • If no runoff events (flow <80 m3/s)– one sample will be
analyzed every two weeks (most recent sample) • One sample on each day of Lake St. Clair survey
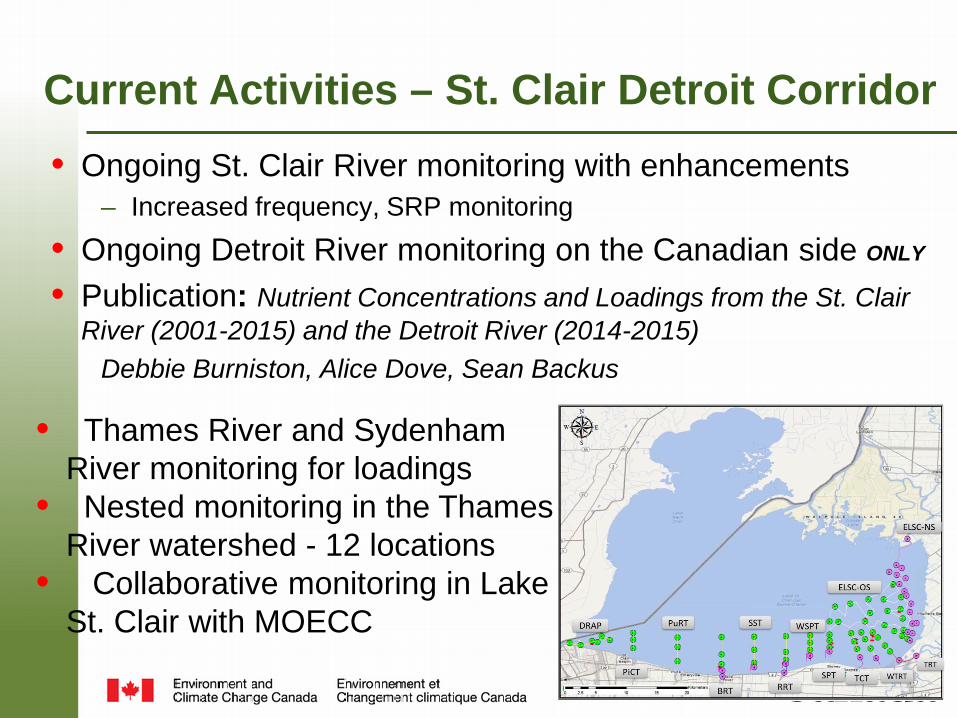
Current Activities – St. Clair Detroit Corridor• Ongoing St. Clair River monitoring with enhancements
– Increased frequency, SRP monitoring
• Ongoing Detroit River monitoring on the Canadian side ONLY
• Publication: Nutrient Concentrations and Loadings from the St. Clair River (2001-2015) and the Detroit River (2014-2015)
Debbie Burniston, Alice Dove, Sean Backus
• Thames River and Sydenham River monitoring for loadings
• Nested monitoring in the Thames River watershed - 12 locations
• Collaborative monitoring in Lake St. Clair with MOECC
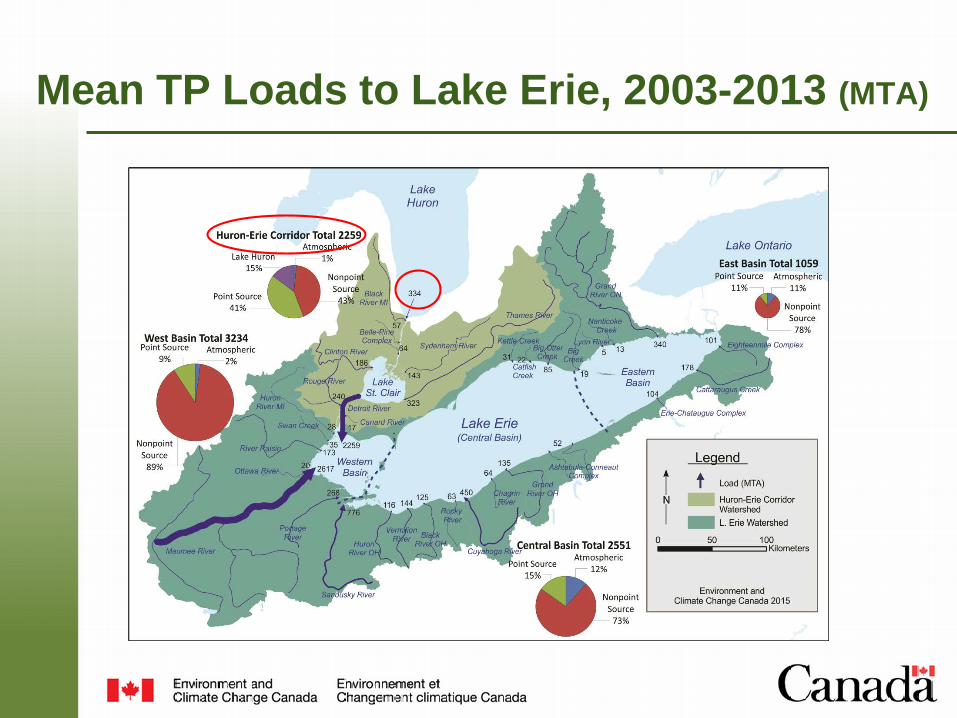
Mean TP Loads to Lake Erie, 2003-2013 (MTA)
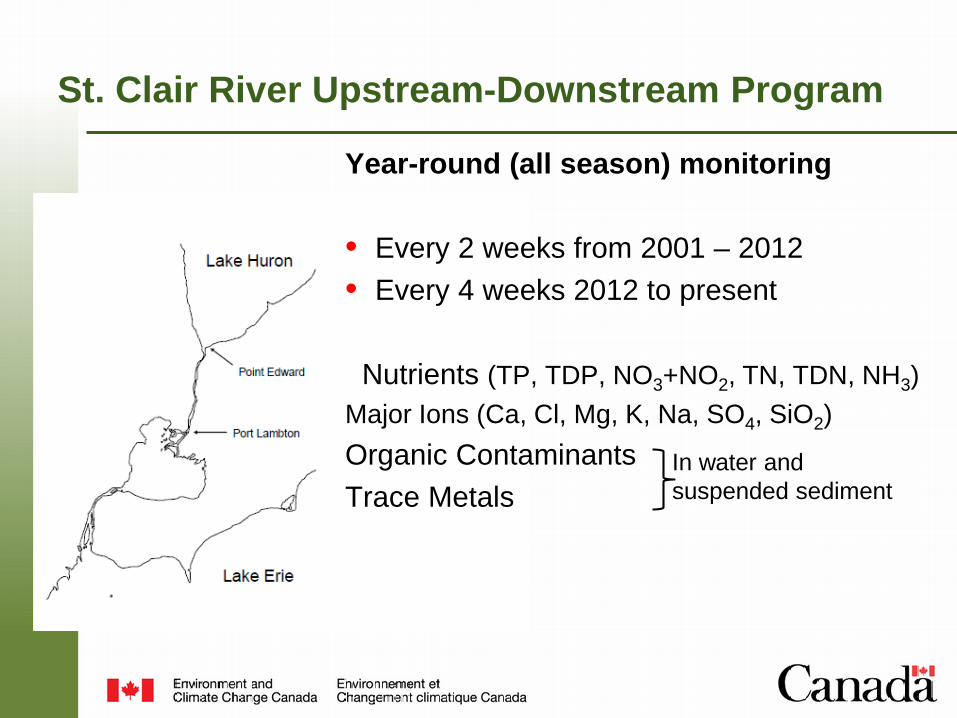
St. Clair River Upstream-Downstream Program
Year-round (all season) monitoring
• Every 2 weeks from 2001 – 2012• Every 4 weeks 2012 to present
Nutrients (TP, TDP, NO3+NO2, TN, TDN, NH3) Major Ions (Ca, Cl, Mg, K, Na, SO4, SiO2)Organic ContaminantsTrace Metals
In water and suspended sediment

Total Phosphorus Loads - LOADEST
900 MTA input from Lake Huron
1980 MTA output to Lake St. Clair

Total Phosphorus Loads - LOADEST
900 MTA input from Lake Huron
1980 MTA output to Lake St. Clair

Detroit River 2014 and 2015 (2004 and 2007)

Detroit River 2014 and 2015 (2004 and 2007)
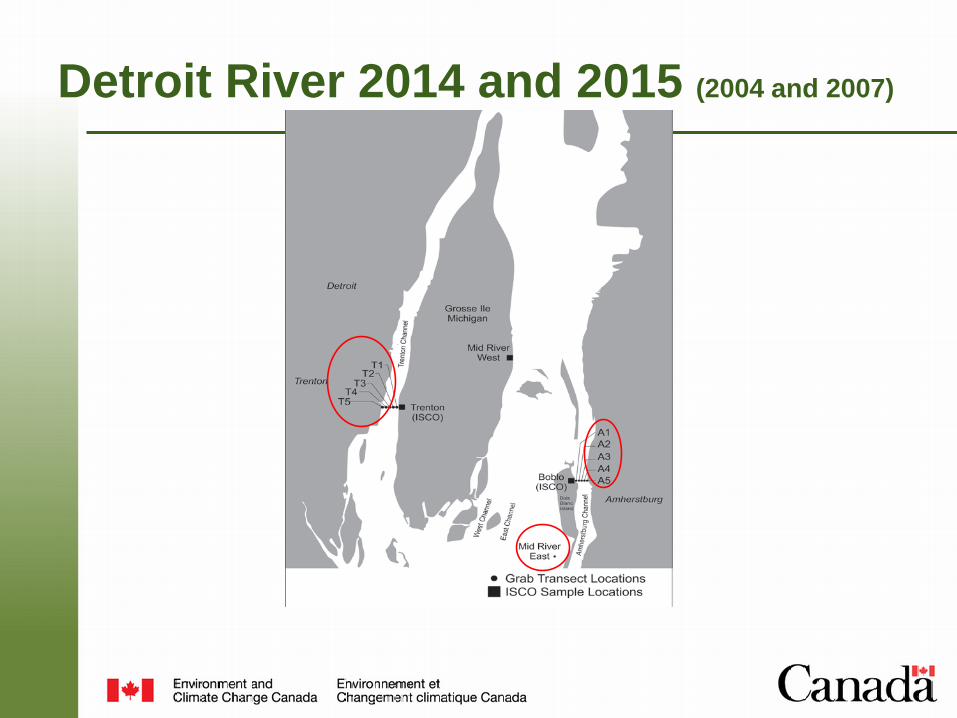
Detroit River 2014 and 2015 (2004 and 2007)
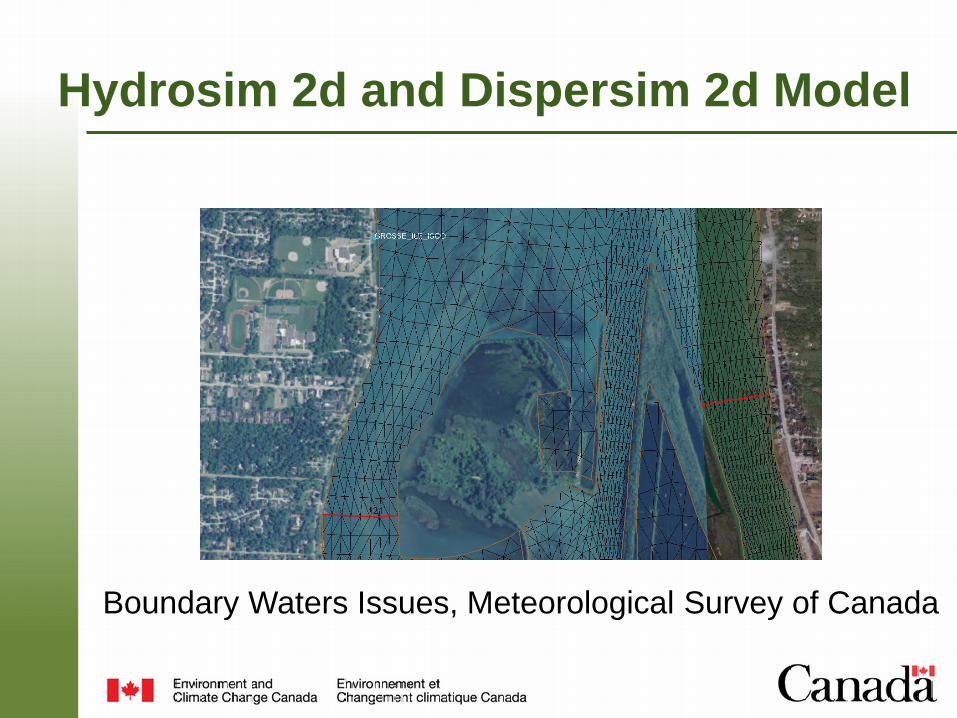
Hydrosim 2d and Dispersim 2d Model
Boundary Waters Issues, Meteorological Survey of Canada
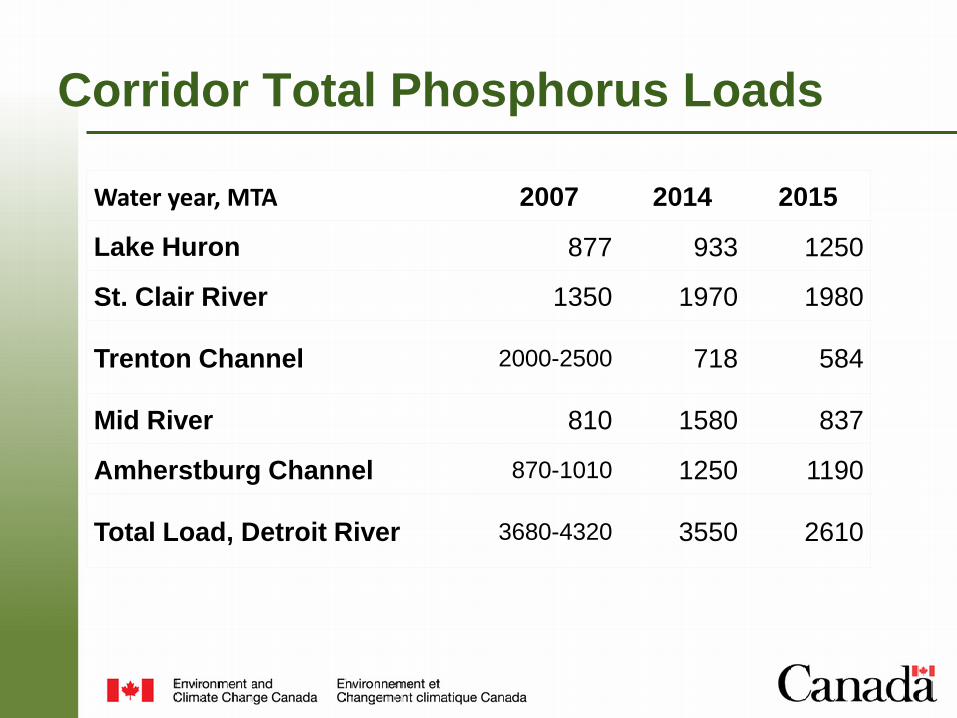
Corridor Total Phosphorus Loads
Water year, MTA 2007 2014 2015
Lake Huron 877 933 1250
St. Clair River 1350 1970 1980
Trenton Channel 2000-2500 718 584
Mid River 810 1580 837
Amherstburg Channel 870-1010 1250 1190
Total Load, Detroit River 3680-4320 3550 2610

Mean TP Loads to Lake Erie, 2003-2013 (MTA)
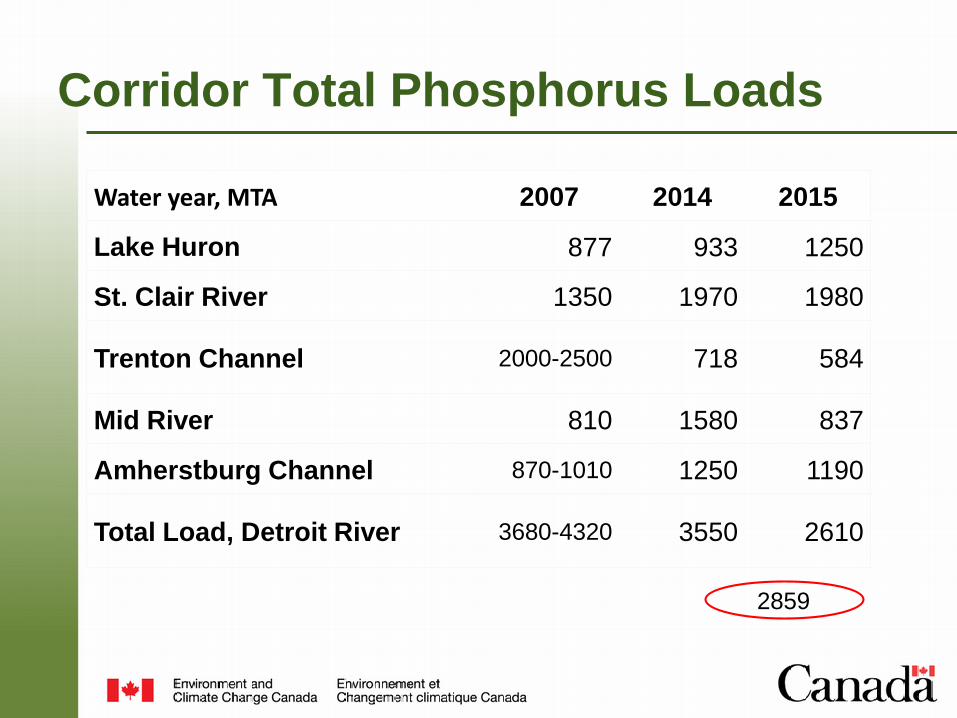
Corridor Total Phosphorus Loads
Water year, MTA 2007 2014 2015
Lake Huron 877 933 1250
St. Clair River 1350 1970 1980
Trenton Channel 2000-2500 718 584
Mid River 810 1580 837
Amherstburg Channel 870-1010 1250 1190
Total Load, Detroit River 3680-4320 3550 2610
2859

Niagara River Upstream-DownstreamLAKE
ONTARIO
Niagara River
Fort ErieStation
Niagara-on-the-Lake Station
LAKE ERIE

What we thought we knew
Total Phosphorus Loads at Niagara-on-the-Lake
1975 1980 1985 1990 1995 2000 2005 2010 2015
0
2000
4000
6000
8000
10000
Tota
l Pho
spho
rus L
oad
(MTA
)

Interlaboratory Comparison Heidelberg University and ECCC NLET
SRP

Loading Estimate Decision Support System
• Collaborative Project between Water Quality Monitoring and Research Divisions• Purpose: an updated, more highly automated tool to estimate annual TP and SRP
loadings using Dolan Method– Monitored tributaries, unmonitored watershed areas, point sources (municipal and industrial), atmospheric
deposition, upstream Great Lakes (i.e. Lake Huron)– Loadings calculated on a water year basis– Standard errors are provided for each estimate
• Project timeline:– April 2016: Start project– June 2016: Receive data files for Lake Erie loads– July 2016: Develop system design of loading estimate decision support system– September 2016: Began implementation of Dolan Method in decision support system (DSS)– March 2017 - present: In process of beta testing, bug fixing and verifying results
Maccoux, M.J., Dove, A., Backus, S.M., Dolan, D.M., 2016. Total and soluble reactive phosphorus loadings to Lake Erie, J. Great Lakes Res., http://dx.doi.org/10.1016/j.jglr.2016.08.005
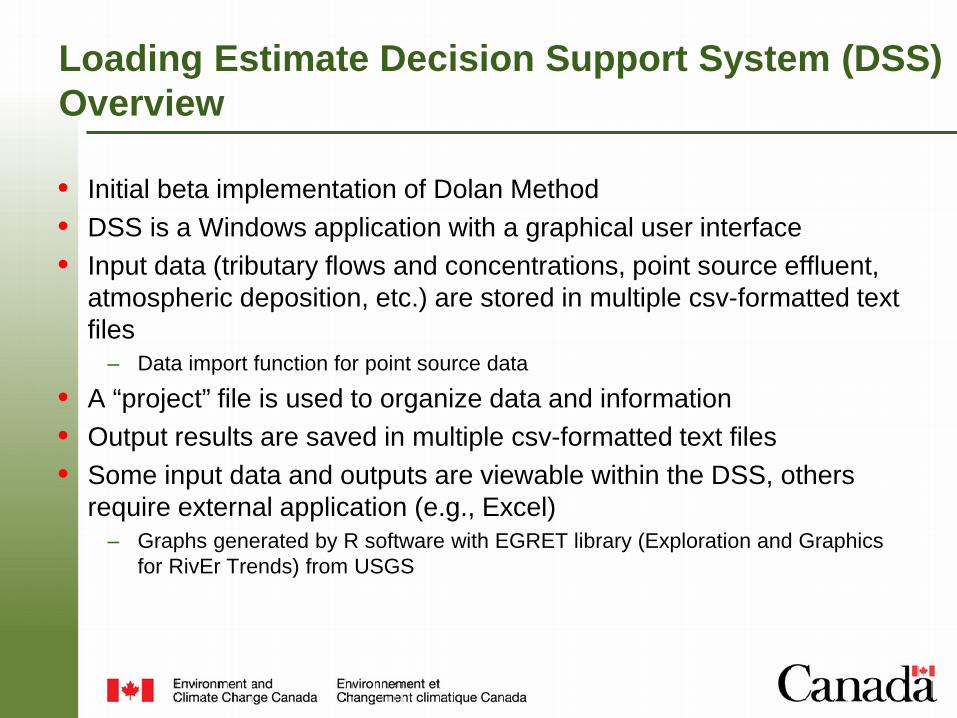
Loading Estimate Decision Support System (DSS)Overview
• Initial beta implementation of Dolan Method• DSS is a Windows application with a graphical user interface• Input data (tributary flows and concentrations, point source effluent,
atmospheric deposition, etc.) are stored in multiple csv-formatted text files
– Data import function for point source data
• A “project” file is used to organize data and information• Output results are saved in multiple csv-formatted text files• Some input data and outputs are viewable within the DSS, others
require external application (e.g., Excel)– Graphs generated by R software with EGRET library (Exploration and Graphics
for RivEr Trends) from USGS

Data Sources (for Lake Erie Loadings)
Data Agency
Tributary Flow CanadaWater Survey of Canada (Environment and Climate Change Canada)
U.S.Water Resources Division (U.S. Geological Service)
Tributary Water Quality
CanadaWater Quality and Monitoring and Surveillance Division (Environment and Climate Change Canada)Provincial Water Quality Monitoring Network (Ontario Ministry of Environment and Climate Change)
U.S.National Center for Water Quality Research (Heidelberg University)Water Resources Division (Michigan Department of Environmental Quality)Division of Surface Water (Ohio Environmental Protection Agency)STORET (U.S. Environmental Protection Agency)Water Resources Division (U.S. Geological Survey)
Point Source CanadaMISA (Ontario Ministry of Environment and Climate Change)
U.S.Water Division-PCS/ICIS (U.S. Environment Protection Agency)
Atmospheric Deposition
CanadaWater Quality and Monitoring and Surveillance Division (Environment and Climate Change Canada)
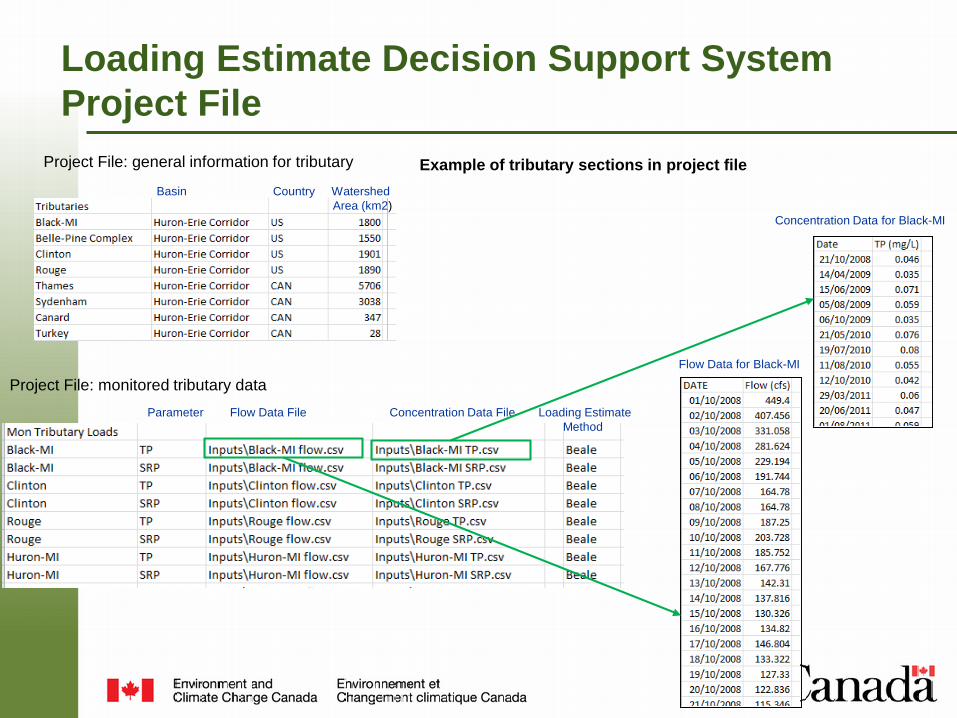
Loading Estimate Decision Support SystemProject File
Basin Country WatershedArea (km2)
Parameter Flow Data File Concentration Data File Loading EstimateMethod
Flow Data for Black-MI
Concentration Data for Black-MI
Project File: general information for tributary
Project File: monitored tributary data
Example of tributary sections in project file
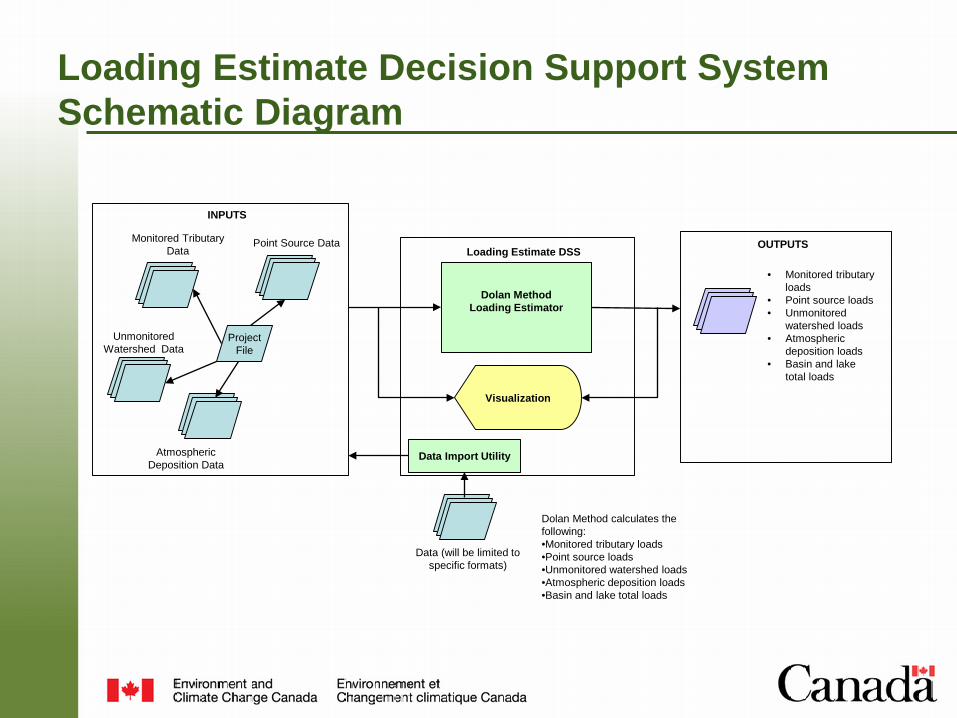
Loading Estimate Decision Support SystemSchematic Diagram
Project File
Monitored Tributary Data
Point Source Data
Atmospheric Deposition Data
Unmonitored Watershed Data
Dolan Method Loading Estimator
Loading Estimate DSS
Visualization
INPUTS
OUTPUTS
• Monitored tributary loads
• Point source loads• Unmonitored
watershed loads• Atmospheric
deposition loads• Basin and lake
total loads
Data Import Utility
Data (will be limited to specific formats)
Dolan Method calculates the following:•Monitored tributary loads•Point source loads•Unmonitored watershed loads•Atmospheric deposition loads•Basin and lake total loads

Loading Estimate Decision Support SystemCurrent Status• Implemented loading calculations for:
– monitored tributaries (Stratified Beale Ratio Estimator, Heidelberg data)– unmonitored watershed areas– point sources– atmospheric deposition– basin, country and lake totals
• In the process of beta testing, bug fixing and verifying results

Loading Estimate Decision Support SystemDemo
Choose project file
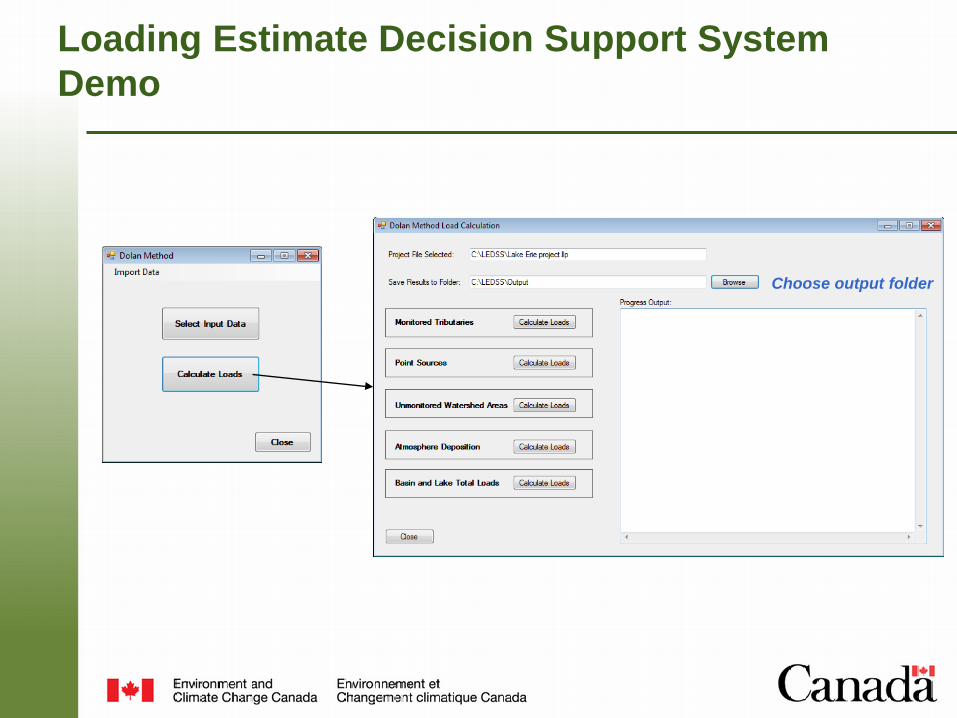
Loading Estimate Decision Support SystemDemo
Choose output folder

Loading Estimate Decision Support SystemMonitored Tributaries (Stratified Beale Ratio)
Inputs OutputsProgram Execution
Grand-ON flow data
Grand-ON concentration data
Original data file csv file for DSS
convert
Original data filecsv file for DSS
convert
View input data
Calculate monitored tributary loads and view results
Graphs: R software with EGRET library
Annual loads for tributaries (csv file)
Details of results (free form text file)
Data files converted into csv format using external program such as Excel
TP
Flow for Grand-ON
Grand-ON
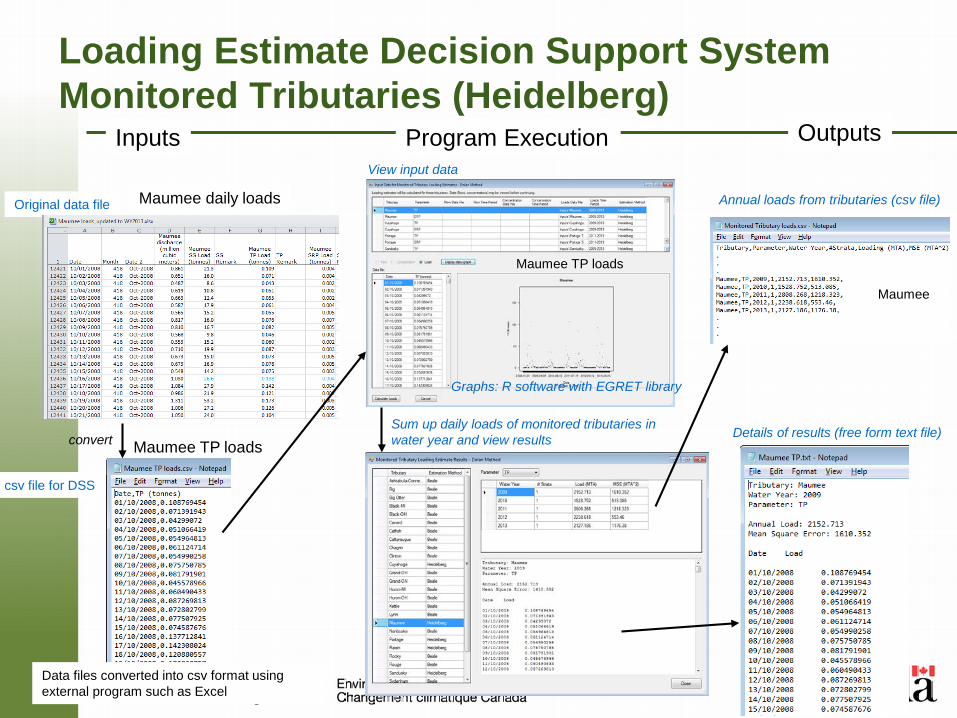
Loading Estimate Decision Support SystemMonitored Tributaries (Heidelberg)
Inputs OutputsProgram Execution
Maumee daily loadsOriginal data file
csv file for DSS
convert
View input data
Sum up daily loads of monitored tributaries in water year and view results
Graphs: R software with EGRET library
Annual loads from tributaries (csv file)
Details of results (free form text file)
Data files converted into csv format using external program such as Excel
Maumee TP loads
Maumee TP loads
Maumee
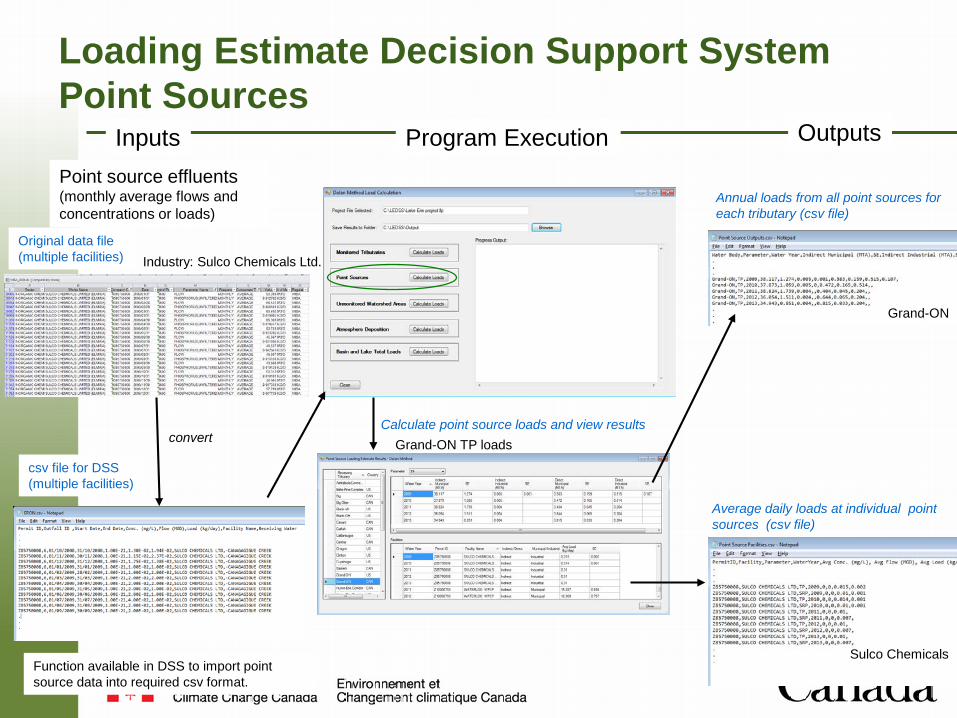
Loading Estimate Decision Support SystemPoint Sources
Inputs OutputsProgram ExecutionPoint source effluents(monthly average flows and concentrations or loads)
Original data file(multiple facilities)
csv file for DSS(multiple facilities)
convertCalculate point source loads and view results
Annual loads from all point sources for each tributary (csv file)
Average daily loads at individual point sources (csv file)
Function available in DSS to import point source data into required csv format.
Industry: Sulco Chemicals Ltd.
Grand-ON TP loads
Grand-ON
Sulco Chemicals
Annual loads from indirect point sources calculated by DSS
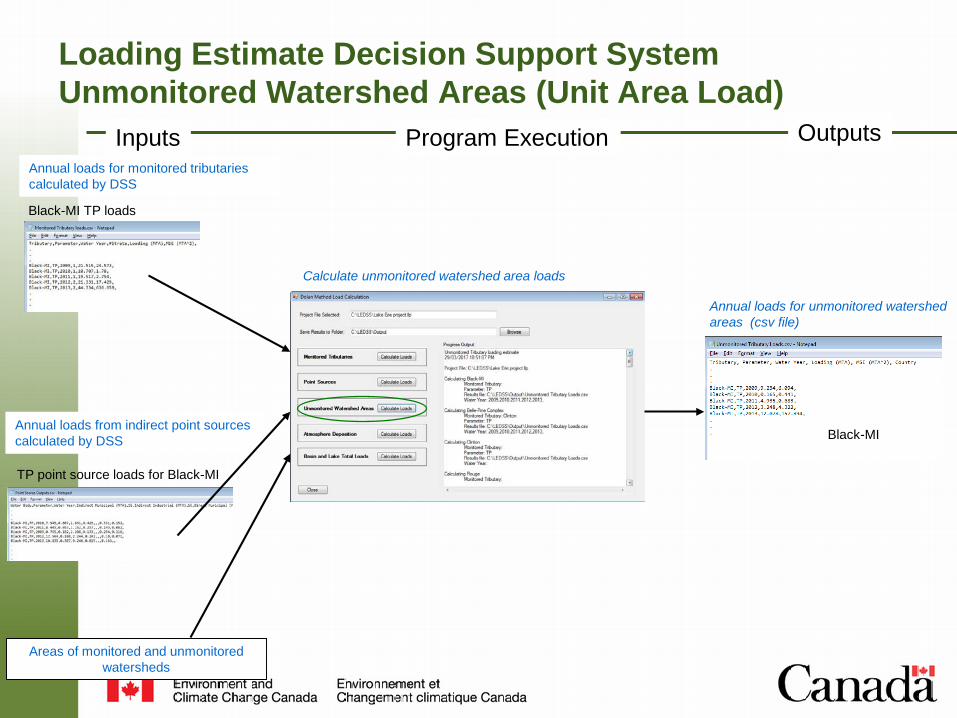
Loading Estimate Decision Support SystemUnmonitored Watershed Areas (Unit Area Load)
Inputs OutputsProgram Execution
Annual loads for unmonitored watershed areas (csv file)
Annual loads for monitored tributaries calculated by DSS
Areas of monitored and unmonitored watersheds
Calculate unmonitored watershed area loads
Black-MI TP loads
TP point source loads for Black-MI
Black-MI

Loading Estimate Decision Support SystemAtmospheric Deposition
Inputs OutputsProgram Execution
Monthly precipitation volumes and TP concentrations
Original data file
csv file for DSSconvert
Annual loads for basins (csv file)
Annual loads at monitoring stations (csv file)
Data files converted into csv format using external program such as Excel
Calculate atmospheric deposition loads
Point Pelee
Point Pelee
Point Pelee
Lake Erie basins
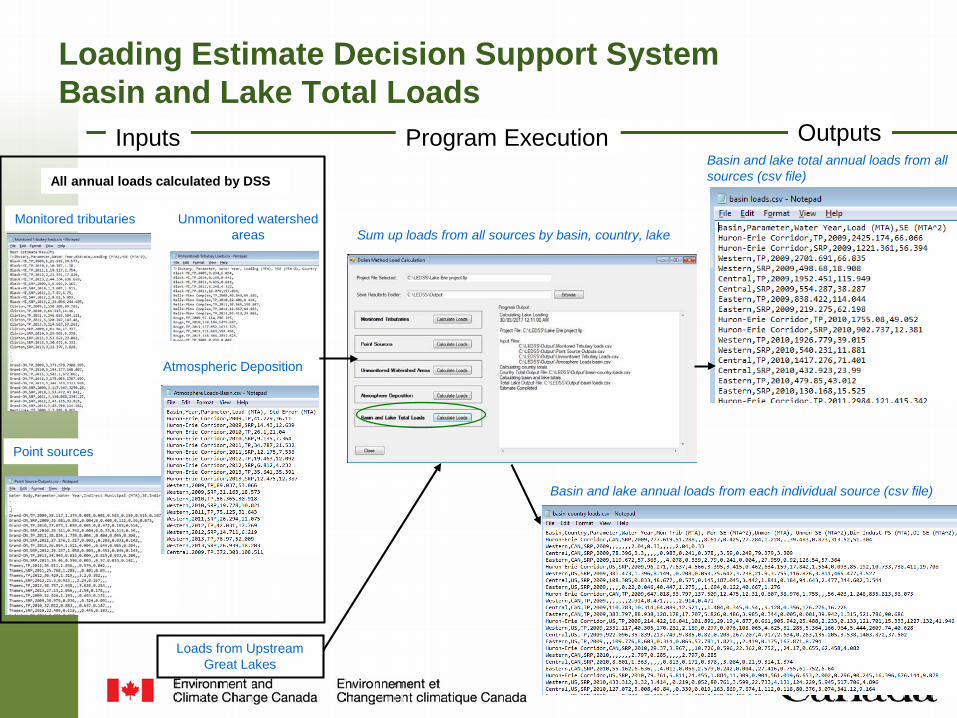
Loading Estimate Decision Support SystemBasin and Lake Total Loads
Inputs OutputsProgram ExecutionBasin and lake total annual loads from all sources (csv file)All annual loads calculated by DSS
Point sources
Monitored tributaries Unmonitored watershed areas
Atmospheric Deposition
Loads from Upstream Great Lakes
Basin and lake annual loads from each individual source (csv file)
Sum up loads from all sources by basin, country, lake

Loading Estimate Decision Support SystemImplementation Issues• After initial round of beta testing of DSS, discrepancies in some results were discovered• Implementation is our interpretation of Dolan Method based on Maccoux et al., (2016)
1. Monitored tributaries: When calculating loads using Stratified Beale Ratio Estimator, there were cases where the DSS used different flow cutoff values and/or number of strata compared to Maccoux et al., (2016).
Examples: Black-MI in 2013 Sydenham in 2013
If we have detail information on the algorithms from Dolan program used by Maccouxet al., (2016) to compute flow cutoff values and to choose number of strata, then issue can be resolved.
# of strata
TP Load (MTA) MSE (MTA^2)
Maccoux 1 49 709DSS 2 44 (-10%) 637 (-10%)
# of strata
Flow cutoff (cfs)
TP Load (MTA)
MSE (MTA^2)
Maccoux 2 400 90 1100DSS 2 300 88 (-2%) 1085 (-1%)
Loading Estimate Decision Support SystemImplementation Issues (continued)
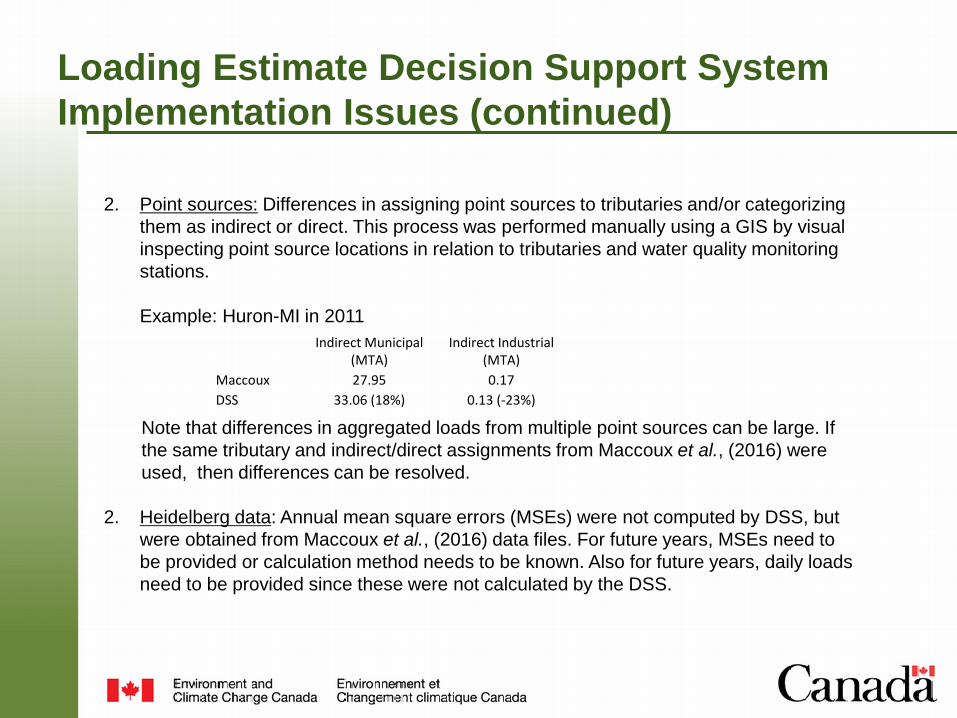
2. Point sources: Differences in assigning point sources to tributaries and/or categorizing them as indirect or direct. This process was performed manually using a GIS by visual inspecting point source locations in relation to tributaries and water quality monitoring stations.
Example: Huron-MI in 2011
Note that differences in aggregated loads from multiple point sources can be large. If the same tributary and indirect/direct assignments from Maccoux et al., (2016) were used, then differences can be resolved.
2. Heidelberg data: Annual mean square errors (MSEs) were not computed by DSS, but were obtained from Maccoux et al., (2016) data files. For future years, MSEs need to be provided or calculation method needs to be known. Also for future years, daily loads need to be provided since these were not calculated by the DSS.
Indirect Municipal (MTA)
Indirect Industrial (MTA)
Maccoux 27.95 0.17DSS 33.06 (18%) 0.13 (-23%)
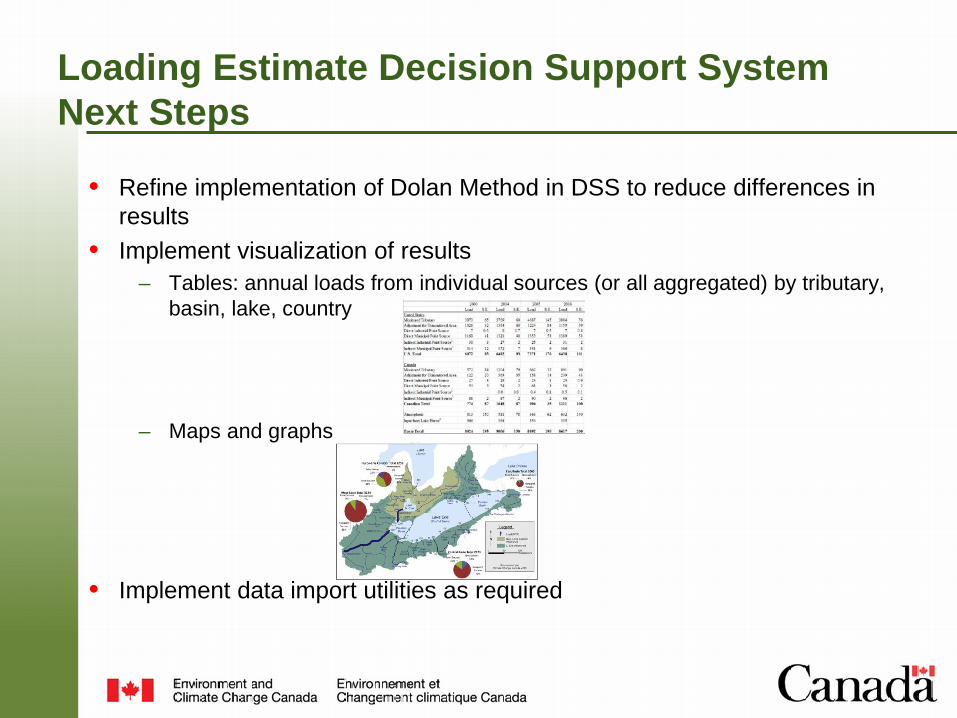
Loading Estimate Decision Support SystemNext Steps
• Refine implementation of Dolan Method in DSS to reduce differences in results
• Implement visualization of results – Tables: annual loads from individual sources (or all aggregated) by tributary,
basin, lake, country
– Maps and graphs
• Implement data import utilities as required

Summary
• ECCC is monitoring in the Huron-Erie corridor, priority Canadian tributaries to Lake Erie, nested monitoring in the Thames River watershed, Lake St. Clair with MOECC, and in the Great Lakes
• Loadings estimates based on Dolan approach, with 50-100 samples collected per location per water year
• LEDSS will be a publically available tool, modernizing the Dolan approach using AI and a user-friendly interface
• ECCC is working with partners to ensure data comparability and is supporting watershed and lake modeling initiatives with enhanced data