nursing, midwifery & health - … · potter, ms sam ward). ... 29 recording vital signs ......
TRANSCRIPT

THIN
K.C
HAN
GE.D
O
NU
RSI
NG
, MID
WIF
ERY
& H
EALT
H

Observation and Response Chart
(ORC) Project
Pilot Testing Report

Observation and Response Chart Project: Pilot Phase i
Preface
This report was prepared for the Australian Commission on Safety and Quality in Health
Care’s program for Recognising and Responding to Clinical Deterioration
Suggested Citation
Elliott D, McKinley S, Perry L, Duffield C, Iedema R, Gallagher R, Fry M, Roche M, Allen E.
2012. Observation and Response Chart (ORC) Project: Pilot Testing Report. University of
Technology, Sydney
ISBN:
Online 0-9806239-9-5
Print 0-9806239-6-0
Publication Date: September 2012`

ii Observation and Response Chart Project: Pilot Phase
Acknowledgements
Thanks to Dr Nicola Dunbar, Program Lead for the Deteriorating Patient at the Australian
Commission on Safety and Quality in Health Care, and other Commission staff who supported
this work.
We acknowledge the important contributions from site executives, project officers and other
staff from each of our clinical sites: Ballarat Health Services, Victoria (Ms Angie Spencer, Mr
Jason Wiseman); Calvary Wakefield and Calvary North Hospitals, South Australia (Ms Jane
Cleveland, Ms Shelley Roberts); Eastern Health, Victoria (Dr David Charlesworth, Ms Sam
Brean); Lyell McEwin Hospital, South Australia (Ms Cindy Halliwell, Ms Tovah Green); North
Shore Private Hospital, New South Wales (Ms Sue Engle, Ms Dena-Louise Hogben; Ms Sarah
Lichenstein); Northern Area Health Service, Tasmania (Ms Sophie Legge); Southern Health,
Victoria (Ms Monica Finnigan, Ms Kate Flynn); St Vincent’s Hospital, Melbourne, Victoria (Mr
Vince Gaglioti, Ms Caroline Scott); St Vincent’s Hospital, Toowoomba, Queensland (Mr Jeff
Potter, Ms Sam Ward).
Thanks also to our Clinical Reference Committee, and the Human Factors team, School of
Psychology, University of Queensland.
We also thank the Hospital Executive of Prince of Wales Hospital / South East Sydney Local
Health District for supporting the project through our secondment agreement for Miss Allen.

Observation and Response Chart Project: Pilot Phase iii
Table of Contents
Preface .................................................................................................................................... i
Acknowledgements ............................................................................................................. ii
Table of Contents ............................................................................................................... iii
List of Tables ....................................................................................................................... vi
List of Figures ..................................................................................................................... vi
Definitions ........................................................................................................................... vii
Executive Summary ........................................................................................................... ix
Study description ................................................................................................................................................................... ix
Study findings. ......................................................................................................................................................................... ix
Recommendations to the Commission ....................................................................................................................... xi
Recommendations to health care organisations .................................................................................................... xi
Conclusions…………………… ............................................................................................................................................... xii
Summary of Recommendations ..................................................................................... xiv
Recommendations to the Commission .................................................................................................................... xiv
Recommendations to Health care organisations .................................................................................................. xv
Introduction .......................................................................................................................... 1
Background………………………….. ......................................................................................................................................... 1
Study aim and objectives .................................................................................................................................................... 3
Methods ................................................................................................................................. 4
Design……….. ............................................................................................................................. 4
Sample……………………….. ...................................................................................................................................................... 4
Site selection ................................................................................................................................................................................. 4
ORC version selection ............................................................................................................................................................ 4
Modification of ORC template ............................................................................................................................................. 5
Extent of ORC implementation .......................................................................................................................................... 5
Site-based Project Officer secondment ........................................................................................................................ 6
Project officer training .............................................................................................................................................................. 6
Clinical site preparation .......................................................................................................................................................... 6
Clinical staff preparation......................................................................................................................................................... 7
Implementation and Data Collection Timeline .......................................................................................................... 7
Data collection .......................................................................................................................................................................... 9
Retrospective and prospective audits ............................................................................................................................ 9
Focus groups ................................................................................................................................................................................ 9
Observations of documentation practice .................................................................................................................. 10
Patient outcome data ............................................................................................................................................................ 10
Data management and analyses ................................................................................................................................. 10
Ethical considerations ....................................................................................................................................................... 11
Results ................................................................................................................................. 12
Demographics. ...................................................................................................................................................................... 12

iv Observation and Response Chart Project: Pilot Phase
Audits - retrospective and prospective ....................................................................................................................... 12
Focus groups ............................................................................................................................................................................. 13
Observation and field notes .............................................................................................................................................. 13
Patient outcome data ............................................................................................................................................................ 14
Objective 1. Rate of completion of chart .................................................................................................................. 15
Compliance with ORC documentation guidelines ............................................................................................... 18
Use of other sections on the ORC ................................................................................................................................ 20
Objective 2. Rate of recognition of abnormal clinical observations ............................................................ 21
Detection of abnormal vital signs................................................................................................................................... 21
Objective 3. Rate of calling for assistance and response obtained ........................................................... 24
Required actions to abnormal vital signs .................................................................................................................. 24
Actual actions in response to an identified abnormal vital sign observation ...................................... 25
Documentation related to interventions for identified abnormal vital signs ......................................... 27
Objective 4. Preferences and comments of clinical staff ................................................................................. 29
Recording vital signs ............................................................................................................................................................. 30
Detecting deterioration ......................................................................................................................................................... 36
Responding / Communicating ......................................................................................................................................... 38
Objective 5. Patient outcomes ...................................................................................................................................... 41
Discussion .......................................................................................................................... 43
Key findings . ...................................................................................................................................................................... 43
Rate of completion of chart ............................................................................................................................................... 43
Rate of documented recognition of abnormal clinical observations ......................................................... 44
Rate of calling for assistance and response obtained ...................................................................................... 46
Preferences and comments of clinical staff ............................................................................................................ 46
Patient outcomes ..................................................................................................................................................................... 49
Study Strengths and Limitations .................................................................................................................................. 50
Implications for practice .................................................................................................................................................... 51
Recommendations to the Commission ..................................................................................................................... 53
Essential element 1: Measurement and documentation of observations ............................................. 53
Essential element 2: Escalation of care .................................................................................................................... 54
Essential element 3: Rapid response systems ..................................................................................................... 54
Essential element 4: Clinical communication ......................................................................................................... 54
Essential element 5: Organisational supports ....................................................................................................... 54
Essential element 6: Education ...................................................................................................................................... 54
Essential element 7: Evaluation, audit and feedback ....................................................................................... 55
Essential element 8: Technological systems and solutions .......................................................................... 56
Recommendations for further research .................................................................................................................... 56
Conclusion .......................................................................................................................... 57
References .......................................................................................................................... 58
Appendices ......................................................................................................................... 60
Appendix A Discussion points for ORC template revision post UTP ................................................... 61
Appendix B Revised templates for pilot phase ................................................................................................ 68
Appendix C Comparison of ORC graphing areas by chart and site ...................................................... 71
Appendix D How to use an ORC information sheet ...................................................................................... 73
Appendix E How to use an ORC poster .............................................................................................................. 80
Appendix F Frequently asked questions (FAQ) sheet ................................................................................. 81
Appendix G Audit form ................................................................................................................................................. 83

Observation and Response Chart Project: Pilot Phase v
Appendix H Focus group questions for project officers ............................................................................... 85
Appendix I Observation and field note guidelines and template ........................................................... 86
Appendix J Ward poster ............................................................................................................................................. 89
Appendix K Participant Information Sheet and Consent Form ................................................................ 90
Appendix L Tables illustrating required actions to abnormal vital signs for each ORC
version… ................................................................................................................................................... 94

vi Observation and Response Chart Project: Pilot Phase
List of Tables
Table 1 Hospital type, selected ORC version and extent of implementation .............. 5
Table 2 ORC implementation checklist ....................................................................... 7
Table 3 Site activity timeline ....................................................................................... 8
Table 4 Number of observation charts audited bychart type and audit period .......... 12
Table 5 Focus groups by clinical site ........................................................................ 13
Table 6 Number of field observations of ORC documentation practices by clinical
site ............................................................................................................... 14
Table 7 Percentage of vital signs recorded by parameter and chart ......................... 18
Table 8 Compliance with graphing of vital signs in accordance with ORC instructions
during the prospective audit ......................................................................... 19
Table 9 Abnormal vital signs by parameter, set and audit period ............................. 22
Table 10 Abnormal vital signs by parameter, set, audit and chart type ...................... 23
Table 11 Location of documented comments relating to abnormal vital signs and
rationale for action taken or not ................................................................... 25
Table 12 MET calls actioned according to ORC criteria in each audit period ............. 27
Table 13 Summary information on MET/arrest calls for the two audit periods ............ 42
List of Figures
Figure 1 Documented frequency for measurement of patient vital signs ................... 15
Figure 2 Additional section on the front of chart by one participating site .................. 16
Figure 3 Total sets of vital signs recorded on each chart during the two 72-hour
audit periods ................................................................................................ 16
Figure 4 Percentage of vital signs recorded by parameter......................................... 17
Figure 5 Total abnormal vital signs by parameter in 72 hours ................................... 21
Figure 6 Action taken according to ORC response criteria ........................................ 26
Figure 7 Concept map of emergent themes from clinical staff preferences and
comments .................................................................................................... 29
Figure 8 Sample of ORC – graphed and written values ............................................. 33

Observation and Response Chart Project: Pilot Phase vii
Definitions
ACSQHC;
The Commission
Australian Commission on Safety and Quality in
Health Care
EWS Early Warning Score
MET Medical Emergency Team
Modifications Any changes made to ORC template; also used
when discussing ‘modifications section’
ORC Observation and Response Charts
Response criteria Physiological signs and parameters set by sites to
align with escalation policies and trigger a response
RRS Rapid Response System
Sets of vital signs /
observations
Core physiological variables – respiratory rate; heart
(pulse) rate; oxygen saturation; systolic blood
pressure; temperature
For the ORC templates, diastolic blood pressure,
consciousness, urine output and pain are also
documented (NB consciousness and urine output
contribute to a response to clinical deterioration)
UTS University of Technology, Sydney

viii Observation and Response Chart Project: Pilot Phase
Chart versions
ADDS + Adult Deterioration Detection System with blood
pressure table; multi-parameter trigger / four-
response level, with calculation of score from
Systolic Blood Pressure (SBP) value
ADDS – Adult Deterioration Detection System without blood
pressure table; multi-parameter scoring / four-
response level – no scoring of SBP value
R1 Single response level with single-parameter trigger
R2 Two response level with single-parameter trigger
R4 Four response level with single-parameter trigger

Observation and Response Chart Project: Pilot Phase ix
Executive Summary
This report details the second of a two-phase project funded by the Australian
Commission on Safety and Quality in Health Care through their ‘Recognising and
responding to clinical deterioration’ Program.
Study description
A before-after design with a multi-method data collection approach was used to
evaluate implementation, clinical utility and user acceptance. Three of the
Commission’s Observation and Response Chart (ORC) templates for use with adult
general medical-surgical patients were implemented and evaluated in nine clinical sites.
The two-level response ORC was selected in six, while the four-level response ORC
and the Adult Deterioration Detection System (ADDS) version (without systolic blood
pressure table) were selected in one site each. Participating sites spanned five
jurisdictions, and both public and private hospitals, with different levels of service and
size, ranging from small rural facilities, to metropolitan and tertiary-level hospitals.
Orientation, training and ongoing support for clinical staff on the introduction and use of
the ORCs was provided by on-site project officers seconded from the local
organisation’s staff. An executive staff member was engaged as a ‘champion’ for chart
implementation at each clinical site to enable optimal communication and engagement
with all relevant clinical staff. ORC templates were modified for local site needs to
reflect local rapid response system criteria and notification processes. Six sites
executed an organisation-wide implementation of the ORC, while the remaining three
trialed the charts in 3-4 of their wards.
Study findings
Across the sites, 1,058 patient records were audited during retrospective and
prospective periods, including 9,920 sets of vital signs. Feedback on clinical utility from
staff involved 218 participants in 44 focus groups. Site-based Project Officers performed
88 periods of observations when staff were using and documenting in the ORCs.
Findings for the five study objectives from the Commission are noted below. Rate of
completion of the chart, in relation to vital signs documentation, noted that 75% of
records had complete recordings. Improved compliance ranged from 4-14% across
parameters when the ORC was in use. Compliance with graphing section requirements
was generally high, ranging from 68-100%. Countering this was the use of written

x Observation and Response Chart Project: Pilot Phase
numbers in the graphing section, contrary to human factors principles and ORC
guidelines, in 60% of audited forms, increasing the risk of failure to detect patient
deterioration. There was also sub-optimal use of the additional features of the chart (6-
53%) designed to improve detection of deterioration, response actions and
communication and lack of engagement and understanding by medical staff. The
required frequency of observations was documented in 75% of cases, with the most
common frequencies (four times per day and fourth hourly) accounting for two-thirds of
the records. Actual frequency approximated three times per day based on audit
findings.
Rate of recognition of abnormality in clinical observations was slightly higher when the
ORC was in use - 8% versus 9% for blood pressure and 5% versus 8% for oxygen
saturation respectively. Incidences of respiratory rate abnormalities were much lower –
around 2% for both audit periods. Actions based on documented abnormal vital signs
varied across the chart versions. Of note, for ‘clinical review’ in the R2 the frequencies
of action for oxygen saturation were twice as high when the ORC was in use. For the
R4 chart ‘increased surveillance’ for respiratory rate and systolic blood pressure were
also twice as high when the ORC was in use. There were also significantly more
‘increased surveillance’ and ‘senior nurse review’ actions for heart rate with the ORC.
No differences were evident with the ADDS- chart. These findings may indicate an
important feature of the single-parameter ORCs, early identification with focused
surveillance or review actions preceding further deterioration and an impending MET
call.
Documentation of calling for assistance and response obtained were minimal, with an
action documented in only 12% of case when an abnormal vital sign was identified. For
a significant sign of clinical deterioration requiring a MET call, actual initiation occurred
in only 33% of cases in the retrospective period. This improved to 41% when the ORC
was in use. From the documentation it was noted that clinicians responded to abnormal
vital signs by using the modifications section or documenting ‘not for resuscitation’
reactively not proactively; information in the progress notes did not match the identified
abnormal vital signs on the ORC; and the decision to activate a MET call or request for
clinical review was based on individual clinical judgement, not the ORC
recommendations which reflected actual local rapid response system policy. Actual
emergency call rates equated to 4.9 and 5.5 per 1,000 bed days respectively. Based

Observation and Response Chart Project: Pilot Phase xi
on the ORC guidelines, the required MET call rates could have been 14.8 and 13.6 per
1,000 bed days respectively.
A range of issues emerged from preferences and comments of clinical staff, providing
some contextual understanding for the clinical utility of the ORCs, and the challenges
encountered by nursing staff in particular when attempting to use these new charts in
an existing practice culture. These included compliance, documentation practices,
multidisciplinary communication, interdisciplinary practices, and tensions related to
clinical decision-making, and ultimately uncovered a range of beliefs and views that
hindered optimal use of the ORC framework. Of note particularly was the perceived
and practical lack of precision when using ranges in the graphing section; and handling
the A3 size, double sided format.
For patient outcomes, there were no differences in rapid response system call rates or
outcomes with the introduction of the ORC, although there were limitations with the
routinely collected data for a number of sites. There were 294 and 314 emergency calls
per month for the retrospective and prospective periods respectively. No event rates
could be calculated from the available data. Actual cardiac arrests were 3% of all
emergency calls, with 15% of calls resulting in an unplanned ICU admission. Calls
during out of hours occurred in 40% and 31% respectively.
Recommendations to the Commission
Our recommendations include: advising health care organisations on documenting the
required frequency of patient observations; adding a required frequency of observations
area to the ORC templates; revising the graphing section to improve the precision of
ranges for vital sign parameters; consider the development of chart inserts to capture all
relevant specialty observations in a single observation chart; development and
dissemination of specific educational resources to enable optimal utility and adoption of
the ORC framework and forms; promote these resources to all clinical disciplines in the
health care sector; promote these resources to education and training providers; and
explore opportunities for electronic versions of the ORC to link with developing clinical
information systems and electronic health records.
Recommendations to health care organisations
Our recommendations are to: develop or revise vital sign and escalation policies,
highlighting minimum standards of practice and required frequencies of vital signs
observations; maintain the integrity of the ORC design characteristics, when local
xii Observation and Response Chart Project: Pilot Phase
modifications are inevitably implemented; continue to evaluate that escalation of care
and appropriate responses are triggered when vital sign abnormalities are identified;
review data collection and evaluation of local rapid response systems to reflect best
practice; ensure full engagement, education and inter-disciplinary communication for all
relevant disciplines when implementing an ORC practice framework and form to enable
optimal and successful adoption; examine resource implications for using an A3 double-
sided colours-specific observation chart which has high usage and handling; consider
how to implement a complex practice change such as the ORC within their work
cultures; provide initial and clinical training for all staff; provide additional training and
support to improve the clinical utility of all sections of the ORC; include documentation
of frequency of observations in routine practice audits; and audit the compliance of
complete sets of vital signs.
Conclusions
This study demonstrated both positive findings and some limitations in relation to
clinical utility and user acceptance of the ORC templates when trialed in adult general
medical-surgical wards. The ORC forms were not used to their optimal functioning for a
range of reasons including different design characteristics compared to existing charts,
precision in charting vital signs values, tensions in clinical decision-making when an
abnormal vital signs was identified, and lack of engagement by medical staff.
We believe this study report provides sufficient information to inform the effective
implementation and evaluation of the adult general medical-surgical Observation and
Response Chart into routine practice in a wide range of health care settings – public
and private; rural to tertiary - across Australian jurisdictions.
Our recommendations involve modifications to the chart template for common sections
of all versions; development and use of specific information and training packages; full
engagement by all clinical staff. Based on our findings, implementation will require a
change management approach to address influencing factors such as workplace
culture(s); inter-disciplinary communication and co-practices; clinical decision-making;
documentation practices; vital sign observation standards and practices; and
understanding of and compliance with the human factors ORC design characteristics.
Observation and Response Chart Project: Pilot Phase xiii
These recommendations to the Commission and health care organisations, listed
below, will potentially improve the clinical utility and user acceptance of the charts as an
important aid in clinical decision-making when managing adult medical surgical patients
with identified abnormal vital signs that are at risk of clinical deterioration. Our
recommendations for further research are to explore the cultural issues that influences
practices in recognising and responding to the unmet identification of abnormal vital
signs, and to examine the actual performance of vital signs measurements for accuracy
and consistency.

xiv Observation and Response Chart Project: Pilot Phase
Summary of Recommendations
Recommendations to the Commission
Provide advice to organisations on a location(s) in the patient’s documentation
where the frequency of observation is to be recorded.
Include the required frequency of observations as a section of the ORC templates.
Revise the graphing section of the ORC to improve the precision in the ranges of
the vital sign parameters. There is also an opportunity to document the actual
abnormal parameter value in the ‘interventions’ section of the ORC, along with any
clinical action.
Develop form ‘inserts’ to enable all relevant specialty observations to be included
on the one ORC, rather than the continuation of multiple observation forms. (1:
‘Measurement and documentation of observations’)
Develop and disseminate explicit educational resources, based on the human
factors principles of the chart design, to guide graphing practices (location of dots
in the centre of the graphing area, use of lines to connect the dots, and use of
arrows and connecting lines for blood pressure documentation). Information
should also focus on eliminating or minimising the practice of writing numerical
values in the graphing section of the chart. These resources should identify the
human factors principles that guide these instructions, and provide a clear
rationale from a patient safety and quality of care perspective.
Promote and disseminate these resources to all clinical disciplines, specifically
medicine at all levels in clinical departments and health care organisations, to
enable optimal engagement and understanding. Appropriate engagement by
medical clinicians would improve communication and team processes with their
nurse colleagues.
Promote these resources to education and training providers, so that students
across all health disciplines have the background knowledge and understanding of
safety science and human factors principles, the application of this knowledge in
the form of the ORC templates, and the understanding and skills to promote
recognition and rapid response systems processes in clinical practice. (6:
‘Education’)
Consider opportunities for developing, implementing and evaluating electronic
versions of the ORC. With the continued development of clinical information

Observation and Response Chart Project: Pilot Phase xv
systems and electronic health records, automated measurement devices in
general ward areas,1 and the future opportunities that handheld devices hold in
clinical practice, automated measurement and documentation with auto-alerts to
staff for abnormal vital signs are distinctly possible. (8: ‘Technological systems and
solutions’)
Recommendations to Health care organisations
Develop / revise local policies on vital sign observations and / or care escalation,
highlighting minimum standards of practice and including frequencies required.
Maintenance of the integrity of the ORC design characteristics will be important
when modifying charts for local use, by adhering to chart developer guidelines and
accessing human factors expertise. (1: ‘Measurement and documentation of
observations’)
Continue to evaluate whether appropriate responses were triggered according to
the ORC recommendations (which were aligned to their local RRS policies), when
a vital sign abnormality was identified. Given the findings presented here, it is clear
that escalation of care does not always eventuate despite signs of clinical
deterioration, sometimes on multiple occasions. (2: ‘Escalation of care’)
Consider the data collection and evaluation processes of their local RRS system,
given the variation in scope and quality of available data noted from study sites. (3:
‘Rapid response systems)
If implementing an ORC-type framework and form facility-wide, ensure full
engagement by all relevant health disciplines. In particular, medical staff at all
levels need to be informed about their role, and committed to their responsibilities
and accountability for effective implementation of the ORC. Inter-disciplinary
communication is essential for the ORC to be successfully adopted into practice.
At the core of this communication is the professional and workplace culture(s) at
all levels of the organisation. (4: ‘Clinical communication’)
Account for increased costs associated with using an A3 double-sided colours-
specific observation chart that has high usage and handling
Consider how to implement the complex practice and cultural changes associated
with the implementation of a clinical initiative such as the ORC, within the context
of their local workplace culture(s). (5: ‘Organisational supports)
Provide relevant initial and continuing training for all clinical staff, based on
resources available from the Commission, and tailored to meet their local needs

xvi Observation and Response Chart Project: Pilot Phase
and context. Application of the ORC is essential to include in clinical deterioration
education packages, including how the chart is implemented in routine practice, as
well as in escalation of care.
Additional training and support is required to improve the clinical utility of other
sections of the ORC template (‘Other Observation Chart in Use’, ‘Modifications’,
‘Interventions Associated with Abnormal Vital Signs’, ‘Clinical Review Requested’,
‘Additional Observations’ sections). (6: ‘Education’)
Include ‘documentation of frequency of observations’, and compare to actual
frequency as part of routine clinical audits, with the aim of improving compliance to
this recommendation by the Commission.
Audit the compliance of complete sets of vital signs (minimum of respiratory rate,
oxygen saturation, systolic blood pressure, heart rate, level of consciousness and
temperature), as recommended by the Commission. (7: Evaluation, audit and
feedback)

Observation and Response Chart Project: Pilot Phase 1
Introduction
This report describes the ‘Pilot Phase’ of a two-stage project commissioned by the
Australian Commission on Safety and Quality in Health Care (ACSQHC; the
‘Commission’). It is recommended that this report be read in conjunction with the
Observation and Response Chart Usability Testing Report,2 available from the
Commission’s website.
As a component of the Commission’s program on ‘Recognising and responding to
clinical deterioration’, a suite of observation and response charts (ORCs) were designed
for use as general observation charts in adult medical / surgical wards of acute care
facilities. Following usability testing of the five ORC templates, chart structure and
design characteristics were reviewed by representatives from the ACSQHC, University
of Technology Sydney (UTS), and the School of Psychology at the University of
Queensland. After discussion of the study findings, revisions were made to the chart
templates that incorporated clinical user feedback while maintaining key human factors
principles.
A summary of the resulting human factors and user information / education issues are
listed in Appendix A, and the revised ORC templates are illustrated in Appendix B.
For further information about the ORC project and current versions of revised templates
visit: www.safetyandquality.gov.au
Background
In attempts to improve timeliness and effectiveness of responses, and reduce serious
adverse events, systems for responding to clinical deterioration of patients in general
wards of acute care hospitals have evolved from 'cardiac arrest' teams to 'medical
emergency teams' (METs). In-hospital mortality rates approximate 80% for cardiac
arrests, 25% for MET calls, and 15% for patients with abnormal vital signs.3
Paper-based observation charts remain the dominant approach for documenting clinical
observations of adult patients in acute general wards of Australian hospitals. With
failure to recognise and respond to signs of clinical deterioration evident,4 development
and evaluation of charts has become a focus of recent work.e.g.5 Earlier projects in the
Commission’s program of work on clinical deterioration focused on chart design
Observation and Response Chart Project: Pilot Phase 2
characteristics including a survey of preferences from clinical staff,6 and a simulated
practice study.7
The online survey examined the preferences of 347 clinical staff (92% nurses; two-
thirds in manager, educator or consultant roles) in relation to the design characteristics
of nine observation charts.6 Two-thirds of respondents used observation charts on a
daily basis. The charts differed across a range of characteristics, including page size,
graphical or numerical recording of physiological parameters, single or multiple
parameter triggers, separate axes for each parameter, integration of colour coding to
signal the level of abnormality and required response, and inclusion of a summed score.
No significant differences were evident between respondents' preferences for their
current observation chart compared to the alternative chart they evaluated. Respondent
preferences aligned with human factors principles for plotting values on graphs with
graded colouring and links to a response system (43%). Chart versions with numerical
recording were less favoured. Conversely, respondents preferred plotting heart rate
and blood pressure on the same axis, despite recent evidence that overlapping plots
increase error rates and response times. Separate axes are particularly required when
a single-parameter response system is in use, to minimise the risk of failure to detect
abnormality.7 This lack of agreement may indicate that any implementation of a new
chart and system requires a considered communication and training approach that also
considers cultural practices.6
Results of the survey and best features of existing charts were then combined with
human factors design knowledge to develop the Adult Deterioration Detection System
(ADDS) chart for subsequent testing. In the related simulated-practice study, 45
clinicians and 46 volunteers examined correct interpretation and response times for six
different designs of observation chart, including the newly developed ADDS chart.7
Error rates for the 24 doctors and 21 nurses were similar and ranged from 13-38%, with
the ADDS charts demonstrating the best performance. Single parameter ORCs were
subsequently developed by the Commission using the human factors design principles
that guided the development of the ADDS charts.
This project proceeded from the above recent work, to examine whether these
specifically designed charts with ‘track and trigger’ response features have utility in
actual clinical practice.
Observation and Response Chart Project: Pilot Phase 3
Study aim and objectives
The overall study aim was to collect original data in a clinical context, examining the
implementation and performance of a site-selected ORC in adult general medical-
surgical wards across a whole facility.
The specific study objectives of this phase were to examine the:
1. Rate of completion of the chart
2. Rate of recognition of abnormality (in clinical observations)
3. Rate of calling for assistance where indicated, and the response obtained
4. Preferences and comments of clinical staff
5. Patient outcomes.

Observation and Response Chart Project: Pilot Phase 4
Methods
Design
This before-after study used a mixed methods approach to optimise the quantity and
quality of data collected. The implementation and performance of each site’s chosen
ORC was examined and explored using data from retrospective and prospective audits;
user focus groups; observational field notes; and patient outcome data (routinely
collected at each site).
Sample
Site selection
Invitations to participate in the Pilot Phase were sent to the ten sites involved in the
Usability Testing Phase (UTP). Nine sites accepted, while one site declined involvement
in favour of continuing with their current track and trigger chart that was developed and
implemented in their State jurisdiction (not one of the ORC versions developed by the
Commission).
ORC version selection
Each pilot site selected an ORC template that best aligned with their current rapid
response system for managing clinical deterioration of adult acute-care patients. It was
not an aim of this project to recommend a preferred ORC template for use in clinical
practice. Sites were also not obliged to continue with the ORC version that they tested
in the UTP. Selected charts are noted in Table 1 describes the selected chart type and
the extent of implementation for each site.
Three of the five available ORC versions were selected across the nine sites:
Seven sites selected the R2 version (single-parameter trigger / two-response
level – ‘clinical review’ or ‘emergency call’)
One site selected the R4 version (single-parameter trigger / four-response level –
‘increased surveillance’, ‘senior nurse review’, ‘clinical review’ or ‘emergency
call’)
One site selected the ADDS- version (multi-parameter scoring / four-response
level)

Observation and Response Chart Project: Pilot Phase 5
Table 1 Hospital type, selected ORC version and extent of implementation
Hospital Type ORC version
R4 R2 ADDS -BP
Tertiary / Metropolitan Site D
(4 wards)
Site E
(Hospital-wide)
Site F
(AHS-wide)
Site H
(4 wards)
Regional Site I
(Hospital-wide)
Rural Site B
(AHS-wide)
Private Site C
(Hospital-wide)
Site G
(Hospital-wide)
Site A
(3 wards)
Notes: AHS Area Health Service
Of the nine sites, six conducted an organisation-wide implementation, while the
remaining three trialed the ORCs in 3-4 wards. No sites selected the R1 (single-level
response chart – ‘Emergency call’ only) or the ADDS+ (multi-parameter trigger with
calculation of score from Systolic Blood Pressure value). See our Usability Testing
report for further details of these chart versions.
Modification of ORC template
The ‘Developer’s guide for observation and response charts’ 8 was provided to all sites
to enable identification of any potentially harmless modifications that could be applied to
their selected ORC, to align with local systems and policies. Sites adjusted the calling
criteria on each chart to match their existing escalation protocol. Appendix C illustrates
the modifications made to the calling criteria and related parameter values in the
graphing area for each site.
Extent of ORC implementation
Site executives provided a letter of support indicating the level of ORC implementation
planned for their site. Any extra staff resources, beyond our site-based project officer
funding, was determined by local site executives when charts were introduced to the
entire organisation. The ORCs were implemented across two area or district health

Observation and Response Chart Project: Pilot Phase 6
services and hospital-wide in four sites. The remaining three implemented the charts in
selected trial wards only. The six sites that implemented the charts across a whole
hospital or service intended to continue to use the ORC in routine practice after
completion of data collection (sites B, C, E, F, G, I; see Table 1).
Site-based Project Officer secondment
A Project Officer from each clinical site was seconded for the duration of site-based
activities, as in the UTP. This allowed facilitation and successful implementation of the
ORC into clinical practice at a site-level by an experienced Registered Nurse who was
familiar with local policy, practices and nuances, and held an established rapport with
key stakeholders and other hospital staff.
Project Officer responsibilities included:
Leading and facilitating the implementation of the selected ORC according to the
site plan
Liaison and collaboration with ward staff, hospital executives, committees and other
key stakeholders
Provision of relevant information and education to all hospital staff and participating
wards
Collection and submission of data within required timelines to the UTS research
team.
Project officer training
Five of the nine project officers recruited were previously seconded to the role in the
UTP, while four were new to the project. A one-day preparatory workshop was
sponsored by the Commission and facilitated by the ORC Project Director and Project
Manager at UTS. The training day allowed extensive discussion of the UTP findings,
introduction to the Project Officer role for the Pilot, and enabled practical application of
data collection approaches using clinical scenarios. Ongoing support was provided by
e-mail and telephone prior to commencing the pilot phase.
Clinical site preparation
A 26-page ‘Pilot Plan’ was distributed to all site-based project officers and site
executives providing details of the different study stages, as well as guidelines, tools for
data collection, participant information and consent form templates, and other resources
for the site-based Project Officer.
Observation and Response Chart Project: Pilot Phase 7
Clinical staff preparation
The initial intent of the Commission was to introduce the ORCs with minimal training to
explore the ‘usability’ of the ORCs for clinical staff. However, results from the participant
user survey overwhelmingly indicated that 98% of respondents found education prior to
the use of the ORC helpful. Based on these findings, educational resources such as
posters and information sheets were developed for Project Officers to provide to clinical
staff. These contained relevant information on ‘how to use’ the ORC (see Appendix D
and E for examples). Separate posters and information sheets were developed for each
version of ORC. A frequently asked questions (FAQ) sheet was also developed (see
Appendix F).
Extensive in-service education sessions were provided by Project Officers prior to
implementation of the ORC, as well as one to one support in clinical areas during the
pilot phase. Nursing staff were predominantly involved in these educations sessions, as
access to medical education time was not available at most sites. Education for doctors
occurred primarily at the patient bedside, during ward round or in general ward
discussions.
Implementation and Data Collection Timeline
Preparation for ORC implementation and data collection at each site included a range
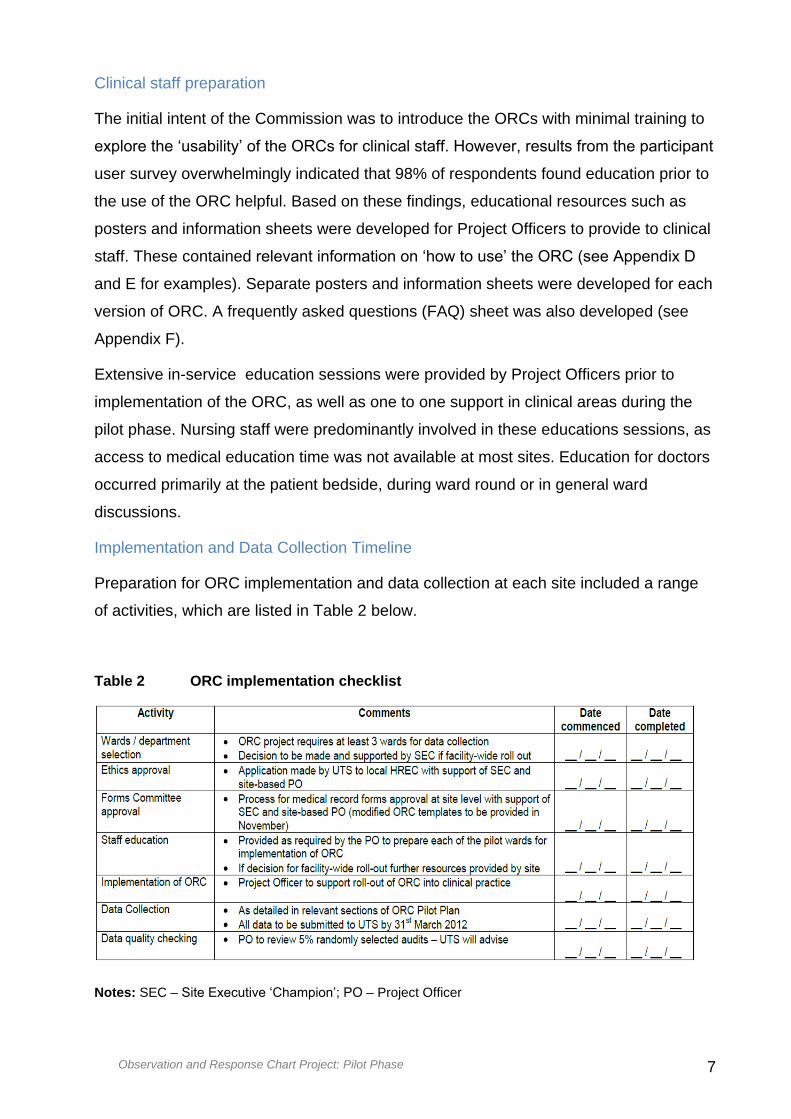
of activities, which are listed in Table 2 below.
Table 2 ORC implementation checklist
Notes: SEC – Site Executive ‘Champion’; PO – Project Officer

Observation and Response Chart Project: Pilot Phase 8
Of particular importance was approval of the ORC ‘form’ for use as an official document
in the sites’ medical records, and Human Research Ethics Committee (HREC) approval
for the study.
The timeline and Project Officer activities related to ORC implementation and data
collection are outlined in Table 3.
Table 3 Site activity timeline
Project Officers (POs) were seconded and funded for a total of 50 days over a period of
four months to implement the charts and collect both retrospective and prospective data
in at least three wards for data collection. In practice, some weeks required only 1-2
days, while the retrospective (November) and prospective (February) data collection
periods required two weeks of full-time involvement.

Observation and Response Chart Project: Pilot Phase 9
Data collection
A range of data collection techniques were used to address the study objectives:
Retrospective audit of data from current hospital systems
Prospective auditing of data following implementation of the selected ORC
User focus groups
Observational field notes
Patient outcome data from routinely collected organisational data sources.
After education and implementation of the ORCs in each site, clinical staff used the
charts routinely for observations for a minimum of three weeks, prior to data collection.
Retrospective and prospective audits
For the two audits, a 72-hour admission period was selected, in February 2011
(retrospective) and February 2012 (prospective). Sixty admission episodes were
audited at each participating site. Sunday, Monday and Tuesday were chosen as the
audit period to include data related to activity occurring ‘out of hours.’
For the retrospective audit, observation charts in use prior to the implementation of the
ORC were examined for rate of completion; rate of recognition of abnormal clinical
parameters; and rate of triggered responses to a clinical deterioration. Abnormal clinical
parameters were identified using triggers from the site-selected ORC. Data collection
also included hospital length of stay, location of discharge or transfer at end of
admission, resuscitation status, and admission outcome.
During the prospective audit, the recently implemented ORCs were audited for the
same data as the retrospective audits, as well as extra items that allowed for
comparison with UTP data of completion compliance according to the ORCs general
instructions. An example of the prospective audit form is shown in Appendix G. The first
page was the same for both retrospective and prospective audits and the second page
was used only during the prospective audit.
Focus groups
After ORC implementation and a period of routine use, Project Officers conducted short
semi-structured focus group interviews with clinical staff. Participant consent was
Observation and Response Chart Project: Pilot Phase 10
provided prior to data collection, and the focus groups were audio-recorded for
transcription of de-identified verbatim comments. Focus groups were scheduled during
shift overlap, staff development sessions, and education forums with the aim of
capturing the views of as many staff comments as possible. Sample questions were
provided to each site project officer (see Appendix H).
Observations of documentation practice
Field observations were conducted by the site-based project officers at negotiated times
with each clinical area piloting the ORC for a recommended minimum of six observation
sessions per selected ward over at least 1-2 hours duration during the prospective data
collection period. Observation sessions ranged across different shifts on different days,
to enable observation of activities related to use of the ORC in routine observation
practices. Guidelines and a template for field notes supported project officers
observation of practices (Appendix I).
Ward staff were informed that observations related to ORC usage would occur using
normal communication processes and visible placement of ward posters (Appendix J).
Individual staff members were able to refuse participation during the observation
periods, by negotiation with the ward manager. Project officer interaction was possible
with clinical staff during the observation period to either clarify or ask a question.
Patient outcome data
To minimise data collection burden, patient outcome data were collected from routinely
collected organisation-wide data systems for adverse events such as MET/arrest calls,
unexpected ICU admissions and deaths and length of stay. These data were collected
for the months of the retrospective (February 2011) and prospective (February 2012)
audit periods. An annual summary for 2011 was also obtained when available from
sites.
Data management and analyses
All site data were sent to UTS for management and analyses. Audit data were entered
into Microsoft Excel, then cleaned and coded for analysis in SPSS (version 19). Patient

Observation and Response Chart Project: Pilot Phase 11
outcome data were sent in original form from the sites, and then re-formatted and coded
in Microsoft Excel. Focus groups were audio recorded and sounds files were sent to
UTS for transcription. Project officer field notes were typed up as Microsoft Word
documents and sent to UTS.
For quantitative data, frequencies were examined for distribution. Descriptive statistics
were used to examine all data. For non-normal distributions of continuous data,
medians and interquartile ranges (IQR) were used. Proportions and frequencies were
used to present categorical data.
Qualitative data were entered into NVivo 9 and analysed for descriptive content and
emerging themes.
Ethical considerations
A National Ethics Application Form (NEAF) was initially submitted to one selected lead
site. Once HREC approval was confirmed, applications were submitted to the ethics
committees all other participating sites as required by the relevant jurisdiction for each
participating site.
Clinical staff participants provided informed consent for the focus groups, and
observation periods by the project officer, using the provided Participant Information
Sheet and Consent Form template (see Appendix K). Confidentially of participant
identity was assured. All data were stored as per National Health and Medical Research
Council guidelines.9

Observation and Response Chart Project: Pilot Phase 12
Results
This chapter reports collated findings from the nine clinical sites involved in pilot
implementation and evaluation of the selected ORC. Demographic details are
presented initially in relation to each of the data collection techniques: the retrospective
and prospective audits; focus groups; observation and field notes; and patient outcome
data.
Data are then combined to present findings for each study objective, examining the:
1. Rate of completion of the chart
2. Rate of recognition of abnormality (in clinical observations)
3. Rate of calling for assistance where indicated, and the response obtained
4. Preferences and comments of clinical staff
5. Patient outcomes (where available as routine data from sites).
Demographics
Audits - retrospective and prospective
The two audit periods were 13th February to 15th February 2011 (retrospective) and 14th
February to 16th February 2012 (prospective). A total of 1058 records were audited –
522 and 536 for the two periods, respectively. This reflected 9920 sets of vital signs
(4896 retrospective, 5024 prospective). Table 4 illustrates the number of charts audited
for each of the three ORC versions. Note the differences in sample sizes across the
versions, ranging from the ADDS- chart used in three wards in one site, through to six
sites for the R2 chart (see Table 1 previously for further detail).
Table 4 Number of observation charts audited bychart type and audit period
Chart type ADDS- R4 R2 Total audits
Retrospective a 60 99 363 522
Prospective 60 116 360 536
Total charts 120 215 723 1058
Notes a site routine observation charts were audited according to their rapid response system and
selected ORC version

Observation and Response Chart Project: Pilot Phase 13
Focus groups
Eight of the nine clinical sites participated with focus group feedback. Overall, data were
available from 44 groups, involving 218 clinical nurse participants. Table 5 illustrates the
number of groups and participants per site.
Table 5 Focus groups by clinical site
Site ORC Number of Number of participants
version focus groups Total Median (range)
A ADDS- 9 26 2 (1-8)
B R4 10 * 33 3 (1-6)
D R2 5 35 7 (6-9)
E R2 3 16 5 (4-7)
F R2 4 22 5 (4-7)
G R2 6 34 6 (4-7)
H R2 8 38 4 (2-9)
I R2 4 16 4 (4-4)
Notes: * 2 additional groups had poor sound quality and were not included
Observation and field notes
Across the nine sites, Project Officers performed 88 periods of field observations of
practice, across all times of the day, including on the evening and night shifts. Periods
of field observation ranged from 1-8 hours. Table 6 lists the number of observation
periods per site. Sites with the smallest number of observation periods (e.g. F and G)
conducted observation periods of 6-8 hours.

Observation and Response Chart Project: Pilot Phase 14
Table 6 Number of field observations of ORC documentation practices by clinical site
Site A B C D E F G H I
Number of observation
periods
6 18 6 12 18 4 3 8 13
Patient outcome data
Where available, data routinely collected from each of the sites, recorded and used for
their own local purposes was used to examine patient outcomes. Our aim was to
examine the number of adverse events to detect any differences in the proportion of
events including transfers to ICU during the ‘before’ and ‘after’ time periods. Collation
and interpretation of these data was challenging, as individual sites collected
information on MET and arrest calls in different ways, and with varying levels of detail.

Observation and Response Chart Project: Pilot Phase 15
Objective 1. Rate of completion of chart
The National Consensus Statement10 recommends six core observations identified as
essential for the recognition of clinical deterioration: respiratory rate, oxygen saturation,
blood pressure, heart rate, temperature and level of consciousness. The Statement also
recommends that the appropriate frequency of observations be documented for each
patient (p. 29). Only one site provided any local policy on vital signs or care escalation
on request; there was no description for minimum standards of vital sign monitoring
practices within the policy.
Each admission episode was therefore audited for documentation of the patients
required vital sign frequency. Over one-quarter (27%; n=291) of patient episodes did not
have the required vital sign frequency documented in either a care plan or medical
record. For the 73% (767) that did, Figure 1 illustrates that four times daily (q.i.d.) was
the most commonly documented frequency for vital sign measurements in this sample
of adult general medical-surgical patients. When combined with the 4th hourly
frequency, this accounts for 60% of all observations of patient vital signs.
Figure 1 Documented frequency for measurement of patient vital signs
The location of this documentation varied between sites – 45% were in patient care
plans (n = 479), with a small number (n = 18) dual-documented in the medical records
or other location. Documentation on a clinical pathway was next most common (n =
234), followed by observations charts (n = 42), operation reports (n = 10), with the
remaining in more than one location, on patient journey boards or ‘other’ locations.
46%
14%
13%
11%
7%
5%
3% 1% Four times daily
Six times daily
Three times daily
Twice daily
Routine post anaesthesia observations
Daily
Once per shift
Hourly
Observation and Response Chart Project: Pilot Phase 16
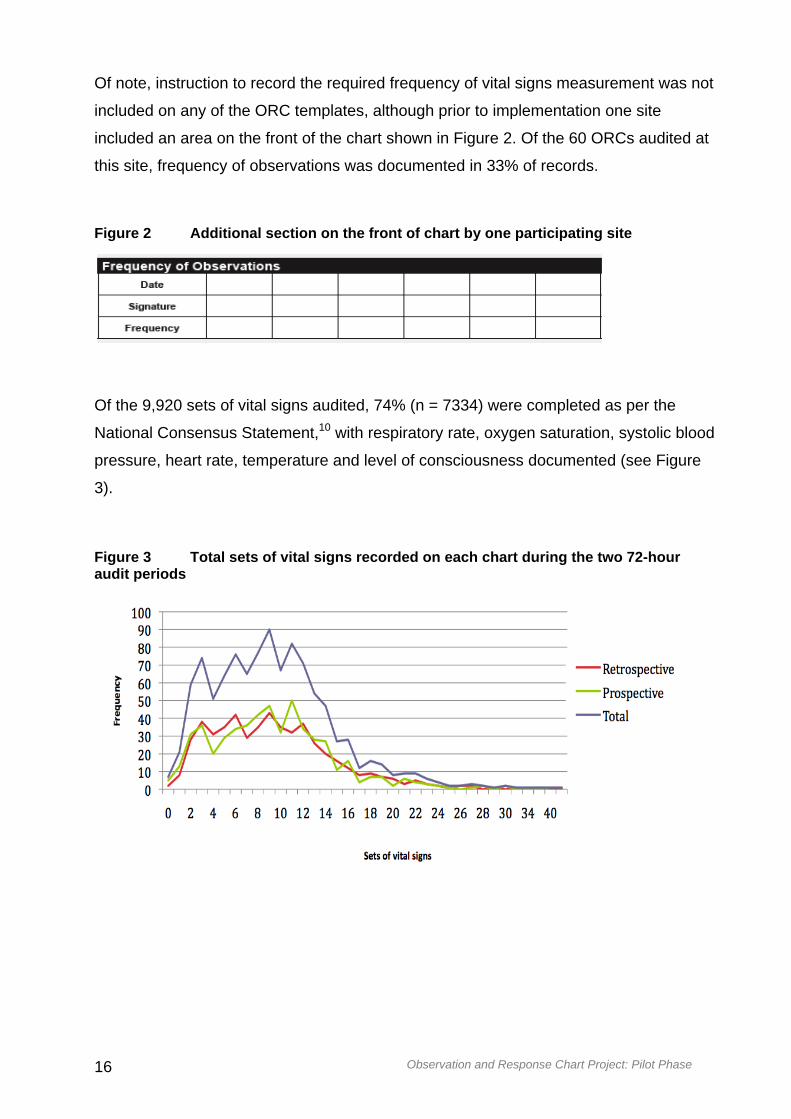
Of note, instruction to record the required frequency of vital signs measurement was not
included on any of the ORC templates, although prior to implementation one site
included an area on the front of the chart shown in Figure 2. Of the 60 ORCs audited at
this site, frequency of observations was documented in 33% of records.
Figure 2 Additional section on the front of chart by one participating site
Of the 9,920 sets of vital signs audited, 74% (n = 7334) were completed as per the
National Consensus Statement,10 with respiratory rate, oxygen saturation, systolic blood
pressure, heart rate, temperature and level of consciousness documented (see Figure
3).
Figure 3 Total sets of vital signs recorded on each chart during the two 72-hour audit periods

Observation and Response Chart Project: Pilot Phase 17
The median frequency of observations recorded during the 72-hour audit period was 9
(IQR = 5-12, range 0-54), approximating three times a day (TDS). This was consistent
across both retrospective and prospective audits. This actual frequency was less than
the required frequency in patients’ documentation. As noted earlier in Figure 1, 60% of
patients were to have observations measured at least four times per day. Note that
some patients may have been admitted and discharged during the 72-hour audit period
so may not have had consistent vital signs recorded over this time.
There was an overall improvement in chart completion for each of the parameters in the
prospective audit period (see Figure 4). Documentation for respiratory rate improved by
14%, oxygen saturation; heart rate and temperature by 8%; blood pressure by 7%; and
oxygen flow by 4%. While there was also a notable increase in recording urine output,
use of this section remained low.
Figure 4 Percentage of vital signs recorded by parameter
Despite education and support, staff may have been unclear how to record findings in
this section, and may have been used to documenting urine output on a separate fluid
balance chart. The significant increases noted for consciousness and pain score
parameters were likely because previous observation charts did not include these two
parameters. However, the high level of documentation for these parameters in the
prospective audit (87% and 59% of cases respectively) reflects high clinical acceptance
and utility for these features of the ORC, and promotes a safety culture approach to
holistic patient assessment.

Observation and Response Chart Project: Pilot Phase 18
Table 7 illustrates a consistent improvement in documentation for each version of the
charts tested.
Table 7 Percentage of vital signs recorded by parameter and chart
Parameter ADDS- R4 R2
Total sets (n)
Retro
(545)
Pro
(433)
Retro
(962)
Pro
(991)
Retro
(3389)
Pro
(3600)
Respiratory rate % 90 97 72 96 88 94
Oxygen saturation % 95 97 94 96 90 94
Oxygen flow % 86 90 74 70 88 89
Systolic blood pressure % 96 100 97 100 93 95
Heart rate % 96 99 94 97 91 94
Temperature % 97 92 86 95 86 89
Consciousness % 87 19 94 29 82
Urine output % 1 69 0 15 0 3
Pain score % 7 27 41 69 38 58
Compliance with ORC documentation guidelines
For the prospective audit, compliance was examined in relation to the ORC instructions
for graphing vital signs (based on human factors principles) of:
placing dots in the centre of the graphing area
use of lines to connect dots
use of arrows for blood pressure documentation
use of connecting lines for blood pressure arrows
As noted in Table 8, compliance with use of dots was 70%, with the highest compliance
related to respiratory rate (80%), and the lowest temperature (67%). Compliance with
the use of lines connecting these dots was slightly lower than the use of dots (68%),
and was frequently incomplete or consistently applied.

Observation and Response Chart Project: Pilot Phase 19
Graphing of systolic and diastolic blood pressure values with arrows was much higher
(100%), with the use of lines connecting arrows less (92%), probably a reflection of
current routine practice for graphical documentation of blood pressure.
Table 8 Compliance with graphing of vital signs in accordance with ORC instructions during the prospective audit
Graphing requirement Median compliance (%)
Dots centre of square 70
Respiratory rate 80
Oxygen saturation 70
Heart rate 73
Temperature 67
Lines connecting dots 68
Complete compliance 7
Mixed compliance * 61
Arrows for BP graphing 100
Lines connecting arrows 92
Notes: * lines were used for some entries of vital signs, but this was not consistent or complete
Contrary to ORC guidelines, both graphed dots and written numbers were documented
in 60% of audited ORC forms during the prospective period. In 30% of cases, only
graphing was used, and in 3% only numerical values were documented.
When specific parameters were examined the highest percentages of written numbers
were for temperature (33%) and oxygen saturation (31%). This may reflect that
clinicians wanted to document these values more precisely than what the chart allowed.
Other parameters had fewer but still frequent instances of written values documented;
heart rate (22%), blood pressure (25%), and respiratory rate (10%).
Observation and Response Chart Project: Pilot Phase 20
Use of other sections on the ORC
The ‘Other Observation Chart in Use’ section was completed in only 28% of audited
charts. The ‘Modifications’ section was used only once in 6% of audited charts and
twice in only 1% of charts.
Similarly, the ‘Interventions Associated with Abnormal Vital Signs’ section was not used
in 80% of cases. One entry was documented in 11% of forms, two entries in 4%, and
three entries in 1% of forms. The ‘Clinical Review Requested’ section was also only
used in a small number of cases; once in 3% of forms and twice in 1%.
The ‘Additional Observations’ section (blood glucose level, weight, bowels, urinalysis)
was used more frequently; in 53% of audited forms. This higher level of use was
probably because recording this information is common nursing practice and is similar
to sections on routine observation charts.
Observation and Response Chart Project: Pilot Phase 21
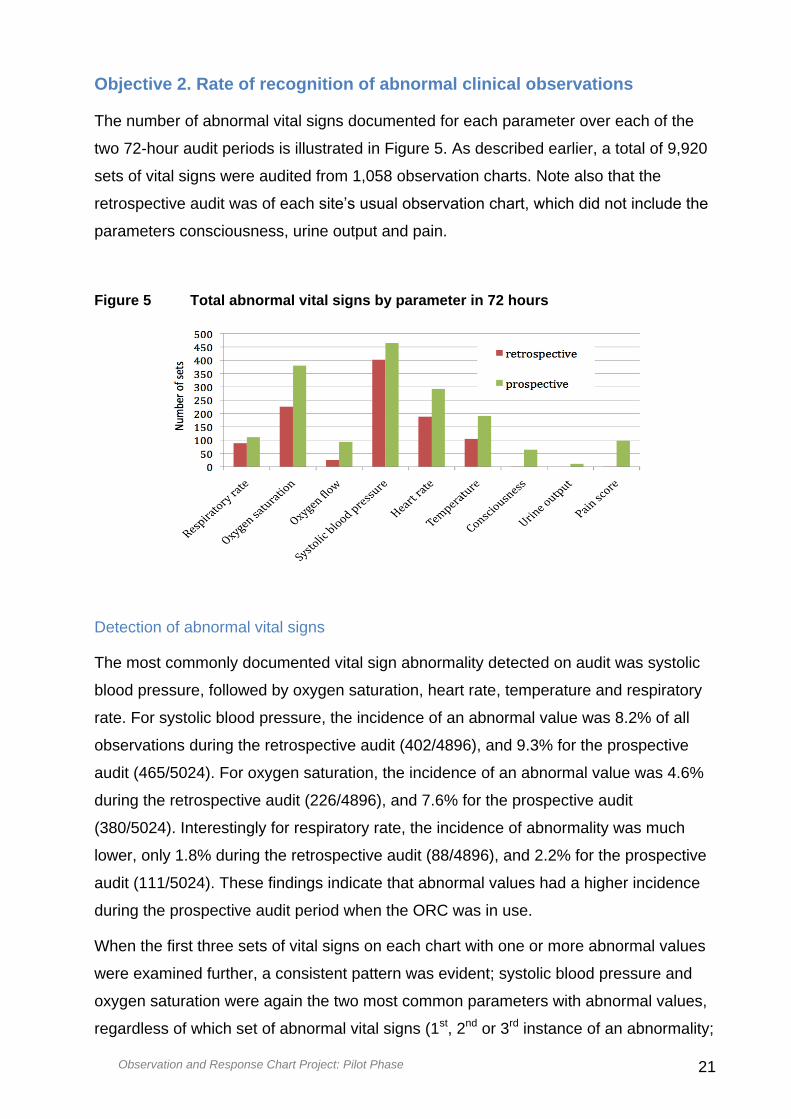
Objective 2. Rate of recognition of abnormal clinical observations
The number of abnormal vital signs documented for each parameter over each of the
two 72-hour audit periods is illustrated in Figure 5. As described earlier, a total of 9,920
sets of vital signs were audited from 1,058 observation charts. Note also that the
retrospective audit was of each site’s usual observation chart, which did not include the
parameters consciousness, urine output and pain.
Figure 5 Total abnormal vital signs by parameter in 72 hours
Detection of abnormal vital signs
The most commonly documented vital sign abnormality detected on audit was systolic
blood pressure, followed by oxygen saturation, heart rate, temperature and respiratory
rate. For systolic blood pressure, the incidence of an abnormal value was 8.2% of all
observations during the retrospective audit (402/4896), and 9.3% for the prospective
audit (465/5024). For oxygen saturation, the incidence of an abnormal value was 4.6%
during the retrospective audit (226/4896), and 7.6% for the prospective audit
(380/5024). Interestingly for respiratory rate, the incidence of abnormality was much
lower, only 1.8% during the retrospective audit (88/4896), and 2.2% for the prospective
audit (111/5024). These findings indicate that abnormal values had a higher incidence
during the prospective audit period when the ORC was in use.
When the first three sets of vital signs on each chart with one or more abnormal values
were examined further, a consistent pattern was evident; systolic blood pressure and
oxygen saturation were again the two most common parameters with abnormal values,
regardless of which set of abnormal vital signs (1st, 2nd or 3rd instance of an abnormality;

Observation and Response Chart Project: Pilot Phase 22
see Table 9). As above, an abnormal respiratory rate had a lower incidence (4% and
3% respectively for the two audits) than the other parameters.
Table 9 Abnormal vital signs by parameter, set and audit period
Vital sign set Audit 1st 2nd 3rd
period % (n) % (n) % (n)
Systolic blood pressure Retro 20 (103) 15 (77) 11 (56)
Pro 21 (110) 15 (81) 12 (63)
Oxygen saturation Retro 12 (63) 8 (42) 5 (25)
Pro 17 (91) 13 (72) 9 (50)
Heart rate Retro 9 (48) 4 (23) 3 (18)
Pro 11 (58) 9 (46) 6 (34)
Temperature Retro 9 (45) 4 (21) 2 (10)
Pro 11 (59) 8 (42) 4 (23)
Respiratory rate Retro 4 (19) 2 (11) 2 (9)
Pro 3 (15) 2 (13) 2 (12)
Notes: Retro - retrospective audit period, Pro - prospective audit period
These findings indicate that a response was not triggered when the first instance of an
abnormal vital sign was detected, and other instances of continuing abnormalities were
then subsequently noted a second and third time within a contiguous period of
observation of the patient.
The patterns of incidence for abnormal parameters across the audits varied in some
respects, depending on the ORC version used (see Table 10).
Observation and Response Chart Project: Pilot Phase 23
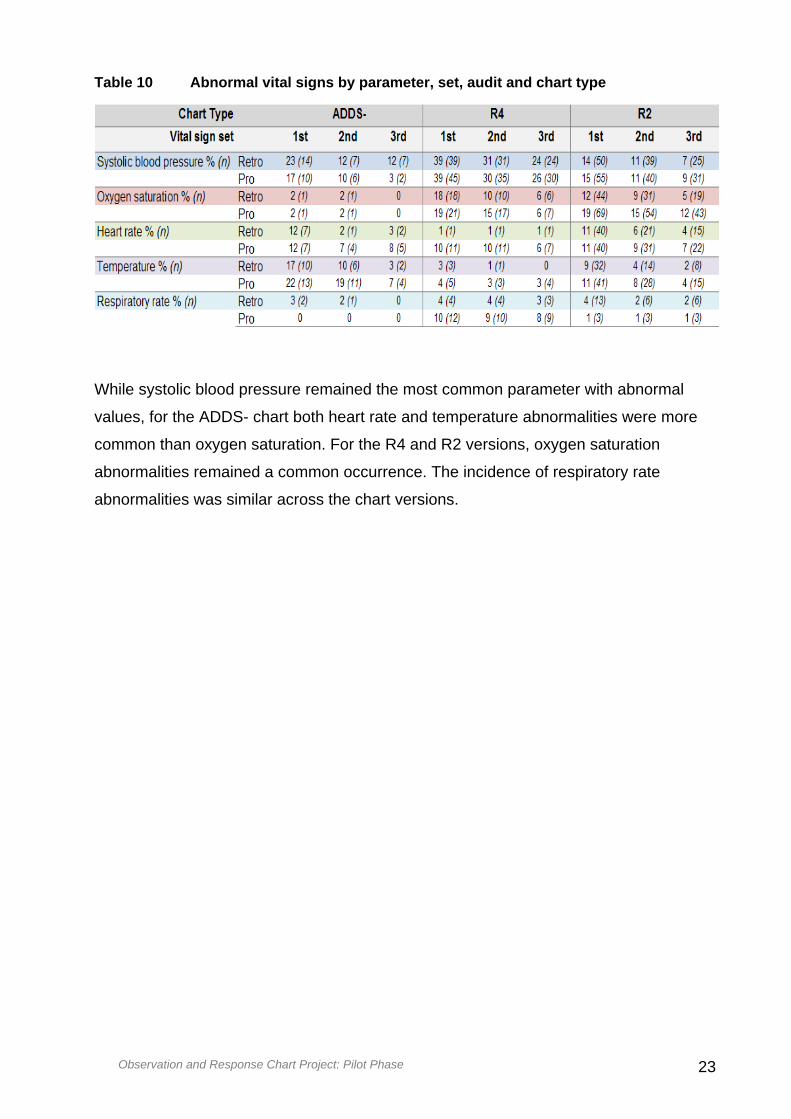
Table 10 Abnormal vital signs by parameter, set, audit and chart type
While systolic blood pressure remained the most common parameter with abnormal
values, for the ADDS- chart both heart rate and temperature abnormalities were more
common than oxygen saturation. For the R4 and R2 versions, oxygen saturation
abnormalities remained a common occurrence. The incidence of respiratory rate
abnormalities was similar across the chart versions.

Observation and Response Chart Project: Pilot Phase 24
Objective 3. Rate of calling for assistance and response obtained
The following data are based on the audit of 60 case notes per clinical site, totaling 540
records for each audit period. The following sub-sections describe required actions,
based on the ORC recommendations; actual actions taken in response to an identified
abnormal vital sign observation; and documentation related to the abnormal vital signs.
Required actions to abnormal vital signs
The instances where an action was required were reviewed for both audit periods
based on the triggers for response on the ORC used in the prospective period (see
Tables in Appendix L). Note that actual actions are described in the next sub-section.
For seven of the nine sites using the R2 version of the ORC, it was noted that the rates
of required action were similar across each of the audit periods at the first instance of
an abnormal sign. The exception was for oxygen saturation, where almost twice the
number of required actions were identified when the ORC was in use, a potentially
important benefit of the chart design and characteristics.
The instances of required actions identified when using the 4-tier ORC (from one site
only; hospital-wide implementation), abnormal values for systolic blood pressure were
most common overall. In this case, actions required were across all four levels of action,
in both the retrospective and prospective datasets. Other abnormalities were evident
again for oxygen saturations, then respiratory rate, heart rate and temperature. For
‘increased surveillance’, the prospective period demonstrated double the incidence for
respiratory rate and systolic blood pressure, and significantly more for heart rate when
compared to the retrospective period. For ‘senior nurse review’, abnormal heart rate
again demonstrated significantly more actions during the prospective period. Other
parameters were similar across the two audit periods for this action. As noted above,
the actions for ‘clinical review’ and ‘MET call’ were mixed, with no patterns evident
between the two periods.
For the ADDS- chart (from three wards in one clinical site), similar rates of action
required were noted across the two audit periods, with systolic blood pressure, heart
rate and temperature again the most common parameters identified for triggering an
action.
What was also evident overall was that abnormal values did not necessarily trigger a
response at the first instance. More importantly when values were also abnormal at
second and third instances for the same patient, a response was also not necessarily

Observation and Response Chart Project: Pilot Phase 25
triggered. That is, an appropriate action was not always triggered at the first observation
of an abnormal value, and abnormalities continued to be present with subsequent
observations.
Actual actions in response to an identified abnormal vital sign observation
Audit findings demonstrated that documentation of actual responses when made, were
mainly in the progress notes (medical records) for both audit periods (see Table 11).
When the ORC was in use in the prospective period there were increased instances of
documentation in both the progress notes and on the observation chart. This latter
finding perhaps indicated greater opportunity for documenting actions in the bedside
(ORC) charts. Some instances of dual documentation were also noted for the
prospective period.
Of most significance however were the findings of ‘no documentation’ of actions for the
vast majority of instances of abnormal vital signs. Note that these data include all levels
of expected actions available across ORC versions – ranging from increased
surveillance to MET calls.
Table 11 Location of documented comments relating to abnormal vital signs and rationale for action taken or not

Observation and Response Chart Project: Pilot Phase 26
The lack of connection between documentation of, and response to, an abnormal vital
sign is illustrated in Figure 6. The vast majority of instances of abnormal vital signs
resulted in no documented response action being taken. The first three instances of a
detected abnormal vital sign are presented. At the first set, only 12% of abnormal vital
signs resulted in a specific action during the retrospective audit period. There was no
improvement when the ORC was in use. Only slight increases in the rate of
documented action were seen in the 2nd and 3rd instances of vital sign abnormality
during the prospective period. Once again, these data include all levels of expected
actions available across ORC versions.
Figure 6 Action taken according to ORC response criteria
Of particular interest are the findings in relation to MET calls. Table 12 indicates that
there was initial evidence of clinical deterioration (1st set) that should have triggered a
MET call in 24 and 22 cases for the two audit periods respectively. An actual MET call
was initiated in only 33% of cases during the retrospective period, and in only 41% of
cases when the ORC was in use during the prospective audit. Note that instances of
missing data were evident from the documentation. Similar findings were noted for the
2nd instance of abnormal vital signs. There was approximately a 10% improvement in
MET call initiation when the ORC was in use, though the numbers are too small to have
any statistical significance.

Observation and Response Chart Project: Pilot Phase 27
Table 12 MET calls actioned according to ORC criteria in each audit period
Abnormal set 1st
set
n (%)
2nd
set
n (%)
3rd
set
n (%)
Retro Pro Retro Pro Retro Pro
MET required according
to ORC 24 22 10 19 6 15
Missing data 5 5 1 4 1 4
MET required - NOT
called % (n) 11 (46) 8 (36) 6 (60) 7 (37) 2 (33) 7 (47)
MET Required – called %
(n) 8 (33) 9 (41) 3 (30) 8 (42) 3 (50) 4 (27)
Issues related to documentation may give some insight into the potential reasons for
these findings.
Documentation related to interventions for identified abnormal vital signs
A set of recurring issues for clinicians were uncovered through further content analysis
of documentation of interventions related to identified abnormal vital signs, including:
Use of ‘modifications’ section, only after an abnormal value was recorded
Documentation of ‘not for resuscitation’ (NFR), only after clinical deterioration
was identified
Documentation in patient notes not reflecting identified abnormal observations
from the ORC
Documentation (or not) of interventions in the progress notes and / or on the
ORC
Activation (or not) of a MET call
Request (or not) for a clinical review, based on clinical judgement, not
necessarily the ORC recommendations
For the prospective audit, there was clear indication that the ‘modifications’ feature in
the charts was being used in some instances to tailor the parameter values to the
individual patient context – an actual benefit of the chart design. However, this was not
always used prospectively, but rather reactively after an abnormal value was detected

Observation and Response Chart Project: Pilot Phase 28
when a clinician did not wish to initiate a response according to the ORC
recommendations.
In a number of cases, this also prompted an NFR designation for the patient, after
clinical deterioration was identified and a response was to be triggered according to the
ORC.
The justification behind these clinical decisions and responses are explored further
when clinician views were examined in Objective 4 below.

Observation and Response Chart Project: Pilot Phase 29
Objective 4. Preferences and comments of clinical staff
Analysis of focus group transcriptions and field notes revealed a range of emergent
themes, across a continuum from assessment, to recognition and subsequent response
to clinical deterioration. A number of contextual issues also emerged that impacted on
staff actions and behaviours.
Figure 7 illustrates the major themes and contextual factors. Themes grouped
according to the temporal process of recognising and responding to abnormal vital
signs – ‘recording vital signs’, ‘detecting deterioration’, ‘responding / communicating’,
and aligned into positive (‘ORC helps’) and negative (‘ORC hinders’) vertical alignment.
Figure 7 Concept map of emergent themes from clinical staff preferences and comments
Themes within and between these temporal groups were often inter-related, and this is
illustrated in some way with the inter-connecting lines between themes in the above
Figure. The most common and instructive themes are discussed below for the purposes
of this report, but not all elements will be elaborated here. The links between themes
Observation and Response Chart Project: Pilot Phase 30
and across temporal areas are reflected in the content when different quotes align with
separate sub-themes.
Recording vital signs
The recording vital signs theme comprised four sub-themes evident within the data;
‘range versus precision’, ‘task orientated completion’, ‘clinical credibility’, and ‘don’t
need this imposition.’ This range of issues spanned both positive and negative aspects
that influenced clinician behaviour and acceptance with the ORCs. Nursing staff,
particularly those with less experience and students, understood and appreciated the
beneficial characteristics of the charts in principle, and could see that the ORC design
and content was of value. The ability of the chart to be tailored to suit the needs of
individual patients was also seen as a benefit.
Generally, staff did not find completion of the chart difficult once they became familiar
with the design characteristics. For example ‘I think it's self-explanatory’, although it was
often considered burdensome and ‘needlessly complicated’ to identify deterioration.
As noted earlier in the findings from Objective 1, patient vital signs were measured and
recorded on the ORC according to instructions with reasonable but not optimal
compliance. Observational field notes made by project officers supported these results.
Of note however were a variety of practices observed on occasions, where compliance
did not occur. For example:
Dots were placed in the correct square, but the numerical value was written in the
lowest row of that parameter (N.B. recording of figures on the graphing area is not
supported from a human factors perspective, as this increases visual clutter and
leads to cognitive load, increasing the risk of not detecting vital sign abnormalities
and clinical deterioration)
Dots were not centred in the square, but placed on or near lines in an attempt to
achieve more accuracy
Crosses were used instead of dots
Numbers alone were used instead of dots
Lines were not used to join dots and BP arrows or were used intermittently
Numbers were written above and below BP arrows.

Observation and Response Chart Project: Pilot Phase 31
On one occasion it was noted that a recorded heart rate triggered a clinical review,
despite the abnormal value being present for a period of time: ‘The low HR is not new, it
is consistent since admission but the intervention section was not completed.’
These findings supported earlier audit data indicating that the intervention section was
completed inconsistently, even when ‘abnormal’ vital signs were viewed as ‘normal’ for
that patient. This result highlights issues with poor documentation of interventions and
low levels of compliance with required actions in response to abnormal vital sign
triggers.
When vital signs triggered a review delays were also encountered as a result of general
ward activities e.g. ‘Not actioned as RN had to transport another patient to cardiac
catheter lab.’
Frequent comments were also made in the focus groups expressing the inconvenience
of the intervention section and additional observation section being on the reverse of
the double-sided chart. It was suggested that this may cause aspects of patient care not
to be documented.
Range versus precision
One significant issue with correct completion of the chart related to current and
accepted practice for documenting specific values, which was not supported by the use
of ranges in the graphing area. This caused staff to graph as well as write numbers.
As noted earlier, the ORC templates did enable modification of the precision of
parameter values to meet local clinical needs, although some trade-off was required to
meet the human factors design imperative of a maximum number of rows in the
graphing area. Examples of ranges applied by participating sites for the pilot phase are
noted in Appendix B.
From a positive perspective, some clinician comments included:
… it is easier to … see a trend… on this chart, but … it's a different way than
we've always been taught … not the actual … roughly this much … we've always
been taught accuracy is better.
While staff therefore understood the benefits and rationale of graphing to observe
changes in trends, some embedded cultures and practices challenged this principle,
mainly due to the lack of numerical precision for parameters with the ORCs. Recording
a dot in the centre of a square was widely discussed in focus groups and often caused
confusion, as illustrated in the following two quotes:

Observation and Response Chart Project: Pilot Phase 32
It's supposed to be just a dot … the idea being [to] graph so we can
actually look at it at a glance and pick it up.
We don’t know whether to put it (the dot) at the top of the square or the
bottom of the square.
When reporting a patient’s clinical condition to medical staff to escalate care, the nurses
stated that they needed accurate numerical vital signs for clinical communication with
medical staff or for senior nurse review. Nurses widely perceived that accuracy in the
charting area and reporting of the values was imperative when escalating care to
medical staff. Doctors were also generally not supportive with the use of ranges, and
requested an accurate figure before they would attend to a nurse’s request for review.
The tension between trend documentation and communication of accurate values to
medical staff was therefore evident. Commonly within practice the need to achieve
accuracy when recording vital signs meant that, ‘a lot of people are still writing the
numbers and that … it defeats the purpose of what the chart is there for in the first
place.’ An example from practice of this issue is illustrated in Figure 8 – note
annotations.

Observation and Response Chart Project: Pilot Phase 33
Figure 8 Sample of ORC – graphed and written values
An example of a completed chart where a
patient began to display signs of
deterioration.
Nursing staff were instructed by a registrar to
record vital signs as numbers instead of using
dots to graph (see handwritten notation).
Note this was an important issue for certain specialties, particularly for Infectious
Diseases, where precise temperature values were required to guide evidence-based
practice. While the intent of the ORC was for use in general medical-surgical patients,
there are implications for certain specialties where modifications to charts may be
necessary. This may also require modifications to scoring systems to then align with
variations in parameter values and response ranges in the charts.

Observation and Response Chart Project: Pilot Phase 34
The ubiquitous use of automated measurement devices in general ward areas also
means that digital values are provided for pulse rate, pulse oximetry, blood pressure
and temperature, but when using the ORCs these precise values are lost when
documenting in ranges.
A fundamental mismatch of the chart to clinical practice was therefore evident, as staff
practices involved precision in documentation, but this was perceived as not possible
with the parameter ranges available in the graphing area of the chart.
Task oriented completion
Completion of the chart quite often appeared task-oriented rather than considered as an
essential aspect and useful tool for assessing and monitoring a patient’s condition. An
occasion was observed where the ‘oxygen saturation and oxygen flow rate were not
documented because the machine was not available’, indicating a lack of reflection on
practice. This behaviour and response is a cultural practice issue, which will not be
altered by introduction of a new style of observation chart.
Clinical credibility / expertise undermined
Perceived benefits of the ORC depended on the level of experience for participants. As
noted earlier, the charts were seen as an enabler for junior staff and had value for
supporting them, including giving them permission and confidence to call and ask for
help.
‘I’m not frightened of calling the doctors but I’ve been nursing for a lot
longer than some of the junior staff so it gives them a backup but, for me, I
just ring if I’m looking after their patients’
However some participants noted that, ‘We should be educating junior staff to look for
more than just educating them to use colours to identify clinical deterioration and being
too reliant.’ Similarly, ‘I think these charts are encouraging people to rely on them too
much … my assessments is what I rely on more than anything. As a graduate I think
that's what they should be encouraged to do ...’

Observation and Response Chart Project: Pilot Phase 35
Don’t need this imposition
The ORC design characteristics generated a series of comments in relation to the
practice context, with a predominant view that the chart was an imposition for clinical
staff.
The size and layout of the chart was viewed as cumbersome compared to previous
charts. Of note, folding, the size and having to turn pages to record observations
caused utility concerns, with charts falling out of folders from wear and tear because of
the quality of paper. ‘This chart is less easy to use and read, than our other chart. This
chart makes comparisons between different vital signs difficult.’
Lack of precision and clarity in the graphing area was a considerable barrier to chart
acceptance in clinical practice and the consideration of including an area to record the
actual figure was widely discussed in focus groups. ‘I am not a fan of this chart. The
oxygen flow rate, and oxygen saturations and temperature sections need to be
redesigned, need to be able to write numbers. Also need a row for room air oxygen
saturations. Also there is no FiO2, which makes documenting a patient on a Fisher and
Paykel difficult.’
When a patient is clinically deteriorating the frequency of observations will increase, and
graphing issues for frequent observation patients was therefore a concern. While this
concern was not supported in the audit, participants raised the potential issue of losing
the benefit of a graphed trend when a new chart was commenced.
Having additional observations on separate pages of the ORC caused considerable
frustration, with a resulting reluctance to use to the chart to its full potential. There was
significant discussion around the location of additional observations such as bowels,
blood glucose, urinalysis, and weight being on the ‘back’ of the chart. These
observations carried significant importance to nurses performing their role in caring for
the patient, not only from a clinical deterioration perspective, but also from an holistic
care perspective.
Another participant noted that the practice of other charts in clinical use continued
despite the introduction of the ORC, ‘I just find that with this chart we've still got a lot of
our old charts anyway.’
An example of this dual-charting is illustrated in the following quote:
The front of the chart was to inform people that there are other charts in
use. But I find that instead of writing your blood glucose on the back,

Observation and Response Chart Project: Pilot Phase 36
people were actually getting another blood glucose chart and putting that in
there. So it's getting doubled up because some people are writing on the
base charts or just on one. Then you look at the charts and you think my
goodness when was the last time the sugar was done.
This was also the case for pain and analgesia being recorded on multiple charts for pain
score. This dual-documentation may lead to transcribing errors, and this needs be
considered when reporting or requesting a patient review.
The complexity of patient care has led to the creation of a plethora of observation charts
that is a significant cause of frustration and time consuming for nurses. This was an
underlying reason for nurses requesting to have all observations in one chart rather
than many.
Some staff participants did not perceive any benefits in detecting deteriorating from their
previous observation chart and expressed a preference to use the old chart, for
example:
I think it was easier to tell from the other charts whether someone was
deteriorating ... (FG)
There's no difference in using the old chart to this chart in terms of
graphing and seeing the change (FG)
… basically you knew before on your old observation chart, if it was out of
whack you knew it was out of whack anyway…
As one participant concluded after using the ORC, ‘It may look beautiful to people
wearing suits in a boardroom but it doesn’t work in day to day practice.’
Detecting deterioration
Emerging from the detecting deterioration themes were sub-themes of ‘seeing the
trend’, ‘protests – muddle, rigmarole’, ‘ignore of fudge it’, and ‘disempowering.’ The first
three sub-themes highlighted positive aspects from the chart by supporting clinical
decision-making, but the remaining three encompassed more negative aspects of
clinician responses in practice.

Observation and Response Chart Project: Pilot Phase 37
Seeing the trend
As noted earlier in this section, many participants acknowledged the potential benefits
of the observation chart, where the clear visibility of separate graphing areas made it
possible to observe clinical deterioration more easily and visualise trends.
The visible recognition of deterioration within the chart reduced some of the ‘wait and
see’ culture evident within practice. Instead the chart made visible the prompt and
activation processes. As noted by one participant, ‘Probably maybe in the past we might
have sat on certain things because you just wanted to see how it goes, whereas this
one it says, right do something about it.’ This reflection and behaviour was not however
universal; some staff were observed to act according to the ORC recommendations,
while others did not, as evident in the following sub-themes.
Protest – ‘muddle’, ‘rigmarole’
There was some resistance to acceptance of the ORC as participants felt they were
being forced to use something that did not align with their current practice. For example:
I'd like to think that it hasn't made any difference to me being able to detect
my patient deteriorating.
Many staff also highlighted that for them, detecting deterioration was not just about
using a track and trigger system, and that there was more to look for:
It's more than just numbers and a graph to see if your patient is
deteriorating, even if you haven't been nursing for long like me.
I think there are a lot of other things that need to be looked at not just a
colour-coded chart.
For some clinicians the chart was viewed as inhibiting their ability to convey patient
deterioration to medical staff; for example, ‘I think if anything it can make it harder
because you don't have the numbers there specifically to back up what you're trying to
get across.’
Ignore or ‘fudge’ it
On occasions when abnormal vital signs were recorded that were consistent with
previously recorded abnormal vital signs, a staff member would consider it acceptable
and action would not be taken or documented. A number of focus group participants
agreed that ‘people are going to fudge it because it’s easier to fudge it than to do all that

Observation and Response Chart Project: Pilot Phase 38
rigmarole.’ This implies that some staff would rather avoid taking action and falsely
document an abnormal vital sign in a normal ‘uncoloured’ graphing area, rather than
record observations accurately, and then follow recommended actions or write an
explanation as to why they did not.
Dis-empowering
Some staff, especially those with more experience and seniority, felt that the chart was
disempowering and the documentation and colour trigger system undermined their
professional capacity to care for patients. Participants who perceived that the chart
purported to dictate how to care for their patient, and that their clinical competence was
being questioned, noted:
This is basically almost a paint by numbers scenario.
I went to nursing school for three years - we know when it's time to ring the
doctor …
To retain a level of autonomy for the care of their patient, one nurse stated, ‘If I've got ...
a score of three or four that tells me to do something about it, and I don’t think I need to
- I'm either going to be confident in my skills and write my intervention that I've chosen
to do nothing or I'm going to write my results in the white.’
Responding / Communicating
The responding / communicating temporal area uncovered similar practice and
professional discipline issues to those previously reported, but with a focus on clinical
decision-making and communication with medical staff, as noted in the following sub-
themes.
Opinions / influences of doctors obtaining a review
One of the perceived benefits of the ORC was the direction provided for actions
required, including obtaining a clinical review. The fixed parameters were however
considered an imposition for nurses, as a doctor was required to complete the
modifications section. Comments noted from focus group participants reflected that
doctors commonly refused to complete the modification section, or did not review
previous modifications within the stated 72 hour time-frame. Obtaining a modification or
a review on the ORC was compounded by work practice. For example, ‘That's the issue
being on a surgical ward is the registrars are never here except first thing in the
morning.’
Observation and Response Chart Project: Pilot Phase 39
There were also reported instances where doctors refused to review a patient that met
the clinical review criteria. These behaviours exaggerated the cultural ‘them and us’
divide between doctors and nurses, reinforcing the traditional hierarchy and the
perceived professional autonomy of doctors to ignore the ORC required actions. This
highlighted again a perception of nurses being ‘dis-empowered’, as described
elsewhere in this report.
Enforces / must act
There was a perception that a nurse was expected to respond to the requirements of
the chart, even when they felt capable of making that clinical judgement based on their
expertise and knowledge. Autonomy was predominantly seen to operate only at the
medical level.
Opposing this position however was a view from a focus group that perceived that
introduction of the ORC was pushing their organisation to function in a particular way
that challenged professional demarcation and the traditional hierarchy – a positive
aspect.
Permission to ask / call
While participants positively viewed the ORC in supporting communication between
nursing teams, including prompting action for a senior nurse review, this was counter-
balanced by a perception of having to act as noted above, often against a nurse’s
clinical judgement.
What is the actual number?
Acceptance of the chart in practice was largely influenced by engagement with doctors,
especially when they refused to respond to a nurse’s request because of a parameter
range being provided and not the actual numerical parameter. Requesting a medical
review was therefore difficult using ranges. When a doctor reviewed a patient some
time after observations had been recorded, nursing staff were unable to report an
accurate figure because they had used dots in the parameter ranges to record the
observations.
‘It's hard to communicate deterioration to the doctors if it's - you know, you're in a rush
and they don't know the charts and … you're trying to tell them what the blood pressure
is, and you can't give them accurate information, and that's what they're wanting in a
time like that.’

Observation and Response Chart Project: Pilot Phase 40
This was seen to contribute to an increased workload, as repeat observations were
required to obtain the ‘actual number’ for the reviewing doctor.
Increased activity / uncertain benefit
The best location for documentation of actions and interventions was debated, with
some participants not convinced about the use of the ORC for recording this
information. One nurse stated:
‘If people were really getting into the intervention thing and writing quite detailed notes
there, then when they get to the end of the day and they write their normal [progress]
notes, are they going to be still writing notes, or are they going to just say as per the
chart, which means if a doctor wants to see, they're going to have to read one set of
notes, and then they're going to have to read these notes, and it's not always in the one
spot.’
The chart was therefore perceived to increase a nurse’s workload, particularly as a
result of lack of engagement and ownership of the chart by medical staff. The
documentation of observation charts has not traditionally been part of the medical
documentation. The ORC chart requires multidisciplinary entry and clear
communication, and hence demands a cultural shift away from traditional medical
documentation. In this study, nurses perceived that by default they had become the
custodian of the form and therefore responsible for ensuring medical documentation
occurs. As one participant noted, ‘I think, and getting the doctors to fill in the
modification thing I think is going to be a nightmare.’

Observation and Response Chart Project: Pilot Phase 41
Objective 5. Patient outcomes
As noted in the Methods, only routinely reported data were requested from local sites to
facilitate compliance for this objective and minimise the burden of data collection. As a
consequence, available data varied across sites for the following fields (see Table 16).
Note that only in-patient events are reported (not outpatient / visitor / staff events).
Number of MET / cardiac arrest (Code Blue) calls: For the seven sites able to
provide MET call frequency data, there were 266 and 289 calls for February
2011 and February 2012, respectively. In addition, there were 28 and 25 cardiac
arrest (‘code blue’) calls, respectively.
Number of actual cardiac arrests: Actual confirmed cardiac arrests were 9 for
both audit periods, but as noted in the Table these data were not available from
some sites.
Number of unplanned admissions to intensive care (ICU): Unplanned
intensive care unit (ICU) admissions were 42 and 50, respectively, but note that
these data were also incomplete for some sites.
Out of hours MET / cardiac arrest calls: Overall, for the three sites able to
provide time of event data, combined ‘out of hours’ calls were 40% (117 / 294)
and 31% (97 / 314) of the total calls for February 2011 and 2012.
Number of unexpected deaths: Based on available data from five sites, there
were 9 and 5 unexpected deaths, respectively.

Observation and Response Chart Project: Pilot Phase 42
Table 13 Summary information on MET/arrest calls for the two audit periods
Site MET calls
Arrest calls
Actual arrests
Unplanned ICU
admissions
Out of hours MET calls 2
Out of hours arrest calls
Unexpected deaths
2011 2012 2011 2012 2011 2012 2011 2012 2011 2012 2011 2012 2011 2012
A
19 31 1 2 1 2 5 7 9 (47%)
14 (45%)
1 (100%)
1 (50%)
1 2
B
- 3 - 3 - 3 - 3 - 3 - 3 4 1 - 3 - 3 - 3 - 3 - 3 - 3
C 1
- 3 - 3 - 3 - 3 - 3 - 3 - 3 - 3 - 3 - 3 - 3 - 3 - 3 - 3
D
50 35 - 3 - 3 - 6 3 5 - 6 - 6 - 6 - 6 - 6 3 - 6
E
62 69 4 0 0 0 11 9 - 3 - 3 - 3 - 3 4 7 3 6, 7
F
35 42 5 10 - 3 2 - 3 6 - 3 - 6 - 3 - 6 - 3 - 3
G
3 4 14 0 0 - 3 - 3 - 3 - 2 - 3 - 3 - 3 - 3 0 0
H 76 58 17 13 7 4 17 25 71 (93%)
46 (79%)
20 (87%)
21 (33%)
- 3 - 3
I 21 40 1 0 1 0 0 2 15 (81%)
15 (37%)
1 (100%)
0 1 0
Notes: ICU, Intensive Care Unit; MET, Medical Emergency Team
1 Site C unable to provide data 4
local information system not working at time; accuracy of data not confirmed 2 frequency and percentage based on total calls
(no delineation for inpatients versus outpatients / visitors / staff)
5 data from 2 of 3 campus sites only
6 incomplete data
3 data not available 7
3 patients deemed not for resuscitation (NFR); documented by MET
Observation and Response Chart Project: Pilot Phase 43
Discussion
This section highlights and discusses the key study findings, the methodological
strengths and limitations, recommendations to the Commission and health care
organisations, implications for practice, and recommendations for further research.
Key findings
Findings are presented in relation to the Commission’s requested research objectives:
1. Rate of completion of the chart
2. Rate of recognition of abnormality (in clinical observations)
3. Rate of calling for assistance where indicated, and the response obtained
4. Preferences and comments of clinical staff
5. Patient outcomes.
Rate of completion of chart
Planned frequency of observations
Over 1,000 patient records were examined across the two audit periods. The required
frequency of patient observations was documented in three-quarters of the patient
records audited, but importantly for the remaining quarter of patients, this information
was not recorded as part of a management plan. While the Commission recommends
documentation of the required frequency of observations,10 there is no stipulation where
this should be recorded, and of note the ORC templates do not currently have a section
to specifically record the observation frequency. Locations for this documentation varied
across and within sites, with almost one-half noted as being in ‘patient care plans.’
There was also some double-documentation noted in some sites. In the one site where
a section was included in the ORC, completion was noted in only one-third of audited
charts.
The most common frequencies documented were four times per day and 4th hourly,
collectively accounting for almost two-thirds of the patient records. On audit, the actual
frequencies approximated three times per day, indicating some lack of compliance,
although the 72-hour audit periods and actual lengths of stay may have contributed to
some of this discrepancy.

Observation and Response Chart Project: Pilot Phase 44
Compliance with documentation of vital signs
Three-quarters of the audited records had completed vital signs as recommended by
the Commission,10 noting the respiratory rate, oxygen saturation, systolic blood
pressure, heart rate and temperature. Improved compliance was noted with use of the
ORC templates (in the prospective audit), ranging from 4-14 % for the above
parameters. Inclusion of additional parameters on the ORC (level of consciousness,
urine output, pain score) appeared to be value-added features compared to sites’
routine charts, with significantly higher improvements in compliance. Overall
improvement in compliance was consistent across each of the ORC versions.
Compliance with graphing of vital signs (dots, BP arrows, connecting lines) was
relatively high (at and above two-thirds), although further improvement is possible, with
continued reinforcement of instructions and related rationale using educational
resources, and local auditing. Importantly however, over half of the audited ORCs
included some numerical values written in the graphing, potentially increasing the risk of
failure to detect deterioration and contrary to the human factors principles of the chart
design.
Use of other chart sections
Additional features of the charts (‘Other Observation Chart in Use’, ‘Modifications’,
‘Interventions Associated with Abnormal Vital Signs’, ‘Clinical Review Requested’,
‘Additional Observations’ sections) were not used optimally. While the latter section was
used in over half of the audited forms, other sections had minimal use, with the ‘Clinical
Review Requested’ section used in only 4% of cases.
Rate of documented recognition of abnormal clinical observations
Documented incidence of abnormal values was overtly higher during the prospective
period, when the ORC was in clinical use. While a before-after design limits
interpretation and inference of these results, it was evident that in this audit, the ORC
detected abnormalities in systolic blood pressure in almost one in ten observations,
while the rate was one in thirteen for oxygen saturation. Of note, rates of abnormality for
respiratory rate were much lower – about 2% of all observations. Findings were
consistent when the first three sets of vital signs included an abnormal value in one of
the parameters. Systolic blood pressure and oxygen saturation were the most common
signs to exhibit, while respiratory rate had the lowest incidence.
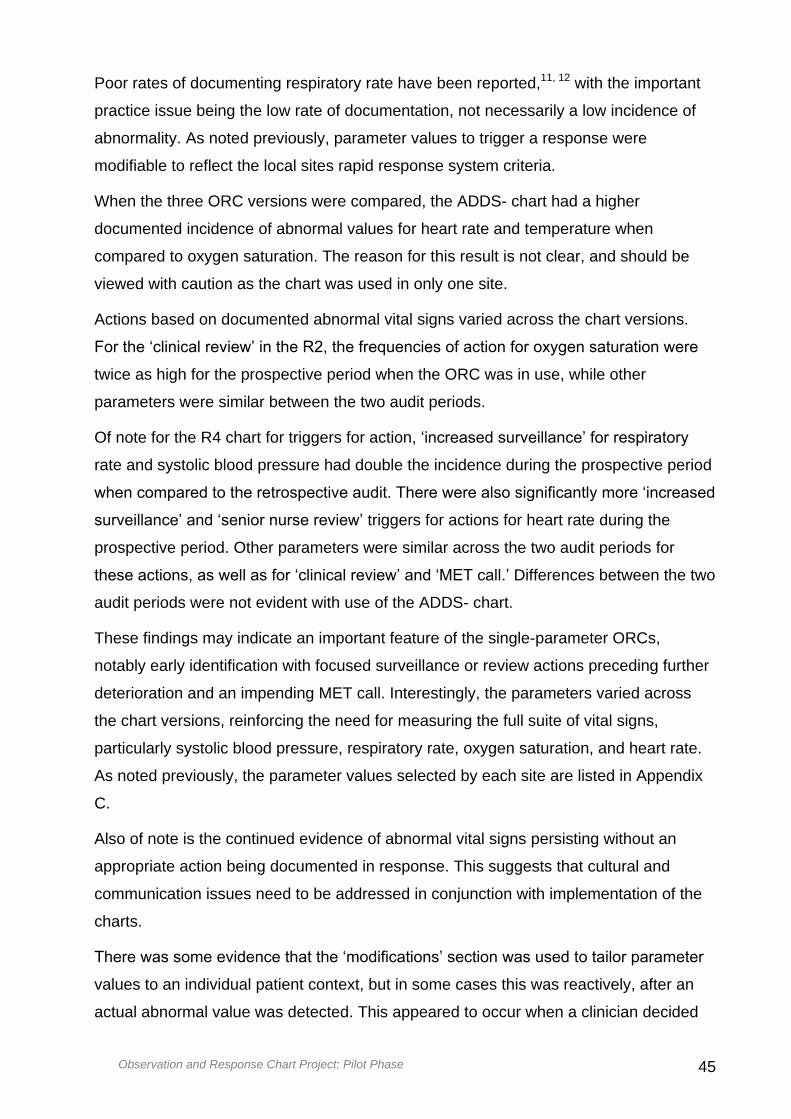
Observation and Response Chart Project: Pilot Phase 45
Poor rates of documenting respiratory rate have been reported,11, 12 with the important
practice issue being the low rate of documentation, not necessarily a low incidence of
abnormality. As noted previously, parameter values to trigger a response were
modifiable to reflect the local sites rapid response system criteria.
When the three ORC versions were compared, the ADDS- chart had a higher
documented incidence of abnormal values for heart rate and temperature when
compared to oxygen saturation. The reason for this result is not clear, and should be
viewed with caution as the chart was used in only one site.
Actions based on documented abnormal vital signs varied across the chart versions.
For the ‘clinical review’ in the R2, the frequencies of action for oxygen saturation were
twice as high for the prospective period when the ORC was in use, while other
parameters were similar between the two audit periods.
Of note for the R4 chart for triggers for action, ‘increased surveillance’ for respiratory
rate and systolic blood pressure had double the incidence during the prospective period
when compared to the retrospective audit. There were also significantly more ‘increased
surveillance’ and ‘senior nurse review’ triggers for actions for heart rate during the
prospective period. Other parameters were similar across the two audit periods for
these actions, as well as for ‘clinical review’ and ‘MET call.’ Differences between the two
audit periods were not evident with use of the ADDS- chart.
These findings may indicate an important feature of the single-parameter ORCs,
notably early identification with focused surveillance or review actions preceding further
deterioration and an impending MET call. Interestingly, the parameters varied across
the chart versions, reinforcing the need for measuring the full suite of vital signs,
particularly systolic blood pressure, respiratory rate, oxygen saturation, and heart rate.
As noted previously, the parameter values selected by each site are listed in Appendix
C.
Also of note is the continued evidence of abnormal vital signs persisting without an
appropriate action being documented in response. This suggests that cultural and
communication issues need to be addressed in conjunction with implementation of the
charts.
There was some evidence that the ‘modifications’ section was used to tailor parameter
values to an individual patient context, but in some cases this was reactively, after an
actual abnormal value was detected. This appeared to occur when a clinician decided

Observation and Response Chart Project: Pilot Phase 46
not to initiate a response according to the ORC recommendations. This included
initiation of a NFR designation for the patient, after actual clinical deterioration was
identified. Although reactive, this action may have been a clinically appropriate
response, and again highlights the need for appropriate inter-disciplinary
communication and proactive discussion for advance care directives.13
When abnormal vital signs were documented clinical judgement frequently appeared to
take precedence over the ORC required actions. Decisions not to initiate a clinical
review or MET call were documented in the progress notes in some instances, but not
always. Of equal concern was evidence that the documentation in the patient notes did
not reflect identified and documented abnormal observations on the observation (ORC)
charts.
Rate of calling for assistance and response obtained
Based on these audit findings documentation of responses to a clinical deterioration
was minimal. There was evidence of an action in approximately only one in eight cases
when an abnormal vital sign was detected. For a significantly abnormal vital sign that
should have triggered a MET call as the response action, MET calls occurred in only
one-third of cases in the retrospective period. This increased by almost 10% in the
prospective period when the ORC was in use. The actual MET call rates equated to 4.9
and 5.5 per 1,000 bed days, for the retrospective and prospective audit periods
respectively. If MET calls had been made every time an abnormal vital sign should have
triggered one, call rates would have been 14.8 and 13.6 per 1,000 bed days,
respectively.
Preferences and comments of clinical staff
Findings from the focus groups and field notes provided some contextual understanding
for the clinical utility of the ORCs, and the challenges encountered by nursing staff in
particular when attempting to use these new charts in an existing practice culture.
Observed behaviours and staff comments reflected issues related to compliance,
documentation practices, multidisciplinary communication, interdisciplinary practices,
and tensions related to clinical decision-making, and ultimately uncovered a range of
beliefs and views that hindered optimal use of the ORC framework. A number of
important themes emerged from the data across the continuum of recording vital signs,
detecting deterioration, and responding / communicating the abnormal vital sign/s.

Observation and Response Chart Project: Pilot Phase 47
Of note particularly, were issues of precision in documentation. The use of a range for a
vital sign was problematic when communicating with others (mainly medical doctors)
and initiating an appropriate response. This led to inter-disciplinary tensions, and
uncovered a feeling of lack of autonomy for the nursing staff, along with the view that
the medical staff did not have to comply with the ORC recommendations for
documenting and responding.
As noted earlier, the ORC graphing area was designed using human factors principles
to enable observation of a patient’s clinical condition as a trend over time. Each vital
sign is displayed as a separate graph using a range as a measure rather than actual
numbers. Coloured zones in the graphing area provide an instant visual trigger to
indicate if the vital signs are within acceptable ranges or if further action is required.
While simulated experiments using a human factors approach found detection of
deterioration works better with graphing and ranges, e.g. 6 in clinical practice there is a
fundamental mismatch as staff training and practice focused on accurate
documentation. Compliance with the related ORC documentation requirements was
therefore often low, despite initial education and continued support by site project
officers. It was clear the rationale for the chart design, according to safety science /
human factors principles was not always understood or accepted by clinical staff.
Importantly, as vital signs became abnormal, more precision was required, but this often
resulted in writing of actual figures in the graphing area. This led to visual clutter on the
ORC, adding to cognitive load and generating a risk for failure to recognise further
clinical deterioration.
Improving the available precision for documentation of parameter values in the graphing
area may therefore improve multi-disciplinary clinical acceptance and compliance,
enabling the ORC to truly act as a decision-support tool for timely inter-disciplinary
communication and clinical responsiveness to identified patient deterioration. Note
however that implementation of the charts was conducted in a condensed time frame,
while culture change associated with successful recognition and response systems can
take years to achieve.
Other chart characteristics and format also caused concern and sub-optimal use by
clinical staff. The use of an A3 size, double-sided format, when staff were used to A4
observation charts, resulted in some section not being completed. This included the
‘additional observations’ section on the last or back page, when these parameters were
on the same page as the vital signs in some previous observation charts.

Observation and Response Chart Project: Pilot Phase 48
Despite participant comments that the charting area did not allow enough observation
sets to be documented, the audit indicated that the median frequency of observations
was three times per day. With 18 charting columns, one chart will last up to six days for
an average patient. This suggests there is little need to change the human factors-
based design imperative that the graphing area should remain on the left side of the
page and not extend beyond the centre-fold.
As noted in the methods section, preparation for implementation in local sites, included
highlighting the human factors principles of chart characteristics and reference to the
Commission’s developers guide. Site staff were then able to modify parameters
according to their local rapid response system parameters. Despite this preparation,
clinical staff and project officers consistently requested additional changes that were not
aligned with human factors principles; e.g. requesting more than nine variables in the
graphing area; removal of essential sections such as review requested, to allow for
further additional observations such as wounds or surgical drains. It is therefore clear
that further education and information is required, so that the essential design principles
and chart characteristics are retained, and the ORC is used optimally.
A second important point was related to clinical judgement, with some nurse
participants viewing the ORC framework as undermining their professional thinking and
decision-making. This resulted in a protest from some staff, including ‘fudging’ the
documentation so that there was no need to respond, or ignoring the recommended
ORC actions for an identified abnormal vital sign measurement. It is therefore
necessary to change the perception that the escalation processes associated with an
ORC are ‘instead of’ clinical judgement. Education programs should make it clear that
the ORC is an adjunct and support for clinical judgement.
As noted earlier from the audit findings, documentation practices were commonly
incomplete, missing or inaccurate. Implementation of the chart was predominantly a
nursing responsibility although the autonomy and ability to modify vital sign parameters
on with the chart was in the domain of the medical staff. Engaging medical staff was
therefore challenging when the initiative was considered to be a nursing role. This
perceived disparity between nursing and medical staff led to tensions, as nursing staff
had no real capacity to achieve form completion from medical staff (e.g. ‘modifications’),
or when requesting a review if an abnormal ‘range’ for a vital sign was identified.

Observation and Response Chart Project: Pilot Phase 49
Multidisciplinary ownership of the form is therefore required before the full benefits of
ORC implementation can be achieved.
Despite these concerns and limitations in practice, the ORC did on balance provide
some nursing staff with the necessary information to contact medical staff when clinical
deterioration was identified. This was however counter-balanced by a sense of
increased workload, for an uncertain benefit. This reflects a culture of reactivity rather
than proactivity, where there was no perception that the system and chart was a
potential benefit for minimising preventable clinical deterioration. As noted previously,
the focus groups were conducted after a minimum of three weeks of routine use. It is
unclear whether time and continued clinical use will reduce the above criticisms.
Broader implementation of an ORC-type framework into routine clinical practice will
therefore require more emphasis and education / information on the potential benefits of
these systems. This defined preparation and implementation needs to be situated within
the broader context of the professional workplace and culture(s), inter-disciplinary
communication, professional autonomy and accountability, and multi-disciplinary
teamwork. Only when all these issues are managed will there be optimal benefits from
an ORC framework, with improved timely and appropriate responses for a patient at risk
of clinical deterioration.
Patient outcomes
Complete data were not available from all sites for February 2011 and February 2012
regarding MET / arrest calls, related unplanned ICU admissions and unexpected
deaths, and out of hours calls. From the available routinely collected information, there
were 294 and 314 emergency calls for the two audit months, respectively. Event rates
could not be calculated. Actual cardiac arrests were nine for each month, reflecting an
approximately 3% rate for the total combined MET and arrest calls for each period.
Approximately 15% of all calls resulted in an unplanned ICU admission for both audit
periods, and unexpected deaths were nine and five, respectively.
Based on this information, and noting the methodological limitations, no differences in
call rates or patient outcomes were apparent with the introduction of the ORC.
The occasions where abnormal vital signs were found to be in the MET calling criteria
and action was not taken may be appropriate rather than concerning. Even though low
numbers of MET calls were captured in the two audits the overall figures where MET

Observation and Response Chart Project: Pilot Phase 50
calls were not made with each abnormal set are consistent with some studies e.g. 14
noting that 40% of initial abnormal observations did not lead to an actual adverse event.
Study Strengths and Limitations
This study used a before-after design with mixed methods data collection approaches to
evaluate the implementation, clinical utility and user acceptance of an observation and
response chart for use with adult general medical-surgical patients in nine clinical sites
across five jurisdictions in Australia. The sites included both public and private
hospitals, with different levels of service and size, ranging from small rural facilities, to
metropolitan and tertiary-level hospitals.
Data were collected on three versions of the ORC, using retrospective and prospective
audits of 1,058 cases (9,920 sets of vital signs); 44 user focus groups involving 218
participants; 88 sets of observations from nine project officers; and routinely collected
patient outcome data related to clinical deterioration events.
Orientation, training and ongoing support for clinical staff on the introduction and use of
the ORCs was provided by on-site project officers seconded from the local
organisation’s staff. An executive staff member was engaged to be a ‘champion’ for
chart implementation at each clinical site to enable optimal communication and
engagement with all relevant clinical staff.
Within the context of the chart design characteristics, modifications to parameter values
and response levels were possible for alignment with local site needs, policies and
practices. This process of ‘flexible standardisation’ enabled site input, but perhaps not
from front line staff. Their engagement in setting of parameters may have improved
acceptance and compliance. In practice, there were also some project time restrictions
that impeded effective feedback for human factors review of locally requested
modifications to the ORC templates prior to pilot testing.
The initial intent from the Commission was for this pilot to be an organisation-wide roll-
out; this was specified in the invitation to participate for clinical sites. This was not
however possible for some services to provide additional support beyond the funded
project officer position for each site. Therefore, three sites were only able to trial the
ORC on 3-4 wards.
Training and introduction of the chart was timed to coincide with the start of a new
clinical term for resident medical officers. Clinical staff using the charts on a daily basis,

Observation and Response Chart Project: Pilot Phase 51
primarily nurses, had a minimum of three weeks experience with the ORC prior to data
collection / evaluation.
Despite these activities, a range of issues were evident that resulted in sub-optimal use
of the ORCs, including:
1. Compliance with graphing of observations, particularly in relation writing of
numerical values
2. Minimal use of the additional features of the chart designed to improve detection
of deterioration, response actions and communication (‘Other Observation Chart
in Use’, ‘Modifications’, ‘Interventions Associated with Abnormal Vital Signs’,
‘Clinical Review Requested’, ‘Additional Observations’ sections)
3. Lack of engagement and understanding by medical staff, particularly those at
more senior levels
Of note, industrial action by nurses in Victoria relating to workload and nurse:patient
ratios occurred during implementation and evaluation of the chart in clinical areas in
four of our nine clinical sites. This led to skepticism and mistrust as to the purpose of
the chart by some staff (anecdotal reports from site project officers, prior to focus
groups).
Clearly, the cultural context of an organisation has considerable influence on the
acceptance of any new initiative such as the introduction of a new form of observation
chart. The Commission’s intent was to enable implementation of the ORC into clinical
practice with ‘minimal training.’ This was reflected in the study, and while training on the
completion of the chart was achieved, the underlying knowledge, values and beliefs of
the clinical staff influenced both our findings and acceptance of the ORC into practice.
As a consequence, the following recommendations highlight issues for both the
Commission and health care organisations to consider, specifically in relation to
education, communication and culture.
Implications for practice
This section provides an initial discussion of a number of general practice implications;
local modification of ORC templates, resource implications for implementation of the
ORC into routine practice, and use of technology in vital signs measurement. Specific
recommendations for the Commission and health care organisations are then noted in
the following sections.
Observation and Response Chart Project: Pilot Phase 52
The ORC design characteristics resulted from application of human factors principles to
enable clear identification of potential patient deterioration and reduce cognitive load. 7
It is also clear that clinical chart design and modifications is a cottage industry in health
care.6 The Commission’s attempt to standardise the layout and characteristics of an
observation chart8 (and others such as the National Inpatient Medication Chart; NIMC)
to minimise risk and error will be impeded if local health services continually modify the
ORC templates. If local modifications are absolutely necessary, then the above
guidelines provided by the Commission should be adhered to. Access to human factors
expertise is required to ensure that any modifications to chart design characteristics do
not increase risks to patient safety.
There are specific resource implications if health services implement the ORC across
their organisation. While a cost-benefit analysis was not undertaken as part of this
project’s brief, the printing costs for the A3, double-sided coloured ORC forms will be
considerable compared to the costs of using current charts at some sites. The charts
need to be printed, not photocopied, as there will be loss of definition and delineation in
the specific ORC alert colours. This is particularly the case when using the R4 version.
There may also be more usage of the ORCs; although there are 18 columns for
observations, graphing of observations should only be on the inside left page of the
chart, and there may be therefore less columns than some old forms. The weight and
the quality of the paper is also a consideration. As an A3 size, the ORC is folded,
opened and closed numerous times during their use. Based on this study’s findings
from field observations, some forms ripped or fell out of bedside folders when the filing
holes were torn. On a related issue, the bedside folders for patient notes were usually of
an A4 size, either with clips or ring-binders. Accommodation of the A3 ORC was
therefore noted as problematic, particularly when the form was folded inside out or back
to front in the folder. Health services will therefore need to consider the utility of the
ORC in the current available folders, or whether an A3 clipboard would have improved
utility (particularly as the NIMC is also an A3 size).
During field observations, project officers focused on clinicians’ use and documentation
practices with the ORCs. Actual practices during vital signs measurement were not
directly observed. The accuracy of those measurements, or any recording or
transcriptions errors cannot be verified. As noted in the literature, various factors can
influence the precision of measurements for all vital signs, including operator error when
using equipment such as automated devices. e.g. 15 With the increasing ubiquitous use

Observation and Response Chart Project: Pilot Phase 53
and reliance on technology in general ward areas, e.g. 1 clinicians need to consider
equipment performance limitations and maintenance of core clinical assessment skills,
particularly when monitoring a patient at risk of clinical deterioration.
Recommendations to the Commission
This section lists a range of suggestions for the Commission to consider, including
aspects when liaising and supporting the broader implementation by health care
organisations. The recommendations are aligned to the relevant consensus statement10
elements:
Measurement and documentation of observations
Escalation of care
Rapid response systems
Clinical communication
Organisational supports
Education
Evaluation, audit and feedback
Technological systems and solutions
Essential element 1: Measurement and documentation of observations
1. The Commission consider providing advice to organisations on a location(s) in the
patient’s documentation where the frequency of observation is to be recorded.
2. The Commission consider including the required frequency of observations as a
section of the ORC templates.
3. The Commission consider revising the graphing section of the ORC to improve the
precision in the ranges of the vital sign parameters. There is also an opportunity to
document the actual abnormal parameter value in the ‘interventions’ section of the
ORC, along with any clinical action.
4. The Commission consider the development of form ‘inserts’ to enable all relevant
specialty observations to be included on the one ORC, rather than the continuation
of multiple observation forms.
5. Health care organisations develop or revise local policies on vital sign observations
and / or care escalation, highlighting minimum standards of practice and including
frequencies required.

Observation and Response Chart Project: Pilot Phase 54
6. Health care organisations maintain the integrity of the ORC design characteristics
when modifying charts for local use, by adhering to chart developer guidelines and
accessing human factors expertise.
Essential element 2: Escalation of care
7. Health care organisations continue to evaluate whether appropriate responses were
triggered according to the ORC recommendations (which were aligned to their local
RRS policies), when a vital sign abnormality was identified. Given the findings
presented here, it is clear that escalation of care does not always eventuate despite
signs of clinical deterioration, sometimes on multiple occasions.
Essential element 3: Rapid response systems
8. Health care organisations consider the data collection and evaluation processes of
their local RRS system, given the variation in scope and quality of available data
noted here from study sites.
Essential element 4: Clinical communication
9. Health care organisations that decide to implement an ORC-type framework and
form across their facility need to consider how to ensure full engagement by all
relevant health disciplines. In particular, medical staff at all levels need to be
informed and committed to their role, responsibilities and accountability as
participants in the effective implementation of the ORC. Inter-disciplinary
communication is essential for the ORC to be successfully adopted into practice. At
the core of this communication is the professional and workplace culture(s) at all
levels of the organisation (see below).
Essential element 5: Organisational supports
10. Account for increased costs associated with using an A3 double-sided colours-
specific observation chart that has high usage and handling
11. Health care organisations consider how to implement the complex practice and
cultural changes associated with the implementation of a clinical initiative such as
the ORC, within the context of their local workplace culture(s).
Essential element 6: Education
12. The Commission consider development and dissemination of explicit educational
resources, based on the human factors principles of the chart design, to guide

Observation and Response Chart Project: Pilot Phase 55
graphing practices (location of dots in the centre of the graphing area, use of lines to
connect the dots, and use of arrows and connecting lines for blood pressure
documentation).
The information should also focus on eliminating or minimising the practice of writing
numerical values in the graphing section of the chart. These resources should
identify the human factors principles that guide these instructions, and provide a
clear rationale from a patient safety and quality of care perspective.
13. The Commission should promote and disseminate these resources to all clinical
disciplines, specifically medicine at all levels in clinical departments and health care
organisations, to enable optimal engagement and understanding. Appropriate
engagement by medical clinicians would improve communication and team
processes with their nurse colleagues.
14. The Commission should also promote these resources to education and training
providers, so that students across all health disciplines have the background
knowledge and understanding of safety science and human factors principles, the
application of this knowledge in the form of the ORC templates, and the
understanding and skills to promote recognition and rapid response systems
processes in clinical practice
15. Health care organisations provide relevant initial and continuing training for all
clinical staff, based on resources available from the Commission, and tailored to
meet their local needs and context. Application of the ORC is essential to include in
clinical deterioration education packages, including how the chart is implemented in
routine practice, as well as in escalation of care
16. Additional training and support is required to improve the clinical utility of other
sections of the ORC template (‘Other Observation Chart in Use’, ‘Modifications’,
‘Interventions Associated with Abnormal Vital Signs’, ‘Clinical Review Requested’,
‘Additional Observations’ sections).
Essential element 7: Evaluation, audit and feedback
17. Health care organisations include ‘documentation of frequency of observations’, and
compare to actual frequency as part of routine clinical audits, with the aim of
improving compliance to this recommendation from the Commission.
18. Health care organisations to audit the compliance of complete sets of vital signs
(minimum of respiratory rate, oxygen saturation, systolic blood pressure, heart rate,
level of consciousness and temperature), as recommended by the Commission.

Observation and Response Chart Project: Pilot Phase 56
Essential element 8: Technological systems and solutions
19. The Commission consider the opportunities for developing, implementing and
evaluating electronic versions of the ORC. With the continued development of
clinical information systems and electronic health records, automated measurement
devices in general ward areas,1 and the future opportunities that handheld devices
hold in clinical practice, automated measurement and documentation with auto-
alerts to staff for abnormal vital signs are distinctly possible.
Recommendations for further research
The findings from this study highlighted a number of areas for further potential research.
Given the identified issues of clinical acceptance and compliance, further exploration of
cultural issues that influence practices of recognising and responding to the unmet
needs of a deteriorating patient within local escalation systems is warranted.
While not a focus of this study, during field observations a range of issues were
identified related to the actual performance of vital signs measurement. In particular, the
practices for measuring vital signs without use of electronic equipment, currently such
as respiratory rate, can be explored for accuracy and consistency. In this study and
others, e.g. 16,17 respiratory rate did not appear to be physiologically important for
triggering a response to clinical deterioration when compared to other parameters. It is
not clear if this is related to practice issues around the accuracy of measurement and
documentation of respiratory rate or to the study population.

Observation and Response Chart Project: Pilot Phase 57
Conclusion
This study demonstrated both positive findings and some limitations in relation to
clinical utility and user acceptance of the ORC templates when trialed in adult general
medical-surgical wards. The ORC forms were not used to their optimal functioning for a
range of reasons including different design characteristics compared to existing charts,
precision in charting vital signs values, tensions in clinical decision-making when an
abnormal vital signs was identified, and lack of engagement by medical staff.
We believe this study report provides sufficient information to inform the effective
implementation and evaluation of the adult general medical-surgical Observation and
Response Chart into routine practice in a wide range of health care settings – public
and private; rural to tertiary - across Australian jurisdictions.
Our recommendations involve modifications to the chart template for common sections
of all versions; development and use of specific information and training packages; full
engagement by all clinical staff. Based on our findings, implementation will require a
change management approach to address influencing factors such as workplace
culture(s); inter-disciplinary communication and co-practices; clinical decision-making;
documentation practices; vital sign observation standards and practices; and
understanding of and compliance with the human factors ORC design characteristics.
With optimal use of the ORC sections and compliance with the local rapid response
system calling criteria, we believe implementation of the Commission standards
together with a revised version of the ORC templates will improve both the identification
and response to abnormal vital signs and the trigger when clinical deterioration is
determined and a rapid response system is called.

Observation and Response Chart Project: Pilot Phase 58
References
1. Bellomo R, Ackerman M, Bailey M, Beale R, Clancy G, Danesh V, Hvarfner A, Jimenez E, Konrad D, Lecardo M, Pattee KS, Ritchie J, Sherman K, Tangkau P. A controlled trial of electronic automated advisory vital signs monitoring in general hospital wards*. Critical care medicine. 2012 Aug;40(8):2349-61.
2. Elliott D, McKinley S, Perry L, Duffield C, Iedema R, Gallagher R, Fry M, Roche M, Allen E. Observation and Response Charts Usability Testing Report. : University of Technology, Sydney2011.
3. Jones DA, Dunbar NJ, Bellomo R. Clinical deterioration in hospital inpatents: the need for another paradigm shift. Medical Journal of Australia. 2012;196(2):97-100.
4. Harrison GA, Jacques TC, Kilborn G, McLaws M-L. The prevalence of recordings of the signs of critical conditions and emergency responses in hospital wards: the SOCCER study. Resuscitation. 2005;65:149-57.
5. Mitchell IA, McKay H, Van Leuvan C, Berry R, McCutcheon C, Avard B, Slater N, Neeman T, Lamberth P. A prospective controlled trial of the effect of a multi-faceted intervention on early recognition and intervention in deteriorating hospital patients. Resuscitation. 2010;81(6):658-66.
6. Preece MHW, Hill A, Horswill MS, Karamatic R, O'Watson M. Designing observation charts to optimize the detection of patient deterioation: Reliance on the subjective preferences of healthcare professionals is not enough. Australian Critical Care. 2012.
7. Preece MHW, Hill A, Horswill MS, Watson MO. Supporting the detection of patient deterioration: Observation chart design affects the recognition of abnormal vital signs. Resuscitation. 2012;83:1111-8.
8. Preece MHW, Hill A, Horswill MS, Dunbar N, Adams LM, Stephens J-AL, Christofidis MJ, Watson MO. Developer’s Guide for Observation and Response Charts. Brisbane: School of Psychology, The University or Queensland; Australian Commission on Safety and Quality in Health Care2010.
9. National Health and Medical Research Council; Australian Research Council; Australian Vice-Chancellors' Committee. National statement on ehtical conduct in human research. Canberra: NHMRC, ARC, AVCC; 2007.
10. Australian Commission on Safety and Quality in Health Care [ACSQHC]. National consensus statement: essential elements for recognising and responding to clinical deterioration. Sydney: Australian Commission for Safety and Quality in Health Care; 2010.
11. Van Leuvan CH, Mitchell I. Missed opportunities? An observational study of vital signs measurements. Critical Care & Resuscitation. 2008;10(2):111-5.

Observation and Response Chart Project: Pilot Phase 59
12. Cretikos MA, Bellomo R, Hillman K, Chen J, Finfer S, Flabouris A. Respiratory rate: the neglected vital sign. The Medical journal of Australia. 2008 Jun 2;188(11):657-9.
13. Silvester W, Detering K. Advance care planning and end-of-life care. The Medical journal of Australia. 2011 Oct 17;195(8):435-6.
14. Flabouris A, Chen J, Hillman K, Bellomo R, Finfer S. Timing and interventions of emergency teams during the MERIT study. Resuscitation. 2010;81(1):25-30.
15. Lockwood C, Conroy-Hiller T, Page T. Vital signs. JBI Reports. 2004;2(6):207-30.
16. Jacques T, Harrison G, McLaws M-L, Kilborn G. Signs of critical conditions and emergency responses (SOCCER): A model for predicting adverse events in the inpatient setting. Resuscitation. 2006;69(2):175-83.
17. Kause J, Smith G, Prytherch D, Parr M, Flabouris A, Hillman K. A comparison of Antecedents to Cardiac Arrests, Deaths and EMergency Intensive care Admissions in Australia and New Zealand, and the United Kingdom—the ACADEMIA study. Resuscitation. 2004;62(3):275-82.

Observation and Response Chart Project: Pilot Phase 60
Appendices

Observation and Response Chart Project: Pilot Phase 61
Appendix A Discussion points for ORC template revision post UTP
I = Issue / D = Discussion Human Factors Action Education Action
Charting areas
1. I - Remove vertical bold lines or move to 4 / 6 columns?
D - Bold vertical lines minimise ‘column-shift’ error when documenting observations. Three (3) columns between the bold lines is optimal for accuracy with documenting. Changing the number of columns between the bold line, or removing bold lines will increase the risk of recording observations in the wrong column.
Bold lines to remain in charting area
Highlight justification for use of bold lines
Emphasise that the bold lines do not relate to the frequency of observations required for an individual patient
2. I - Delete rows above first emergency call line to create more space to narrow parameters?
D - Rows can be deleted from sections in graphing area to add to others, which will allow for increased precision in parameter values. The graphing area allows for a maximum of nine (9) observation parameters.
Advise on optimal ‘minimum row height’ and therefore related ‘maximum numbers of rows’ available in graphing area
n/a
3. I - Increase the precision for each parameter by using faint horizontal lines (i.e. at 5 bpm / mmHg)?
D - Additional horizontal lines through each row on graphing area will clutter the space and increase the risk of incorrect recording of vital signs.
n/a Focus on ‘patterns’ of observations, and ‘rounding-down / rounding up’ in documentation a
4. I - Remove ‘modifications in use’ tick box and locate one next to each parameter?
D - Modifications in use box rarely ticked in usability trial. Space limited in charting area; not enough space in boxes next to parameters without causing clutter in the charting area
Remove modifications in use tick box from ORC
Highlight completion of actual ‘modification in use’ section of chart

Observation and Response Chart Project: Pilot Phase 62
I = Issue / D = Discussion Human Factors Action Education Action
5. I - Parameter value ranges need to be narrower so trend is clearly seen when changes occur, especially respiratory rate, O2 saturations, O2 flow, temperature.
D - See discussion Point 2; ‘maximum numbers of rows’ to be confirmed, to enable increased precision of values
As for discussion Point 2 Information to sites on managing the parameter values within the context of the maximum number of rows in the charting area
Other charts in use
6. I - Add O2 delivery method?
D - Can be included in the O2 Flow rate section, with modifications of parameters (noting the maximum number of parameters as 9), or could be noted in ‘interventions’ section
Not to be a core component of the ORC, but can be
added by individual sites
Documenting the type of device in the interventions section
7. I - Relocate charting area to right side (if binder in centre)?
D - Binder to remain on left of chart (see Point 23)
Binding margin to remain in current left of chart position
Use of left margin for binding; chart layout with ‘writing’ and ‘information’ pages
Response criteria & actions required
8. I - Move section to back page?
D - Response criteria and actions required are next to the charting area as it is important for staff to identify deterioration and take relevant action promptly. Right side of page designed for information only when leaf open; not for writing / documentation
Response criteria and actions required’ section to remain in current place
Highlight ‘writing’ and ‘information’ sections of the chart design; ‘importance’ not ‘frequency’ guide location of section; ‘right-facing’ page a non-writing section
9. I - Clear guidelines that should NOT repeat what is already in graphing area to action?
D - Cognitive overload an important consideration. Documentation in these sections should remain clear, concise and not repeat what the graphing area already
n/a FAQ sheet to be developed, to include this information

Observation and Response Chart Project: Pilot Phase 63
I = Issue / D = Discussion Human Factors Action Education Action
actions. Developers guide provides further information
10. I - Delete ‘other charts in use’ section – issues around keeping up to date, already on inpatient medication chart.
D - Considering usefulness comments from usability testing and the importance of the ORC as a tool, suggestion was made that listed charts with tick boxes are changed to forms that are most frequently used
Other charts in use’ section to remain
Highlight value of identifying other observation-type charts in use
Modifications
11. I - Separate each box so that modified parameters are documented individually, as all vital signs won’t necessarily be modified at the same time
D - Feedback on modifications section was positive overall; some concern about completion by medical staff and how to use if more than one modification required
Re-design the section to allow up to 3 modifications for each vital sign
Highlight chart revisions
12. D - 1 line including parameter, 2 boxes for ranges acceptable from-to, date, time, sig, valid for xx hours / days
As for # 11 Highlight chart revisions
13. I - Develop specific training information for ‘modifications’ section
Education for medical staff to be included in ORC training package
Interventions
14. I - Relocate ‘interventions’ section to charting area/page
D - Due to graphing area and binding margin requirements, it is impractical to move the interventions section next to graphing area because the right inside cannot be written on when opened out
Interventions section to remain in existing location
As for # 7

Observation and Response Chart Project: Pilot Phase 64
I = Issue / D = Discussion Human Factors Action Education Action
15. I - Add date, time, signature/initials for each comment
D - Date and time correlates with relevant set of vitals signs and staff sign at the end of each comment
No change to section design Highlight process and link of intervention code to time on charting area
16. I - Provide guidelines on how and what to document i.e. actions taken relevant to vital signs
Guidelines to be provided in section i.e. document intervention(s) associated with deranged vital signs
D - Numbers cannot replace letters because of scoring with ADDS chart
Add comment, ‘document intervention(s) associated with deranged vital signs’ to intervention section
Replace upper case letters (e.g. ‘A’) with lower case in brackets (e.g. ‘(a)’ ) for coding interventions
Highlight chart revisions
17. I - Additional rows to be added to ‘intervention’ sections
D - This is possible with above planned modifications to section
Add further rows if space available following modifications
Highlight chart revisions
Urine Output
18. I - Remove urine output section?
D - A number of issues discussed about use of urine output section; noted as an important sign to monitor for recognition of clinical deterioration. The urine output section does not replace the need for a FBC for other clinical reasons
To remain on chart templates until further trial, use and recommendations occur
Highlight optimal use and documentation, including purpose from a clinical deterioration perspective
19. I - Change to fluid balance chart (FBC) trigger?
D - See point 18
As for # 18 As for # 18
20. I - Does patient require FBC as well?
D - The patient may or may not require a fluid balance chart.
As for # 18 As for # 18

Observation and Response Chart Project: Pilot Phase 65
I = Issue / D = Discussion Human Factors Action Education Action
The urine output section does not replace the FBC
21. I - Need to be able to document HNPU, PUIT, IDC ...
D - It is acceptable for staff to note the above, if this complies with local policies.
As for # 18 As for # 18
22. I - Add fluid balance summary to front or back of chart
D - As noted in points above, if summaries required, then FBC is needed to appropriately document patient fluid balance
General Layout
23. I - Move fold / binding to centre of ORC (similar to National Inpatient Medication Chart)?
D - Possible, but would mean losing 3 columns in the charting area due to space limitation with binding in the centre
Binding margins to remain on left of chart
As for # 7
24. I - Add page numbers
D - Agreed labelling of pages would be helpful. ‘Numbers’ however may not be always clear as there maybe be more than one chart
To label pages as ‘inside left’, ‘inside right’, ‘outside left’, ‘outside right’
As for # 7
25. I - Move binder / filing margin to centre?
D - See # 23
As for # 23 As for # 23
26. I - Move instructions to back at bottom of chart
D - Instructions are placed in areas on the R1 and R2 because this side of the page has space that cannot be written on
All charts to be reviewed so that instructions are moved to the back page if modifications allow
Highlight chart revisions

Observation and Response Chart Project: Pilot Phase 66
I = Issue / D = Discussion Human Factors Action Education Action
Clinical Review
27. I - Remove review undertaken section - Drs will not complete, as required to write in medical records
D - A number of issues discussed with completion of this section
Remove ‘clinical review’ section, with doctors to continue to record in patient notes
Highlight chart revisions
28. I - Add extra ‘review requested’ sections so that nurse can document when request made
D - Agreed with suggestion
Revise section to be amended to allow recording of more than one request
Highlight chart revisions
Additional Observations
29. I - Move blood glucose level to charting area
D - Blood glucose level is not a vital sign that requires monitoring for all patients
p.r.n. blood glucose to remain in additional observation section
Specific BSL chart to be used if patient requires frequent monitoring
30. D- Keep weight & bowels documentation sections These components to remain
in chart n/a
Other issues
31. I - Add sections for additional observations
D - Significant requests for extra sections / observations to be added to chart. It is however important that the ORC is kept as ‘clutter free’ as possible and adding extra information should be avoided because of risk of cognitive
n/a Highlight risk of cognitive overload; staff to continue to use specific charts for specialized observations
32. I - Develop educational tools – how to use ORC n/a Develop FAQ and other information resources for
pilot phase roll-out

Observation and Response Chart Project: Pilot Phase 67
I = Issue / D = Discussion Human Factors Action Education Action
33. I - Generate consensus on the required precision for documentation for observation values b
D - Outside scope of ORC Project
n/a n/a
34. I - Standardise values for response system triggers b
D - Outside scope of ORC Project
n/a n/a
35. I - Consider development of additional standard charts that complement the ORC and lead to a harmonised suite of national observation charts b
D - Outside scope of ORC Project
n/a n/a
36. I - Use of term ‘heart rate’ in charts, when actual observational parameter is most commonly measurement of ‘pulse rate’ b
D - This issue was not identified from the usability testing data, but was raised by a member of the UTS research team. This was discussed, and it was agreed that ‘pulse rate’ was the more correct term
n/a n/a
Notes:
a ACSQHC to examine the optimal precision for parameter values, in relation to the minimal important clinical difference (MID), where
treatment will change; this will require a cultural change in practice settings, involving pre-registration education, and post-registration training
(item 3)
b For discussion at the Deteriorating Patient Advisory Committee (items 35-36)

Observation and Response Chart Project: Pilot Phase 68
Appendix B Revised templates for pilot phase

Observation and Response Chart Project: Pilot Phase 69
N.B. The ADDS chart with blood pressure table had the same modifications applied. No
changes were made to the graphing area.

Observation and Response Chart Project: Pilot Phase 70
N.B. The R1 and R2 had the same modifications applied. No changes were made to the
graphing area.

Observation and Response Chart Project: Pilot Phase 71
Appendix C Comparison of ORC graphing areas by chart and site
Template ADDS- Site A Template R4 Site B Site C
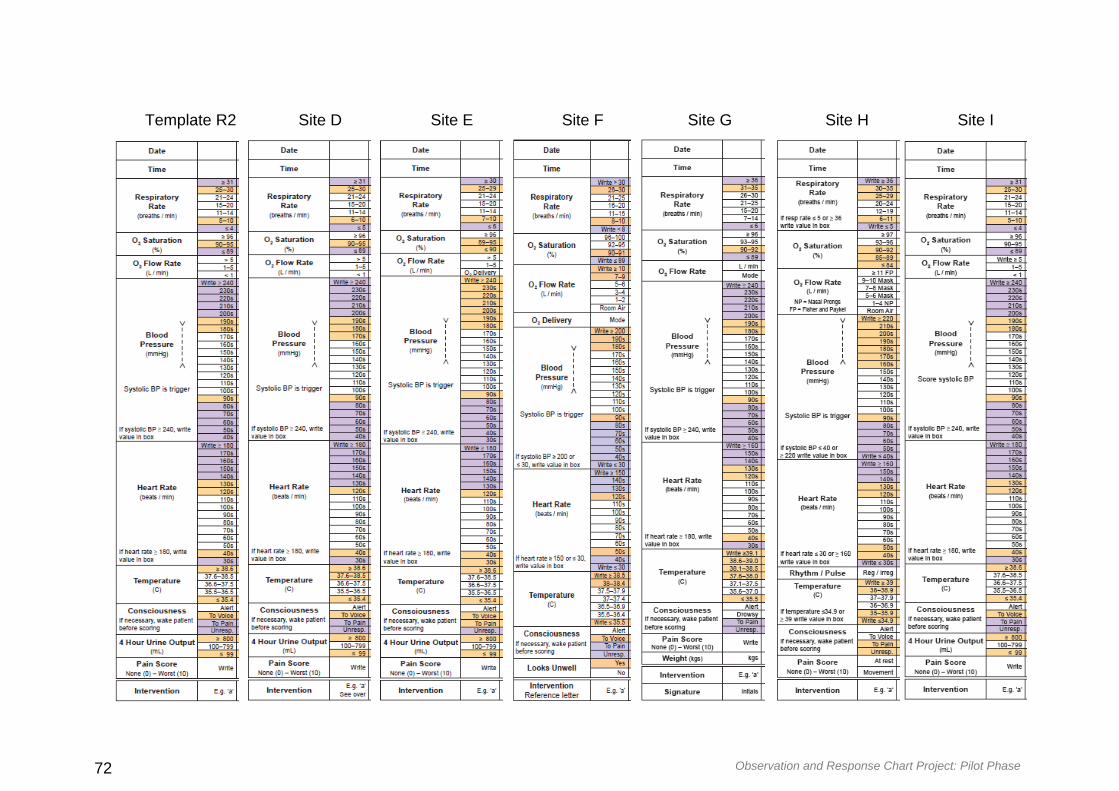
Observation and Response Chart Project: Pilot Phase 72
Template R2 Site D Site E Site F Site G Site H Site I

Observation and Response Chart Project: Pilot Phase 73
Appendix D How to use an ORC information sheet
1 ‘Other Observation Charts in Use’ Section
This first section on the outside of the ORC (when folded) highlights other
observation charts relevant for monitoring a patient’s clinical condition
Check this section each time before you measure and document a set of
observations
2 ‘Modifications’ section
Refer to this second section on the outside of the ORC (when folded) prior to
documenting and responding to any abnormal observations – any observation / vital
sign that falls within a coloured zone or acquires an ADDS score

Observation and Response Chart Project: Pilot Phase 74
If abnormal observations are accepted for a patient’s clinical condition they are
recorded in this section and any Action(s) Required according to the relevant
coloured / scoring section do not apply (see No.4)
Each modification MUST be completed in full by the treating doctor, as a medico-
legal order
Up to four modifications are allowed for each chart - if further modifications are
required, commence a new ORC

Observation and Response Chart Project: Pilot Phase 75
3 ‘Graphing’ section
This third section on the inside of the ORC (when open) is for documentation of
important observations
For ALL observations EXCEPT blood pressure record a dot in the centre of the square
and join it to the previous dot (connecting the dots enables faster recognition of clinical
deterioration)
For blood pressure use arrows as indicated in the box to the left of the graphing area,
and connect the arrows with a dashed line (connecting the arrows enables faster
recognition of clinical deterioration)
DO NOT use numbers (unless indicated) as they impede the ability to observe and
recognise clinical deterioration
4 ‘Response Criteria and Actions Required’ Section
This fourth section on the inside of the ORC (when open) provides you with essential
information when abnormal observations are identified for a patient
Familiarise yourself with this information as extra Response Criteria may be provided that
do not fit within the coloured or ADDS scoring zones

Observation and Response Chart Project: Pilot Phase 76
Make sure you are aware of any documented modifications before responding to abnormal
observations (see No. 2)
If any action is taken for abnormal observations OR is not deemed appropriate it should be
documented in the Interventions Associated with Abnormal Vital Signs section (see No.6)
When one or more observations are documented in any of the coloured zones use the
darkest colour, or total ADDS score, to identify any action(s) that must be taken
If a clinical review is requested, document in the Clinical Review Requests section (see No.
7).

Observation and Response Chart Project: Pilot Phase 77
5 ‘Interventions Associated with Abnormal Vital Signs’ section
This fifth section on the outside of the ORC (when closed) is where you document any
actions taken OR not taken in response to abnormal observations
When you have written comments in a row, document the corresponding letter at the
bottom of the column in the charting area, with the abnormal observations
The corresponding letter is written in lower case to avoid any confusion with abbreviations
or acronyms
6 ‘Clinical Review Requests’ section
This is the sixth section on the ORC (when closed) where you document that a request for

Observation and Response Chart Project: Pilot Phase 78
a clinical review has been made
Up to three clinical review requests can be recorded in this section – if further clinical review
requests are required, commence a new chart
7 ‘Additional Observations’ section
This is the final section on the ORC (when closed) where you can document other
observations being monitored for a patient’s clinical condition
You do not have to document in all of the sections unless it is important to monitor for a
patient’s clinical condition
8 ‘General Instructions’ section
This section provides instruction for staff who are unfamiliar with the ORC and remains an
integral feature of the chart

Observation and Response Chart Project: Pilot Phase 79
N.B. This ‘how to use an ORC’ document is to be read in conjunction with the
FAQs sheet

Observation and Response Chart Project: Pilot Phase 80
Appendix E How to use an ORC poster

Observation and Response Chart Project: Pilot Phase 81
Appendix F Frequently asked questions (FAQ) sheet
1. What is Human Factors?
Human factors (HF) incorporates knowledge from a range of multidisciplinary field incorporating knowledge from psychology and design, to inform complex processes, and minimize risk of human error
2. Why do HF principles need to be applied to ORCs?
Applying HF minimises risk of error occurring and reduces ‘cognitive load’
Cognitive load is related to a person’s working memory, problem-solving and other aspects of high-level functioning
3. Why is the ORC designed in this format?
This format minimises cognitive load and processing, reducing the risk of errors being made when recording and interpreting patient’s vital signs
4. Why is the ORC A3 size and not A4 like other charts we use?
The A3 size improves usability and interpretation by minimising clutter
The ORC has a left binding margin and an off centre fold to allow enough space for the graphing area. The graphing area MUST NOT extend beyond the fold of the page
5. I want to be accurate when I’m recording patient observations. Why do I have to use dots and ranges in the graphing area instead of numbers?
Empirical HF research has found that clinical deterioration is recognised much faster with the use of dots instead of numbers; With the use of separate graphing areas instead of overlapping, and using colour coding instead of tables / legends
It is also important to consider the accuracy of automated machines and if a patient’s vital sign is abnormal it MUST be check manually
6. I’ve always been taught to look for the ‘seagull sign’ as an indicator of clinical deterioration. How am I supposed to apply this principle with the separate graphing area?
Empirical HF research has found the ‘seagull sign’ to be potentially harmful when
indentifying clinical deterioration because overlapping of the graphing area ‘impedes recognition of clinical deterioration’
7. Why can’t I add more variables to the graphing area?
The maximum of 9 variables prevents the charting area from becoming ‘cluttered’ with too much information, causing cognitive overload
Adding more than 9 variables increases cognitive load, risk of error, and distracts from the most significant variables reducing the likelihood of identifying clinical deterioration

Observation and Response Chart Project: Pilot Phase 82
The core variables include respiration rate, oxygen saturation, systolic blood pressure, heart rate and temperature
8. Can the order of variables in the graphing area be changed?
The order of the variables on the charting area should not be changed because they are in order of significance to clinical deterioration
9. Why is there a bold line every 3rd column when it doesn’t align with 4 hourly or QID observations?
The bold line every 3rd column prevents ‘column shift’ or error of recording observations in the wrong column
10. Can more rows be added to the graphing area to narrow the ranges in each variable?
Yes, extra rows can be inserted for variables but other rows must be deleted to keep the overall graphing area the same size
The minimum height for each row must not be less than 3.6mm
These restrictions prevent too much ‘clutter’ in the graphing area and enables faster recognition of clinical deterioration
11. Why can’t we add other observation sections such as wound management, surgical drains, cannula changes etc?
The additional observations section is not an essential element of monitoring clinica deterioration
Different observations can be placed in this section, however the area should NOT be increased at the cost of other sections on the ORC that are important for the recognition of clinical deterioration
Adding further ‘additional observations’ would increase cognitive load with extra information and reduce the likelihood of identifying clinical deterioration
12. I work on a neuro ward and the Glasgow Coma Scale is really important to monitor alongside other vital signs. Why can’t this be included on the ORC?
This is a ‘general’ adult observation chart that has been designed to monitor the core physiological vital signs of all adult patients (see ACSQHC standards/consensus)
Any additional specialty observations should be monitored on a separate chart
N.B. This FAQ document should be read in conjunction with the ORC Developers
Guide available from the Australian Commission on Safety and Quality in Health
Care website www.safetyandquality.gov.au
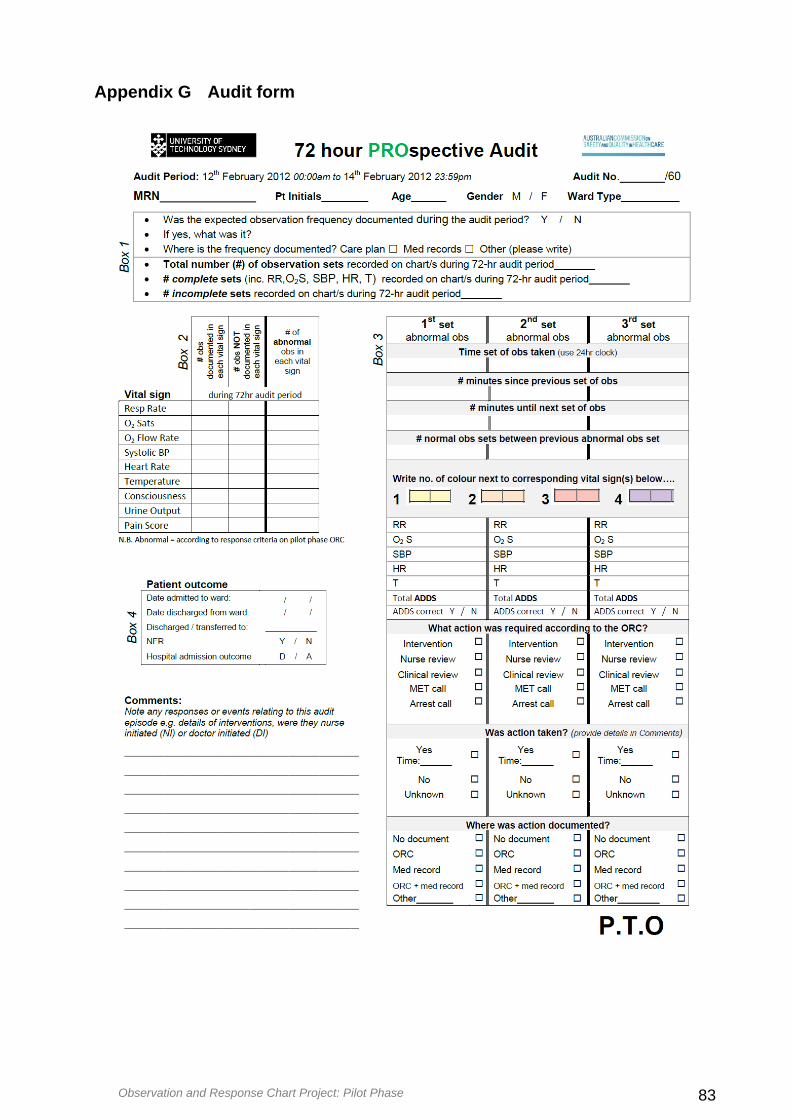
Observation and Response Chart Project: Pilot Phase 83
Appendix G Audit form

Observation and Response Chart Project: Pilot Phase 84

Observation and Response Chart Project: Pilot Phase 85
Appendix H Focus group questions for project officers
1. How did you find using the new charts? (What did you like about them? What
didn’t you like?)
2. Are there any particular sections, which you particularly liked or disliked on the
ORC? (Please explain answer)
3. Did you encounter any difficulties while using the ORC? If so, what were they?
Can you suggest any ways to resolve this?
4. How do you find graphing using ranges rather than writing the actual number?
5. How does the ORC compare to the ones you usually use? (Easier / harder to fill
in or read? If so, in what way? What makes them easier / harder to use?).
6. Does the chart make any difference to your ability to detect/ pick up changes in
a patient’s condition? (If yes, what is it about the chart that makes the
difference?)
7. Does the chart make any difference to your ability to make decisions about
patient care? (If so, in what way?)
8. Do you think the chart influences your ability to communicate clinical
deterioration to the patient’s team? (If so, in what way?)
9. Is there anything else about these charts that you would like to tell me about?

Observation and Response Chart Project: Pilot Phase 86
Appendix I Observation and field note guidelines and template
Preparing for Observations
The focus of the observation period is to record dialogue / practice that is specifically relevant to the use of the ORC in the clinical environment in which it is being trialed.
Identify times for observation periods when increased activity with observations charts occurs on the ward, such as routine observation rounds or medical /multidisciplinary ward rounds.
During the Observations
Think about where you can position yourself without being ‘in the way.’ It is fine if you need to reposition yourself or even shadow a member of staff with their permission.
Make notes during the observation periods of dialogue and practices that have any relevance to the use of the ORC. Notes can be made using the template provided in this package or something similar. Try to capture as much data as possible and make sure your notes are clear and legible so that when you review them you will be able to understand what you were observing at the time.
Questions to Consider During Observations
When making field notes you might like to consider:
Where are the observation charts (current & trial) kept? E.g. by the bed, at the end of the bed, at the nurses’ station, in an office.
Who is completing the ORC?
Which section of the ORC are they completing?
Where is it being completed? By the bed or at the nurses’ station, or somewhere else?
How many people are involved? For example, is there an RN and AIN and/or others?
Note level of ease for completion - is there confusion / is clarification required?
Is there any informal education occurring between staff members and what roles are they in?
How long does it take to complete the observation chart section or any of the other sections?
Note comments made directly or indirectly / out loud about the ORC.
How are the observations being recorded, e.g. straight to chart or on piece of paper

Observation and Response Chart Project: Pilot Phase 87
After the Observations
Before leaving the clinical area make sure you have asked any questions that you noted during the observation period and may have been unable to clarify at the time.
Review your notes as soon as possible after completing the observation period and add any observer comments or questions in the relevant column alongside your notes.
Once you have completed your observational notes transcribe them into a word document and email them to the Project Manager at UTS [email protected]
then to chart; do they get taken and charted one by one or all together?
Where are the observations being taken such as oral, tympanic or underarm temperature & where/how is this being documented if it is?
Is the participant taking the necessary vital signs or are they missing something / following previous? For example, if the patient is tachypnoeic has their respiratory rate been taken and documented?
Did the observations fall within ‘acceptable’ parameters? If not, was the appropriate action taken and was it immediate or did they complete other tasks first? Was this documented, and if so how?

Observation and Response Chart Project: Pilot Phase 88

Observation and Response Chart Project: Pilot Phase 89
Appendix J Ward poster

Observation and Response Chart Project: Pilot Phase 90
Appendix K Participant Information Sheet and Consent Form
Observation and Response Chart Project: Pilot Phase 91

Observation and Response Chart Project: Pilot Phase 92

Observation and Response Chart Project: Pilot Phase 93

Observation and Response Chart Project: Pilot Phase 94
Appendix L Tables illustrating required actions to abnormal vital signs for
each ORC version
Table L1 Action required according to abnormal vital signs on the RE ORC
Table L2 Action required according to abnormal vital signs on the R4 ORC
Table L3 Action required according to abnormal vital signs on the ADDS- ORC