nursery product-related injuries treated in united … volume 139 , number 4 , april 2017 :e...
TRANSCRIPT

ARTICLEPEDIATRICS Volume 139 , number 4 , April 2017 :e 20162503
Nursery Product-Related Injuries Treated in United States Emergency DepartmentsChristopher E. Gaw, BS, a, b Thiphalak Chounthirath, MS, a Gary A. Smith, MD, DrPHa, c, d
abstractOBJECTIVE: The goal of this study was to determine the epidemiology of injuries associated
with nursery products among young children treated in US emergency departments.
METHODS: Data from the National Electronic Injury Surveillance System were retrospectively
analyzed for patients aged <3 years who sustained an injury associated with a nursery
product from 1991 through 2011.
RESULTS: An estimated 1 391 844 (95% confidence interval, 1 169 489–1 614 199) nursery
product–related injuries among children aged <3 years were treated in US emergency
departments during the 21-year study period, averaging 56.29 injuries per 10 000 children.
The annual injury rate decreased significantly by 33.9% from 1991 to 2003, followed by a
significant increase of 23.7% from 2003 to 2011. The decrease was driven by a significant
decline in baby walker/jumper/exerciser-related injuries; the increase was driven by a
significant increase in concussions and closed head injuries. Nursery product–related
injuries were most commonly associated with baby carriers (19.5%), cribs/mattresses
(18.6%), strollers/carriages (16.5%), or baby walkers/jumpers/exercisers (16.2%). The
most common mechanism of injury was a self-precipitated fall (80.0%), and the most
frequently injured body region was the head or neck (47.1%).
CONCLUSIONS: Although successful injury prevention efforts with baby walkers led to a decline
in nursery product–related injuries from 1991 to 2003, the number and rate of these
injuries have been increasing since 2003. Greater efforts are warranted to prevent injuries
associated with other nursery products, especially baby carriers, cribs, and strollers.
Prevention of falls and concussions/closed head injuries associated with nursery products
also deserves special attention.
aCenter for Injury Research and Policy, The Research Institute at Nationwide Children’s Hospital, Columbus,
Ohio; bPerelman School of Medicine at the University of Pennsylvania, Philadelphia, Pennsylvania; cThe Ohio
State University College of Medicine, Columbus, Ohio; and dChild Injury Prevention Alliance, Columbus, Ohio
Mr Gaw conducted the data analysis and drafted and revised the manuscript; Mr Chounthirath
assisted in data analysis and revised the manuscript; and Dr Smith conceptualized the study,
assisted in data analysis, and critically reviewed and revised the manuscript; and all authors
approved the fi nal manuscript.
DOI: 10.1542/peds.2016-2503
Accepted for publication Jan 6, 2017
Address correspondence to Gary A. Smith, MD, DrPH, Center for Injury Research and Policy, The
Research Institute at Nationwide Children’s Hospital, 700 Children’s Dr, Columbus, OH 43205.
E-mail: [email protected]
PEDIATRICS (ISSN Numbers: Print, 0031-4005; Online, 1098-4275).
Copyright © 2016 by the American Academy of Pediatrics To cite: Gaw CE, Chounthirath T, Smith GA. Nursery Product-
Related Injuries Treated in United States Emergency
Departments. Pediatrics. 2016;139(4):e20162503
WHAT’S KNOWN ON THIS SUBJECT: Previous
studies have described the epidemiology of injuries
associated with specifi c nursery products, such as
cribs and baby walkers. No study has attempted to
examine and compare classes of nursery products
by using a nationally representative sample.
WHAT THIS STUDY ADDS: This study is the fi rst to
use nationally representative data to investigate the
epidemiology of injuries associated with a broad
range of nursery products among young children.
The rise in these injuries since 2003 warrants
increased injury prevention efforts.
by guest on March 15, 2017Downloaded from
GAW et al
Nearly every household in the United
States with a newborn or young child
uses nursery products, which include
infant furniture, barriers, walkers,
devices, and equipment used for
transporting, bathing, or caring for
a child. These products are intended
to help parents raise their children.
However, nursery products can pose
a threat to the well-being of young
children, especially if the products do
not meet current safety standards.
From 2009 to 2012, nursery
products were the leading category
of children’s products recalled in the
United State, 1 – 4 and they account
for millions of dangerous products
found in US households.5, 6 Nursery
products are known to be a source
of child injuries 7 and deaths. 8, 9 In
2014, there were 69 300 emergency
department (ED) visits by children <5
years old attributable to nursery
products.10
Few studies have evaluated injuries
associated with multiple classes of
nursery products among infants and
children, including 1 small study in a
non-US population. 11 Most previous
epidemiologic studies focus on
injuries associated with 1 or several
products in a single product class,
such as strollers, 12 – 14 cribs, 15 baby
walkers, 16 –20 and baby bottles, 21
using both regional and national data.
Nursery product safety is a critical
yet challenging issue in injury
prevention, complicated by the
rapid anatomic, motor, and cognitive
development of young children as
well as injury profiles unique to
specific products based on their
design and use. 15, 22 Identification of
injury characteristics and patterns
associated with nursery products is
therefore essential in pinpointing
areas of greatest concern for
caregivers, health care providers,
manufacturers, and policy makers.
The objective of the present study
was to determine the epidemiology of
injuries associated with a wide array
of nursery products among young
children treated in US EDs. To our
knowledge, this study is the first to
comprehensively investigate nursery
product–related injuries by using a
nationally representative sample.
METHODS
Data Source
The National Electronic Injury
Surveillance System (NEISS), 23 which
is operated by the US Consumer
Product Safety Commission (CPSC),
monitors consumer product–related
and sports and recreational activity–
related injuries treated in US EDs. 24
Approximately 100 hospitals,
including 8 children’s hospitals,
contribute to the NEISS, which
represents a stratified probability
sample of >5300 hospitals with a
24-hour ED with at least 6 beds in the
United States and its territories. 25, 26
Professional NEISS coders abstract
information from ED medical records,
including patient demographic
characteristics, the consumer product
involved, injury diagnosis, affected
body region, disposition from the ED,
and a brief narrative regarding the
circumstances of the incident.27
Nursery product–related injuries
among children aged <3 years
reported through the NEISS
from 1991 through 2011 were
retrospectively analyzed. Nursery
product–related injuries were
identified by using 39 discrete
NEISS consumer product codes
(Supplemental Information), 24
which were based on the product
codes included in the CPSC annual
report on nursery product–related
injuries and deaths. 10 Each case
narrative was then examined, and
cases were excluded if the injury
did not involve a nursery product
or involved a motor vehicle crash,
diaper rash, animal bite, dermatitis,
or conjunctivitis. The final data set
contained 48 653 actual cases.
Study Variables
NEISS case narratives were
individually reviewed to identify
the mechanism of injury, which
was classified as follows: (1) fell
spontaneously or due to actions of
the patient; (2) fell due to actions
of another person; (3) collision
with or while using the product; (4)
breathing related; (5) entrapment;
(6) product failure, which includes
product collapse or malfunction; (7)
ingestion; (8) nonfatal submersion;
and (9) other. In instances in which
mechanisms of injury overlapped, the
initial event in a sequence of events
was considered the mechanism of
injury. NEISS consumer product
codes were regrouped into 12 major
categories of nursery products,
similar to categories used by the
CPSC (Supplemental Information). 10
The NEISS variable for age was
regrouped into 0 to 5 months, 6 to
11 months, 12 to 17 months, 18 to
23 months, and 24 to 35 months.
Injury diagnosis was categorized as
follows: (1) ingestion; (2) aspiration;
(3) burn; (4) laceration (including
the NEISS categories of amputation,
laceration, puncture, and nondental
avulsion); (5) concussion/closed
head injury (CHI), including internal
organ injury to the head; (6) soft
tissue injury, including crushing,
contusion/abrasion, hematoma,
and strain/sprain; (7) anoxia/
submersion; (8) fracture; (9) dental
injury; or (10) other, including
dislocation, foreign body, nerve
damage, hemorrhage, electric shock,
poisoning, internal organ injury to
non-head body regions, and other.
Body region was grouped into: (1)
upper extremity, including shoulder,
elbow, upper arm, lower arm,
wrist, hand, and finger; (2) lower
extremity, including knee, upper
leg, lower leg, ankle, foot, and toe;
(3) trunk, including upper trunk,
lower trunk, and pubic region;
(4) head/neck; (5) face, including
face, eye, mouth, and ear; and (6)
other, including injury to >25%
of the body. Disposition from the
ED was categorized as: (1) treated
and released; (2) hospitalized,
2by guest on March 15, 2017Downloaded from

PEDIATRICS Volume 139 , number 4 , April 2017
including NEISS categories of
treated and transferred, treated and
admitted, and held for <24 hours for
observation; (3) left against medical
advice; and (4) fatality. Location
of injury was grouped into home
(including home, apartment/condo,
and manufactured/mobile home) and
other. Additional variables analyzed
included sex and year.
Statistical Analysis
Data were analyzed by using SPSS
version 20.0 (IBM SPSS Statistics,
IBM Corporation) and SAS 9.3 (SAS
Institute, Inc, Cary, NC) statistical
software. National injury estimates
were calculated by using sample
weights provided by the CPSC. 25, 26, 28
All data reported in the present
article are stable national estimates
unless otherwise noted. An estimate is
considered unstable if the estimate
is <1200 cases, the sample size
is <20 cases, or the coefficient of
variation is >30%. US Census Bureau
July 1 intercensal and postcensal
population estimates from 1991
to 2011 were used to calculate
injury rates. 29– 31 Piecewise linear
regression models were used to
analyze the trends. Trends involving
all nursery products ( Fig 1) or baby
walkers/jumpers/exercisers ( Fig 2)
were analyzed by using 2003 as a
breakpoint, whereas concussion/CHI
( Fig 3) trends were analyzed by using
2005 as a breakpoint. The estimated
annual rate of change from the
regression model, denoted by
“m, ” was reported along with the
P value associated with the t test used
to test for its statistical significance.
Other analyses included the Rao-
Scott χ2 test for association, and
calculation of relative risk (RR) with
a 95% confidence interval (CI). The
level of significance for all statistical
tests was α = 0.05. This study was
approved by the institutional review
board of The Research Institute at
Nationwide Children’s Hospital.
RESULTS
Demographic Characteristics
During the 21-year study period,
an estimated 1 391 844 (95% CI,
1 169 489–1 614 199) children
age <3 years were treated in US
EDs for nursery product–related
injuries, averaging 66 278 (95% CI,
55 690–76 867) injuries annually
3
FIGURE 1Estimated annual number and rate of nursery product–related injuries among children aged <3 years treated in US EDs, NEISS 1991 to 2011.
FIGURE 2Estimated annual number of nursery product–related injuries among children aged <3 years according to selected nursery product categories, NEISS 1991 to 2011.
by guest on March 15, 2017Downloaded from
GAW et al
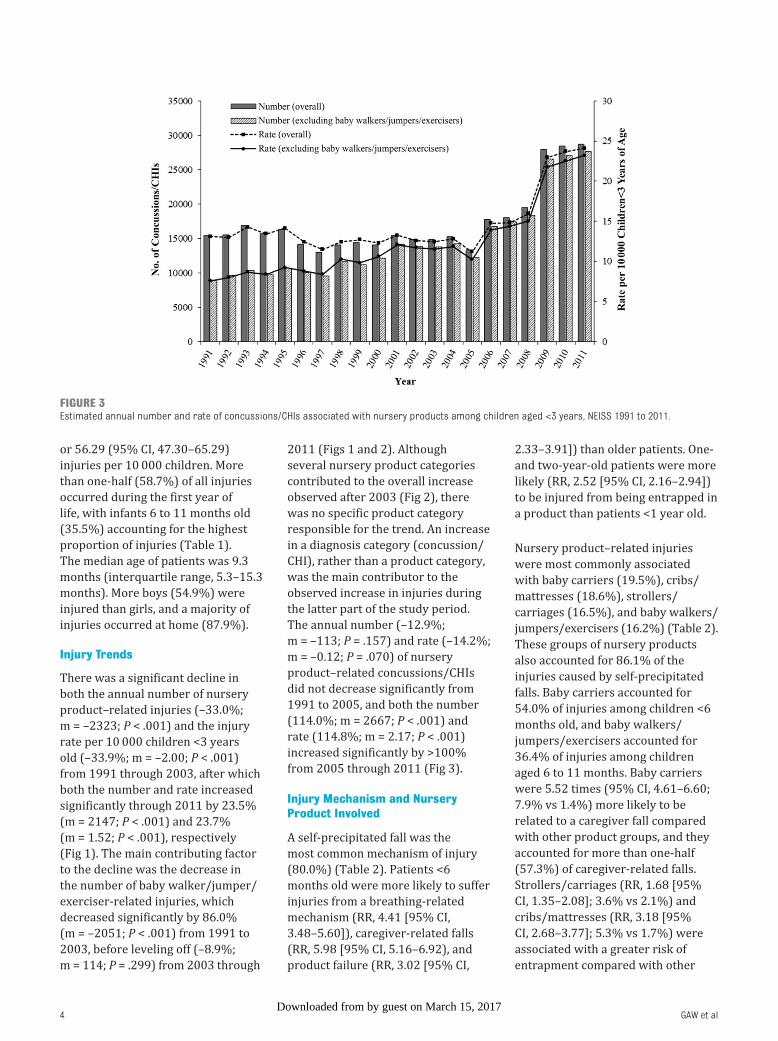
or 56.29 (95% CI, 47.30–65.29)
injuries per 10 000 children. More
than one-half (58.7%) of all injuries
occurred during the first year of
life, with infants 6 to 11 months old
(35.5%) accounting for the highest
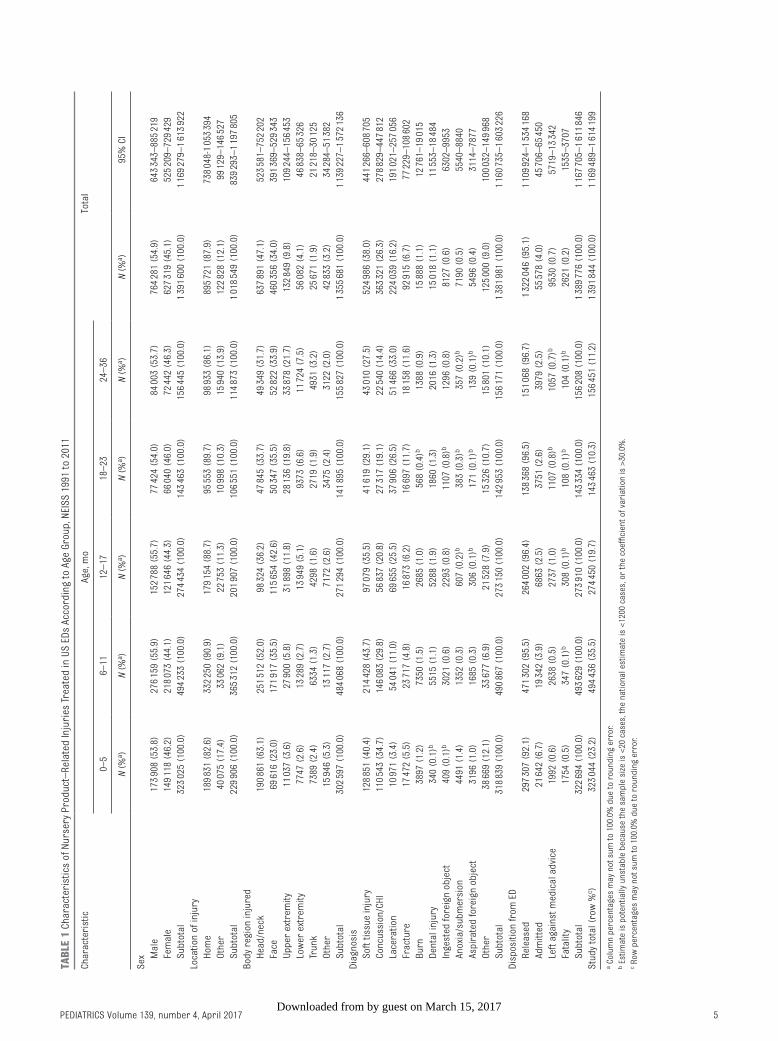
proportion of injuries ( Table 1).
The median age of patients was 9.3
months (interquartile range, 5.3–15.3
months). More boys (54.9%) were
injured than girls, and a majority of
injuries occurred at home (87.9%).
Injury Trends
There was a significant decline in
both the annual number of nursery
product–related injuries (–33.0%;
m = –2323; P < .001) and the injury
rate per 10 000 children <3 years
old (–33.9%; m = –2.00; P < .001)
from 1991 through 2003, after which
both the number and rate increased
significantly through 2011 by 23.5%
(m = 2147; P < .001) and 23.7%
(m = 1.52; P < .001), respectively
( Fig 1). The main contributing factor
to the decline was the decrease in
the number of baby walker/jumper/
exerciser-related injuries, which
decreased significantly by 86.0%
(m = –2051; P < .001) from 1991 to
2003, before leveling off (–8.9%;
m = 114; P = .299) from 2003 through
2011 ( Figs 1 and 2). Although
several nursery product categories
contributed to the overall increase
observed after 2003 ( Fig 2), there
was no specific product category
responsible for the trend. An increase
in a diagnosis category (concussion/
CHI), rather than a product category,
was the main contributor to the
observed increase in injuries during
the latter part of the study period.
The annual number (–12.9%;
m = –113; P = .157) and rate (–14.2%;
m = –0.12; P = .070) of nursery
product–related concussions/CHIs
did not decrease significantly from
1991 to 2005, and both the number
(114.0%; m = 2667; P < .001) and
rate (114.8%; m = 2.17; P < .001)
increased significantly by >100%
from 2005 through 2011 (Fig 3).
Injury Mechanism and Nursery Product Involved
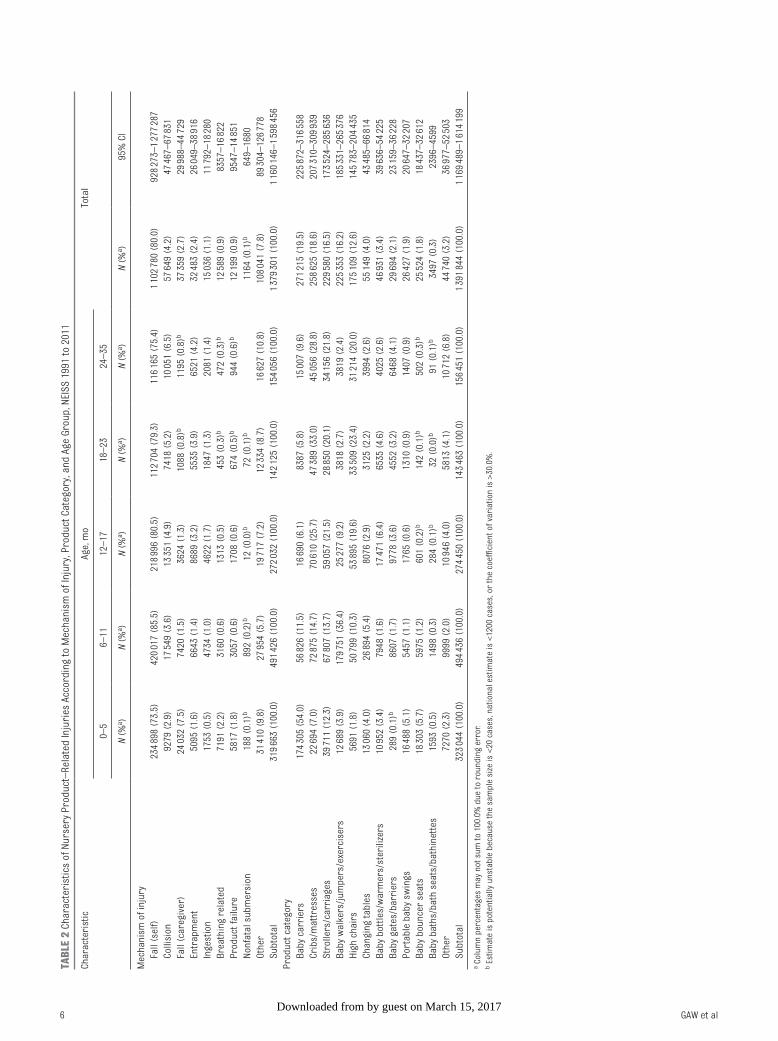
A self-precipitated fall was the
most common mechanism of injury
(80.0%) ( Table 2). Patients <6
months old were more likely to suffer
injuries from a breathing-related
mechanism (RR, 4.41 [95% CI,
3.48–5.60]), caregiver-related falls
(RR, 5.98 [95% CI, 5.16–6.92), and
product failure (RR, 3.02 [95% CI,
2.33–3.91]) than older patients. One-
and two-year-old patients were more
likely (RR, 2.52 [95% CI, 2.16–2.94])
to be injured from being entrapped in
a product than patients <1 year old.
Nursery product–related injuries
were most commonly associated
with baby carriers (19.5%), cribs/
mattresses (18.6%), strollers/
carriages (16.5%), and baby walkers/
jumpers/exercisers (16.2%) ( Table 2).
These groups of nursery products
also accounted for 86.1% of the
injuries caused by self-precipitated
falls. Baby carriers accounted for
54.0% of injuries among children <6
months old, and baby walkers/
jumpers/exercisers accounted for
36.4% of injuries among children
aged 6 to 11 months. Baby carriers
were 5.52 times (95% CI, 4.61–6.60;
7.9% vs 1.4%) more likely to be
related to a caregiver fall compared
with other product groups, and they
accounted for more than one-half
(57.3%) of caregiver-related falls.
Strollers/carriages (RR, 1.68 [95%
CI, 1.35–2.08]; 3.6% vs 2.1%) and
cribs/mattresses (RR, 3.18 [95%
CI, 2.68–3.77]; 5.3% vs 1.7%) were
associated with a greater risk of
entrapment compared with other
4
FIGURE 3Estimated annual number and rate of concussions/CHIs associated with nursery products among children aged <3 years, NEISS 1991 to 2011.
by guest on March 15, 2017Downloaded from
PEDIATRICS Volume 139 , number 4 , April 2017 5
TABL
E 1
Ch
arac
teri
stic
s of
Nu
rser
y P
rod
uct
–R
elat
ed In
juri
es T
reat
ed in
US
ED
s Ac
cord
ing
to A
ge G
rou
p, N
EIS
S 1
991
to 2
011
Ch
arac
teri
stic
Age,
mo
Tota
l
0–5
6–11
12–
1718
–23
24–
36
N (
%a )
N (
%a )
N (
%a )
N (
%a )
N (
%a )
N (
%a )
95%
CI
Sex
M
ale
173
908
(53.
8)27
6 15
9 (5
5.9)
152
788
(55.
7)77
424
(54
.0)
84 0
03 (
53.7
)76
4 28
1 (5
4.9)
643
343–
885
219
Fe
mal
e14
9 11
8 (4
6.2)
218
073
(44.
1)12
1 64
6 (4
4.3)
66 0
40 (
46.0
)72
442
(46
.3)
627
319
(45.
1)52
5 20
9–72
9 42
9
S
ub
tota
l32
3 02
5 (1
00.0
)49
4 23
3 (1
00.0
)27
4 43
4 (1
00.0
)14
3 46
3 (1
00.0
)15
6 44
5 (1
00.0
)1
391
600
(100
.0)
1 16
9 27
9–1
613
922
Loca
tion
of
inju
ry
H
ome
189
831
(82.
6)33
2 25
0 (9
0.9)
179
154
(88.
7)95
553
(89
.7)
98 9
33 (
86.1
)89
5 72
1 (8
7.9)
738
048-
1 05
3 39
4
O
ther
40 0
75 (
17.4
)33
062
(9.
1)22
753
(11
.3)
10 9
98 (
10.3
)15
940
(13
.9)
122
828
(12.
1)99
129
–14
6 52
7
S
ub
tota
l22
9 90
6 (1
00.0
)36
5 31
2 (1
00.0
)20
1 90
7 (1
00.0
)10
6 55
1 (1
00.0
)11
4 87
3 (1
00.0
)1
018
549
(100
.0)
839
293–
1 19
7 80
5
Bod
y re
gion
inju
red
H
ead
/nec
k19
0 86
1 (6
3.1)
251
512
(52.
0)98
324
(36
.2)
47 8
45 (
33.7
)49
349
(31
.7)
637
891
(47.
1)52
3 58
1–75
2 20
2
Fa
ce69
616
(23
.0)
171
917
(35.
5)11
5 65
4 (4
2.6)
50 3
47 (
35.5
)52
822
(33
.9)
460
356
(34.
0)39
1 36
9–52
9 34
3
U
pp
er e
xtre
mit
y11
037
(3.
6)27
900
(5.
8)31
898
(11
.8)
28 1
36 (
19.8
)33
878
(21
.7)
132
849
(9.8
)10
9 24
4–15
6 45
3
Lo
wer
ext
rem
ity
7747
(2.
6)13
289
(2.
7)13
949
(5.
1)93
73 (
6.6)
11 7
24 (
7.5)
56 0
82 (
4.1)
46 8
38–
65 3
26
Tr
un
k73
89 (
2.4)
6334
(1.
3)42
98 (
1.6)
2719
(1.
9)49
31 (
3.2)
25 6
71 (
1.9)
21 2
18–
30 1
25
O
ther
15 9
46 (
5.3)
13 1
17 (
2.7)
7172
(2.
6)34
75 (
2.4)
3122
(2.
0)42
833
(3.
2)34
284
–51
382
S
ub
tota
l30
2 59
7 (1
00.0
)48
4 06
8 (1
00.0
)27
1 29
4 (1
00.0
)14
1 89
5 (1
00.0
)15
5 82
7 (1
00.0
)1
355
681
(100
.0)
1 13
9 22
7–1
572
136
Dia
gnos
is
S
oft
tiss
ue
inju
ry12
8 85
1 (4
0.4)
214
428
(43.
7)97
079
(35
.5)
41 6
19 (
29.1
)43
010
(27
.5)
524
986
(38.
0)44
1 26
6–60
8 70
5
C
oncu
ssio
n/C
HI
110
543
(34.
7)14
6 08
3 (2
9.8)
56 8
37 (
20.8
)27
317
(19
.1)
22 5
40 (
14.4
)36
3 32
1 (2
6.3)
278
829–
447
812
La
cera
tion
10 9
71 (
3.4)
54 0
41 (
11.0
)69
655
(25
.5)
37 9
06 (
26.5
)51
466
(33
.0)
224
039
(16.
2)19
1 02
1–25
7 05
6
Fr
actu
re17
472
(5.
5)23
717
(4.
8)16
873
(6.
2)16
697
(11
.7)
18 1
58 (
11.6
)92
915
(6.
7)77
229
–10
8 60
2
B
urn
3897
(1.
2)73
50 (
1.5)
2685
(1.
0)56
8 (0
.4)b
1388
(0.
9)15
888
(1.
1)12
761
–19
015
D
enta
l in
jury
340
(0.1
)b55
15 (
1.1)
5288
(1.
9)18
60 (
1.3)
2016
(1.
3)15
018
(1.
1)11
553
–18
484
In
gest
ed f
orei
gn o
bje
ct40
9 (0
.1)b
3021
(0.
6)22
93 (
0.8)
1107
(0.
8)b
1296
(0.
8)81
27 (
0.6)
6302
–99
53
An
oxia
/su
bm
ersi
on44
91 (
1.4)
1352
(0.
3)60
7 (0
.2)b
383
(0.3
)b35
7 (0
.2)b
7190
(0.
5)55
40–
8840
As
pir
ated
for
eign
ob
ject
3196
(1.
0)16
85 (
0.3)
306
(0.1
)b17
1 (0
.1)b
139
(0.1
)b54
96 (
0.4)
3114
–78
77
O
ther
38 6
69 (
12.1
)33
677
(6.
9)21
528
(7.
9)15
326
(10
.7)
15 8
01 (
10.1
)12
5 00
0 (9
.0)
100
032–
149
968
S
ub
tota
l31
8 83
9 (1
00.0
)49
0 86
7 (1
00.0
)27
3 15
0 (1
00.0
)14
2 95
3 (1
00.0
)15
6 17
1 (1
00.0
)1
381
981
(100
.0)
1 16
0 73
5–1
603
226
Dis
pos
itio
n f
rom
ED
R
elea
sed
297
307
(92.
1)47
1 30
2 (9
5.5)
264
002
(96.
4)13
8 36
8 (9
6.5)
151
068
(96.
7)1
322
046
(95.
1)1
109
924–
1 53
4 16
8
Ad
mit
ted
21 6
42 (
6.7)
19 3
42 (
3.9)
6863
(2.
5)37
51 (
2.6)
3979
(2.
5)55
578
(4.
0)45
706
–65
450
Le
ft a
gain
st m
edic
al a
dvi
ce19
92 (
0.6)
2638
(0.
5)27
37 (
1.0)
1107
(0.
8)b
1057
(0.
7)b
9530
(0.
7)57
19–
13 3
42
Fa
talit
y17
54 (
0.5)
347
(0.1
)b30
8 (0
.1)b
108
(0.1
)b10
4 (0
.1)b
2621
(0.
2)15
35–
3707
S
ub
tota
l32
2 69
4 (1
00.0
)49
3 62
9 (1
00.0
)27
3 91
0 (1
00.0
)14
3 33
4 (1
00.0
)15
6 20
8 (1
00.0
)1
389
776
(100
.0)
1 16
7 70
5–1
611
846
Stu
dy
tota
l (ro
w %
c )32
3 04
4 (2
3.2)
494
436
(35.
5)27
4 45
0 (1
9.7)
143
463
(10.
3)15
6 45
1 (1
1.2)
1 39
1 84
4 (1
00.0
)1
169
489–
1 61
4 19
9
a C
olu
mn
per
cen
tage
s m
ay n
ot s
um
to
100.
0% d
ue
to r
oun
din
g er
ror.
b E
stim
ate
is p
oten
tial
ly u
nst
able
bec
ause
th
e sa
mp
le s
ize
is <
20 c
ases
, th
e n
atio
nal
est
imat
e is
<12
00 c
ases
, or
the
coef
fi ci
ent
of v
aria
tion
is >
30.0
%.
c R
ow p
erce
nta
ges
may
not
su
m t
o 10
0.0%
du
e to
rou
nd
ing
erro
r.
by guest on March 15, 2017Downloaded from
GAW et al 6
TABL
E 2
Ch
arac
teri
stic
s of
Nu
rser
y P
rod
uct
–R
elat
ed In
juri
es A
ccor
din
g to
Mec
han
ism
of
Inju
ry, P
rod
uct
Cat
egor
y, a
nd
Age
Gro
up
, NEI
SS
199
1 to
201
1
Ch
arac
teri
stic
Age,
mo
Tota
l
0–5
6–11
12–
1718
–23
24–
35
N (
%a )
N (
%a )
N (
%a )
N (
%a )
N (
%a )
N (
%a )
95%
CI
Mec
han
ism
of
inju
ry
Fa
ll (s
elf)
234
898
(73.
5)42
0 01
7 (8
5.5)
218
996
(80.
5)11
2 70
4 (7
9.3)
116
165
(75.
4)1
102
780
(80.
0)92
8 27
3–1
277
287
C
ollis
ion
9279
(2.
9)17
549
(3.
6)13
351
(4.
9)74
18 (
5.2)
10 0
51 (
6.5)
57 6
49 (
4.2)
47 4
67–
67 8
31
Fa
ll (c
areg
iver
)24
032
(7.
5)74
20 (
1.5)
3624
(1.
3)10
88 (
0.8)
b11
95 (
0.8)
b37
359
(2.
7)29
988
–44
729
En
trap
men
t50
95 (
1.6)
6643
(1.
4)86
89 (
3.2)
5535
(3.
9)65
21 (
4.2)
32 4
83 (
2.4)
26 0
49–
38 9
16
In
gest
ion
1753
(0.
5)47
34 (
1.0)
4622
(1.
7)18
47 (
1.3)
2081
(1.
4)15
036
(1.
1)11
792
–18
280
B
reat
hin
g re
late
d71
91 (
2.2)
3160
(0.
6)13
13 (
0.5)
453
(0.3
)b47
2 (0
.3)b
12 5
89 (
0.9)
8357
–16
822
P
rod
uct
fai
lure
5817
(1.
8)30
57 (
0.6)
1708
(0.
6)67
4 (0
.5)b
944
(0.6
)b12
199
(0.
9)95
47–
14 8
51
N
onfa
tal s
ub
mer
sion
188
(0.1
)b89
2 (0
.2)b
12 (
0.0)
b72
(0.
1)b
1164
(0.
1)b
649–
1680
O
ther
31 4
10 (
9.8)
27 9
54 (
5.7)
19 7
17 (
7.2)
12 3
34 (
8.7)
16 6
27 (
10.8
)10
8 04
1 (7
.8)
89 3
04–
126
778
S
ub
tota
l31
9 66
3 (1
00.0
)49
1 42
6 (1
00.0
)27
2 03
2 (1
00.0
)14
2 12
5 (1
00.0
)15
4 05
6 (1
00.0
)1
379
301
(100
.0)
1 16
0 14
6–1
598
456
Pro
du
ct c
ateg
ory
B
aby
carr
iers
174
305
(54.
0)56
826
(11
.5)
16 6
90 (
6.1)
8387
(5.
8)15
007
(9.
6)27
1 21
5 (1
9.5)
225
872–
316
558
C
rib
s/m
attr
esse
s22
694
(7.
0)72
875
(14
.7)
70 6
10 (
25.7
)47
389
(33
.0)
45 0
56 (
28.8
)25
8 62
5 (1
8.6)
207
310–
309
939
S
trol
lers
/car
riag
es39
711
(12
.3)
67 8
07 (
13.7
)59
057
(21
.5)
28 8
50 (
20.1
)34
156
(21
.8)
229
580
(16.
5)17
3 52
4–28
5 63
6
B
aby
wal
kers
/ju
mp
ers/
exer
cise
rs12
689
(3.
9)17
9 75
1 (3
6.4)
25 2
77 (
9.2)
3818
(2.
7)38
19 (
2.4)
225
353
(16.
2)18
5 33
1–26
5 37
6
H
igh
ch
airs
5691
(1.
8)50
799
(10
.3)
53 8
95 (
19.6
)33
509
(23
.4)
31 2
14 (
20.0
)17
5 10
9 (1
2.6)
145
783–
204
435
C
han
gin
g ta
ble
s13
060
(4.
0)26
894
(5.
4)80
76 (
2.9)
3125
(2.
2)39
94 (
2.6)
55 1
49 (
4.0)
43 4
85–
66 8
14
B
aby
bot
tles
/war
mer
s/st
erili
zers
10 9
52 (
3.4)
7948
(1.
6)17
471
(6.
4)65
35 (
4.6)
4025
(2.
6)46
931
(3.
4)39
636
–54
225
B
aby
gate
s/b
arri
ers
289
(0.1
)b86
07 (
1.7)
9778
(3.
6)45
52 (
3.2)
6468
(4.
1)29
694
(2.
1)23
159
–36
228
P
orta
ble
bab
y sw
ings
16 4
88 (
5.1)
5457
(1.
1)17
65 (
0.6)
1310
(0.
9)14
07 (
0.9)
26 4
27 (
1.9)
20 6
47–
32 2
07
B
aby
bou
nce
r se
ats
18 3
03 (
5.7)
5975
(1.
2)60
1 (0
.2)b
142
(0.1
)b50
2 (0
.3)b
25 5
24 (
1.8)
18 4
37–
32 6
12
B
aby
bat
hs/
bat
h s
eats
/bat
hin
ette
s15
93 (
0.5)
1498
(0.
3)28
4 (0
.1)b
32 (
0.0)
b91
(0.
1)b
3497
(0.
3)23
96–
4599
O
ther
7270
(2.
3)99
99 (
2.0)
10 9
46 (
4.0)
5813
(4.
1)10
712
(6.
8)44
740
(3.
2)36
977
–52
503
S
ub
tota
l32
3 04
4 (1
00.0
)49
4 43
6 (1
00.0
)27
4 45
0 (1
00.0
)14
3 46
3 (1
00.0
)15
6 45
1 (1
00.0
)1
391
844
(100
.0)
1 16
9 48
9–1
614
199
a C
olu
mn
per
cen
tage
s m
ay n
ot s
um
to
100.
0% d
ue
to r
oun
din
g er
ror.
b E
stim
ate
is p
oten
tial
ly u
nst
able
bec
ause
th
e sa
mp
le s
ize
is <
20 c
ases
, nat
ion
al e
stim
ate
is <
1200
cas
es, o
r th
e co
effi
cien
t of
var
iati
on is
>30
.0%
.
by guest on March 15, 2017Downloaded from

PEDIATRICS Volume 139 , number 4 , April 2017
product categories. Product failure
accounted for 0.9% of injuries, and
almost one-half were associated with
baby carriers (29.9%) or strollers/
carriages (19.3%).
Body Region and Diagnosis
The head/neck was the most
common body region injured
(47.1%), followed by the face
(34.0%) ( Table 1). The proportion
of head/neck injuries decreased
with increasing age, whereas the
proportion of upper and lower
extremity injuries increased with
increasing age. Patients <1 year old
were more likely (RR, 1.63 [95% CI,
1.57–1.70]) to sustain an injury to the
head/neck, and patients aged
≥1 year were more likely (RR, 3.33
[95% CI, 3.00–3.71]) to sustain
an injury to the upper extremity
compared with the other age group.
The body region injured was not only
associated with patient age but also
with nursery product category and
injury mechanism. Baby carriers,
changing tables, portable baby
swings, and baby bouncer seats
combined were more likely (RR,
1.47 [95% CI, 1.41–1.54]; 61.6%
vs 41.8%) to be associated with
injuries to the head/neck compared
with the other product groups.
Strollers/carriages (RR, 1.34 [95%
CI, 1.27–1.41]; 43.0% vs 32.1%) and
baby bottles/warmers/sterilizers
(RR, 1.92 [95% CI, 1.78–2.07];
63.2% vs 32.9%) were more likely
to be associated with facial injuries
compared with other product groups.
Entrapment was 6.70 (95% CI, 6.15–
7.31; 56.6% vs 8.5%) times more
likely to cause an upper extremity
injury than other injury mechanisms.
Soft tissue injury (38.0%) and
concussion/CHI (26.3%) were the
most common diagnoses ( Table 1).
The proportion of injuries accounted
for by concussion/CHI increased
during the study period from
18.6% in 1991 to 41.9% in 2011.
The proportion of concussions/
CHIs decreased with increasing age,
and the proportion of lacerations
increased with increasing age.
Patients ≥18 months old (RR, 2.17
[95% CI, 1.92–2.46]) were more
likely to be diagnosed with a fracture,
whereas patients <18 months old
(RR, 1.74 [95% CI, 1.62–1.87]) were
more likely to be diagnosed with
a concussion/CHI compared with
the other age group. The face was
7.00 (95% CI, 6.25–7.85; 38.2% vs
5.4%) times more likely to sustain
a laceration; the upper and lower
extremities (RR, 13.75 [95% CI,
11.91–15.87]; 34.0% vs 2.5%)
combined were more likely to sustain
a fracture compared with other body
regions.
Disposition From EDs and Fatalities
Most (95.1%) children presenting
to an ED with a nursery product–
related injury were treated and
released ( Table 1). Of the patients
admitted to the hospital (4.0%),
73.7% were <1 year old. Patients
<6 months old were 2.11 times
(95% CI, 1.81–2.46) more likely to
be hospitalized than patients ≥6
months old. Baby carriers (25.8%),
cribs/mattresses (19.5%), and baby
walkers/jumpers/exercisers (18.7%)
were most commonly associated with
injuries requiring hospital admission.
The breathing-related and nonfatal
submersion mechanisms of injury
combined were 6.56 (95% CI, 5.03–
8.55; 24.9% vs 3.8%) times more
likely to lead to hospitalization than
the other mechanisms.
Of the 0.2% of injuries that resulted
in death, 80.2% were among
patients <1 year old, 86.9% were
associated with the breathing-
related mechanism, and 73.4% were
associated with cribs/mattresses.
Baby carriers were associated with
an additional 10.1% of deaths.
DISCUSSION
On average, >66 000 nursery
product–related injuries were treated
in the US EDs annually from 1991
through 2011. Despite the significant
decline in both the number and rate
of nursery product–related injuries
from 1991through 2003, primarily
attributable to the decline in baby
walker/jumper/exerciser-related
injuries, both the number and rate
of injuries increased significantly
from 2003 through 2011. Part of this
increase was driven by an increase in
the number and rate of concussions/
CHIs, which is likely attributable
to multiple factors, including
heightened awareness about
concussions during recent years
among parents, child caregivers,
and health professionals. These
findings agree with a recent study,
which reported a >200% increase
in traumatic brain injuries among
children aged <5 years occurring
in the home from 1991 to 2012. 32
Further research is needed to better
define the factors contributing to the
observed increase in concussions/
CHIs.
From 2009 to 2012, nursery products
were the leading children’s product
category recalled in the United
States, 1 – 4 and it is estimated that
up to 80% of recalled children’s
products remain in consumer
households after a recall.6 Since
enactment of the Consumer Product
Safety Improvement Act of 2008,
which (among other requirements)
mandated safety standards for all
durable infant or toddler products, 33
product recalls have begun to
decline. 6 However, components of the
law are continuing to be phased-in,
and its effects on nursery product–
related injuries is unlikely to be
reflected in the results of the present
study. Future research is warranted
to assess the effects of this important
consumer product legislation on
nursery product–related injuries to
children.
Given the success of interventions
to prevent injuries associated
with baby walkers, including
strengthened safety standards and
new safer product design, 18, 20 similar
7by guest on March 15, 2017Downloaded from
GAW et al
efforts should be used to address
injuries associated with other
nursery products, especially the top
contributors to pediatric morbidity
in this study: baby carriers, cribs/
mattresses, and strollers/carriages.
Baby carriers were the leading
source of nursery product–related
injuries and hospital admissions.
Baby carrier–related falls involving
caregivers may lead to more severe
injuries due to factors such as
the caregiver falling on top of the
child or propelling the child with
additional momentum during a fall. 34
To reduce the likelihood of these
injuries, caregivers should attempt
to keep living spaces free of objects
that pose a tripping hazard. Child
caregivers using a carrier should
minimize the use of stairs and
refrain from carrying other objects
while on the stairs, using the free
hand to grasp the handrail. 35 Infants
should be matched to carriers that
are appropriate for their size and
weight.36
Nearly one-third of product failures
were associated with baby carriers,
which included instances of handle
detachment and product collapse.
Baby carrier seats, especially
detachable car seats, should be
carefully inspected before infant
transport. Any supporting devices
and carrier handles should be
locked into position before moving
an infant or child. 37 Carrier seats also
pose an additional hazard of injuries
due to unattended falls, which
are associated with placement
of seats on elevated surfaces. 34, 38
Infants in carrier seats should
always be secured using the safety
harness straps provided, and carriers
should be equipped with nonskid
undersides. Caregivers should
not place carrier seats on slippery
surfaces, such as glass tables, or on
soft surfaces, such as beds, where a
tip over could lead to suffocation. 37
Cribs/mattresses were the second
most common source of injury and
were associated with the majority of
nursery product–related fatalities.
Previous literature provides evidence
that cribs are a leading nursery
product associated with infant
mortality. 15, 22, 39 It is likely that
sudden unexpected infant death
accounted for many of these fatalities
in our study as well as in others.
Sleep environment hazards play a
key role in infant injury, especially
sudden unexpected infant death,
and health care practitioners should
counsel caregivers to not place
bumper pads or soft objects, such
as blankets or pillows, in the crib
because of the risk of strangulation,
entrapment, and suffocation. 36, 37
Caregivers should only use the firm,
snugly fitting mattress designed
for their crib and never use
supplemental mattresses, which may
increase the risk of entrapment and
suffocation.
Crib bumper pads have been
marketed as protective barriers to
reduce entrapment injuries, and
some organizations, such as the
Juvenile Products Manufacturers
Association, maintain that bumper
pads are safe. 40 However, multiple
fatalities attributable to bumper pad–
related suffocation or strangulation
have been reported. 41, 42 Since 2011,
the American Academy of Pediatrics
has recommended against bumper
pad use due to the risk of injury. 43, 44
The city of Chicago 45 and the state
of Maryland 46 have taken these
recommendations further, banning
the sale of bumper pads. Despite
these public policy efforts, bumper
pads can still be found in Chicago, 47
and more needs to be done at the
national level to limit the sale and use
of crib bumper pads.
Strollers/carriages were the
third-leading source of nursery
product–related injuries. Tip overs
and falls involving strollers have
been described as the predominant
mechanism of injury in the
literature, 12, 48, 49 underscoring the
need for caregivers to avoid taking
strollers on stairs, hanging objects
on stroller handles, and allowing
other children to play with or
hang onto a stroller while a child
is inside. 36 These measures should
be combined with safety belt use,
which previous studies suggest is low
among injured children.49 In a report
describing stroller-related injuries in
Queensland, Australia, researchers
noted that 8% of fall injuries were
due to the stroller rolling away
from the caregiver. 48 The injury risk
from stroller-roll-away could be
mitigated through the installation of
a “dead man brake, ” similar to those
on airport trolleys. Manufacturers
should be encouraged to place these
conditional braking systems on child
strollers and carriages.
Almost 90% of injuries occurred at
home, and 80% of injuries were due
to a fall. Therefore, prevention efforts
should focus on fall prevention in
the home setting. Strategies for
preventing falls include the following:
(1) use of products’ safety devices,
such as a strap or harness; (2)
appropriate adult supervision; and
(3) proper assembly/installation and
use of products, such as adjusting the
mattress height in a crib to prevent
a child from climbing out. We also
found that young children were more
likely to injure their head and neck or
be diagnosed with a concussion/CHI,
whereas older children were more
likely to injure an upper extremity or
be diagnosed with a laceration. This
finding is most like due to children’s
developmental changes and how
this development specifically affects
how they fall. Young children have
disproportionately large heads,
which provides a larger target for
injury and also raises their center
of gravity. These children tend to
lead with their head when they fall
and are unable to break their fall
with their arms because of lack of
coordination and strength. As they
get older, they use their arms more
effectively to protect their heads but
have more upper extremity injuries
as a result. 32
8by guest on March 15, 2017Downloaded from
PEDIATRICS Volume 139 , number 4 , April 2017
Several limitations exist in this study.
The number of nursery product–
related injuries was underestimated
because only cases treated in EDs
were included. Injuries treated
in urgent care centers and other
non-ED medical facilities are not
captured by the NEISS. Fatalities
are also underreported in the
NEISS because prehospital deaths
may not be transported to an ED,
and fatal patient outcomes after
hospital admission are not captured
in the NEISS database. The findings
of this study, therefore, may not
be representative of all nursery
product–related injuries. In addition,
NEISS case narratives are limited by
the amount of detail included in ED
medical records. Narratives may not
consistently provide information
about injury mechanism, factors
contributing to the injury event,
and which product was primarily
involved in the injury if multiple
products were listed. Information
regarding socioeconomic status was
unavailable. It is possible that some
of these injuries were the result
of child maltreatment. Because
multivariate analyses were not
performed, our results do not reflect
the potential influence of covariates
on the relationships examined.
Despite these limitations, the
strength of this study lies in its use
of a large, nationally representative
sample over a period of 21 years
that includes product-specific
information.
CONCLUSIONS
To our knowledge, this study
is the first to use a nationally
representative database to examine
pediatric injuries associated with
a wide array of nursery products.
Although nursery product–related
injuries declined from 1991 to
2003, primarily due to successful
injury prevention efforts with baby
walkers, these injuries increased
during the final 8 years of the study
(2003–2011). Greater efforts are
warranted to prevent injuries
associated with other nursery
products, especially baby carriers,
cribs, and strollers. Prevention of falls
and concussions/CHIs associated
with nursery products also deserves
special attention. Future studies that
further examine the circumstances of
nursery product–related injuries and
evaluate current safety interventions
are needed to help inform the
development of effective prevention
strategies.
REFERENCES
1. Kids In Danger. The year of the nursery
product recall: a look at children’s
product recalls in 2009 and changes in
children’s product safety. Available at:
www. kidsindanger. org/ docs/ reports/
2009_ Recall_ Report. pdf. Accessed May
26, 2016
2. Kids In Danger. Moving towards safety:
a look at product recalls in 2010 and
changes in children’s product safety.
Available at: www. kidsindanger. org/
docs/ reports/ 2010_ Movingtowardsafet
y. pdf. Accessed May 24, 2016
3. Kids In Danger. A measure of safety:
children’s product recalls in 2011.
Available at: www. kidsindanger.
org/ docs/ reports/ A_ Measure_ of_
Safety032612. pdf. Accessed May 24, 2016
4. Kids in Danger. Safe sleep, safe play:
children’s product recalls in 2012.
Available at: www. kidsindanger. org/
docs/ reports/ SafeSleepSafePlay
021313. pdf. Accessed May 24, 2016
5. Durrett J. After the recall: dangerous
products remain in homes. Children’s
product recalls in 2013 and recall
effectiveness of 2012 recalls. Available
at: www. kidsindanger. org/ docs/
reports/ KID_ Recall_ Report_ 2013_
Final. pdf. Accessed May 24, 2016
6. Durrett J. A decade of data: an
in-depth look at 2014 and a
ten-year retrospective on children’s
product recalls. Available at: www.
kidsindanger. org/ docs/ research/ 2015_
KID_ Recall_ Report. pdf. Accessed May
24, 2016
7. Mack KA, Gilchrist J, Ballesteros
MF. Injuries among infants treated
in emergency departments in the
United States, 2001-2004. Pediatrics.
2008;121(5):930–937
8. Byard RW, Charlwood C. Lethal head
entrapment—a problem characteristic
of early childhood. J Forensic Leg Med.
2009;16(6):340–342
9. Centers for Disease Control and
Prevention (CDC). Suffocation deaths
associated with use of infant sleep
positioners—United States, 1997-
2011. MMWR Morb Mortal Wkly Rep.
2012;61(46):933–937
10. Chowdhury RT. Injuries and deaths
associated with nursery products
among children younger than age
fi ve. US Consumer Product Safety
Commission. Available at: www.
cpsc. gov/ Global/ Research- and-
Statistics/ Injury- Statistics/ Toys/
NurseryProductsAn nualReport2015.
pdf. Accessed May 24, 2016
11. Watson W, Ozanne-Smith J, Begg S,
Imberger A, Ashby K, Stathakis V.
9
ABBREVIATIONS
CHI: closed head injury
CI: confidence interval
CPSC: United States Consumer
Product Safety
Commission
ED: emergency department
NEISS: National Electronic Injury
Surveillance System
RR: relative risk
FINANCIAL DISCLOSURE: The authors have indicated they have no fi nancial relationships relevant to this article to disclose.
FUNDING: No external funding.
POTENTIAL CONFLICT OF INTEREST: The authors have indicated they have no potential confl icts of interest to disclose.
by guest on March 15, 2017Downloaded from

GAW et al
Injuries associated with nursery
furniture and bunk beds. Available
at: www. monash. edu/__ data/ assets/
pdf_ fi le/ 0017/ 217205/ muarc123. pdf.
Accessed October 25, 2016
12. Powell EC, Jovtis E, Tanz RR. Incidence
and description of stroller-related
injuries to children. Pediatrics.
2002;110(5). Available at: www.
pediatrics. org/ cgi/ content/ full/ 110/ 5/
e62
13. Tripathi M, Tyebally A, Feng JX, Chong
SL. A review of stroller-related and
pram-related injuries to children in
Singapore [published online ahead
of print February 29, 2016]. Inj Prev.
10.1136/injuryprev-2015-041805
14. Vilke GM, Stepanski BM, Ray LU,
Lutz MW, Murrin PA, Chan TC. 9-1-1
Responses for shopping cart and
stroller injuries. Pediatr Emerg Care.
2004;20(10):660–663
15. Yeh ES, Rochette LM, McKenzie LB,
Smith GA. Injuries associated with
cribs, playpens, and bassinets among
young children in the US, 1990-2008.
Pediatrics. 2011;127(3):479–486
16. Chiaviello CT, Christoph RA, Bond
GR. Infant walker-related injuries:
a prospective study of severity and
incidence. Pediatrics. 1994;93(6 pt
1):974–976
17. Fazen LE III, Felizberto PI. Baby walker
injuries. Pediatrics. 1982;70(1):106–109
18. Rodgers GB, Leland EW. An evaluation
of the effectiveness of a baby
walker safety standard to prevent
stair-fall injuries. J Safety Res.
2005;36(4):327–332
19. Smith GA, Bowman MJ, Luria JW,
Shields BJ. Babywalker-related injuries
continue despite warning labels
and public education. Pediatrics.
1997;100(2). www. pediatrics. org/ cgi/
content/ full/ 100/ 2/ E1
20. Shields BJ, Smith GA. Success in the
prevention of infant walker-related
injuries: an analysis of national data,
1990-2001. Pediatrics. 2006;117(3).
Available at: www. pediatrics. org/ cgi/
content/ full/ 117/ 3/ e452
21. Keim SA, Fletcher EN, TePoel MR,
McKenzie LB. Injuries associated with
bottles, pacifi ers, and sippy cups in the
United States, 1991-2010. Pediatrics.
2012;129(6):1104–1110
22. Pollack-Nelson C, Drago D. Hazards
associated with common nursery
products. In: Liller KD, ed. Injury
Prevention for Children and
Adolescents: Research, Practice, and
Advocacy. Washington, DC: American
Public Health Association; 2012
23. US Consumer Product Safety
Commission. National Electronic Injury
Surveillance System (NEISS). Available
at: www. cpsc. gov/ en/ Research–Statisti
cs/ NEISS- Injury- Data/ . Accessed May
24, 2016
24. US Consumer Product Safety
Commission. 2016 NEISS product code
comparability table. Available at: www.
cpsc. gov/ Media/ Documents/ Research–
Statisti cs/ NEISS- Injury- Data/ Product-
Code- Comparability- Table/ . Accessed
May 24, 2016
25. Schroeder T, Ault K. The NEISS sample
(design and implementation) 1997
to present. US Consumer Product
Safety Commission. Available at:
www. cpsc. gov/ Media/ Documents/
Research–Statisti cs/ NEISS- Injury- Data/
NEISS- Sample- Design- 1997- Present/ .
Accessed April 11, 2016
26. Schroeder T, Ault K. The NEISS sample
(design and implementation) from
1979 to 1996. US Consumer Product
Safety Commission. Available at: www.
cpsc. gov/ Media/ Documents/ Research–
Statisti cs/ NEISS- Injury- Data/ NEISS-
Sample- Design- 1979- 1996/ . Accessed
April 11, 2016
27. US Consumer Product Safety
Commission. National Electronic Injury
Surveillance System Coding Manual. US
Consumer Product Safety Commission.
Available at: www. cpsc. gov/ Media/
Documents/ Research–Statisti cs/ NEISS-
Injury- Data/ NEISS- Coding- Manual/ .
Accessed April 11, 2016
28. US Consumer Product Safety
Commission. The National Electronic
Injury Surveillance System: a tool for
researchers. Available at: www. cpsc. gov/
Media/ Documents/ Research–Statisti
cs/ NEISS- Injury- Data/ NEISS- A- Tool- For-
Researchers/ . Accessed May 24, 2016
29. US Census Bureau. Intercensal
estimates of the United States
population by age and sex, 1990-2000:
all months. Available at: www. census.
gov/ popest/ data/ intercensal/ national/
index. html. Accessed April 11, 2016
30. US Census Bureau. Intercensal
estimates of the resident population
by single year of age and sex for states
and the United States: April 1, 2000 to
July 1, 2010. Available at: www. census.
gov/ popest/ data/ intercensal/ state/
fi les/ ST- EST00INT- AGESEX. csv. Accessed
April 11, 2016
31. US Census Bureau. Annual estimates of
the resident population by single year
of age and sex for the United States:
April 1, 2010 to July 1, 2014. US Census
Bureau. Available at: http:// factfi nder.
census. gov/ faces/ tableservices/ jsf/
pages/ productview. xhtml? src= bkmk.
Accessed April 11, 2016
32. Kamboj A, Chounthirath T, Xiang H,
Smith GA. Traumatic brain injuries
associated with consumer products
at home among us children younger
than 5 years of age [published
online ahead of print September
6, 2016]. Clin Pediatr (Phila).
10.1177/0009922816664064
33. Public Law 110-314. Consumer Product
Safety Improvement Act of 2008.
Available at: www. cpsc. gov/ PageFiles/
129663/ cpsia. pdf. Accessed May 24, 2016
34. Greenberg RA, Bolte RG, Schunk
JE. Infant carrier-related falls: an
unrecognized danger. Pediatr Emerg
Care. 2009;25(2):66–68
35. Zielinski AE, Rochette LM, Smith
GA. Stair-related injuries to young
children treated in US emergency
departments, 1999-2008. Pediatrics.
2012;129(4):721–727
36. Center for Injury Research and Policy.
A guide for new parents: getting
your home ready for baby. Available
at: www. nationwidechildre ns. org/
Document/ Get/ 103644. Accessed May
24, 2016
37. US Consumer Product Safety
Commission. The safe nursery.
Available at: www. cpsc. gov/ Media/
Documents/ Safety- Education/ Safety-
Guides/ Babies- and- Kids/ 202/ . Accessed
May 24, 2016
38. Pollack-Nelson C. Fall and suffocation
injuries associated with in-home use
of car seats and baby carriers. Pediatr
Emerg Care. 2000;16(2):77–79
39. Shapiro-Mendoza CK, Kimball
M, Tomashek KM, Anderson RN,
Blanding S. US infant mortality trends
10by guest on March 15, 2017Downloaded from
PEDIATRICS Volume 139 , number 4 , April 2017
attributable to accidental suffocation
and strangulation in bed from 1984
through 2004: are rates increasing?
Pediatrics. 2009;123(2):533–539
40. Juvenile Products Manufacturers
Association. JPMA bumper statement.
Available at: www. jpma. org/ news/
news. asp? id= 261773& hh. Accessed
June 30, 2016
41. Scheers NJ, Woodard DW, Thach BT.
Crib bumpers continue to cause infant
deaths: a need for a new preventive
approach. J Pediatr. 2016;169:93–97.e1
42. Thach BT, Rutherford GW Jr, Harris
K. Deaths and injuries attributed to
infant crib bumper pads. J Pediatr.
2007;151(3):271–274, 274.e1–e3
43. Task Force on Sudden Infant Death
Syndrome, Moon RY. SIDS and other
sleep-related infant deaths: expansion
of recommendations for a safe infant
sleeping environment. Pediatrics.
2011;128(5):1030-1039
44. Task Force on Sudden Infant Death
Syndrome, Moon RY. Technical Report:
SIDS and other sleep-related infant
deaths: expansion of recommendations
for a safe infant sleeping environment.
Pediatrics. 2011;128(5). Available at:
www. pediatrics. org/ cgi/ content/ full/
128/ 5/ e1341
45. Balcer J, Cardenas GA. Amendment
of chapter 7-36 of municipal code by
adding new section 112 regarding
crib bumper pads. Available at: www.
cityofchicago. org/ content/ dam/ city/
depts/ bacp/ cribinfo/ cityclerkcribbump
er. pdf. Accessed May 24, 2016
46. Division of State Documents. Code
of Maryland 10.11.07: prohibition of
sale of baby bumper pads. Available
at: www. dsd. state. md. us/ comar/
SubtitleSearch. aspx? search= 10. 11. 07.
Accessed May 23, 2016
47. Kids In Danger. A check-up on
Chicago’s ban on crib bumpers.
Available at: www. kidsindanger. org/
2013/ 01/ 07/ a- check- up- on- chicagos-
ban- on- crib- bumpers/ . Accessed May
23, 2016
48. Inoue N, Baker R, Scott D. Pram
and stroller related injuries in
Queensland children under 5 years
of age. Available at: www. qisu. org.
au/ ModCoreFilesUploa ded/ Bulletin-
108256. pdf. Accessed May 24, 2016
49. Watson WL, Ozanne-Smith J. The use
of child safety restraints with nursery
furniture. J Paediatr Child Health.
1993;29(3):228–232
11by guest on March 15, 2017Downloaded from

DOI: 10.1542/peds.2016-2503; originally published online March 13, 2017;Pediatrics
Christopher E. Gaw, Thiphalak Chounthirath and Gary A. SmithDepartments
Nursery Product-Related Injuries Treated in United States Emergency
ServicesUpdated Information &
/content/early/2017/03/09/peds.2016-2503.full.htmlincluding high resolution figures, can be found at:
Supplementary Material
html/content/suppl/2017/03/09/peds.2016-2503.DCSupplemental.Supplementary material can be found at:
References
/content/early/2017/03/09/peds.2016-2503.full.html#ref-list-1at:This article cites 23 articles, 13 of which can be accessed free
Subspecialty Collections
/cgi/collection/injury_violence_-_poison_prevention_subInjury, Violence & Poison Preventionthe following collection(s):This article, along with others on similar topics, appears in
Permissions & Licensing
/site/misc/Permissions.xhtmltables) or in its entirety can be found online at: Information about reproducing this article in parts (figures,
Reprints /site/misc/reprints.xhtml
Information about ordering reprints can be found online:
rights reserved. Print ISSN: 0031-4005. Online ISSN: 1098-4275.Grove Village, Illinois, 60007. Copyright © 2017 by the American Academy of Pediatrics. All and trademarked by the American Academy of Pediatrics, 141 Northwest Point Boulevard, Elkpublication, it has been published continuously since 1948. PEDIATRICS is owned, published, PEDIATRICS is the official journal of the American Academy of Pediatrics. A monthly
by guest on March 15, 2017Downloaded from
DOI: 10.1542/peds.2016-2503; originally published online March 13, 2017;Pediatrics
Christopher E. Gaw, Thiphalak Chounthirath and Gary A. SmithDepartments
Nursery Product-Related Injuries Treated in United States Emergency
/content/early/2017/03/09/peds.2016-2503.full.html
located on the World Wide Web at: The online version of this article, along with updated information and services, is
of Pediatrics. All rights reserved. Print ISSN: 0031-4005. Online ISSN: 1098-4275.Boulevard, Elk Grove Village, Illinois, 60007. Copyright © 2017 by the American Academy published, and trademarked by the American Academy of Pediatrics, 141 Northwest Pointpublication, it has been published continuously since 1948. PEDIATRICS is owned, PEDIATRICS is the official journal of the American Academy of Pediatrics. A monthly
by guest on March 15, 2017Downloaded from