nursery habitat use and foraging ecology of the brown ... · introduction coastal ecosystems ......
TRANSCRIPT

MARINE ECOLOGY PROGRESS SERIESMar Ecol Prog Ser
Vol. 433: 221–236, 2011doi: 10.3354/meps09171
Published July 18
INTRODUCTION
Coastal ecosystems such as bays and estuaries aregenerally characterized by high productivity and adiverse range of habitats, and offer an abundant preybase for faunal constituents and refuge from predation(Shulman 1985, Beck et al. 2001). Because of thesecharacteristics, coastal ecosystems commonly serve as
nursery habitat for a wide range of fishes, includingelasmobranchs (Beck et al. 2001, Heupel et al. 2007).These ecosystems are highly susceptible to degrada-tion from anthropogenic influences (Lotze et al. 2006),which can have substantial effects on juvenile sur-vivorship (e.g. Jennings et al. 2008). Because juvenilesurvivorship is often one of the most important factorsregulating overall population size (Heppell et al. 1999,
© Inter-Research 2011 · www.int-res.com*Email: [email protected]
Nursery habitat use and foraging ecology of thebrown stingray Dasyatis lata determined from
stomach contents, bulk and amino acid stable isotopes
Jonathan J. Dale1, 2,*, Natalie J. Wallsgrove3, Brian N. Popp4, Kim N. Holland1
1Hawai‘i Institute of Marine Biology, University of Hawai‘i at Manoa, Kane‘ohe, Hawaii 96744, USA2Department of Zoology, 3Department of Oceanography, and 4Department of Geology and Geophysics, University of Hawai‘i
at Manoa, Honolulu, Hawaii 96822, USA
ABSTRACT: Identification of nursery habitats and knowledge of the trophic ecology and habitat useof juvenile fishes within these habitats are fundamental in developing sound management and con-servation strategies. The brown stingray Dasyatis lata is a large benthic predator that inhabits thecoastal waters of Hawai‘i. Although abundant in these ecosystems, little is known about its basic eco -logy. Stomach content, bulk and amino acid stable isotope analyses were used to assess diet andhabitat use of juvenile brown stingrays and to examine the possibility of competitive interactions withjuvenile scalloped hammerhead sharks Sphyrna lewini that are sympatric with brown stingrays inKane‘ohe Bay, Oahu. Based on stomach contents, brown stingrays fed almost exclusively on crus-taceans. An ontogenetic shift in stingray diet and an increase in relative trophic position (TP) wereapparent from stomach content and stable isotope analysis. Stingray bulk δ13C and δ15N values indi-cated long-term foraging fidelity to subregions of the bay. Use of Kane‘ohe Bay as a nursery habitatwas supported by nitrogen isotopic analysis of individual amino acids from stingray muscle samples.Our results clearly demonstrated that stingrays foraged within the bay for the majority of their juve-nile lives then shifted to offshore habitats with the onset of sexual maturity. Trophic enrichment fac-tors used to estimate TPs from amino acid analysis in previous studies may underestimate TPs in elas-mobranchs owing to urea retention for osmoregulation. Potential prey resources were partitionedbetween stingrays and juvenile scalloped hammerhead sharks, and TP estimates from each analyti-cal method indicated that juvenile scalloped hammerhead sharks forage on higher TP prey than dojuvenile brown stingrays. These results show that the study of foraging ecology and habitat use ofmarine animals can greatly benefit from integrating traditional stomach content and bulk stable isotopic analyses with nitrogen isotopic analyses of individual amino acids.
KEY WORDS: Elasmobranch · Amino acids · Trophic position · Ontogenetic shift · Resource partitioning
Resale or republication not permitted without written consent of the publisher

Mar Ecol Prog Ser 433: 221–236, 2011
Cortés 2002), identification of nursery habitats andknowledge of the trophic ecology and habitat use ofjuvenile fishes within these habitats are fundamentalin developing sound management and conservationstrategies.
The trophic ecology of elasmobranchs has tradition-ally been studied through stomach content analysis(SCA) (Hyslop 1980). However, bulk tissue stable iso-tope analysis (SIA) has increasingly been used to com-pliment SCA (e.g. Graham et al. 2007). Stable isotopeanalysis is based on the observation that the ratio ofcarbon isotopes (13C/12C) in an animal’s tissues primar-ily reflects the isotopic signatures of the primary pro-ducers at the base of its food chain and nitrogen iso-tope ratios (15N/14N) can indicate the trophic position(TP) of the animal (Post 2002). Thus, stable isotopeanalyses provide a complementary method to SCA fordetecting ontogenetic shifts in diet and foraging habi-tat and calculation of TP (Post 2002, Fisk et al. 2002,Cocheret de la Morinière et al. 2003, MacNeil et al.2005). Calculation of TP using bulk tissue SIA canrequire knowledge of the habitat-specific nitrogen iso-topic composition of primary producers (Post 2002).These values may be difficult to obtain in habitats suchas coral reefs, which have a diverse range of primaryproducers, or in deep water habitats that are not easilysampled. Recent studies have shown that analysis ofthe isotopic composition of individual amino acids (asopposed to bulk tissue) taken from a consumer can cir-cumvent these challenges (Uhle et al. 1997, Fantle etal. 1999, McClelland & Montoya 2002, Chikaraishi etal. 2007, 2009, 2010, Popp et al. 2007, Hannides et al.2009, Lorrain et al. 2009). This is because the δ15N val-ues of some amino acids, such as phenylalanine, retainthe δ15N values of primary producers. Other aminoacids, such as glutamic acid, undergo large, consistentenrichments (~7.6‰) with each successive trophicposition. The advantage of this approach is that thebaseline δ15N values of a consumer’s foraging habitatas well as the consumer’s TP can be determined byanalyzing δ15N values of individual amino acids in theconsumer’s tissues. Trophic positions have been esti-mated with this method for a variety of consumersacross a range of TPs (Pakhomov et al. 2004, Schmidtet al. 2004, Popp et al. 2007, Chikaraishi et al. 2009,Hannides et al. 2009, Lorrain et al. 2009), yet TP hasonly been estimated for a single elasmobranch(Chikaraishi et al. 2010).
The brown stingray Dasyatis lata is a large (up to133 cm disk width, 66 kg; J. Dale unpubl. data) benthicpredator endemic to Hawai‘i. Juveniles are abundantin shallow bays and estuaries, whereas adults are oftenfound in deep offshore waters (Cartamil et al. 2003,Randall 2007, J. Dale unpubl. data). Despite theirabundance in near-shore estuaries and potential for
strong impacts on the trophic dynamics of theseregions (VanBlaricom 1982, Thrush et al. 1994, Peter-son et al. 2001), little is known about their general bio -logy, foraging ecology and habitat use. The habitat useand activity patterns of brown stingrays activelytracked for short durations (days) overlapped signifi-cantly with that of juvenile scalloped hammerheadsharks Sphyrna lewini that are sympatric with brownstingrays in Kane‘ohe Bay, Oahu, Hawai‘i (Holland etal. 1993, Lowe 2002, Cartamil et al. 2003). Theseresults suggest that competition for prey resourcesbetween these 2 sympatric species may contribute tohigh rates of starvation found for neonate scallopedhammerhead sharks within their Kane‘ohe Bay nurs-ery (Bush & Holland 2002, Lowe 2002, Duncan & Hol-land 2006).
The goals of this study were to quantify the foragingecology and habitat use of brown stingrays inKane‘ohe Bay and evaluate the extent of ecologicalinteractions between brown stingrays and juvenilescalloped hammerhead sharks. Specifically, we usedSCA and SIA to address the following questions. (1)What are the food habits of brown stingrays? (2) Dotheir food habits change through ontogeny? (3) IsKane‘ohe Bay used as a nursery habitat by brownstingrays? (4) Do isotopic analyses of individual aminoacids accurately reflect the TP of brown stingrays andjuvenile scalloped hammerhead sharks? (5) Is thereevidence of competition between brown stingrays andjuvenile scalloped hammerhead sharks for preyresources? We found that the combined use of stomachcontent, bulk tissue and individual amino acid stableisotope analyses allowed for validation of results fromeach individual method and provided significantinsight into the early life history and ecological rela-tionships of brown stingrays. These results highlightthe advantages of integrating multiple approaches inthe study of foraging ecology and habitat use.
MATERIALS AND METHODS
Study site and sample collection. Kane‘ohe Bay,located on the east coast of Oahu, covers an area of~46 km2 and is bounded on its seaward side by a bar-rier reef (Fig. 1). The inner bay, landward of the barrierreef, consists of deep lagoon (average depth, 13 m)interspersed with numerous patch reefs (Smith et al.1981). Spatial differences in diet composition and habi-tat use were evaluated by dividing the bay into 3zones: south, mid and north (Fig. 1). Zones were basedon previous studies examining environmental and eco-logical processes within the bay (Smith et al. 1981,Duncan & Holland 2006). Brown stingrays were col-lected with standard demersal longlines in and outside
222

Dale et al.: Diet and nursery habitat of the brown stingray
of Kane‘ohe Bay. Inshore longlines were set at least5 m away from patch reefs to avoid entanglement oncoral. Offshore longlines were set at depths of ~80 mbased on catch records from a shark survey conductedin this area (D. Grubbs unpubl. data). All longlineswere baited with tuna Thunnus spp., and/or squidLoligo spp. Lines were soaked for 3 h before beingretrieved. Captured stingrays were landed, disk width(DW) measured to the nearest 1 mm, and euthanized.Maturity state (juvenile/adult) was assessed as part ofa concurrent study on the age and growth of brownstingrays (J. Dale unpubl. data).
Stomach content analysis. Stomach contents wereremoved and preserved in 70% ethyl alcohol. Uponanalysis, stomach contents were rinsed and individualprey items were identified to the lowest possible taxon.The total number and wet weight of each taxon wasrecorded and prey items were then dried to a constantweight at 60°C. The contribution of each prey taxon tothe diet of brown stingrays was quantified with severalmetrics of dietary composition. Percent abundance( , [number of individuals in a prey category/totalnumber of individuals among all prey categories] ×100) and percent weight ( , [weight of individualsin a prey category/total weight of individuals amongall prey categories] × 100) were calculated for eachsample to provide mean and variability estimates (Biz-
zarro et al. 2007, Chipps & Garvey 2007). The percentfrequency occurrence (%FO) was calculated as thenumber of stomachs containing a prey taxon/totalnumber of stomach containing prey × 100 (Hyslop1980). Individual metrics were also combined into acomposite metric, the index of relative importance(IRI), for an additional description of diet composition(Pinkas et al. 1971), which is defined as:
IRI = ( + ) × %FO (1)
The IRI values were expressed as a percentage( ) to facilitate comparisons between prey taxon(Cortés 1997). Percent IRI values were calculated foreach sample to provide mean and variability estimatesfor each prey taxon (Bizzarro et al. 2007).
There was no significant effect of sex or location ongravimetric diet data based on analysis of similarities(ANOSIM) procedures (see below); therefore, for onto-genetic comparisons data were pooled. By clusteranalysis with the group average linkage method(PRIMER v. 6), 3 size classes were identified: small(35.0 to 54.9 cm DW), medium (55.0 to 69.9 cm DW)and large (70.0 to 94.9 cm DW). Brown stingrays wereseparated by DW into 5 cm bins, and the average for each prey item was calculated. Bin averages wererequired because individual stomachs were too vari-able for meaningful interpretation. To compare dietarycomposition between identified size classes, non- metric multidimensional scaling (MDS) ordinationplots were generated and ANOSIM was used to test forsignificant differences between size groups (PRIMERv. 6). The resultant global R-statistic (–1 > R < 1)describes the amount of similarity between each pairin the ANOSIM. A value of 0 indicates no differencewhile a value close to |1| indicates that the 2 groupsare entirely separate. p-values generated from theR-statistic were considered statistically significant ifthey were <0.05. Multivariate dispersion (MVDISP)calculated the degree of dispersion between sampleswithin size classes and similarity percentages (SIM-PER) identified which dietary categories contributedmost to the dissimilarities between size classes (PRI -MER v. 6). For each size class, brown stingrays wererandomly sorted into groups of 4 (i.e. dietary samples)and mean values for each prey taxon determined toovercome the problem of low prey diversity in thestomachs of individual stingrays (Platell & Potter 2001).Gravimetric diet data were square root transformedbefore multivariate analysis and, when appropriate,used to construct a Bray-Curtis similarity matrix. Onlyprey items representing >5% 3W were included toreduce effects of rare prey. Prey diversity was calcu-lated for each size class with the Shannon-Wienerdiversity index (H ’) (Krebs 1999). Trophic positionswere calculated for each size class following Cortés
%W
%IRI
%N %W
%W
%N
223
Fig. 1. Kane‘ohe Bay showing outline of patch reefs andbay zones (south, mid and north). HIMB: Hawaii Instituteof Marine Biology. Inset: location of Kane‘ohe Bay (KB)
on Oahu, Hawai‘i
Mar Ecol Prog Ser 433: 221–236, 2011224
(1999). Trophic position estimates for prey categorieswere taken from the Sea Around Us Project database(www.seaaroundus.org) and Ebert & Bizzarro (2007).
To evaluate the possibility of competitive interac-tions, diet composition was compared between brownstingrays and juvenile scalloped hammerhead sharks.Raw data from Bush (2003) were reanalyzed to gener-ate values for each individual hammerhead sharksample. Dietary data were grouped into broad cate-gories to eliminate biases in comparisons based onvariable levels of taxonomic identification (Cortés1997). Differences between hammerhead shark andstingray diets were analyzed following the proceduresdescribed for stingray size class comparisons (i.e.ANOSIM, MDS).
Bulk stable isotope analysis. A preliminary studyconducted in September 2009 that examined the foodweb structure of Kane‘ohe Bay found red macroalgae tobe the primary nitrogen source for benthic predators(mean δ15N ± SD: 3.3 ± 0.7‰, n = 6, J. Dale unpubl.data). Macroalgae were collected by hand from sitesthroughout the bay, washed in distilled water and visu-ally inspected for sources of contamination. Brownstingray and juvenile scalloped hammerhead sharkepaxial white muscle tissue (~1 cm3) was removed fromeach sample and frozen until further analysis. Sampleswere dried at 60°C and ground into a fine powder witha mortar and pestle. Lipid extraction was not performedowing to the low molar C:N ratios of stingray (mean ±SD: 2.97 ± 0.10) and hammerhead shark (3.00 ± 0.12)muscle samples, indicating low lipid concentrations intissues and little variation between individuals (Post etal. 2007). The δ13C and δ15N values of white muscle tis-sue were determined with a carbon-nitrogen analyzercoupled with an isotope ratio mass spectrometer (Finni-gan Conflo II/Delta-Plus). Isotope values are reportedas δ-values (as ‰) relative to Vienna PeeDee Belemnite(VPDB) and atmospheric N2 standards for carbon andnitrogen, respectively. Accuracy of isotopic measure-ments was determined through repeated analyses of asample of glycine isotopically well characterized bylong-term (>10 yr) analyses using multiple instrumentsin different laboratories and interspersed with samples.Average accuracy and precision of all stable isotopicanalyses determined by replicate analysis of glycineand samples was <±0.1‰ (1 SD).
A general linear model (GLM) was used to test fordifferences in brown stingray bulk isotopic composi-tions between bay zones and sexes, with stingray DWas a covariate. If significant differences between zonesor sex were found, a subsequent GLM was used to testfor differences in isotopic values between size classeswhile controlling for variability due to significant fac-tors, which were included as fixed effects. Trophicpositions for each stingray size class and juvenile scal-
loped hammerhead sharks were calculated with thefollowing equation:
(2)
where 2.7‰ is the assumed trophic enrichment factor(TEF) (Vanderklift & Ponsard 2003) and 3.3‰ is theaverage nitrogen isotopic value for red macroalgaeabundant in Kane‘ohe Bay (Stimson et al. 2001, J. Daleunpubl. data).
Stable nitrogen isotope analysis of individualamino acids. Before analysis, brown stingray and juve-nile scalloped hammerhead shark muscle tissue wassubjected to acid hydrolysis, esterification of the car-boxyl terminus and trifluoroacetylation of the aminegroup (Macko et al. 1997, Popp et al. 2007). Muscle tis-sue (~5 mg) was hydrolyzed at 150°C for 70 min withsequanal grade 6 N hydrochloric acid (HCl) in a cul-ture tube that was flushed with nitrogen gas (N2) andfitted with a Teflon-lined cap. Glutamine is convertedto glutamic acid during hydrolysis (Metges et al. 1996)so δ15N values of glutamic acid include glutamine. TheHCl was evaporated to dryness in a Thermo SavantSpeed Vac concentrator coupled with a UVS400 at55°C for 1.5 h. The residue was redissolved in 1 ml0.01 N HCl and purified by filtration (0.45 μmhydrophilic filter), and the filter was washed with 1 ml0.01 N HCl. Amino acids were further purified bycation exchange (~5 cm Dowex 50WX8-400 in a Pas-teur pipette). The filtered hydrolysate was added to theion exchange column in 0.01 N HCl and amino acidseluted with 4 ml ammonium hydroxide and evaporatedto dryness under a stream of N2 at 80°C. The sampleswere re-acidified by adding 0.5 ml of 0.2 N HCl; thevials were then flushed with N2, heated to 110°C for5 min and then dried in the Speed Vac concentrator for1.5 h at 55°C. The hydrolyzed muscle samples wereesterified with 2 to 3 ml of 1:4 acetyl chloride : iso-propanol in N2-flushed vials heated to 110°C for60 min. Excess solvent was removed under a stream ofN2 at 60°C. Trifluoroacetylation of the amine groupwas accomplished by adding 3:1 methylene chloride :trifluoroacetic anhydride (TFAA) to each vial and heat-ing to 100°C for 15 min. The samples were further puri-fied by solvent extraction following Ueda et al. (1989)with 2 ml of P-buffer (KH2PO4 + Na2HPO4 in milli-Qwater, pH 7). The acylated amino acids were parti-tioned into chloroform, the chloroform evaporated todryness and the trifluoroacetylation step repeated toensure full derivitization. Samples were stored at–20°C in 3:1 methylene chloride : TFAA for up to 1 mountil isotope analysis.
Just before isotope analysis, the 3:1 methylene chlo-ride : TFAA mixture was evaporated under a stream
%W
TPN
bulkconsumer .
.= − +δ15 3 3
2 71

Dale et al.: Diet and nursery habitat of the brown stingray
of N2 at room temperature. Samples were redissolvedin 100 μl of ethyl acetate. The stable N isotope compo-sition of the amino acids were determined with eithera Delta XP or Delta V Plus mass spectrometer inter-faced with a Trace GC gas chromatograph through aGC-C III combustion furnace (980°C), reduction fur-nace (650°C) and liquid N cold trap. The samples (1 to2 μl) were injected (split/splitless injector, 10:1 splitratio) onto a forte BPx5 capillary column (30 m ×0.32 mm × 1.0 μm film thickness) at an injector tem-perature of 180°C with a constant helium flow rate of1.4 ml min–1. The column was initially held at 50°C for2 min and then increased to 190°C at a rate of 8°Cmin–1. Once at 190°C, the temperature was increasedat a rate of 10°C min–1 to 300°C where it was held for7.5 min. Internal reference compounds, aminoadipicacid and norleucine of known nitrogen isotopic com-position, were co-injected with samples and used tonormalize the measured δ15N values of unknownamino acids. All samples were analyzed at least intriplicate. Reproducibility associated with isotopicanalysis of glutamic acid and phenylalanine averaged±0.44‰ (1 SD) and ranged from ±0.06‰ to ±0.85‰.The accuracy of each measurement was determinedby using the known δ15N value for aminoadipic acidto determine the measured δ15N value of norleucineas an unknown, and vice versa. We have found thatthe combustion reactor on the GC-C III is susceptibleto rapid failure when used for nitrogen isotopic analy-ses of amino acids. Co-injection of aminoadipic acidand norleucine allows monitoring of combustion reac-tor degradation and provides an internal check on theaccuracy of each sample injected. The accuracy aver-aged ±1.5‰ (1 SD) and ranged from ±0.36‰ to±2.4‰.
Determination of trophic position using amino acidisotope analyses. The fractional trophic position ofbrown stingray and juvenile scalloped hammerheadshark samples was calculated with the measured δ15Nvalues of glutamic acid and phenylalanine asdescribed by Chikaraishi et al. (2009) as follows:
(3)
where TPGlu/Phe is the trophic position determined withglutamic acid (Glu) and phenylalanine (Phe), 3.4 is theisotopic difference between glutamic acid and pheny-lalanine in the primary producers (β) and 7.6 is theTEF. A conservative error associated with the TP cal-culation was determined by propagation of error (e.g.Gelwicks & Hayes 1990) using the uncertainty in β andthe TEF in Chikaraishi et al. (2009), as well as the mea-sured reproducibility for glutamic acid and phenylala-nine for each sample.
RESULTS
Stomach content analysis
A total of 156 juvenile brown stingrays were sampledfrom Kane‘ohe Bay (size range, 35.0 to 94.9 cm DW); 20(12.8%) of these had empty stomachs. The number ofempty stomachs varied significantly between sizeclasses, with the greatest percentage occurring in smallrays (22%), followed by large (17%) and medium (5%)rays (χ2 = 6.4, df = 2, p = 0.04). Prey from stomach con-tents of brown stingrays were separated into 16 prey cat-egories (Table 1). Crustaceans, represented by alpheidshrimps, portunid crabs and stomatopods, were the mostimportant prey group for all size classes (32IRI ± SD: small,93.25 ± 18.30; medium, 86.46 ± 25.52; large, 84.67 ±23.32), with minor contributions from polychaete wormsand teleost fish (Table 1). Gobies were the most impor-tant teleost component and only 1 other teleost familywas identified (Table 1). With increasing stingray size,alpheid shrimps and polychaete worms declined in im-portance whereas the portunid crab, Podophthalmusvigil, and gobies increased in importance (Table 1). An-other portunid crab, Libys tes villosus, increased in im-portance from small to medium sized individuals, butthen decreased from medium to large sized individuals(Table 1). There was a positive, linear relationship be-tween stingray size (DW) and stingray mouth gape (r2 =0.86, p < 0.001) as well as stingray size and carapacewidth of P. vigil consumed (r2 = 0.51, p < 0.001). Based oncalculation of TP from prey in stingray stomachs, juve-nile stingrays were classified as secondary consumers(TP < 4) and TP increased with increasing stingray size(range: 3.3 to 3.7, Table 1).
Gravimetric diet composition differed significantlyoverall between the 3 size classes (ANOSIM: Global Rstatistic = 0.428, p = 0.001) and also for each of the pair-wise comparisons between size classes. The R-statisticvalues for pairwise comparisons were greatest be -tween small and large size classes (0.856, p = 0.001)and comparably lower between small and medium(0.291, p = 0.004) and medium and large (0.298, p =0.004) size classes. Ordination of the mean gravimetricdietary data showed a gradual dietary transition insmall to large stingrays (Fig. 2). Sample dispersion wassimilar between the 3 size classes (MVDISP valuerange: 0.906 to 1.054). Although dietary samples over-lapped between size classes, no samples from thesmall size class overlapped with samples from thelarge size class (Fig. 2). Alpheus malabaricus andPodo phthalmus vigil were identified as the prey itemsmost responsible for differences in dietary composi-tions between size classes by SIMPER analysis. Dietarybreadth was lowest for small stingrays (H ’ = 0.563) andgreatest for large stingrays (H ’ = 0.708) (Table 1).
TPN N
Glu/PheGlu Phe( ) .
.= − − +δ δ15 15 3 4
7 61
225

Mar Ecol Prog Ser 433: 221–236, 2011226
Pre
yS
ize
clas
s (D
W)
35.0
to
54.9
cm
55.0
to
69.9
cm
70.0
to
94.9
cm
322
%N
SD
322
%W
SD
%F
O3
32
%IR
IS
D3
22
%N
SD
322
%W
SD
%F
O3
32
%IR
IS
D3
22
%N
SD
322
%W
SD
%F
O3
32
%IR
IS
D
Cru
stac
ea86
.51
22.4
087
.73
23.8
696
.97
93.2
518
.30
79.0
127
.16
78.5
731
.45
93.6
586
.46
25.5
274
.95
27.4
381
.55
30.3
897
.50
84.6
723
.32
Alp
hei
dae
Alp
heu
s m
alab
aric
us
68.0
527
.44
55.5
034
.42
93.9
478
.37
26.2
638
.63
30.8
120
.40
29.7
277
.78
40.5
831
.49
13.6
420
.97
2.64
6.60
40.0
08.
5815
.16
Un
iden
tifi
ed a
lph
eid
0.52
2.29
0.08
0.42
6.06
0.02
0.10
0.49
2.86
0.00
0.01
3.17
0.02
0.13
––
––
––
–
Por
tun
idae
Pod
oph
thal
mu
s vi
gil
3.76
7.56
9.50
22.3
224
.24
2.78
6.72
15.3
826
.92
20.8
335
.16
38.1
016
.63
29.4
436
.36
36.5
447
.11
43.3
670
.00
50.7
039
.58
Por
tun
us
gra
nu
latu
s–
––
––
––
––
––
––
–2.
5015
.81
2.50
15.8
12.
502.
5015
.81
Por
tun
us
lon
gis
pin
osu
s0.
181.
020.
864.
943.
030.
020.
140.
292.
290.
141.
101.
590.
020.
161.
257.
911.
8711
.82
2.50
0.22
1.38
Lib
yste
s vi
llos
us
10.9
521
.45
17.3
928
.95
42.4
211
.03
22.2
416
.25
21.4
927
.48
34.2
150
.79
23.2
127
.85
8.76
16.1
412
.49
25.4
430
.00
8.96
16.7
8U
nid
enti
fied
Por
tun
idae
––
––
––
–0.
452.
520.
412.
353.
170.
090.
57–
––
––
––
Un
iden
tifi
ed c
rab
2.12
9.27
4.18
17.4
56.
060.
512.
333.
9614
.45
4.42
16.2
512
.70
2.36
12.7
54.
8212
.48
6.73
18.9
717
.50
4.04
10.5
8
Sto
mat
opod
aO
rato
squ
illa
ora
tori
a–
––
––
––
1.36
7.68
0.76
5.36
3.17
0.27
1.82
0.86
3.84
1.57
6.95
5.00
0.15
0.64
Gon
odac
tyla
ceu
s fa
lcat
us
––
––
––
–0.
342.
700.
352.
751.
590.
060.
49–
––
––
––
Pse
ud
osq
uil
la c
ilia
ta–
––
––
––
1.33
6.38
2.54
12.4
64.
760.
622.
823.
0115
.07
3.80
17.5
45.
001.
779.
41U
nid
enti
fied
man
tis
0.93
3.05
0.22
0.71
9.09
0.09
0.30
0.52
3.28
1.24
6.95
3.17
0.08
0.47
3.75
14.6
92.
8315
.58
10.0
02.
3513
.70
Pol
ych
aeta
9.33
20.8
46.
6918
.24
36.3
65.
5017
.70
7.06
18.6
56.
0119
.49
26.9
84.
4717
.72
1.80
6.97
1.44
7.70
7.50
0.28
1.31
Un
iden
tifi
ed P
olyc
hae
ta9.
3320
.84
6.69
18.2
436
.36
5.83
17.7
67.
0618
.65
6.01
19.4
926
.98
5.27
17.9
61.
806.
971.
447.
707.
500.
432.
01
Ost
eich
thye
s2.
347.
251.
254.
1115
.15
0.34
1.05
9.50
17.5
18.
8220
.56
39.6
86.
1515
.65
20.7
624
.23
13.8
824
.24
55.0
014
.26
22.0
4G
obii
dae
2.20
7.25
1.24
4.11
12.1
20.
381.
248.
8117
.65
7.37
19.1
633
.30
6.85
17.1
717
.96
24.6
812
.24
23.7
845
.00
17.7
327
.80
Op
hic
hth
idae
––
––
––
–0.
181.
401.
048.
271.
590.
040.
30–
––
––
––
Un
iden
tifi
ed t
eleo
st0.
140.
790.
010.
053.
030.
000.
020.
522.
420.
413.
154.
760.
050.
282.
808.
161.
647.
9212
.50
1.08
3.54
Mis
cell
aneo
us
1.89
5.43
4.46
16.8
715
.15
0.95
3.98
4.42
14.0
66.
6018
.14
22.2
22.
9212
.92
2.49
6.38
3.13
9.71
15.0
00.
782.
33U
nid
enti
fied
rem
ain
s1.
895.
434.
4616
.87
15.1
51.
004.
074.
4214
.06
6.60
18.1
422
.22
3.86
13.9
62.
496.
383.
139.
7115
.00
1.49
4.26
Sam
ple
siz
e (e
mp
ty)
42 (
9)66
(3)
48 (
8)T
rop
hic
lev
el3.
33.
53.
7S
han
non
-Wie
ner
in
dex
0.56
30.
691
0.70
8
Tab
le 1
. Das
yati
s la
ta. M
ean
an
d S
D o
f p
erce
nt
nu
mb
er (
322
%N
) an
d p
erce
nt
wei
gh
t (3
22
%W
), p
erce
nt
freq
uen
cy o
ccu
rren
ce (
%F
O)
and
mea
n a
nd
SD
of
per
cen
t in
dex
of
rela
-ti
ve i
mp
orta
nce
(3
32
%IR
I) o
f p
rey
con
sum
ed b
y ju
ven
ile
bro
wn
sti
ng
rays
in
Kan
e‘oh
e B
ay. S
amp
le s
ize,
tro
ph
ic l
evel
an
d S
han
non
-Wie
ner
In
dex
giv
en a
t th
e b
otto
m o
f ea
ch
size
cla
ss. D
W: d
isk
wid
th

Dale et al.: Diet and nursery habitat of the brown stingray
Diet composition of juvenile scalloped hammerheadsharks was significantly different than that of brownstingrays in Kane‘ohe Bay (ANOSIM: Global R-statistic= 0.842, p = 0.001) and all pairwise comparisonsbetween hammerhead sharks and stingray size classeswere also significant (p = 0.001). Ordination of thedietary data revealed 2 distinct clusters with no over-lap, one composed of juvenile scalloped hammerheadshark samples and the other composed of brownstingray samples (Fig. 3). SIMPER analysis identifiedteleosts and portunid crabs as contributing most to thedissimilarity between hammerhead sharks and allstingray size classes. Hammerhead sharks consumedlarger amounts of teleosts and smaller amounts of por-tunids by weight compared with stingrays (Fig. 4).Alpheid shrimps also contri buted strongly to the dis-similarity be tween juvenile scalloped hammerheadsharks and large brown stingrays, with hammerheadsharks consuming larger amounts of alpheids byweight compared with large stingrays (Fig. 4). Trophicposition based on stomach contents for hammerheadsharks was 4.0, ~0.5 TPs higher than the average TPfor all juvenile stingrays.
Bulk stable isotope analysis
White muscle tissue from 44 juvenile brown sting -rays collected within Kane‘ohe Bay, ranging from 42.1to 93.1 cm DW, were analyzed for bulk carbon andnitrogen isotopic compositions. These stingrays were asubset of the 156 individuals examined for SCA andrepresented the entire geographic distribution withinKane‘ohe Bay, full size range and sex of juvenilestingrays. There was no significant effect of sex onbulk δ13C (p = 0.578) or δ15N (p = 0.774) values
(Table 2). Disk width and location explained 51 and52% of the variance for δ13C and δ15N values, respec-tively. Of the total explained variance, 17 and 25% wasexplained by size and 33 and 26% was explained bylocation for δ13C and δ15N values, respectively (Table 2,Fig. 5). Stingrays captured in the south part ofKane‘ohe Bay were, on average, more depleted in 13C(1.4‰, p < 0.001) and more enriched in 15N (1.2‰, p <0.002) compared with stingrays captured in the midand north parts of the bay (Table 3, Fig. 5). There weresignificant differences between size classes for δ13Cvalues (GLM: F2, 39 = 4.17, p = 0.023) and δ15N values
227
Fig. 2. Dasyatis lata. Non-metric multidimensional scaling ofthe mean gravimetric dietary data for the 3 size classes of
juvenile brown stingrays
Fig. 3. Dasyatis lata and Sphyrna lewini. Non-metric multi -dimensional scaling of the mean gravimetric dietary data forjuvenile brown stingrays and juvenile scalloped hammerheadsharks. Juvenile scalloped hammerhead dietary data were
reanalyzed from Bush (2003)
Fig. 4. Dasyatis lata and Sphyrna lewini. Gravimetric contri-bution (+1 SD) of the prey groups primarily responsible fordifferences in dietary composition between the 3 size classesof brown stingrays and juvenile scalloped hammerheadsharks. Juvenile scalloped hammerhead dietary data were
reanalyzed from Bush (2003)

Mar Ecol Prog Ser 433: 221–236, 2011
(F2, 39 = 4.74, p = 0.015). Small stingrays were moredepleted in 13C (p = 0.018) and 15N (p = 0.013) com-pared with large stingrays (Table 3, Fig. 5). There wereno significant differences between small and mediumstingrays or between medium and large stingrays. ForTP calculations, δ15N values of sting rays captured inthe south part of the bay were normalized by 1.2‰ tocorrect for spatial variation. Trophic positions forstingray size classes based on bulk nitrogen isotopic
values were in close agreement tothose based on SCA and increasedwith increasing stingray size (range:3.3 to 3.6, Table 3).
Differences in dietary compositionbetween juvenile scalloped ham-merhead sharks and juvenile brownstingrays were also supported bybulk SIA. Juvenile hammerheadsharks were significantly more de -pleted in 13C (mean δ13C = –16.41 ±0.34; ANOVA: F3, 48 = 89.94, p <0.001) and more enriched in 15N
(mean δ15N = 11.83 ± 0.60; ANOVA: F3, 48 = 15.61, p <0.001) compared with all stingray size classes (stableisotopic values of brown stingrays and juvenile scal-loped hammerhead sharks caught in the south baynormalized for spatial variation). The TP of juvenilehammerhead sharks based on bulk nitrogen isotopicvalues was 4.1, ~0.6 TPs higher than that of juvenilestingrays (south bay samples normalized for spatialvariation).
Stable nitrogen isotope analysis of individual amino acids
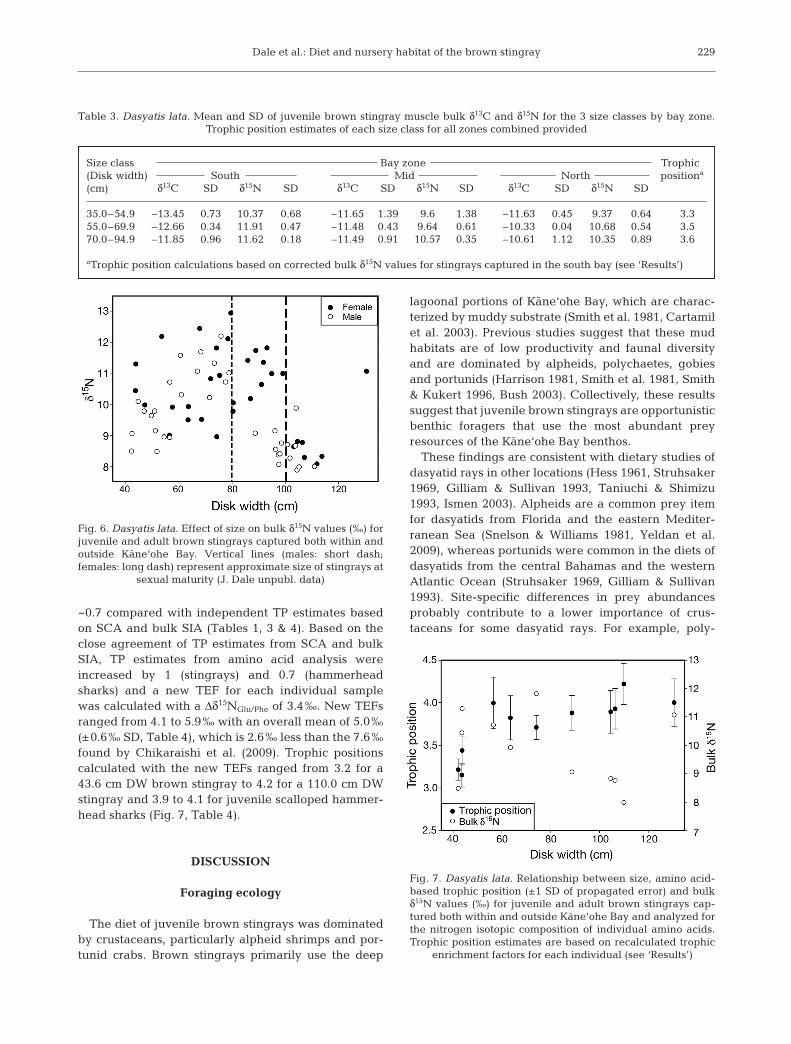
An additional 23 muscle samples were collectedfrom very large (>95 cm DW) brown sting rays cap-tured both within and outside Kane‘ohe Bay. Inclusionof these samples revealed a dramatic de crease in bulktissue δ15N values, and onset of this decrease varied bysex (Fig. 6). There are 2 competing hypotheses thatcould explain the observed decrease in δ15N values: (1)stingrays of all sizes are feeding in habitats that areisotopically similar and the observed decrease in δ15Nvalues is due to very large stingrays changing to foodthat is on average 0.7 TPs lower than that of large (70to 94.9 cm DW) juvenile stingrays, or (2) very largestingrays are feeding in a habitat with basal nitrogenisotopic values distinct (lower) from those withinKane‘ohe Bay. To test these hypotheses, we analyzedthe δ15N values of individual amino acids from 11 indi-viduals representing the entire DW range that wasused to determine the TP of brown stingrays. Based onthis analysis, TP increased in very large stingrays com-pared with that in juvenile stingrays. This result is con-trary to the trend in bulk tissue results and unambigu-ously supports the second hypothesis, namely that verylarge stingrays are feeding in a habitat isotopically dif-ferent from Kane‘ohe Bay (Fig. 7).
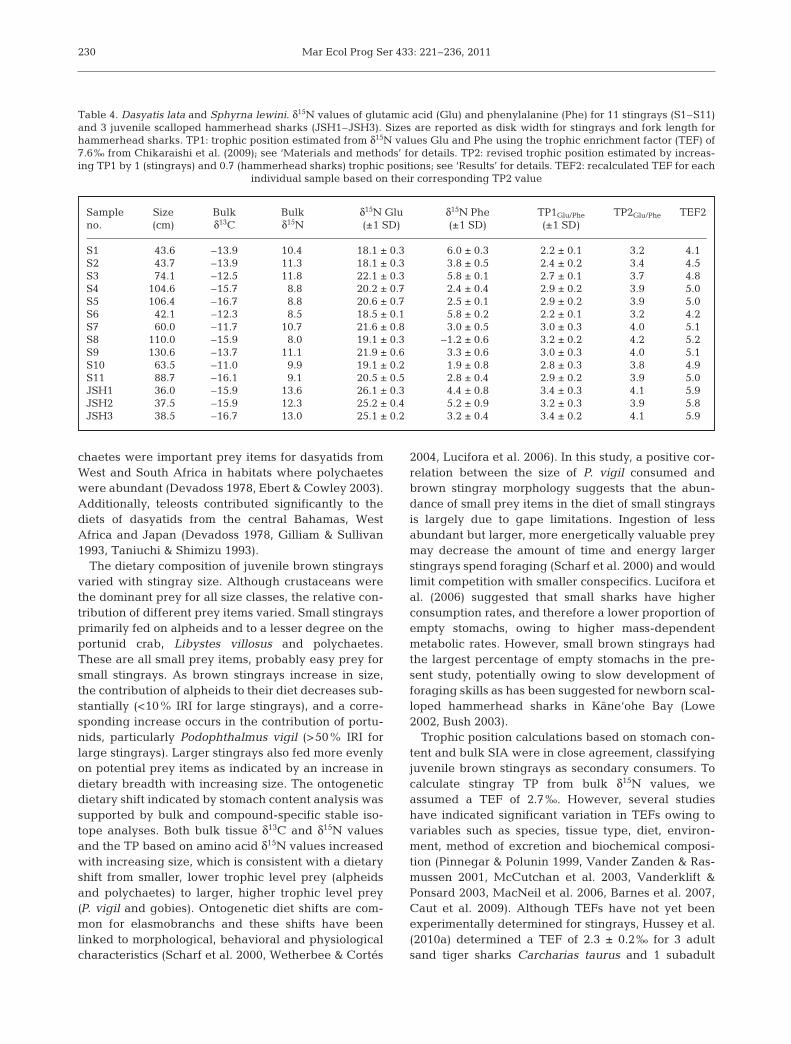
Calculations of TP from amino acid nitrogen isotopicanalyses based on a TEF of 7.6‰ and a Δδ15NGlu/Phe of3.4‰ consistently underestimated absolute TP forbrown stingrays by ~1 (9 out of 11 samples had a TP<3) and juvenile scalloped hammerhead sharks by
228
Source df δ13C δ15NSS MS F p SS MS F p
Disk width 1 9.296 11.737 17.33 <0.001 14.469 5.612 8.04 0.007Location 2 18.154 9.077 13.40 <0.001 15.053 7.526 10.78 <0.001Sex 1 0.849 0.213 0.31 0.578 0.276 0.058 0.08 0.774Error 39 26.420 0.677 27.229 0.698Total 43 54.719 57.026
Table 2. Dasyatis lata. Results of GLM evaluating differences in juvenile brownstingray bulk δ13C and δ15N values between bay zones (location) and sex, with size
(disk width) as a covariate
Fig. 5. Dasyatis lata. Effect of size and capture location ofjuvenile brown stingrays on bulk (a) δ13C values (‰) and
(b) δ15N values (‰)
Dale et al.: Diet and nursery habitat of the brown stingray
~0.7 compared with independent TP estimates basedon SCA and bulk SIA (Tables 1, 3 & 4). Based on theclose agreement of TP estimates from SCA and bulkSIA, TP estimates from amino acid analysis wereincreased by 1 (stingrays) and 0.7 (hammerheadsharks) and a new TEF for each individual samplewas calculated with a Δδ15NGlu/Phe of 3.4‰. New TEFsranged from 4.1 to 5.9‰ with an overall mean of 5.0‰(±0.6‰ SD, Table 4), which is 2.6‰ less than the 7.6‰found by Chikaraishi et al. (2009). Trophic positionscalculated with the new TEFs ranged from 3.2 for a43.6 cm DW brown stingray to 4.2 for a 110.0 cm DWstingray and 3.9 to 4.1 for juvenile scalloped hammer-head sharks (Fig. 7, Table 4).
DISCUSSION
Foraging ecology
The diet of juvenile brown stingrays was dominatedby crustaceans, particularly alpheid shrimps and por-tunid crabs. Brown stingrays primarily use the deep
lagoonal portions of Kane‘ohe Bay, which are charac-terized by muddy substrate (Smith et al. 1981, Cartamilet al. 2003). Previous studies suggest that these mudhabitats are of low productivity and faunal diversityand are dominated by alpheids, polychaetes, gobiesand portunids (Harrison 1981, Smith et al. 1981, Smith& Kukert 1996, Bush 2003). Collectively, these resultssuggest that juvenile brown stingrays are opportunisticbenthic foragers that use the most abundant preyresources of the Kane‘ohe Bay benthos.
These findings are consistent with dietary studies ofdasyatid rays in other locations (Hess 1961, Struhsaker1969, Gilliam & Sullivan 1993, Taniuchi & Shimizu1993, Ismen 2003). Alpheids are a common prey itemfor dasyatids from Florida and the eastern Mediter-ranean Sea (Snelson & Williams 1981, Yeldan et al.2009), whereas portunids were common in the diets ofdasyatids from the central Bahamas and the westernAtlantic Ocean (Struhsaker 1969, Gilliam & Sullivan1993). Site-specific differences in prey abundancesprobably contribute to a lower importance of crus-taceans for some dasyatid rays. For example, poly-
229
Size class Bay zone Trophic (Disk width) South Mid North positiona
(cm) δ13C SD δ15N SD δ13C SD δ15N SD δ13C SD δ15N SD
35.0–54.9 –13.45 0.73 10.37 0.68 –11.65 1.39 9.6 1.38 –11.63 0.45 9.37 0.64 3.355.0–69.9 –12.66 0.34 11.91 0.47 –11.48 0.43 9.64 0.61 –10.33 0.04 10.68 0.54 3.570.0–94.9 –11.85 0.96 11.62 0.18 –11.49 0.91 10.57 0.35 –10.61 1.12 10.35 0.89 3.6
aTrophic position calculations based on corrected bulk δ15N values for stingrays captured in the south bay (see ‘Results’)
Table 3. Dasyatis lata. Mean and SD of juvenile brown stingray muscle bulk δ13C and δ15N for the 3 size classes by bay zone. Trophic position estimates of each size class for all zones combined provided
Fig. 6. Dasyatis lata. Effect of size on bulk δ15N values (‰) forjuvenile and adult brown stingrays captured both within andoutside Kane‘ohe Bay. Vertical lines (males: short dash;females: long dash) represent approximate size of stingrays at
sexual maturity (J. Dale unpubl. data)
Fig. 7. Dasyatis lata. Relationship between size, amino acid-based trophic position (±1 SD of propagated error) and bulkδ15N values (‰) for juvenile and adult brown stingrays cap-tured both within and outside Kane‘ohe Bay and analyzed forthe nitrogen isotopic composition of individual amino acids.Trophic position estimates are based on recalculated trophic
enrichment factors for each individual (see ‘Results’)
Mar Ecol Prog Ser 433: 221–236, 2011
chaetes were important prey items for dasyatids fromWest and South Africa in habitats where polychaeteswere abundant (Devadoss 1978, Ebert & Cowley 2003).Additionally, teleosts contributed significantly to thediets of dasyatids from the central Bahamas, WestAfrica and Japan (Devadoss 1978, Gilliam & Sullivan1993, Taniuchi & Shimizu 1993).
The dietary composition of juvenile brown stingraysvaried with stingray size. Although crustaceans werethe dominant prey for all size classes, the relative con-tribution of different prey items varied. Small stingraysprimarily fed on alpheids and to a lesser degree on theportunid crab, Libystes villosus and polychaetes.These are all small prey items, probably easy prey forsmall stingrays. As brown stingrays increase in size,the contribution of alpheids to their diet decreases sub-stantially (<10% IRI for large stingrays), and a corre-sponding increase occurs in the contribution of portu-nids, particularly Podophthalmus vigil (>50% IRI forlarge stingrays). Larger stingrays also fed more evenlyon potential prey items as indicated by an increase indietary breadth with increasing size. The ontogeneticdietary shift indicated by stomach content analysis wassupported by bulk and compound-specific stable iso-tope analyses. Both bulk tissue δ13C and δ15N valuesand the TP based on amino acid δ15N values increasedwith increasing size, which is consistent with a dietaryshift from smaller, lower trophic level prey (alpheidsand polychaetes) to larger, higher trophic level prey(P. vigil and gobies). Ontogenetic diet shifts are com-mon for elasmobranchs and these shifts have beenlinked to morphological, behavioral and physiologicalcharacteristics (Scharf et al. 2000, Wetherbee & Cortés
2004, Lucifora et al. 2006). In this study, a positive cor-relation between the size of P. vigil consumed andbrown stingray morphology suggests that the abun-dance of small prey items in the diet of small stingraysis largely due to gape limitations. Ingestion of lessabundant but larger, more energetically valuable preymay decrease the amount of time and energy largerstingrays spend foraging (Scharf et al. 2000) and wouldlimit competition with smaller conspecifics. Lucifora etal. (2006) suggested that small sharks have higher consumption rates, and therefore a lower proportion ofempty stomachs, owing to higher mass-dependentmeta bolic rates. However, small brown stingrays hadthe largest percentage of empty stomachs in the pre-sent study, potentially owing to slow development offoraging skills as has been suggested for newborn scal-loped hammerhead sharks in Kane‘ohe Bay (Lowe2002, Bush 2003).
Trophic position calculations based on stomach con-tent and bulk SIA were in close agreement, classifyingjuvenile brown stingrays as secondary consumers. Tocalculate stingray TP from bulk δ15N values, weassumed a TEF of 2.7‰. However, several studieshave indicated significant variation in TEFs owing tovariables such as species, tissue type, diet, environ-ment, method of excretion and biochemical composi-tion (Pinnegar & Polunin 1999, Vander Zanden & Ras-mussen 2001, McCutchan et al. 2003, Vanderklift &Ponsard 2003, MacNeil et al. 2006, Barnes et al. 2007,Caut et al. 2009). Although TEFs have not yet beenexperimentally determined for stingrays, Hussey et al.(2010a) determined a TEF of 2.3 ± 0.2‰ for 3 adultsand tiger sharks Carcharias taurus and 1 subadult
230
Sample Size Bulk Bulk δ15N Glu δ15N Phe TP1Glu/Phe TP2Glu/Phe TEF2no. (cm) δ13C δ15N (±1 SD) (±1 SD) (±1 SD)
S1 43.6 –13.9 10.4 18.1 ± 0.3 6.0 ± 0.3 2.2 ± 0.1 3.2 4.1S2 43.7 –13.9 11.3 18.1 ± 0.3 3.8 ± 0.5 2.4 ± 0.2 3.4 4.5S3 74.1 –12.5 11.8 22.1 ± 0.3 5.8 ± 0.1 2.7 ± 0.1 3.7 4.8S4 104.6 –15.7 8.8 20.2 ± 0.7 2.4 ± 0.4 2.9 ± 0.2 3.9 5.0S5 106.4 –16.7 8.8 20.6 ± 0.7 2.5 ± 0.1 2.9 ± 0.2 3.9 5.0S6 42.1 –12.3 8.5 18.5 ± 0.1 5.8 ± 0.2 2.2 ± 0.1 3.2 4.2S7 60.0 –11.7 10.7 21.6 ± 0.8 3.0 ± 0.5 3.0 ± 0.3 4.0 5.1S8 110.0 –15.9 8.0 19.1 ± 0.3 –1.2 ± 0.6 3.2 ± 0.2 4.2 5.2S9 130.6 –13.7 11.1 21.9 ± 0.6 3.3 ± 0.6 3.0 ± 0.3 4.0 5.1S10 63.5 –11.0 9.9 19.1 ± 0.2 1.9 ± 0.8 2.8 ± 0.3 3.8 4.9S11 88.7 –16.1 9.1 20.5 ± 0.5 2.8 ± 0.4 2.9 ± 0.2 3.9 5.0JSH1 36.0 –15.9 13.6 26.1 ± 0.3 4.4 ± 0.8 3.4 ± 0.3 4.1 5.9JSH2 37.5 –15.9 12.3 25.2 ± 0.4 5.2 ± 0.9 3.2 ± 0.3 3.9 5.8JSH3 38.5 –16.7 13.0 25.1 ± 0.2 3.2 ± 0.4 3.4 ± 0.2 4.1 5.9
Table 4. Dasyatis lata and Sphyrna lewini. δ15N values of glutamic acid (Glu) and phenylalanine (Phe) for 11 stingrays (S1–S11)and 3 juvenile scalloped hammerhead sharks (JSH1–JSH3). Sizes are reported as disk width for stingrays and fork length forhammerhead sharks. TP1: trophic position estimated from δ15N values Glu and Phe using the trophic enrichment factor (TEF) of7.6‰ from Chikaraishi et al. (2009); see ‘Materials and methods’ for details. TP2: revised trophic position estimated by increas-ing TP1 by 1 (stingrays) and 0.7 (hammerhead sharks) trophic positions; see ‘Results’ for details. TEF2: recalculated TEF for each
individual sample based on their corresponding TP2 value
Dale et al.: Diet and nursery habitat of the brown stingray
lemon shark Negaparion brevirostris in a long-term(12 mo) controlled feeding experiment. However, theconcordance of TP estimates between stomach contentand stable isotope methods in our study supports theassumed ecosystem-level TEF of 2.7‰. Stomach con-tent and bulk tissue SIA both indicated an increase inTP with increasing size for juvenile brown stingrays,although these increases were generally small (0.3 to0.4 TPs). This small increase is predominantly drivenby stingrays shifting to larger, higher trophic level preywhile retaining crustaceans as their primary preyresource. There is little information on TPs for otherstingray species. A TP of 3.7 was estimated for marbledstingrays Dasyatis marmorata from the MediterraneanSea and skates primarily feeding on decapods had TPsranging from 3.5 to 3.9, values similar to thoseobserved in this study (Stergiou & Karpouzi 2002,Ebert & Bizzarro 2007).
Habitat use
Bulk SIA indicated a significant effect of capturelocation on stingray δ13C and δ15N values. Brownstingrays captured in the southern part of Kane‘oheBay were consistently depleted in 13C and enriched in15N compared with stingrays caught in the mid andnorth bay. A lack of spatial variation in juvenile brownstingray diet composition suggests stable isotopic dif-ferences are due to variability in baseline valuesbetween bay zones. Variation in baseline values is sup-ported by the independence of stingray bulk tissueδ15N values and TPs calculated from amino acid iso-topic analysis, which indicates stingray bulk tissueδ15N values are controlled primarily by variations inbaseline δ15N values within the bay. The south part ofKane‘ohe Bay is characterized by relatively long waterresidence times (13 d versus 8 d for the remainder ofthe bay), receives 30% of the stream runoff enteringthe bay and is bordered by relatively high levels ofhuman population (Smith et al. 1981). In addition, sed-iments may still be heavily affected by treated sewagedumped into the south bay from 1951 to 1978. Recentanalyses showed that high rates of dissolved inorganicnitrogen efflux continue to support macroalgae growthwithin the south bay (Smith et al. 1981, Stimson et al.2001). Cumulatively, these factors probably contributesubstantially to the low δ13C and high δ15N valuesfound in brown stingrays captured in the south part ofthe bay because freshwater and anthropogenic inputscan decrease δ13C and increase δ15N values, respec-tively, in coastal ecosystems (McClelland & Valiela1998, Vizzini et al. 2005). These results highlight theimportance of understanding spatial variability ofbasal stable isotopic values for foraging ecology stud-
ies, even in relatively small ecosystems. Our resultsshow that incorporation of stable isotopic analysis ofindividual amino acids can provide the informationnecessary for gaining insight into the underlyingcauses of variations in bulk tissue δ15N values.
Stable isotope analysis has been used to determineresidence time and detect small-scale migration withinand between habitats for a variety of fishes (e.g.Cocheret de la Morinière et al. 2003). Despite rela-tively long nitrogen isotopic turnover times for musclein elasmobranchs (>1 yr, MacNeil et al. 2006, Logan &Lutcavage 2010), we were able to detect both sitefidelity within and recent migrations between bayzones. Capture location for the majority of stingrayssampled during this study could be identified by theirbulk stable isotopic values, indicating long-term forag-ing in that area. In a previous study, brown stingraysactively tracked in the south part of Kane‘ohe Bayremained in the area for the duration of the study(>3 d, Cartamil et al. 2003). However, some stingraysdisplayed stable isotopic values distinctly differentfrom their capture location suggesting recent migra-tion between bay zones. Alternative methods such aspassive acoustic tracking and/or SIA that use tissueswith faster turnover times (e.g. blood, liver) might berequired to more accurately describe the movementpatterns of brown stingrays throughout the bay.
Analysis of individual amino acids in stingray musclesamples allowed us to evaluate competing hypothesesgenerated from bulk SIA and calculate TPs for brownstingrays (including very large stingrays from offshorehabitats) and juvenile scalloped hammerhead sharkswithout prior knowledge of the δ15N values of primaryproducers. Sampling of all potential primary producersin offshore habitats would have been challengingowing to the depths at which very large stingrays typi-cally occur (>40 m). Trophic positions based on recal-culated TEFs (stingrays range: 3.2 to 4.2; hammerheadsharks range: 3.9 to 4.1) were consistent with thosebased on stomach content and bulk SIA. The increasein stingray TP based on amino acid analysis was inde-pendent of bulk δ15N values (especially evident forvery large stingrays) and confirmed a foraging habitatshift from inside Kane‘ohe Bay to offshore waters. Theonset of this shift coincides closely with the onset ofsexual maturity. Males mature and migrate to offshorehabitats at a smaller size than do females (Fig. 6,J. Dale unpubl. data).
Heupel et al. (2007) proposed 3 criteria for definingan area as a nursery. (1) Juveniles are more commonlyencountered in the nursery than other areas. In ourcase, juvenile brown stingrays were rarely capturedduring ongoing longline fishing surveys outsideKane‘ohe Bay (J. Dale unpubl. data). (2) Juveniles havea tendency to remain or return for extended periods.
231

Mar Ecol Prog Ser 433: 221–236, 2011
Results from SIA suggest that juvenile brown stingraysforage within Kane‘ohe Bay for the majority of theirjuvenile lives. (3) The habitat is repeatedly used acrossyears. Juvenile stingrays were captured across multi-ple years during this study indicating repeated use ofthe bay habitat. Thus, based on the criteria proposedby Heupel et al. (2007), Kane‘ohe Bay is an importantnursery habitat for brown stingrays.
The relative ontogenetic and interspecific variationin TPs calculated from amino acid analysis, regardlessof the TEF used, was consistently represented forbrown stingrays and juvenile scalloped hammerheadsharks in the present study and further demonstratesthe value of this method for understanding the forag-ing ecology of elasmobranchs. All elasmobranchs arecarnivores, requiring a minimum TP of 3.0 (Wetherbee& Cortés 2004). However, in the present study, initialcalculations of absolute TPs systematically underesti-mated TP by ~1 TP for stingrays (range: 2.2 to 3.2) and~0.7 TP for juvenile scalloped hammerhead sharks(range: 3.2 to 3.4). Assuming the Δδ15NGlu/Phe of 3.4‰ iscorrect (Chikaraishi et al. 2009), we estimated an aver-age TEF of 5.0 ± 0.6‰ for brown stingray and scal-loped hammerhead shark muscle. A previous studythat used stable isotopic compositions of amino acidsfound a TEF of 3.6‰ more accurately represented pen-guin TPs (Lorrain et al. 2009). That difference wasattributed to the use of blood samples for isotopicanalysis, whereas earlier studies had used whole ani-mal or muscle tissue (McClelland & Montoya 2002,Chikaraishi et al. 2007, 2009, Popp et al. 2007, Han-nides et al. 2009).
The use of muscle in the present study precludes tis-sue biochemical effects as a viable explanation for thelower observed TEF from amino acid analysis. Alterna-tively, lower observed TEFs in brown stingray andjuvenile scalloped hammerhead shark muscle may bedue to lower reaction rates involving glutamic acid as aconsequence of urea retention for osmotic regulation(Evans et al. 2004). This has been suggested from elas-mobranch bulk tissue isotopic analysis (e.g. Fisk et al.2002, Hussey et al. 2010b) and is consistent with reten-tion of 15N-depleted waste products. Trophic enrich-ment of glutamic acid in elasmobranchs is more diffi-cult to explain but probably results from its frequentuse in transamination and deamination reactions(Gannes et al. 1998, Chikaraishi et al. 2007). Glutamatecan be converted to α-ketoglutarate by glutamatedehydrogenase (GDH) for use in the citric acid cycle(Ballantyne 1997) or converted to glutamine by gluta-mine synthetase to provide nitrogen to the ornithine–glutamine–urea pathway (Anderson 1991). Activitylevels of GDH provide a measure of importance ofamino acids as an oxidative substrate and a stronginverse relationship was found between hepatic GDH
and urea levels in elasmobranch muscle (Speers-Roesch et al. 2006). Increased importance of the gluta-mate–glutamine–urea pathway could result in lowerglutamate catabolism (Speers-Roesch et al. 2006) andreduced 15N enrichment in glutamic acid in muscle tis-sue. Elasmobranchs use a unique carbamoyl phos-phate synthetase (CPSase III) that utilizes glutamine inthe pool of free amino acids in liver mitochondrial cellsas the nitrogen-donating substrate rather than ammo-nia for urea formation (Julsrud et al. 1998). We specu-late that reduced hepatic glutamate catabolism re -sulted in lower 15N enrichment of glutamic acid inmuscle tissue of brown stingrays and juvenile scal-loped hammerhead sharks. Nitrogen isotope fractiona-tion associated with cleavage of the amide functionalgroup of glutamine should be smaller than that associ-ated with cleavage of the single amine group of gluta-mate because glutamine has 2 nitrogen atoms and only1 nitrogen bond is broken. Therefore we suggest that15N enrichment is lower in glutamic acid exiting theliver to form muscle protein in elasmobranchs withhigh muscle urea concentrations and perhaps in otheranimals that excrete urea (or uric acid) as a wasteproduct.
These results suggest that urea retention in elasmo-branchs can have important impacts on metabolicpathways involving glutamic acid that could influenceTPs determined with amino acid compound-specificisotopic analyses. Consequently, TP estimates basedon a TEF of 7.6‰ estimated from non-ureosmotic spe-cies would result in an underestimation of absolutestingray and hammerhead shark TPs. However, in theonly other study to use nitrogen isotopic analysis ofindividual amino acids to estimate TP for an elasmo-branch, Chikaraishi et al. (2010) estimated a TP of 4.8for a Squalus sp. using a TEF of 7.6‰. This is 0.6 to0.9 TPs higher than TPs estimated from stomach con-tent studies for this genus (3.9 to 4.2, Cortés 1999). It isknown that amino acids rather than lipids can beimportant oxidative substrates in elasmobranch mus-cle tissue (Ballantyne 1997), thus in addition to ureage-nesis, TEF could vary with relative animal activity. Forexample, the higher TEF we found for juvenile scal-loped hammerhead sharks could be due to lower ureaproduction in the liver or higher muscle activity inhammerhead sharks relative to brown stingrays. Thesecontradictory results emphasize the need to furtherinvestigate the relationship between urea content inelasmobranchs, hepatic GDH activity, animal activityand the extent of 15N enrichment in glutamic acid forwhite muscle tissue. In order to adapt to hypotonicenvironments, freshwater elasmobranchs retain lowlevels of urea (Thorson et al. 1967, Tam et al. 2003) andexpress higher levels of hepatic GDH activity than domarine elasmobranchs (Speers-Roesch et al. 2006).
232

Dale et al.: Diet and nursery habitat of the brown stingray
Therefore, future experimental studies should alsofocus on both marine and freshwater species to evalu-ate the potential effects of urea on amino acid TEFs.
Ecological interactions
Significant differences exist in the foraging ecologyof brown stingrays and juvenile scalloped hammer-head sharks, which suggests available prey resourcesare partitioned between these 2 species in Kane‘oheBay. Differences between diets were primarily due toa larger contribution of teleosts to the diet of juvenilehammerhead sharks and a larger contribution of por-tunids to the diet of juvenile stingrays. A larger con-tribution of teleosts to the hammerhead shark diet isalso supported by bulk tissue and amino acid stableisotope analysis. Hammerhead shark bulk muscle tis-sue was enriched in 15N by ~1.5‰ compared withjuvenile sting ray muscle, and the amino acid basedTP was higher by ~0.5, indicating that the hammer-head sharks are feeding higher in the food web.These dietary differences can potentially be ex -plained by differences in mouth morphology andprey capture behavior be tween species. Brownstingrays have larger mouths than juvenile scallopedhammerhead sharks, which would allow them to for-age on larger prey such as portunids. The prey cap-ture behavior of brown stingrays is similar to thatdescribed for the blue stingray Dasyatis chrysonota,Ebert & Cowley 2003). Once a prey item is located,the stingray quickly settles upon the substrate, trap-ping prey under its body, which is followed by suc-tion of prey into the mouth (J. Dale pers. obs.).Although this foraging mechanism is well suited forbenthic prey, it may limit the stingray’s ability tocatch faster, more mobile prey such as teleost fish. Incontrast, the use of ram feeding by the hammerheadsharks would facilitate capture and ingestion ofteleosts. Similar mechanisms were suggested to ex -plain low dietary overlap between a rhinobatid rayand sharks in an Australian bay (White et al. 2004).
CONCLUSIONS
Brown stingrays use Kane‘ohe Bay as a nurseryground and, while present, tend to show restrictedmovements within subsections of the bay. Stingraysmove out of the bay when they become sexuallymature although some adults are occasionally foundwithin the bay. Juvenile brown stingrays are generalistbenthic predators whose diets reflect the low diversityof potential prey items in Kane‘ohe Bay. Ontogeneticshifts in dietary composition are correlated with mouth
size, with larger individuals able to forage on larger,more energetically valuable prey. Future studies fo -cusing on the growth rates and energetics of brownstingrays would provide further insight into their rolein ecosystem energy flow and their effect on prey pop-ulations (e.g. Lowe 2002). This study demonstratedthat analysis of the nitrogen isotopic composition ofindividual amino acids is a viable method for detectingontogenetic foraging habitat shifts and determiningrelative trophic positions for elasmobranchs. However,our results suggest that the TEF used to calculateabsolute TP in previous studies requires adjustment forelasmobranchs, potentially owing to retention of ureaas an osmolyte and its effect on biochemical reactionsinvolving glutamic acid. Controlled experiments arerequired to better understand the effect of urea on themetabolic pathways of amino acids, particularly glu-tamic acid. Prey resource partitioning between brownstingrays and juvenile scalloped hammerhead sharksin Kane‘ohe Bay indicate competition for preyresources is not a factor contributing to high mortalityrates of hammerhead shark pups.
Acknowledgements. This research was funded by NationalScience Foundation grants to K. Y. Kaneshiro through the UHEECB program (DGE02-32016), to G. Trapido-Rosenthal, R.Bidigare, P. Bienfang and T. Hernscheidt (OCE-0852301) andto B.N.P and J. Drazen (OCE-1041329). Additional fundingwas provided by the PADI Foundation (2010-3930). We thankM. Burns, A. Stankus, C. Clark, C. Espasandin, J. Milisen andM. Freese for long-term assistance in the field. For generalsupport and assistance we thank Y. Papastamatiou, N. Whit-ney, T. Daly-Engel, M. Hutchinson, J. Anderson, C. Meyer,D. Grubbs and J. Drazen. We thank K. Longnecker andS. Godwin for assistance in prey identification, A. Bush foraccess to the original juvenile scalloped hammerhead sharkdiet data, J. M. Hayes for valuable discussion of nitrogen iso-tope fractionation associated with biosynthesis of amino acidsand E. Gier for assistance in stable isotope analysis. Thisstudy was carried out in accordance with the animal use pro-tocols of the University of Hawai‘i (protocol 06-030-5). This isSOEST contribution number 8152.
LITERATURE CITED
Anderson PM (1991) Glutamine-dependent urea synthesis inelasmobranch fishes. Biochem Cell Biol 69:317–319
Ballantyne JS (1997) Jaws: the inside story. The metabolism ofelasmobranch fishes. Comp Biochem Physiol B BiochemMol Biol 118:703–742
Barnes C, Sweeting CJ, Jennings S, Barry JT, Polunin NVC(2007) Effect of temperature and ration size on carbon andnitrogen stable isotope trophic fractionation. Funct Ecol21:356–362
Beck MW, Heck KL, Able KW, Childers DL and others (2001)The identification, conservation, and management of estuarine and marine nurseries for fish and invertebrates.Bioscience 51:633–641
Bizzarro J, Robinson H, Rinewalt C, Ebert D (2007) Compara-tive feeding ecology of four sympatric skate species offcentral California, USA. Environ Biol Fishes 80:197–220
233
Mar Ecol Prog Ser 433: 221–236, 2011
Bush A (2003) Diet and diel feeding periodicity of juvenilescalloped hammerhead sharks, Sphyrna lewini, inKaneohe Bay, Oahu, Hawaii. Environ Biol Fishes 67:1–11
Bush A, Holland K (2002) Food limitation in a nursery area:estimates of daily ration in juvenile scalloped hammer-heads, Sphyrna lewini (Griffith and Smith, 1834) inKane‘ohe Bay, O’ahu, Hawai’i. J Exp Mar Biol Ecol 278:157–178
Cartamil DP, Vaudo JJ, Lowe CG, Wetherbee BM, HollandKN (2003) Diel movement patterns of the Hawaiianstingray, Dasyatis lata: implications for ecological interac-tions between sympatric elasmobranch species. Mar Biol142: 841–847
Caut S, Angulo E, Courchamp F (2009) Variation in discrimi-nation factors (δ15N and δ13C): the effect of diet isotopicvalues and applications for diet reconstruction. J ApplEcol 46:443–453
Chikaraishi Y, Kashiyama Y, Ogawa NO, Kitazato H, Ohk-ouchi N (2007) Metabolic control of nitrogen isotope com-position of amino acids in macroalgae and gastropods:implications for aquatic food web studies. Mar Ecol ProgSer 342:85–90
Chikaraishi Y, Ogawa NO, Kashiyama Y, Takano Y and oth-ers (2009) Determination of aquatic food-web structurebased on compound-specific nitrogen isotopic composi-tion of amino acids. Limnol Oceanogr Methods 7:740–750
Chikaraishi Y, Ogawa NO, Ohkouchi N (2010) Further evalu-ation of the trophic level estimation based on nitrogen iso-topic composition of amino acids. In: Ohkouchi N, TayasuI, Koba K (eds) Earth, life and isotopes. Koyoto UniversityPress, Koyoto, p 37–51
Chipps SR, Garvey JE (2007) Quantitative assessment of foodhabits and feeding patterns. In: Guy C, Brown M (eds)Analysis and interpretation of freshwater fisheries data.American Fisheries Society, Bethesda, MD, p 473–514
Cocheret de la Morinière E, Pollux BJA, Nagelkerken I, Hem-minga MA, Huiskes AHL, van der Velde G (2003) Ontoge-netic dietary changes of coral reef fishes in the mangrove-seagrass-reef continuum: stable isotopes and gut-contentanalysis. Mar Ecol Prog Ser 246:279–289
Cortés E (1997) A critical review of methods of studying fishfeeding based on analysis of stomach contents: applicationto elasmobranch fishes. Can J Fish Aquat Sci 54:726–738
Cortés E (1999) Standardized diet compositions and trophiclevels of sharks. ICES J Mar Sci 56:707–717
Cortés E (2002) Incorporating uncertainty into demographicmodeling: application to shark populations and their con-servation. Conserv Biol 16:1048–1062
Devadoss P (1978) On the food of rays, Dasyatis uarnak(Forskal), D. alcockil (Annandale) and D. sephen (Fors -kal). Indian J Fish 25:1–8
Duncan KM, Holland KN (2006) Habitat use, growth rates anddispersal patterns of juvenile scalloped hammerheadsharks Sphyrna lewini in a nursery habitat. Mar Ecol ProgSer 312:211–221
Ebert DA, Bizzarro JJ (2007) Standardized diet compositionsand trophic levels of skates (Chondrichthyes: Rajiformes:Rajoidei). Environ Biol Fishes 80:221–237
Ebert DA, Cowley PD (2003) Diet, feeding behaviour andhabitat utilisation of the blue stingray Dasyatis chrysonota(Smith, 1828) in South African waters. Mar Freshw Res54:957–965
Evans DH, Piermarini PM, Choe KP (2004) Homeostasis:osmoregulation, pH regulation, and nitrogen excretion. In:Carrier JC, Musick JA, Heithaus MR (eds) Biology ofsharks and their relatives. CRC Press, Boca Raton, FL,p 247–268
Fantle MS, Dittel AI, Schwalm SM, Epifanio CE, Fogel ML(1999) A food web analysis of the juvenile blue crab, Calli -nectes sapidus, using stable isotopes in whole animals andindividual amino acids. Oecologia 120:416–426
Fisk AT, Tittlemier SA, Pranschke JL, Norstrom RJ (2002)Using anthropogenic contaminants and stable isotopes toassess the feeding ecology of greenland sharks. Ecology83:2162–2172
Gannes LZ, Martínez del Rio C, Koch P (1998) Natural abun-dance variations in stable isotopes and their potential usesin animal physiological ecology. Comp Biochem Physiol AMol Integr Physiol 119:725–737
Gelwicks JT, Hayes JM (1990) Carbon-isotope analysis of dis-solved acetate. Anal Chem 62:535–539
Gilliam D, Sullivan KM (1993) Diet and feeding habits of thesouthern stingray Dasyatis americana in the central Baha -mas. Bull Mar Sci 52:1007–1013
Graham B, Grubbs D, Holland K, Popp B (2007) A rapid onto-genetic shift in the diet of juvenile yellowfin tuna fromHawaii. Mar Biol 150:647–658
Hannides CCS, Popp BN, Landry MR, Graham BS (2009)Quantification of zooplankton trophic position in theNorth Pacific Subtropical Gyre using stable nitrogen iso-topes. Limnol Oceanogr 54:50–61
Harrison JT (1981) The influence of Alpheus mackayi onecosystem dynamics in Kaneohe Bay. PhD dissertation,University of Hawaii
Heppell SS, Crowder LB, Menzel TR (1999) Life table analy-sis of long-lived marine species with implications for con-servation and management. In: Musick JA (ed) Life in theslow lane: ecology and conservation of long-lived marineanimals. Am Fish Soc Symp 23, Bethesda, MD, p 137–148
Hess PW (1961) Food habits of two dasyatid rays in DelawareBay. Copeia 1961:239–241
Heupel MR, Carlson JK, Simpfendorfer CA (2007) Sharknursery areas: concepts, definition, characterization andassumptions. Mar Ecol Prog Ser 337:287–297
Holland KN, Wetherbee BM, Peterson JD, Lowe CG (1993)Movements and distribution of hammerhead shark pupson their natal grounds. Copeia 1993:495–502
Hussey NE, Brush J, McCarthy ID, Fisk AT (2010a) δ15N andδ13C diet-tissue discrimination factors for large sharksunder semi-controlled conditions. Comp Biochem PhysiolA Mol Integr Physiol 155:445–453
Hussey NE, MacNeil MA, Fisk AT (2010b) The requirementfor accurate diet-tissue discrimination factors for interpret-ing stable isotopes in sharks. Comment on: stable isotopedynamics in elasmobranch fishes. Hydrobiologia 654:1–5
Hyslop EJ (1980) Stomach contents analysis — a review ofmethods and their application. J Fish Biol 17:411–429
Ismen A (2003) Age, growth, reproduction and food of com-mon stingray (Dasyatis pastinaca L., 1758) in IskenderunBay, the eastern Mediterranean. Fish Res 60:169–176
Jennings D, Gruber S, Franks B, Kessel S, Robertson A (2008)Effects of large-scale anthropogenic development onjuvenile lemon shark (Negaprion brevirostris) populationsof Bimini, Bahamas. Environ Biol Fishes 83:369–377
Julsrud EA, Walsh PJ, Anderson PM (1998) N-acetyl-L- glutamate and the urea cycle in gulf toadfish (Opsanusbeta) and other fish. Arch Biochem Biophys 350:55–60
Krebs CJ (1999) Ecological methodology, 2nd edn. Addison-Welsey Educational Publishers, Menlo Park, CA
Logan J, Lutcavage M (2010) Stable isotope dynamics in elas-mobranch fishes. Hydrobiologia 644:231–244
Lorrain A, Graham B, Ménard F, Popp B, Bouillon S, vanBreugel P, Cherel Y (2009) Nitrogen and carbon isotopevalues of individual amino acids: a tool to study foraging
234

Dale et al.: Diet and nursery habitat of the brown stingray 235
ecology of penguins in the Southern Ocean. Mar Ecol ProgSer 391:293–306
Lotze HK, Lenihan HS, Bourque BJ, Bradbury RH and others(2006) Depletion, degradation, and recovery potential ofestuaries and coastal seas. Science 312:1806–1809
Lowe CG (2002) Bioenergetics of free-ranging juvenile scal-loped hammerhead sharks (Sphyrna lewini) in Kane‘oheBay, O’ahu, HI. J Exp Mar Biol Ecol 278:141–156
Lucifora LO, García VB, Menni RC, Escalante AH (2006) Foodhabits, selectivity, and foraging modes of the school sharkGaleorhinus galeus. Mar Ecol Prog Ser 315:259–270
Macko SA, Uhle ME, Engel MH, Andrusevich V (1997) Stablenitrogen isotope analysis of amino acid enantiomers bygas chromatography/combustion/isotope ratio mass spec-trometry. Anal Chem 69:926–929
MacNeil MA, Gregory BS, Aaron TF (2005) Stable isotopesfrom multiple tissues reveal diet switching in sharks. MarEcol Prog Ser 302:199–206
MacNeil MA, Drouillard KG, Fisk AT (2006) Variable uptakeand elimination of stable nitrogen isotopes between tis-sues in fish. Can J Fish Aquat Sci 63:345–353
McClelland JW, Montoya JP (2002) Trophic relationships andthe nitrogen isotopic composition of amino acids in plank-ton. Ecology 83:2173–2180
McClelland JW, Valiela I (1998) Changes in food web struc-ture under the influence of increased anthropogenic nitro-gen inputs to estuaries. Mar Ecol Prog Ser 168:259–271
McCutchan JH, Lewis WM, Kendall C, McGrath CC (2003)Variation in trophic shift for stable isotope ratios of carbon,nitrogen, and sulfur. Oikos 102:378–390
Metges CC, Petzke KJ, Hennig U (1996) Gas chromato -graphy/combustion/isotope ratio mass spectrometric com-parison of N-acetyl- and N-pivatoyl amino acid esters tomeasure 15N isotopic abundances in physiological sam-ples: a pilot study on amino acid synthesis in the uppergastro-intestinal track of minipigs. J Mass Spectrom 31:367–376
Pakhomov EA, McClelland JW, Bernard K, Kaehler S, Mon-toya JP (2004) Spatial and temporal shifts in stable iso-tope values of the bottom-dwelling shrimp Nauticarismarionis at the sub-Antarctic archipelago. Mar Biol 144:317–325
Peterson CH, Fodrie FJ, Summerson HC, Powers SP (2001)Site-specific and density-dependent extinction of prey byschooling rays: generation of a population sink in top qual-ity habitat for bay scallops. Oecologia 129:349–356
Pinkas L, Oliphant MS, Iverson ILK (1971) Food habits ofalbacore, bluefin tuna and bonito in Californian waters.Calif Dept Fish Game Fish Bull 152, Sacramento, CA
Pinnegar JK, Polunin NVC (1999) Differential fractionation ofδ13C and δ15N among fish tissues: implications for thestudy of trophic interactions. Funct Ecol 13:225–231
Platell ME, Potter IC (2001) Partitioning of food resourcesamongst 18 abundant benthic carnivorous fish species inmarine waters on the lower west coast of Australia. J ExpMar Biol Ecol 261:31–54
Popp BN, Graham BS, Olson RJ, Hannides CCS and others(2007) Insight into the trophic ecology of yellowfin tuna,Thunnus albacares, from compound-specific nitrogen iso-tope analysis of proteinaceous amino acids. In: DawsonTE, Siegwolf RTW (eds) Stable isotopes as indicators ofecological change. Elsevier, Amsterdam, p 173–190
Post DM (2002) Using stable isotopes to estimate trophic position: models, methods, and assumptions. Ecology 83:703–718
Post DM, Layman CA, Arrington DA, Takimoto G, QuattrochiJ, Montaña CG (2007) Getting to the fat of the matter:
models, methods and assumptions for dealing with lipidsin stable isotope analyses. Oecologia 152:179–189
Randall JE (2007) Reef and shore fishes of the HawaiianIslands. Sea Grant College Program, University of Hawaii,Honolulu, HI
Scharf FS, Juanes F, Rountree RA (2000) Predator size-preysize relationships of marine fish predators: interspecificvariation and effects of ontogeny and body size on trophic-niche breadth. Mar Ecol Prog Ser 208:229–248
Schmidt K, McClelland JW, Mente E, Montoya JP, AtkinsonA, Voss M (2004) Trophic-level interpretation based onδ15N values: implications of tissue-specific fractionationand amino acid composition. Mar Ecol Prog Ser 266:43–58
Shulman MJ (1985) Recruitment of coral reef fishes: effectsof distribution of predators and shelter. Ecology 66:1056–1066
Smith CR, Kukert H (1996) Macrobenthic community struc-ture, secondary production, and rates of bioturbation andsedimentation at the Kaneohe Bay lagoon floor. Pac Sci50:211–229
Smith SV, Kimmerer WJ, Laws EA, Brock RW, Walsh TW(1981) Kaneohe Bay sewage diversion experiment: per-spectives on ecosystem responses to nutritional perturba-tion. Pac Sci 35:279–395
Snelson FF Jr, Williams SE (1981) Notes on the occurrence,distribution, and biology of elasmobranch fishes in theIndian River lagoon system, Florida. Estuaries 4:110–120
Speers-Roesch B, Ip YK, Ballantyne JS (2006) Metabolic orga-nization of freshwater, euryhaline, and marine elasmo-branchs: implications for the evolution of energy metabo-lism in sharks and rays. J Exp Biol 209:2495–2508
Stergiou KI, Karpouzi VS (2002) Feeding habits and trophiclevels of Mediterranean fish. Rev Fish Biol Fish 11:217–254
Stimson J, Larned ST, Conklin E (2001) Effects of herbivory,nutrient levels, and introduced algae on the distributionand abundance of the invasive macroalga Dictyosphaeriacavernosa in Kaneohe Bay, Hawaii. Coral Reefs 19:343–357
Struhsaker P (1969) Observations on the biology and distribu-tion of the thorny stingray, Dasyatis centroura (Pisces:Dasyatidae). Bull Mar Sci 19:456–481
Tam WL, Wong WP, Loong AM, Hiong KC, Chew SF, Ballan-tyne JS, Ip YK (2003) The osmotic response of the Asianfreshwater stingray (Himantura signifer) to increasedsalinity: a comparison with marine (Taeniura lymma) andAmazonian freshwater (Potamotrygon motoro) stingrays.J Exp Biol 206:2931–2940
Taniuchi T, Shimizu M (1993) Dental sexual dimorphism andfood habits in the stingray Dasyatis akajei from Tokyo Bay,Japan. Bull Jpn Soc Sci Fish 59:53–60
Thorson TB, Cowan CM, Watson DE (1967) Potamotrygonspp.: elasmobranchs with low urea content. Science 158:375–377
Thrush SF, Pridmore JE, Hewitt JE, Cummings VJ (1994) Theimportance of predators on a sandflat: interplay betweenseasonal changes in prey density and predator effects.Mar Ecol Prog Ser 107:211–222
Ueda K, Morgan SL, Fox A, Gilbart J, Sonesson A, Larsson L,Odham G (1989) D-Alanine as a chemical marker forthe determination of streptococcal cell wall levels in mammalian tissues by gas chromatography/negative ionchemical ionization mass spectrometry. Anal Chem 61:265–270
Uhle ME, Macko SA, Spero HJ, Engel MH, Lea DW (1997)Sources of carbon and nitrogen in modern planktonicforaminifera: the role of algal symbionts as determined by
Mar Ecol Prog Ser 433: 221–236, 2011
bulk and compound specific stable isotopic analyses. OrgGeochem 27:103–113
VanBlaricom GR (1982) Experimental analyses of structuralregulation in a marine sand community exposed tooceanic swell. Ecol Monogr 52:283–305
Vander Zanden JM, Rasmussen JB (2001) Variation in δ15Nand δ13C trophic fractionation: implications for aquaticfood web studies. Limnol Oceanogr 46:2061–2066
Vanderklift MA, Ponsard S (2003) Sources of variation in con-sumer-diet δ15N enrichment: a meta-analysis. Oecologia136:169–182
Vizzini S, Savona B, Chi T, Mazzola A (2005) Spatial variabil-ity of stable carbon and nitrogen isotope ratios in a
Mediterranean coastal lagoon. Hydrobiologia 550:73–82Wetherbee BM, Cortés E (2004) Food consumption and feed-
ing habits. In: Carrier JC, Musick JA, Heithaus MR (eds)Biology of sharks and their relatives. CRC Press, BocaRaton, FL, p 225–246
White WT, Platell ME, Potter IC (2004) Comparisons betweenthe diets of four abundant species of elasmobranchs in asubtropical embayment: implications for resource parti-tioning. Mar Biol 144:439–448
Yeldan H, Avsar D, Manasirli M (2009) Age, growth and feed-ing of the common stingray (Dasyatis pastinaca, L., 1758)in the Cilician coastal basin, northeastern MediterraneanSea. J Appl Ichthyol 25(s1):98–102
236
Editorial responsibility: Yves Cherel, Villiers-en-Bois, France
Submitted: December 23, 2010; Accepted: April 14, 2011Proofs received from author(s): June 22, 2011