nurse manager scope and span of control: an … · measure nurse manager scope and span of control...
TRANSCRIPT

Dawndra Jones MSN, RN, NEA-BC, Sr. Director of Strategic Initiatives
Christopher Gebbens, BS, BA, Financial Analyst
Maribeth McLaughlin BSN, RN, MPM, CNO, VP Magee Womens Hospital
Lorraine Brock MSN, RN, Director of Nurse Recruitment
Nurse Manager Scope and Span of Control: An
Objective Business and Measurement Model

Disclosures
Today’s presenters do not have any relevant financial interests
or endorsement of products.
Participants must attend the entire session(s) in order to earn
contact hour credit. Continuing Nursing Education credit can
be earned by completing the online session evaluation.
The American Organization of Nurse Executives is accredited as a provider of
continuing nursing education by the American Nurses Credentialing Center’s
Commission on Accreditation.
Welcome
2

• Describe the importance of measuring scope and span of
control for nurse managers success in their role.
• Discuss the components of a method used to successfully
measure nurse manager scope and span of control
Objectives

• Global health enterprise
headquartered in Pittsburgh,
Pennsylvania
• Operates more than 20
academic, community, and
specialty hospitals and 400
outpatient sites, offers an
array of rehabilitation,
retirement, and long-term
care facilities
• Pennsylvania’s largest
employer, with more than
55,000 employees
• Over 12,000 nurses
UPMC
4

“Create the best patient experience, nationally and
internationally, through the selection, development,
retention and reward of the highest performing nurses
while creating systems and programs that creates
consistency and excellence in patient care.”
UPMC Nursing Vision
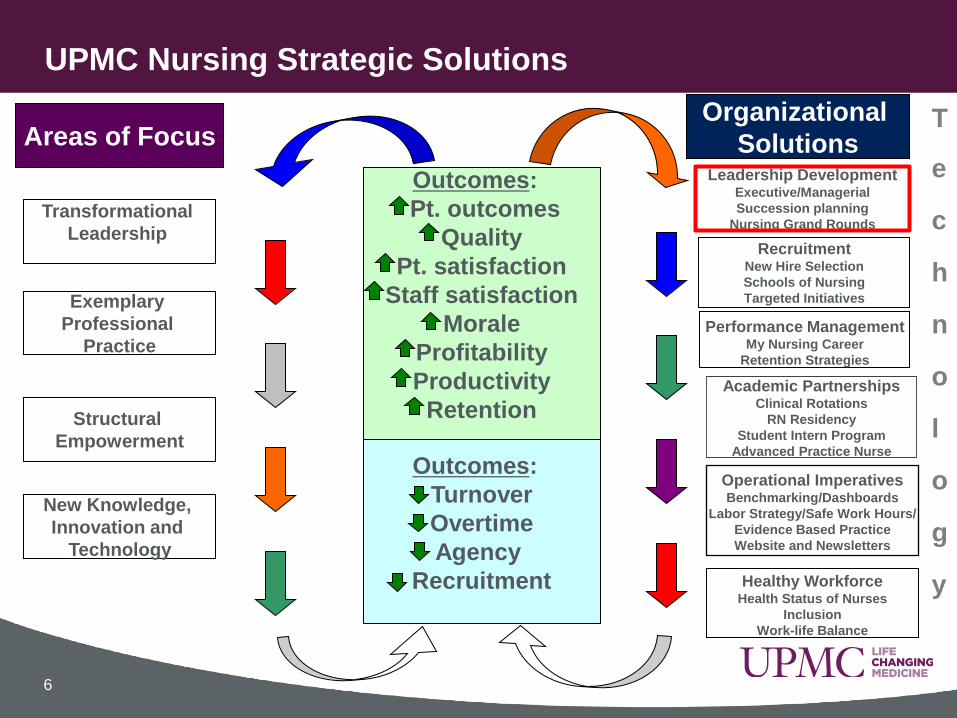
UPMC Nursing Strategic Solutions
Outcomes:
Turnover
Overtime
Agency
Recruitment
Outcomes:
Pt. outcomes
Quality
Pt. satisfaction
Staff satisfaction
Morale
Profitability
Productivity
Retention
Areas of Focus Organizational
Solutions Leadership Development
Executive/Managerial
Succession planning
Nursing Grand Rounds
Recruitment New Hire Selection
Schools of Nursing
Targeted Initiatives
Performance Management
My Nursing Career
Retention Strategies
Academic Partnerships Clinical Rotations
RN Residency
Student Intern Program
Advanced Practice Nurse
Healthy Workforce Health Status of Nurses
Inclusion
Work-life Balance
Exemplary
Professional
Practice
Transformational
Leadership
Structural
Empowerment
New Knowledge,
Innovation and
Technology
Operational Imperatives Benchmarking/Dashboards
Labor Strategy/Safe Work Hours/
Evidence Based Practice
Website and Newsletters
T
e
c
h
n
o
l
o
g
y
6

• Unit Directors (Nurse Manager)
– Operational accountability
– Manage the daily priorities
– Employee relations
– Drive department’s care delivery
– Fiscal accountability
Key to Achieving Outcomes
7

Unit Director’s Influences to Reach Priorities/Goals
8
Staff Participation
Staff Satisfaction
Organizational Priorities/Goal
Patient Satisfaction
Care Delivery
Unit Director Department nurse manager
• Plan
• Organize
• Staff
• Direct
• Control
• Decision Making

9
Unit
Director
Role
Job Satisfaction
Vacancy
Turnover
Overlapping Challenges
Weak Pipeline
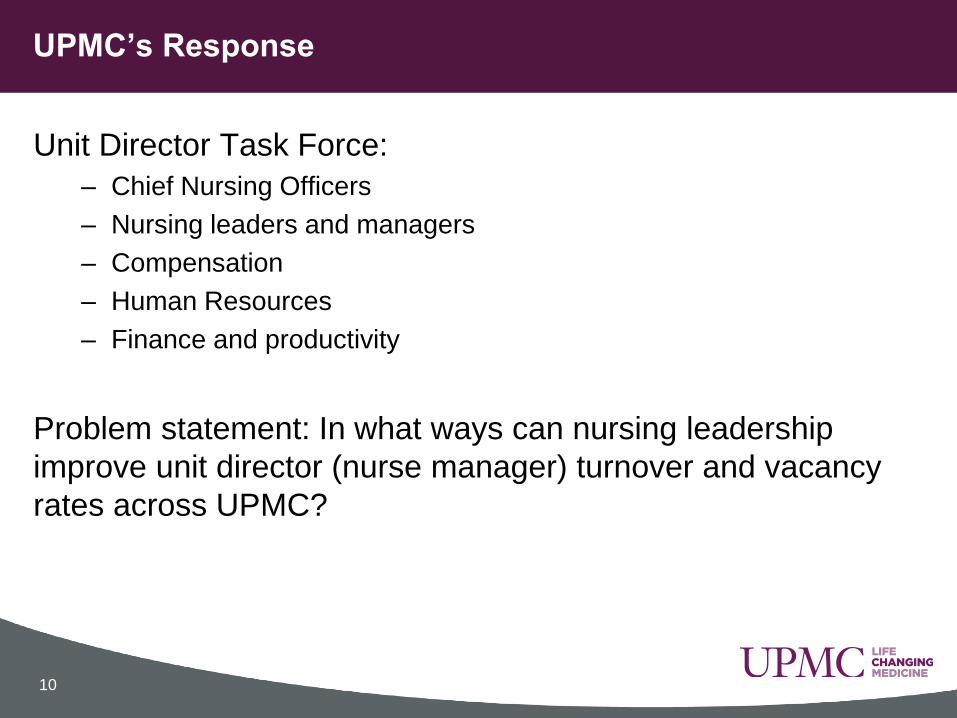
Unit Director Task Force:
– Chief Nursing Officers
– Nursing leaders and managers
– Compensation
– Human Resources
– Finance and productivity
Problem statement: In what ways can nursing leadership
improve unit director (nurse manager) turnover and vacancy
rates across UPMC?
UPMC’s Response
10

• Surveyed nurse managers
• Focus groups with shared governance councils
• Surveyed to CNOs
• Literature review
Assessment
11

Varying Workload
Scope
Span of control
ADT
Hours of operations
Varying Financial Stewardship
Budget
Supplies
Capital
Minimal Succession Planning
Staff development
Operational support
Work-life Balance
Majority work 50+ hours/week
Uninterrupted time off
~12% satisfied
Assessment Findings
12

• Successful Unit Directors/Nurse Manager
– Transformational leaders
– Strong communication regarding organization goals, values and
vision
– Positive personality traits, extroverted, openness, optimism
– Tenured within organization
– Embraces autonomy, shared governance, empowerment of staff
– Advanced nursing degree
– Attitude of “I own it”- accountable
– Self awareness and confidence
– Self management: transparency and adaptability, initiative,
empathetic
– Social awareness
The Evidence Supports
13
Force, M. (2005) The Relationship Between Effective Nurse Managers and Nursing Retention, JONA, 35(7/8).
Goleman, D., Boyatzis, R., and McKee, A. (2002). Primal Leadership.
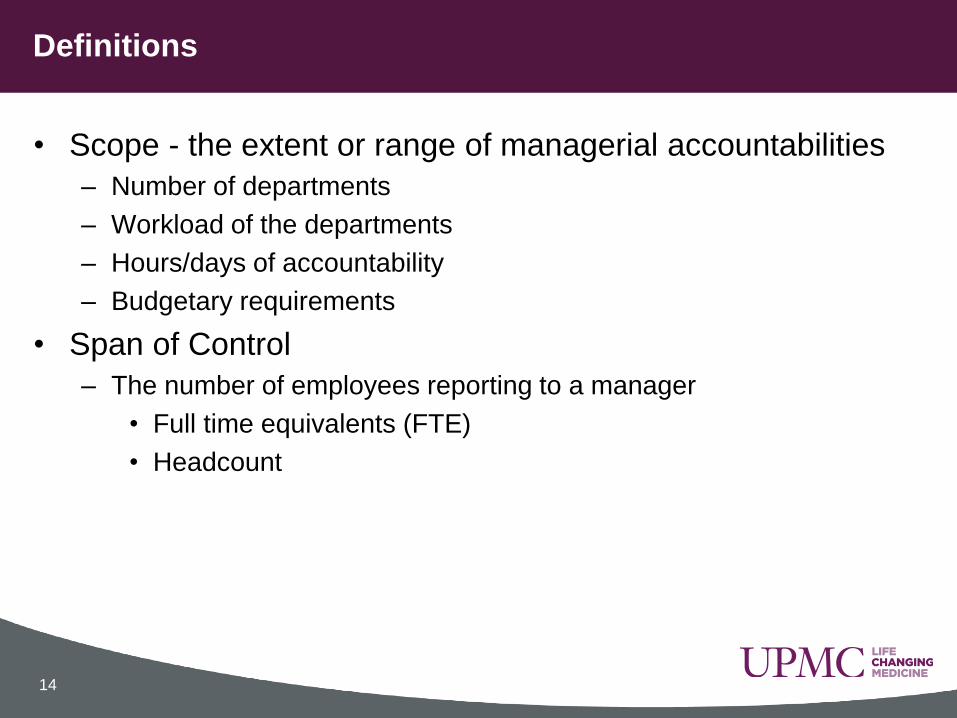
• Scope - the extent or range of managerial accountabilities
– Number of departments
– Workload of the departments
– Hours/days of accountability
– Budgetary requirements
• Span of Control
– The number of employees reporting to a manager
• Full time equivalents (FTE)
• Headcount
Definitions
14

Span of Control in the literature
• Advisory Board – Hospital-Wide
Footnotes: 1 Represents headcount data for 95 hospitals.
2 Includes supervisors and frontline staff per manager
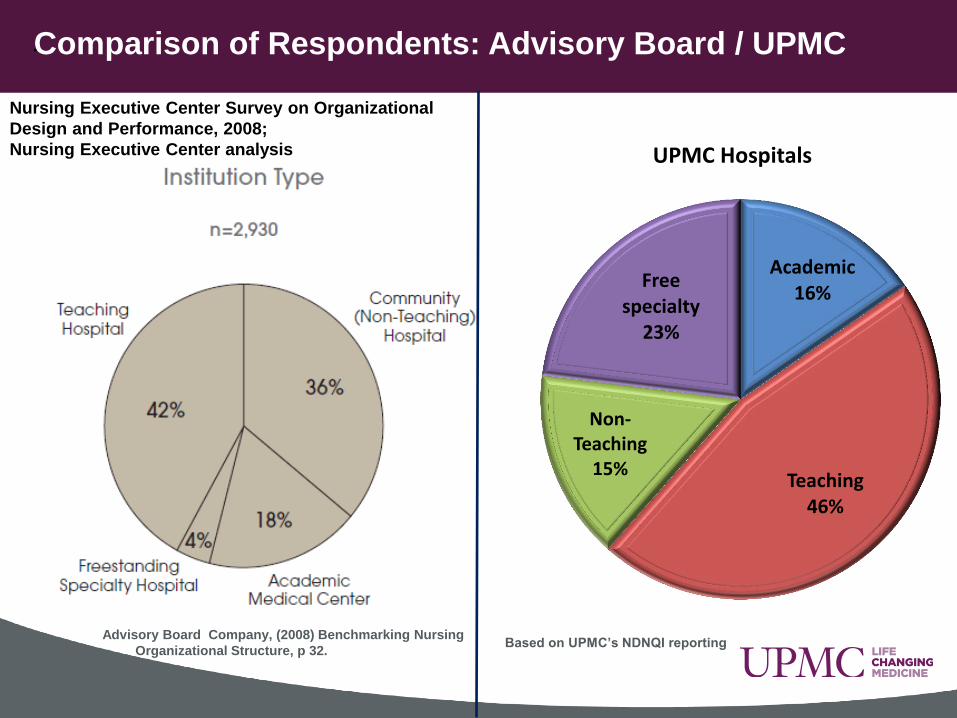
. Comparison of Respondents: Advisory Board / UPMC
Nursing Executive Center Survey on Organizational
Design and Performance, 2008;
Nursing Executive Center analysis
Academic 16%
Teaching 46%
Non-Teaching
15%
Free specialty
23%
UPMC Hospitals
Based on UPMC’s NDNQI reporting Advisory Board Company, (2008) Benchmarking Nursing
Organizational Structure, p 32.
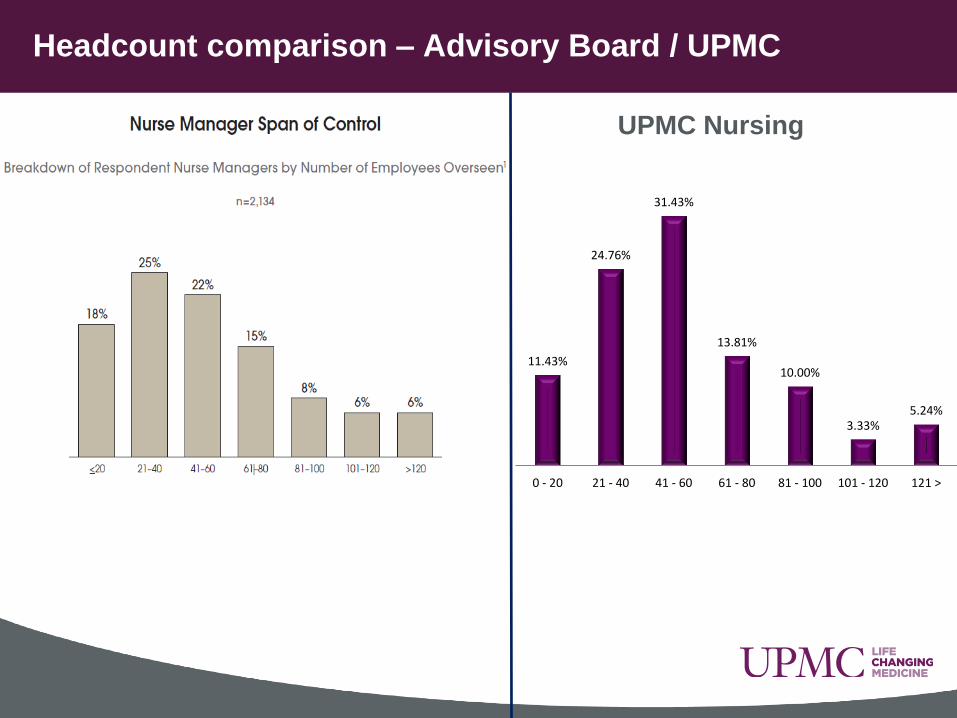
Headcount comparison – Advisory Board / UPMC
11.43%
24.76%
31.43%
13.81%
10.00%
3.33% 5.24%
0 - 20 21 - 40 41 - 60 61 - 80 81 - 100 101 - 120 121 >
UPMC Nursing

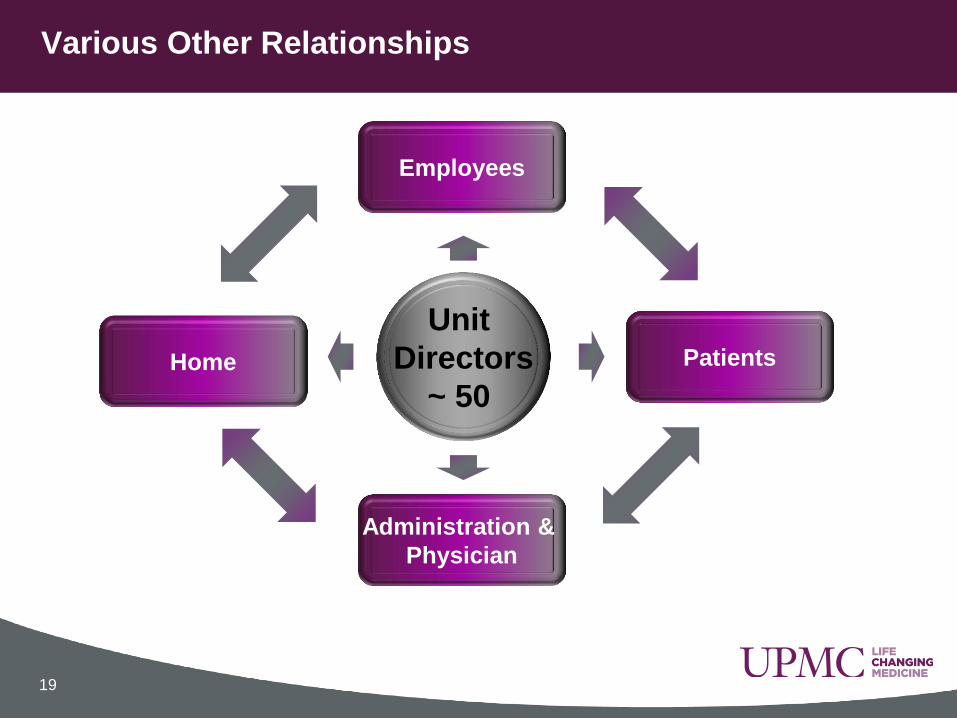
1manager/ 6 director reports = 222 relationships
Relationships Increases with Span of Control
18
Hindle,T. (2009), Span of Control, The Economist, London: The Economist Newspaper Limited
19
Various Other Relationships
Unit
Directors
~ 50 Home
Employees
Administration &
Physician
Patients
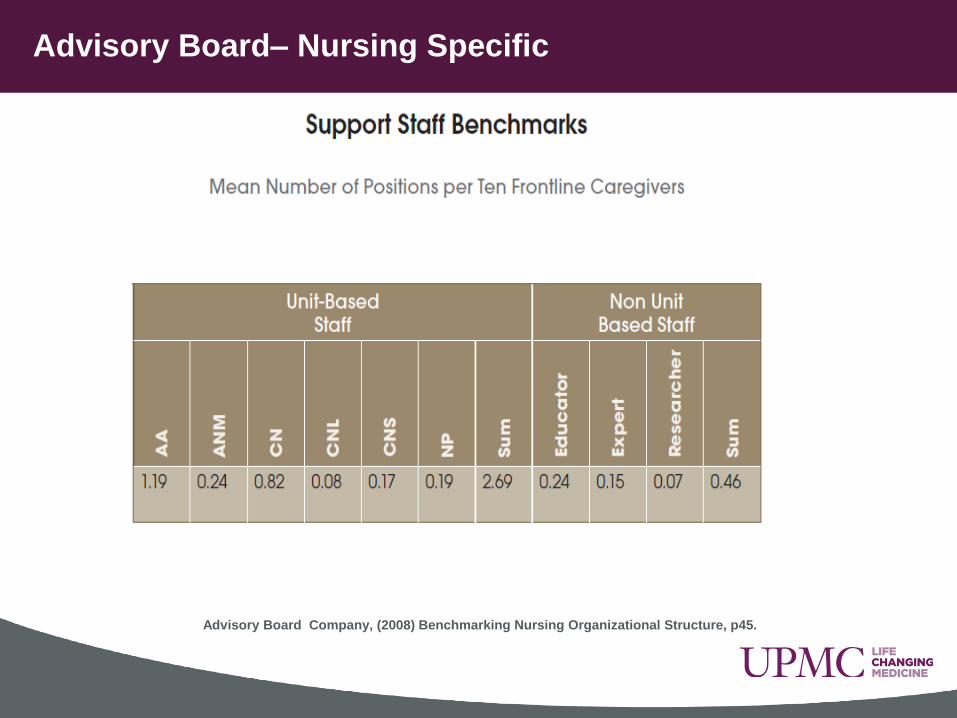
Advisory Board– Nursing Specific
Advisory Board Company, (2008) Benchmarking Nursing Organizational Structure, p45.
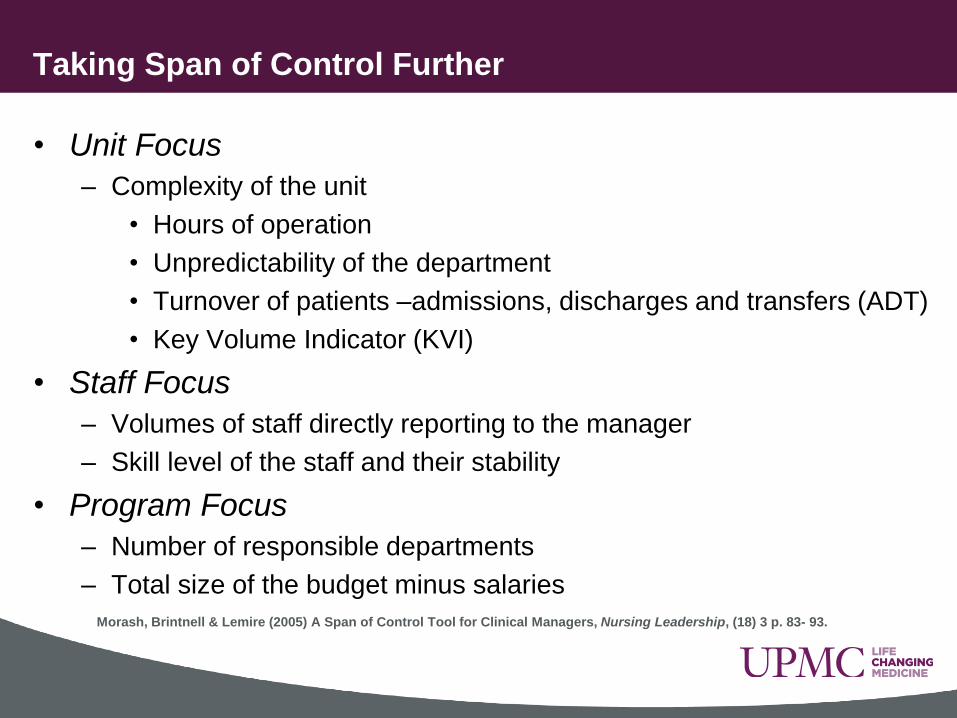
• Unit Focus
– Complexity of the unit
• Hours of operation
• Unpredictability of the department
• Turnover of patients –admissions, discharges and transfers (ADT)
• Key Volume Indicator (KVI)
• Staff Focus
– Volumes of staff directly reporting to the manager
– Skill level of the staff and their stability
• Program Focus
– Number of responsible departments
– Total size of the budget minus salaries
Taking Span of Control Further
Morash, Brintnell & Lemire (2005) A Span of Control Tool for Clinical Managers, Nursing Leadership, (18) 3 p. 83- 93.

UPMC’s Distribution of Measurements
Staff Focus 45%
Unit Focus 45%
Program Focus 10%
Hours of Operation 20% ADT or Required Hours 25%
Cost Center 5% Controllable Expenses 5%
Headcount 45%

5 Overall Categories Weighted Using a Point System:
Measuring Span of Control
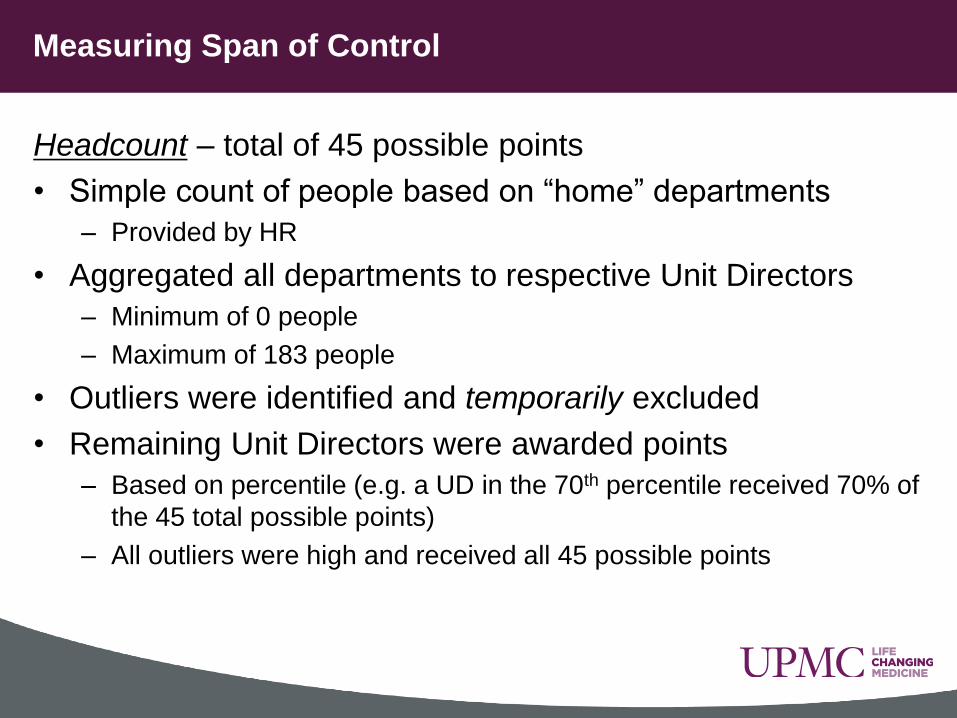
Headcount – total of 45 possible points
• Simple count of people based on “home” departments
– Provided by HR
• Aggregated all departments to respective Unit Directors
– Minimum of 0 people
– Maximum of 183 people
• Outliers were identified and temporarily excluded
• Remaining Unit Directors were awarded points
– Based on percentile (e.g. a UD in the 70th percentile received 70% of
the 45 total possible points)
– All outliers were high and received all 45 possible points

Measuring Scope and Span of Control
ADT or Direct Required Hours – total of 25 possible points
• Clinical nursing units or Non-nursing departments
– Clinical nursing units evaluated using ADT ADT = Admission + Discharge + Observation + Transfers in + Transfers Out
Contact Census (start census + Admissions + Transfers in)
– Non-nursing units evaluated using budgeted direct required hours • Amount of actual patient related time each department should be staffing
• Each departed awarded points using the same method as
“headcount”
– Identify outliers, rank in percentiles, award points
• Aggregated departments under respective Unit Directors
– Averaged points to compensate for multiple departments

Measuring Scope and Span of Control
Hours of Operation – total of 20 possible points
• Actual charged hours to departments during 6 months
• Hours divided into 4 categories
– Daylight: All departments received 2 points
– Weekend: 6 points
• Approximately 28% (2/7) of the week is weekend
• Threshold lowered to 20% for staffing fluctuations
– Off-Shift: 6 points
• Approximately 36% (1/2 of each of 5 weekdays)
• Minimum threshold lowered to 27%
– Holiday: 6 points
• 2 holidays during the 184 day period – or 1%
• Minimum threshold lowered to 0.5%
• Department points averaged when aggregated
Measuring Scope and Span of Control
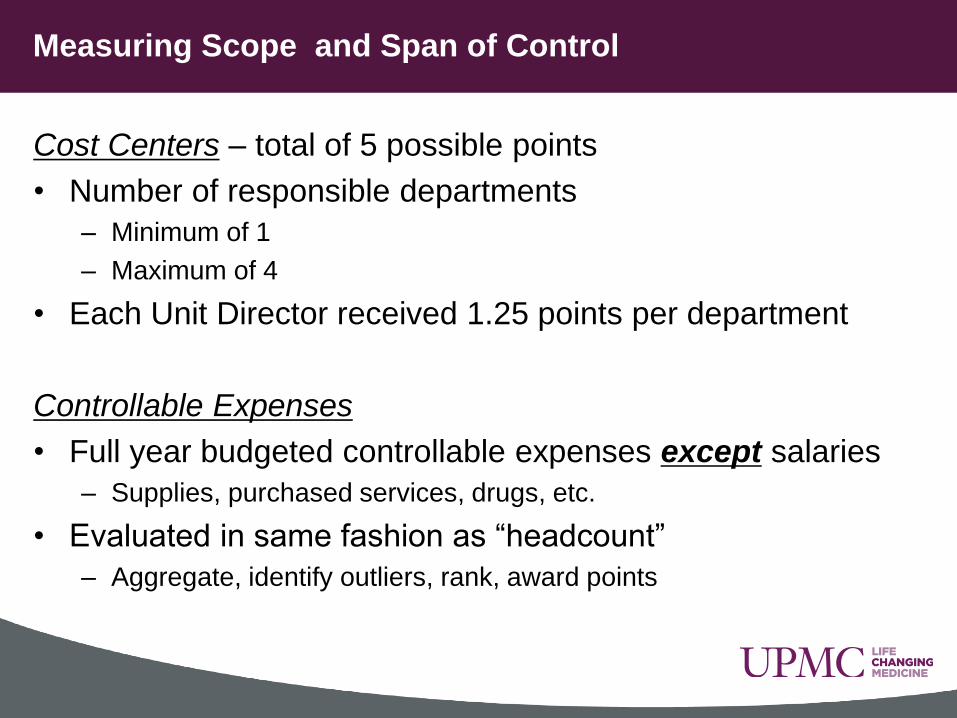
Cost Centers – total of 5 possible points
• Number of responsible departments
– Minimum of 1
– Maximum of 4
• Each Unit Director received 1.25 points per department
Controllable Expenses
• Full year budgeted controllable expenses except salaries
– Supplies, purchased services, drugs, etc.
• Evaluated in same fashion as “headcount”
– Aggregate, identify outliers, rank, award points

Steps in Creating Ranking
28
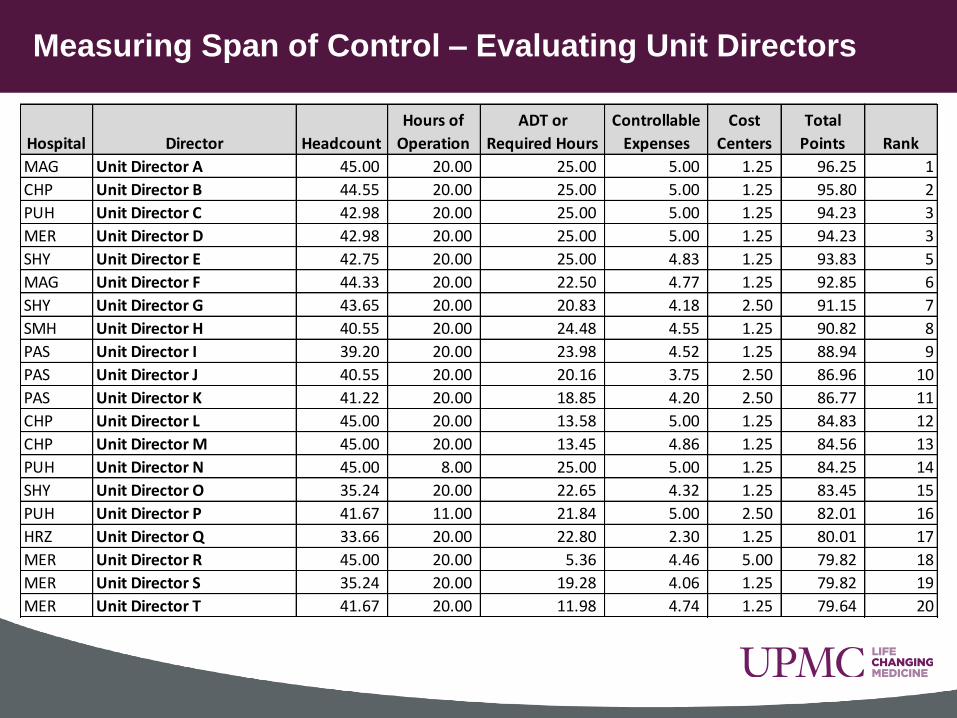
Measuring Span of Control – Evaluating Unit Directors
Hospital Director Headcount
Hours of
Operation
ADT or
Required Hours
Controllable
Expenses
Cost
Centers
Total
Points Rank
MAG Unit Director A 45.00 20.00 25.00 5.00 1.25 96.25 1
CHP Unit Director B 44.55 20.00 25.00 5.00 1.25 95.80 2
PUH Unit Director C 42.98 20.00 25.00 5.00 1.25 94.23 3
MER Unit Director D 42.98 20.00 25.00 5.00 1.25 94.23 3
SHY Unit Director E 42.75 20.00 25.00 4.83 1.25 93.83 5
MAG Unit Director F 44.33 20.00 22.50 4.77 1.25 92.85 6
SHY Unit Director G 43.65 20.00 20.83 4.18 2.50 91.15 7
SMH Unit Director H 40.55 20.00 24.48 4.55 1.25 90.82 8
PAS Unit Director I 39.20 20.00 23.98 4.52 1.25 88.94 9
PAS Unit Director J 40.55 20.00 20.16 3.75 2.50 86.96 10
PAS Unit Director K 41.22 20.00 18.85 4.20 2.50 86.77 11
CHP Unit Director L 45.00 20.00 13.58 5.00 1.25 84.83 12
CHP Unit Director M 45.00 20.00 13.45 4.86 1.25 84.56 13
PUH Unit Director N 45.00 8.00 25.00 5.00 1.25 84.25 14
SHY Unit Director O 35.24 20.00 22.65 4.32 1.25 83.45 15
PUH Unit Director P 41.67 11.00 21.84 5.00 2.50 82.01 16
HRZ Unit Director Q 33.66 20.00 22.80 2.30 1.25 80.01 17
MER Unit Director R 45.00 20.00 5.36 4.46 5.00 79.82 18
MER Unit Director S 35.24 20.00 19.28 4.06 1.25 79.82 19
MER Unit Director T 41.67 20.00 11.98 4.74 1.25 79.64 20
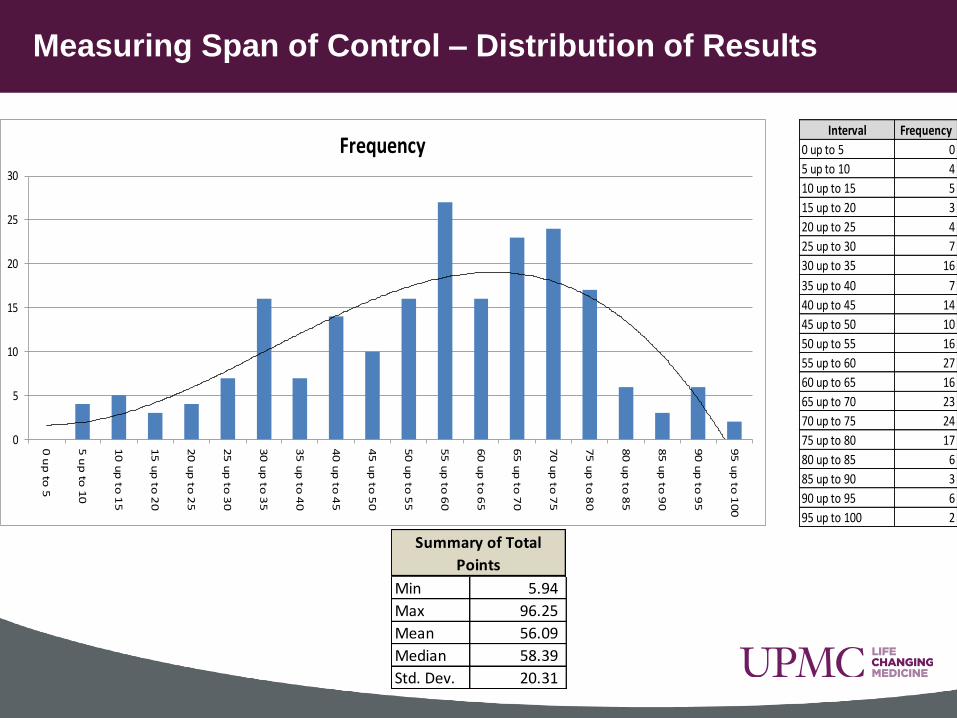
Measuring Span of Control – Distribution of Results
Interval Frequency
0 up to 5 0
5 up to 10 4
10 up to 15 5
15 up to 20 3
20 up to 25 4
25 up to 30 7
30 up to 35 16
35 up to 40 7
40 up to 45 14
45 up to 50 10
50 up to 55 16
55 up to 60 27
60 up to 65 16
65 up to 70 23
70 up to 75 24
75 up to 80 17
80 up to 85 6
85 up to 90 3
90 up to 95 6
95 up to 100 2
0
5
10
15
20
25
30
0 u
p to
5
5 u
p to
10
10
up
to 1
5
15
up
to 2
0
20
up
to 2
5
25
up
to 3
0
30
up
to 3
5
35
up
to 4
0
40
up
to 4
5
45
up
to 5
0
50
up
to 5
5
55
up
to 6
0
60
up
to 6
5
65
up
to 7
0
70
up
to 7
5
75
up
to 8
0
80
up
to 8
5
85
up
to 9
0
90
up
to 9
5
95
up
to 1
00
Frequency
Min 5.94
Max 96.25
Mean 56.09
Median 58.39
Std. Dev. 20.31
Summary of Total
Points

Measuring Scope and Span of Control Interpreting Results
• Span of Control Tool evaluated by University of Pittsburgh statistician
– Main purpose was to establish tiers for allocating administrative support and
to determine the validity of the tool
Defining Tiers
• Statistician recommended the 10th and 90th percentiles
• Statistician found significant difference between groups
– Results indicate need to different support
• 90th+ Percentile (n=21)
High Tier
• 90th to 10th Percentile (n=168)
Middle Tier
• Below 10th Percentile (n=21)
Low Tier

Unit Director Support
Operational Support:
• Clinician or other type of nurse in the department
– Assists with the day to day operations (schedules, staffing, audits,
RCA, patient rounds)
– Assists with performance management
• Support level is determined by the headcount
– Recommendation is in hours of indirect time per week, pay period,
and year
– Guide for budgeting – this could be accomplished by redirecting
hours from direct to indirect or from other indirect activity
Formula: Headcount X 0.12 hours (Advisory Board)
per 10 Staff

Unit Director Support
Administrative Support
• Unit operation support for items such as meeting agendas
and minutes, ordering, tracking and audits, etc.
– May be provided by an administrative assistant, business assistant,
or higher level HUC
– According to Labor Management Institute, 2007 Nurse Manager
Span of Control Report, approximately 50% of nurse managers have
either full or part time administrative assistant support
– Advisory Board does not separate unit clerk and administrative
assistant
Unit Director Support
Administrative Support
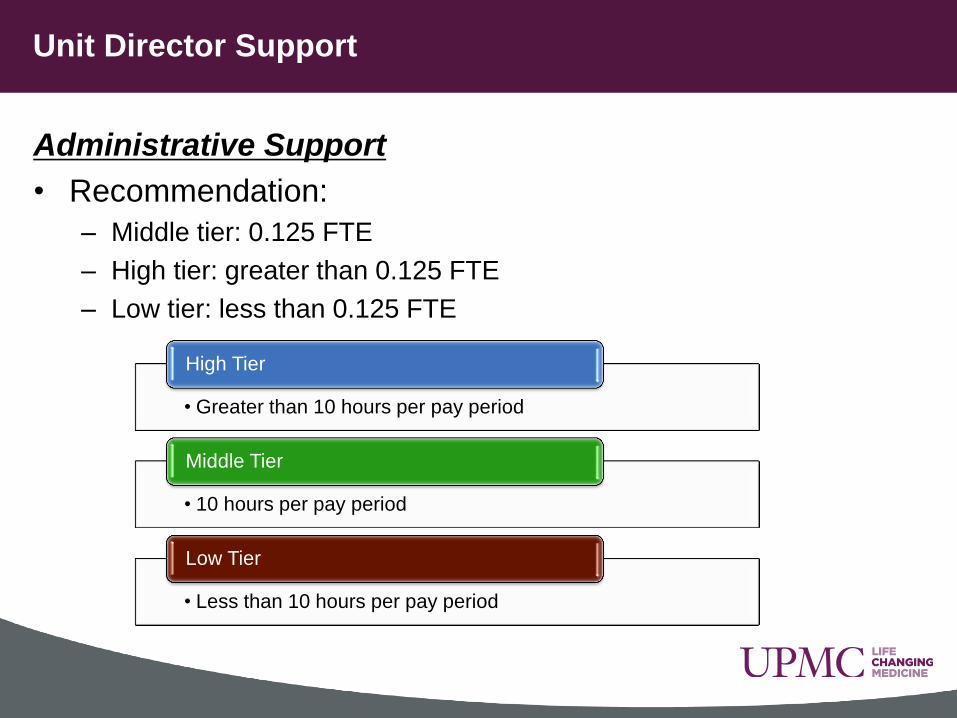
• Recommendation:
– Middle tier: 0.125 FTE
– High tier: greater than 0.125 FTE
– Low tier: less than 0.125 FTE
• Greater than 10 hours per pay period
High Tier
• 10 hours per pay period
Middle Tier
• Less than 10 hours per pay period
Low Tier

• 36 bed Medicine Unit (Middle Tier) Formula: 63 Headcount x .12 hours (Advisory Board) = .75 operational support
per 10 staff
Indirect Operational Support
Clinician = .2
Clinician = .2
Clinician = .2
1 Life Stages RN = .1 (8hours/pay)
.7 FTE
Administrative Support
10 hours per week of a shared Administrative Assistant
Business Unit Example
35
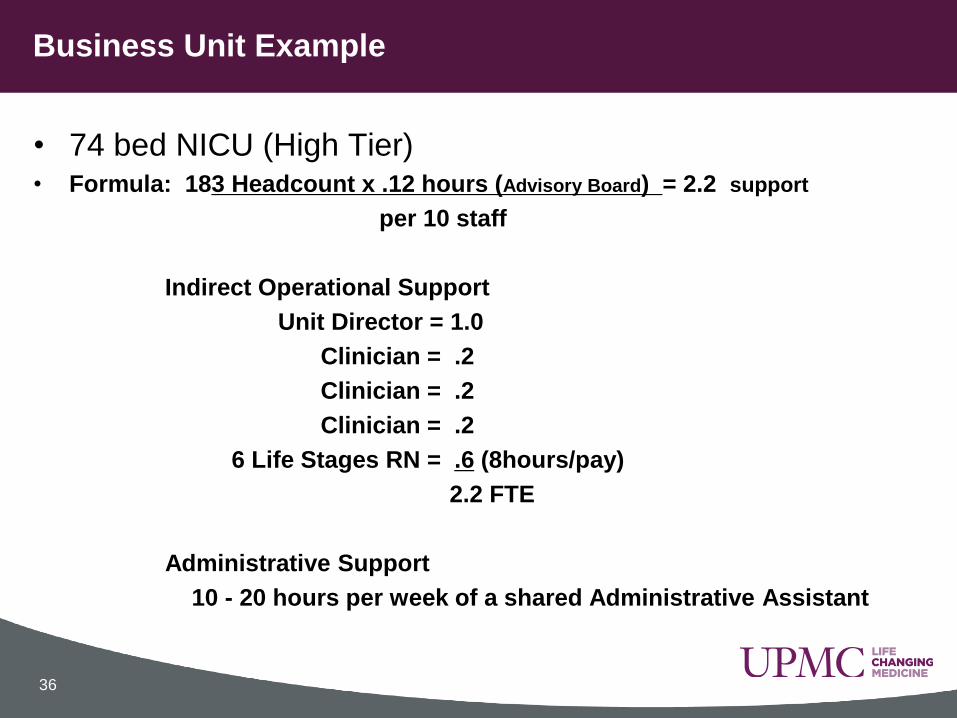
• 74 bed NICU (High Tier) • Formula: 183 Headcount x .12 hours (Advisory Board) = 2.2 support
per 10 staff
Indirect Operational Support
Unit Director = 1.0
Clinician = .2
Clinician = .2
Clinician = .2
6 Life Stages RN = .6 (8hours/pay)
2.2 FTE
Administrative Support
10 - 20 hours per week of a shared Administrative Assistant
Business Unit Example
36

• Mapped each UD to a tier
• Shared the concepts with all system CNO’s
• UDs Job Grade was adjusted to the Director Level similar to
all other ancillary department heads.
• Modeled the concepts to meet each specific hospitals needs
and resources.
• Adjusted the budget to incorporate the indirect time while
remaining budget neutral
Note: This was not an exactly identical model for each unit or
hospital. Goal was to provide the support needed.
System wide Roll Out
37

Outcomes
Vacancies Turnover Hires
Education Operational Support
Performance

First…a quick Unit Director Overview (does not include WPIC)
201 UD’s throughout UPMC
Manage Across 15 BU’s
Average Age is 48.5
• Oldest BU Avg = 53.12
• Youngest BU Avg = 42.56
Demographics
• 90% Female/10% Male
UPMC
UD Snapshot

Termination/Turnover (left UPMC) – as of 11/2012
8.21%
3.48%
0.00%
1.00%
2.00%
3.00%
4.00%
5.00%
6.00%
7.00%
8.00%
9.00%
10.00%
CY 2011 CY 2012
Unit Director: Termination Rate
Termination Rate
Linear (TerminationRate)

Termination/Turnover (left UPMC) – as of 11/2012
8.21%
3.48%
0.00%
1.00%
2.00%
3.00%
4.00%
5.00%
6.00%
7.00%
8.00%
9.00%
10.00%
CY 2011 CY 2012
Unit Director: Termination Rate
Termination Rate
Linear (TerminationRate)

Unit Director – Internal Transfers out of Role
65%
44%
87%
35%
56%
13%
0%
20%
40%
60%
80%
100%
2010 2011 2012
UD Transfers
% of UD's changing roles
% of UD's promoted

Unit Director – Internal Transfers out of Role
65%
44%
87%
35%
56%
13%
0%
20%
40%
60%
80%
100%
2010 2011 2012
UD Transfers
% of UD'schanging roles
% of UD'spromoted
8.21%
3.48%
0.00%
1.00%
2.00%
3.00%
4.00%
5.00%
6.00%
7.00%
8.00%
9.00%
10.00%
CY2011
CY2012
Unit Director: Termination Rate
TerminationRate
Linear(TerminationRate)
As our Terminations
across the system
decrease, the internal
promotions increase….

Vacancy Rate – as of 11/2012
6.74%
1.91%
0.00%
1.00%
2.00%
3.00%
4.00%
5.00%
6.00%
7.00%
8.00%
9.00%
10.00%
CY 2011 CY 2012
Unit Director: Vacancy Rate

Vacancy Rate – as of 11/2012
6.74%
1.91%
0.00%
1.00%
2.00%
3.00%
4.00%
5.00%
6.00%
7.00%
8.00%
9.00%
10.00%
CY 2011 CY 2012
Unit Director: Vacancy Rate
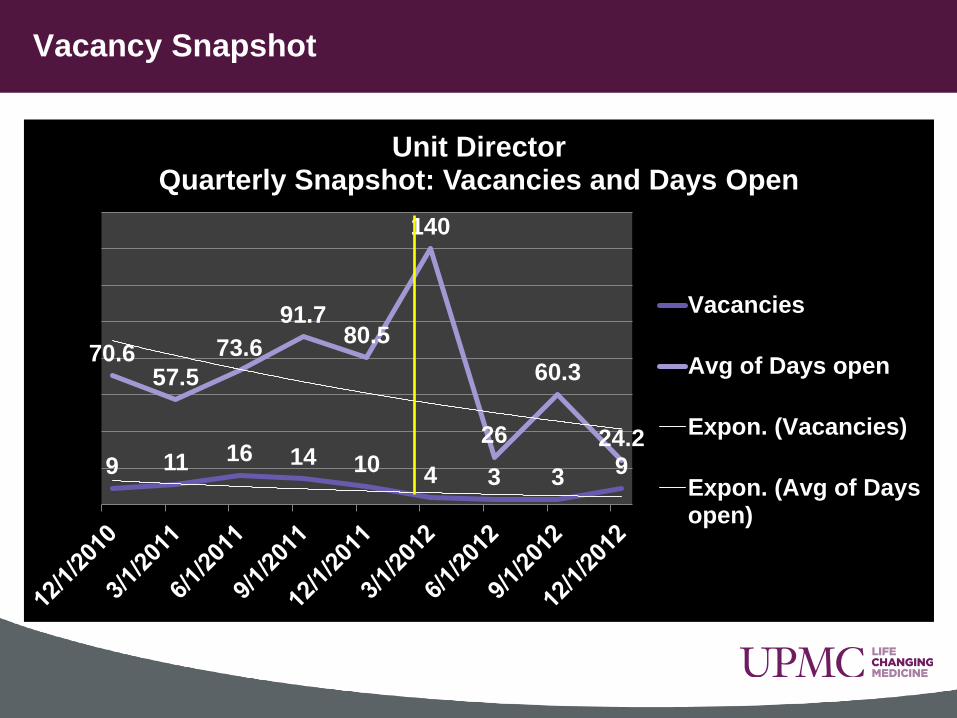
Vacancy Snapshot
9 11 16 14 10 4 3 3 9
70.6 57.5
73.6
91.7 80.5
140
26
60.3
24.2
Unit Director Quarterly Snapshot: Vacancies and Days Open
Vacancies
Avg of Days open
Expon. (Vacancies)
Expon. (Avg of Daysopen)

Vacancy Snapshot
9 11 16 14 10 4 3 3 9
70.6 57.5
73.6
91.7 80.5
140
26
60.3
24.2
Unit Director Quarterly Snapshot: Vacancies and Days Open
Vacancies
Avg of Days open
Expon. (Vacancies)
Expon. (Avg of Daysopen)

Unit Director: Hires/Promotions
30% 26%
8%
70% 74%
92%
0%
20%
40%
60%
80%
100%
201030 hires
201139 hires
201226 hires
UD Hires: External vs Internal
UD internal transfers
UD External hires

Unit Director: Hires/Promotions
30% 26%
8%
70% 74%
92%
0%
20%
40%
60%
80%
100%
201030 hires
201139 hires
201226 hires
UD Hires: External vs Internal
UD internal transfers
UD External hires
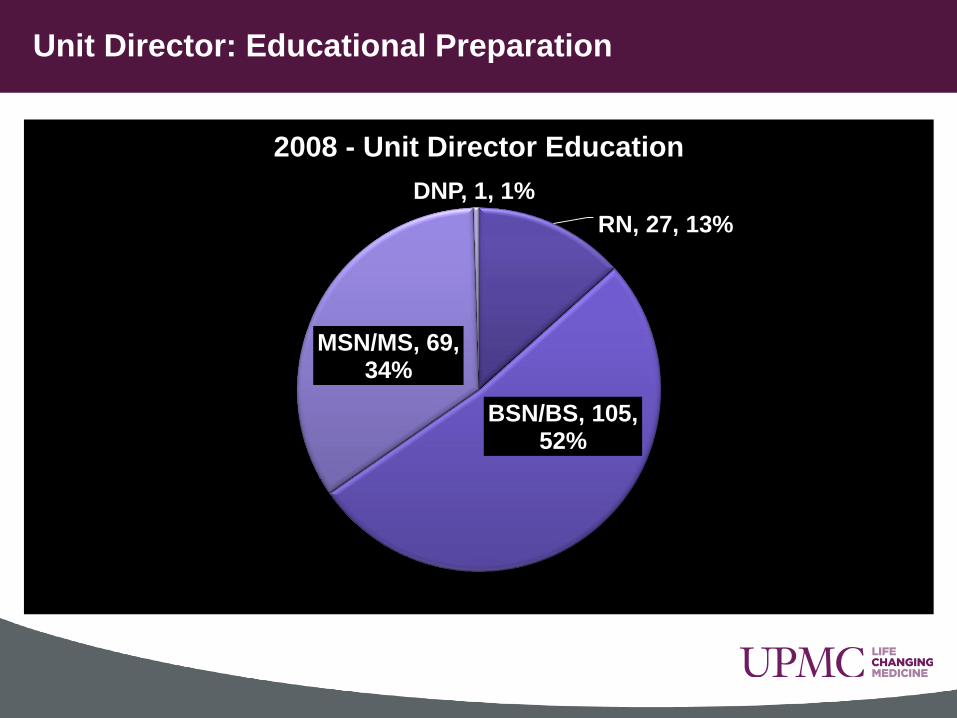
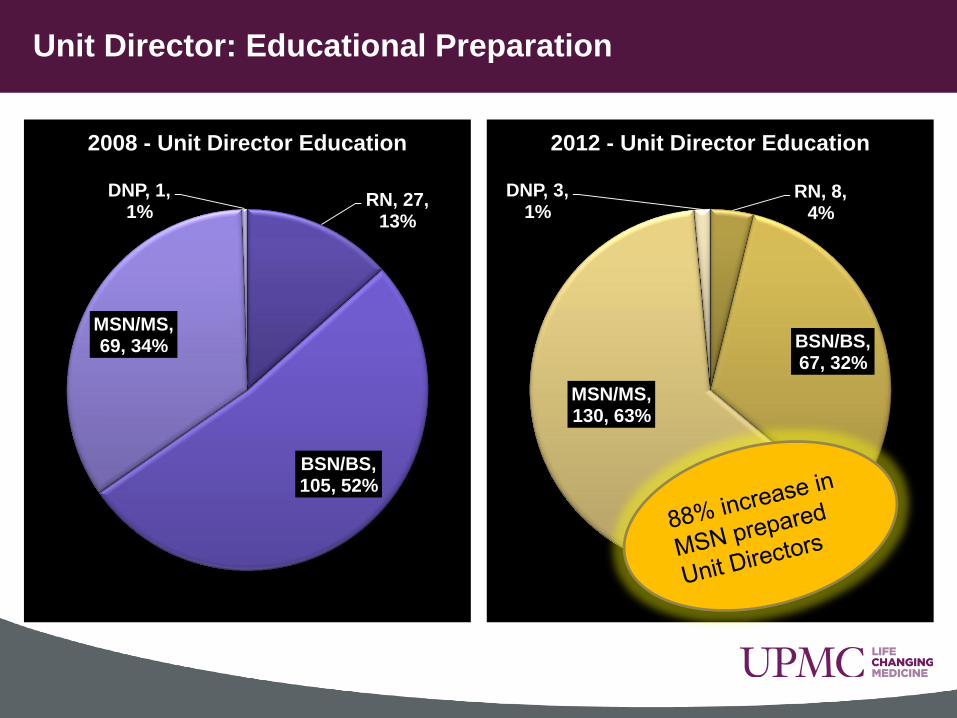
Unit Director: Educational Preparation
RN, 27, 13%
BSN/BS, 105, 52%
MSN/MS, 69, 34%
DNP, 1, 1%
2008 - Unit Director Education

Unit Director: Educational Preparation
RN, 27, 13%
BSN/BS, 105, 52%
MSN/MS, 69, 34%
DNP, 1, 1%
2008 - Unit Director Education
RN, 8, 4%
BSN/BS, 67, 32%
MSN/MS, 130, 63%
DNP, 3, 1%
2012 - Unit Director Education
Unit Director: Educational Preparation
RN, 27, 13%
BSN/BS, 105, 52%
MSN/MS, 69, 34%
DNP, 1, 1%
2008 - Unit Director Education
RN, 8, 4%
BSN/BS, 67, 32%
MSN/MS, 130, 63%
DNP, 3, 1%
2012 - Unit Director Education
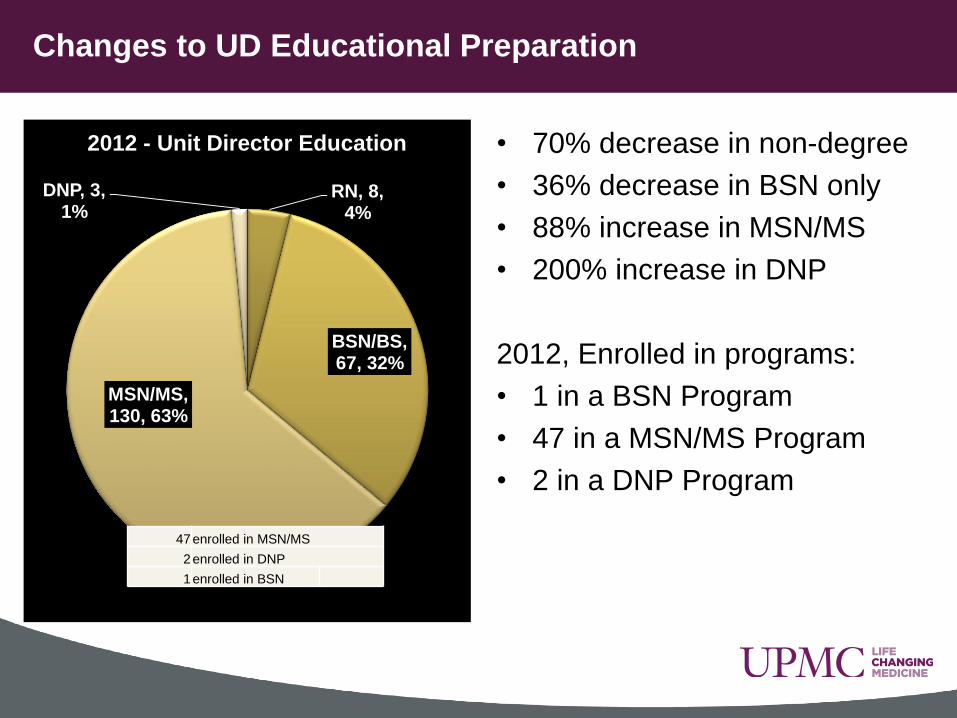
• 70% decrease in non-degree
• 36% decrease in BSN only
• 88% increase in MSN/MS
• 200% increase in DNP
2012, Enrolled in programs:
• 1 in a BSN Program
• 47 in a MSN/MS Program
• 2 in a DNP Program
Changes to UD Educational Preparation
RN, 8, 4%
BSN/BS, 67, 32%
MSN/MS, 130, 63%
DNP, 3, 1%
2012 - Unit Director Education
47 enrolled in MSN/MS
2 enrolled in DNP
1 enrolled in BSN

Clinician and PNCC Support
171
200 201
261
339
381
87 93 93
0
100
200
300
400
500
Year End 2010 Year End 2011 Year End 2012
Number of Clinician/PNCC
UD
Clinician
PNCC
Linear (UD)
Linear (Clinician)

Clinician and PNCC Support
171
200 201
261
339
381
87 93 93
0
100
200
300
400
500
Year End 2010 Year End 2011 Year End 2012
Axi
s Ti
tle
Number of Clinician/PNCC
UD
Clinician
PNCC
Linear (UD)
Linear (Clinician)

• UD’s – flat
• PNCC – flat
• Number of Clinicians
increased:
– 2010 to 2011 – 30%
– 2011 to 2012 – 12%
– 2010 to 2012 – 46%
• Total UPMC Employees
– 2010 to 2012 – 19%
Clinician and PNCC Support
171
200 201
261
339
381
87 93 93
0
100
200
300
400
500
Year End 2010 Year End 2011 Year End 2012
Number of Clinician/PNCC
UD
Clinician
PNCC
Linear (UD)
Linear (Clinician)
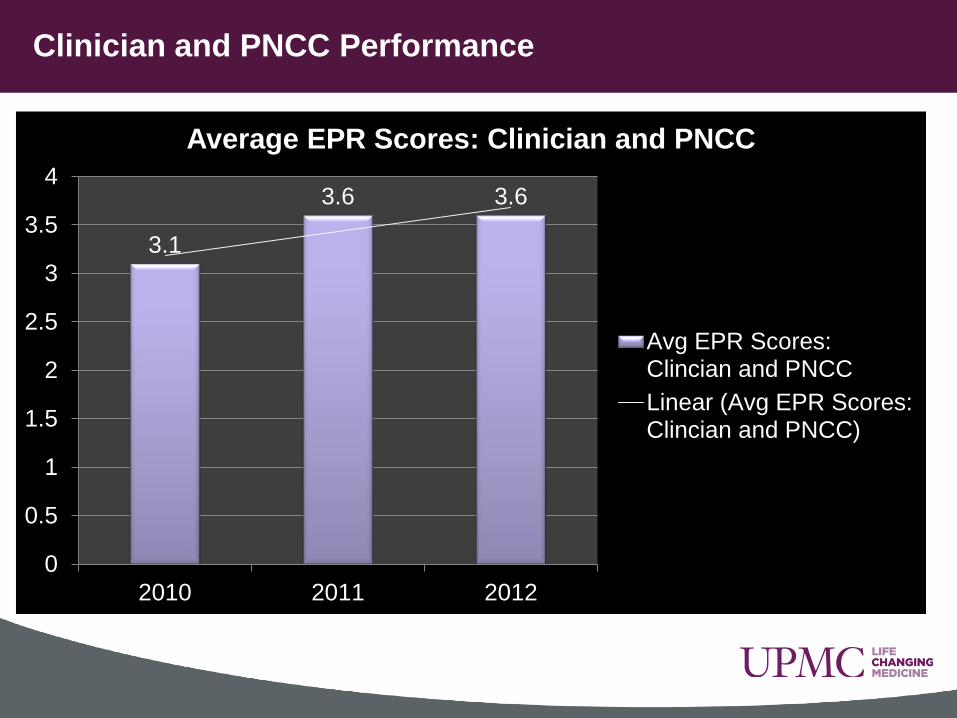
Clinician and PNCC Performance
3.1
3.6 3.6
0
0.5
1
1.5
2
2.5
3
3.5
4
2010 2011 2012
Average EPR Scores: Clinician and PNCC
Avg EPR Scores:Clincian and PNCC
Linear (Avg EPR Scores:Clincian and PNCC)

Clinician and PNCC Performance
3.1
3.6 3.6
0
0.5
1
1.5
2
2.5
3
3.5
4
2010 2011 2012
Average EPR Scores: Clinician and PNCC
Avg EPR Scores:Clincian and PNCC
Linear (Avg EPR Scores:Clincian and PNCC)

3.1
3.6 3.6
2010 2011 2012
Average EPR Scores: Clinician and PNCC
Avg EPRScores:Clincianand PNCC
Linear(Avg EPRScores:ClincianandPNCC)
Identified Roles as critical to Unit
Director Success
• Refocused Role Purpose
• Unit Director Course
• Talent Management Review
(TMR)
• 16% increase in performance
translates to better support for
the Unit Director
Clinician and PNCC Performance

Questions

• Burke, R & Friedman, L. H, (2011) Essentials of Management and Leadership in Public Health,
Sudbury, MO: Jones & Bartlett Publishers
• Hindle,T. (2009), Span of Control, The Economist, London: The Economist Newspaper Limited
• Morash, Brintnell & Lemire (2005) A Span of Control Tool for Clinical Managers, Nursing Leadership,
(18) 3 p. 83- 93.
• Advisory Board Company, (2008) Benchmarking Nursing Organizational Structure.
References
61