nuremberg facts & figures 2014 - stadtportal nürnberg · football matches 1.fcn; 38 730 266;...
TRANSCRIPT

Nuremberg Facts & Figures2014
Office of Urban Research and Statistics for Nuremberg and Fürth
Year Population Year Population
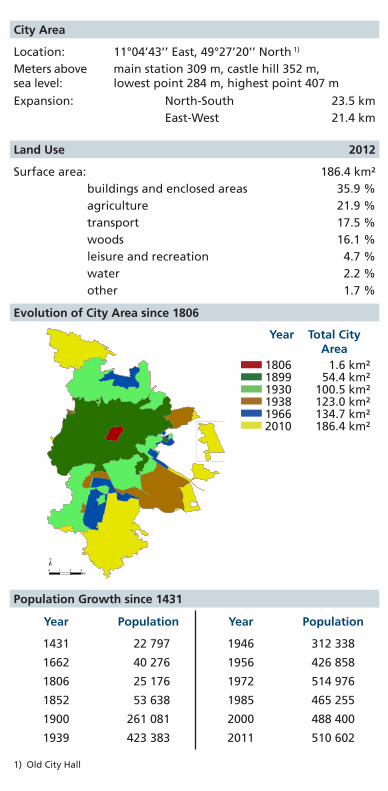
Location: 11°04’43’’ East, 49°27’20’’ North 1)
Meters above sea level:
main station 309 m, castle hill 352 m, lowest point 284 m, highest point 407 m
Expansion: North-South 23.5 kmEast-West 21.4 km
Surface area: 186.4 km²buildings and enclosed areas 35.9 %agriculture 21.9 %transport 17.5 %woods 16.1 %leisure and recreation 4.7 %water 2.2 %other 1.7 %
City Area
Land Use 2012
Evolution of City Area since 1806
1) Old City Hall
1431 22 797 1946 312 338
1662 40 276 1956 426 858
1806 25 176 1972 514 976
1852 53 638 1985 465 255
1900 261 081 2000 488 400
1939 423 383 2011 510 602
Population Growth since 1431
0 1 2 3
km
Year Total City Area
1806 1.6 km²1899 54.4 km²1930 100.5 km²1938 123.0 km²1966 134.7 km²2010 186.4 km²
Twin Cities
Political Representation
Winners of the Nuremberg International Human Rights Award
City Country since
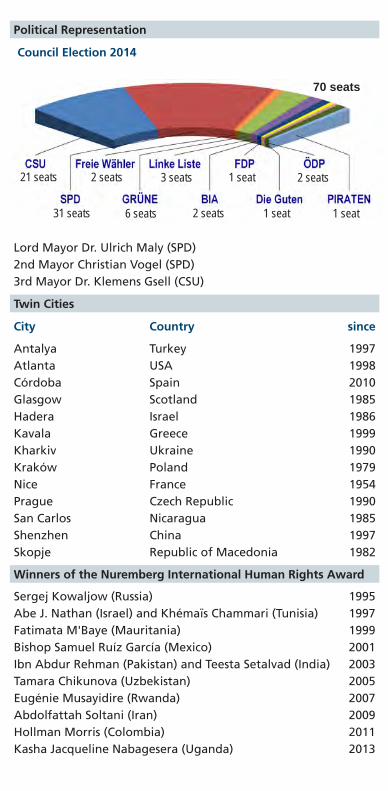
Council Election 2014
Lord Mayor Dr. Ulrich Maly (SPD)2nd Mayor Christian Vogel (SPD)3rd Mayor Dr. Klemens Gsell (CSU)
Antalya Turkey 1997Atlanta USA 1998Córdoba Spain 2010Glasgow Scotland 1985Hadera Israel 1986Kavala Greece 1999Kharkiv Ukraine 1990Kraków Poland 1979Nice France 1954Prague Czech Republic 1990San Carlos Nicaragua 1985Shenzhen China 1997Skopje Republic of Macedonia 1982
Sergej Kowaljow (Russia) 1995Abe J. Nathan (Israel) and Khémaïs Chammari (Tunisia) 1997Fatimata M'Baye (Mauritania) 1999Bishop Samuel Ruíz García (Mexico) 2001Ibn Abdur Rehman (Pakistan) and Teesta Setalvad (India) 2003Tamara Chikunova (Uzbekistan) 2005Eugénie Musayidire (Rwanda) 2007Abdolfattah Soltani (Iran) 2009Hollman Morris (Colombia) 2011Kasha Jacqueline Nabagesera (Uganda) 2013
Age
21 seats 2 seats 3 seats
2 seats
2 seats1 seat
1 seat 1 seat6 seats31 seats
70 seats

0
10
20
30
40
50
60
70
80
90
4 500 3 000 1 500 0 1 500 3 000 4 5000
10
20
30
40
50
60
70
80
90
femalemale
Age
2013
2030
Proportion of population total 100 100by gender male 48.2 48.7
female 51.8 51.3by marital status (18+) unmarried 31.0 33.1
married 50.2 48.4widowed 8.7 8.2divorced 10.1 10.4
by religious affiliation Protestant 32.4 30.0Catholic 28.1 26.6
other, none 39.5 43.4by age under 6 5.0 5.1
6-14 7.3 7.115-24 11.3 11.425-34 14.9 15.635-64 40.9 40.565-74 11.6 10.4
75 and older 9.1 9.9
Population Structure (%) 2) 2009 2013
Population by Age 2013 and Population Projection 2030
Age
2) registered population, as of December 31
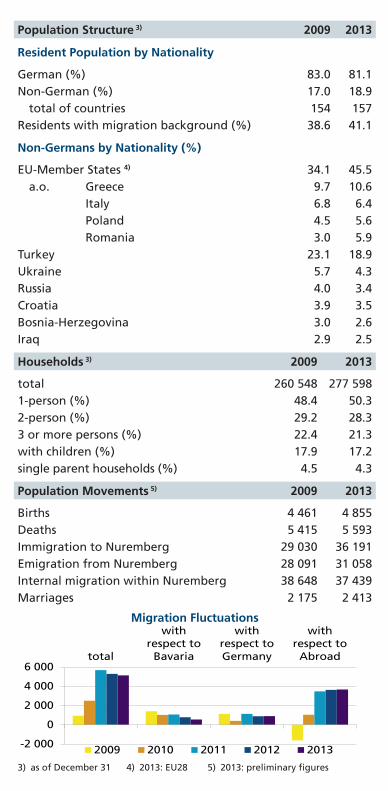
Migration Fluctuations
German (%) 83.0 81.1Non-German (%) 17.0 18.9
total of countries 154 157Residents with migration background (%) 38.6 41.1
EU-Member States 4) 34.1 45.5a.o. Greece 9.7 10.6
Italy 6.8 6.4Poland 4.5 5.6Romania 3.0 5.9
Turkey 23.1 18.9Ukraine 5.7 4.3Russia 4.0 3.4Croatia 3.9 3.5Bosnia-Herzegovina 3.0 2.6Iraq 2.9 2.5
total 260 548 277 5981-person (%) 48.4 50.32-person (%) 29.2 28.33 or more persons (%) 22.4 21.3with children (%) 17.9 17.2single parent households (%) 4.5 4.3
Births 4 461 4 855Deaths 5 415 5 593Immigration to Nuremberg 29 030 36 191Emigration from Nuremberg 28 091 31 058Internal migration within Nuremberg 38 648 37 439Marriages 2 175 2 413
3) as of December 31
Population Structure 3) 2009 2013
Households 3) 2009 2013
Population Movements 5) 2009 2013
Resident Population by Nationality
Non-Germans by Nationality (%)
4) 2013: EU28
-2 000
0
2 000
4 000
6 000 total
with respect to
Bavaria
with respect to Germany
with respect to Abroad
2009 2010 2011 2012 2013
5) 2013: preliminary figures

Grundschule (grades 1 to 4) 57 15 212Mittel- und Hauptschule (grades 5 to 9 + voluntary 10th grade) 29 7 813
Förderschule (school for pupils with special needs; grades 1 to 10) 15 2 820
Realschule (grades 5 to 10) 12 6 169Gymnasium (grades 5 to 12) 15 12 755Other Schools (grades 5 to 12) 2 1 040Abendrealschule, Abendgymnasium and Kol-leg (secondary evening schools, 1 to 4 years) 3 1 188
Berufsschule (part-time vocational school; 1 to 3.5 years; grades 10 to 12) 12 18 320
Berufsfachschule(full-time vocational school; 1 to 3 years; grades 10 to 12) 31 2 193
Other vocational schools 48 8 843
Colleges of Applied Sciences 2 12 075Academies of Art and of Music 2 705University 1 8 012
Double periods (2 x 45 min. Courses) 52 481Participants 163 078
Loaned Media 2 007 365Media inventory 916 991
Education
General education 2012/13Number of
schoolsNumber of
students
Nuremberg Centre for Adult Education 2012
Nuremberg Public Library 2013
Vocational education 2012/13Number of
schoolsNumber of
students
Higher education 2012/13Number of institutions
Number of students
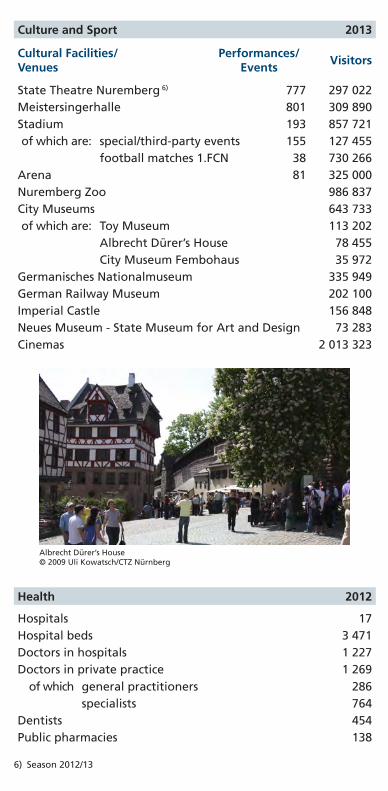
State Theatre Nuremberg 6) 777 297 022Meistersingerhalle 801 309 890Stadium 193 857 721of which are: special/third-party events 155 127 455
football matches 1.FCN 38 730 266Arena 81 325 000Nuremberg Zoo 986 837City Museums 643 733of which are: Toy Museum 113 202
Albrecht Dürer’s House 78 455City Museum Fembohaus 35 972
Germanisches Nationalmuseum 335 949German Railway Museum 202 100Imperial Castle 156 848Neues Museum - State Museum for Art and Design 73 283Cinemas 2 013 323
Hospitals 17Hospital beds 3 471Doctors in hospitals 1 227Doctors in private practice 1 269
of which general practitioners 286specialists 764
Dentists 454Public pharmacies 138
Culture and Sport 2013
Cultural Facilities/Venues
Performances/ Events
Visitors
Health 2012
6) Season 2012/13
Albrecht Dürer’s House© 2009 Uli Kowatsch/CTZ Nürnberg

4 %
6 %
8 %
10 %
1 2 3 4 1 2 3 4 1 2 3 4 1 2 3 4 1 2 3 4
2009 2010 2011 2012 2013
Unemployment Rate in Nuremberg 7)
7) in May 2009: Change of labour market programmes
end of quarter
for children under the age of 3 years 22for children aged 2 to 7 years (excluding school children) 177for children aged 5 to 13 years (only school children) 92with children of all age groups 134Children in Day Care by Age Groupsunder 3 Years 2 4953 to 5 Years 11 3016 to 10 Years 7 47811 to 13 Years 298
Nursing Facilities Number 56 Capacity 6 426Residents of Nursing Facilities 5 763Staff 3 978
of which work part-time 2 194
Recipients of Unemployment Benefit II 33 051Recipients of „Social Money“ (children and handicapped) 13 352
Regular subsistence payments 2 224Basic security payments in old age and in cases of reduced earning capacity 8 275
Assistance in special situations (benefits according to chapters 5 to 9 of SGB XII) 8 752
Unemployment rate (%) 6.9 3.8 7.8Unemployed persons 2 950 250 264 523 21 302
of which are: female (%) 45.9 46.7 47.7non-German (%) 17.1 20.9 34.3
Children´s Day Care centres 2013
Care for Elderly People 2012
Social Security
Labour Market Annual Average 2013
Basic Social Security Benefits for Job-seekers (SGB II) June 2013
Recipients of Social Benefits (SGB XII) 2012
Germany Bavaria Nuremberg

Employment by economic sector June 2013
0.4%
22.0%
23.3%
54.3%
Agriculture and forestry, fisheries
Production
Commerce, hotel and catering, transport
Other services
Agriculture and forestry, fisheries
Production
Commerce, hotel and catering, transport
Other services
Employees 264 324 278 637of which are: female 120 344 128 285
apprentices 15 014 13 548
Gross value added (million €) 18 513 20 151of which are:
production sector (%) 23.7 24.1service sector (%) 76.1 75.8
Gross domestic product per employee (€) 57 463 62 460
Visitors 908 896 958 696of which are:
Consumenta 141 186 154 746Leisure Fair Nuremberg 106 604 92 083International Toy Fair 75 409 72 595World Organic Trade Fair 46 771 41 794
Lodging 148 152Beds 15 126 16 492Guests 1 182 565 1 508 135
of which are from abroad 321 325 452 371Overnight stays 2 128 291 2 666 932
of which are from abroad 608 738 847 262
Employment 8) June 2009 June 2013
Economy 2007 2011
Exhibition Centre 2009 2013
Tourism 2009 2013
8) only employees liable for social security contributions; job location in Nuremberg
Guests from abroad 2013
9.7%
8.3%
8.1%
7.8% 6.6%
59.6%
USA
United Kingdom
Italy
Austria
Netherlands
Other
Austria
USA
United Kingdom
Italy
Netherlands
Other

1.2
7.8
20.3
47.8
22.9
0.9
10.5
23.5
47.1
18.0
Coal, Wood
Electricity
Oil
Gas
District heating
2003
2011
Proportion in %
5.07 5.20 4.61 4.71 5.06 5.50 5.85 5.83 6.17 6.42
93/94 95/96 97/98 99/00 01/02 03/04 05/06 07/08 09/10 11/12 Year
Residential buildings 451 399of which are one-family and two-family houses 385 328
Residential units 1 035 1 064
Residential buildings 68 554 69 794of which are: one-family and
two-family houses45 333 45 980
apartment buildings 23 221 23 701Apartments in residential buildings 259 226 265 499of which are: in one-family and
two-family houses53 010 52 150
flats in apartment buildings 206 216 208 414Floor space per person (m²) 38.3 39.9Residents per apartment 1.9 1.9
Average net rent for privately financed apartments exclusive of heating (€ per m²)
Modes of heating in Residential buildings
Construction and Housing 2008 2012
Newly completed Buildings
Housing Stock
Rent before Utilities
Heating

Electricity (1 000 kWh) 3 161 378 2 911 480Gas (1 000 kWh) 5 980 240 5 917 539District heating (1 000 kWh) 1 260 155 1 304 406Water (1 000 m³) 28 976 29 024
Sulphur dioxide SO2 (mg/m³) 0.003 0.005Carbon monoxide CO (mg/m³) 0.4 0.4Nitrogen dioxide NO2 (mg/m³) 0.038 0.035Particle emissions PM10 (µg/m³) 26 28
Average air temperature
(°C) 9.3deviation from norm 9) 0.5
Precipitation (mm) 647.2percentage of norm 9) 100.5
Sunshine (hours) 1 526.4percentage of norm 9) 89.9
Energy and Water Supply 2009 2013
Immissions 2009 2013
Climate 2013
Transport
Measured at Nuremberg Main Station Annual Averages
Airport 2009 2013
Starts and landings 71 217 62 644Passengers 3 969 857 3 314 524Air freight (t) 10 609 9 909
Roads within City Limits 2009 2013
Total length (km) 1 146 1 148of which are municipal roads (km) 1 002 1 004
Motor Vehicles 2008 2012Registered motor vehicles 256 702 269 274
of which are saloons and station wagons 217 146 228 167
Harbour 2008 2012Ship arrivals 605 538Freight turnover (t) 14 098 339 15 414 177
Public Transport 2009 2013
Passengers (1 000) 219 561 211 983Length of route network (km) 551.2 614.1Stops 596 617
9) Norm = long-term mean value Nuremberg Airport 1961-1990

Impressum:Published by:City of Nuremberg Office of Urban Research and Statistics for Nuremberg and FürthUnschlittplatz 7a90403 NurembergPhone 09 11 / 2 31-28 43Fax 09 11 / 2 31-28 44E-mail [email protected] www.statistik.nuernberg.deCover Photo: Ralf Schedlbauer/City of Nuremberg Printed by: Nova.Druck Goppert GmbH, Andernacher Straße 20, 90411 NürnbergPublished in July 2014This publication draws on statistics from City of Nuremberg local cen-suses, the Bavarian State Office of Statistics and Data Processing, the German Federal Labour Agency and various other sources. © Copyright for the pictures: City of Nuremberg, Press and Informa-tion Office; Reproduction of the folder in total or in parts is permit-ted with a quotation of the sources.
CityArea(km2)
Popula-tion 10)
Non-Ger-mans(%) 10)
Unem-ployed(%) 11)
Motorvehicles
(per 1 000 inhabi-
tants) 10)
Nuremberg 186.37 510 602 17.0 7.9 520Berlin 891.75 3 501 872 14.1 13.3 379Hamburg 755.33 1 798 836 13.8 7.8 468Munich 310.70 1 378 176 24.2 5.1 548Cologne 405.17 1 017 155 16.3 9.6 496Frankfurt a.M. 248.31 691 518 21.4 7.5 508Stuttgart 207.35 613 392 22.6 5.5 514Düsseldorf 217.41 592 393 18.3 9.0 545Dortmund 280.71 580 956 16.0 12.8 510Essen 210.34 573 468 12.3 12.0 533Bremen 325.55 548 319 13.1 10.6 472Leipzig 297.37 531 809 6.0 13.0 426Dresden 328.31 529 781 4.8 10.0 453Augsburg 146.84 266 647 17.4 6.9 518Regensburg 80.70 136 577 11.2 4.8 669Würzburg 87.63 133 808 12.8 4.9 528Ingolstadt 133.37 126 732 15.5 3.7 760Fürth 63.35 116 317 13.1 6.6 554Erlangen 76.95 106 326 15.1 3.7 551
Nuremberg Compared 2011
10) Population based on data from the 1987 Census 11) Annual Average