nureg/cr-6889, 'seismic analysis of simplified piping ...the piping design rules of the...
TRANSCRIPT

NUREG/CR-6889BNL-NUREG-74978-2005
Seismic Analysis of Simplified PipingSystems for the NUPEC UltimateStrength Piping Test Program
Brookhaven National Laboratory
U.S. Nuclear Regulatory CommissionOffice of Nuclear Regulatory ResearchWashington, DC 20555-0001

AVAILABILITY OF REFERENCE MATERIALSIN NRC PUBLICATIONS
NRC Reference Material
As of November 1I999, you may electronically accessNUREG-series publications and other NRC records atNRC's Public Electronic Reading Room athtt:ll/www.nrc.aov/readina-rm.html. Publicly releasedrecords include, to name a few, NUREG-seriespublications; Federal Register notices; applicant,licensee, and vendor documents and correspondence;NRC correspondence and internal memoranda;bulletins and Information notices; inspection andinvestigative reports; licensee event reports; andCommission papers and their attachments.
NRC publications In the NUREG series, NRCregulations, and Title 10, Energy, in the Code ofFederal Regulations may also be purchased from oneof these two sources.1. The Superintendent of Documents
U.S. Government Printing OfficeMail Stop SSOPWashington, DC 20402-0001Internet: bookstore.gpo.govTelephone: 202-512-1800Fax: 202-512-2250
2. The National Technical Information ServiceSpringfield, VA 22161-0002www.ntis.gov1-800-553-6847 or, locally, 703-605-6000
A single copy of each NRC draft report for comment isavailable free, to the extent of supply, upon writtenrequest as follows:Address: Office of the Chief Information Officer,
Reproduction and DistributionServices Section
U.S. Nuclear Regulatory CommissionWashington, DC 20555-0001
E-mail: [email protected]: 301-415-2289
Some publications In the NUREG series that areposted at NRC's Web site addresshttp://www.nrc.pov/readinp-rm/doc-collections/nuregsare updated periodically and may differ from the lastprinted version. Although references to material foundon a Web site bear the date the material was accessed,the material available on the date cited maysubsequently be removed from the site.
Non-NRC Reference Material
Documents available from public and special technicallibraries include all open literature Items, such asbooks, journal articles, and transactions, FederalRegister notices, Federal and State legislation, andcongressional reports. Such documents as theses,dissertations, foreign reports and translations, andnon-NRC conference proceedings may be purchasedfrom their sponsoring organization.
Copies of industry codes and standards used in asubstantive manner in the NRC regulatory process aremaintained at-
The NRC Technical LibraryTwo White Flint North11545 Rockville PikeRockville, MD 20852-2738
These standards are available in the library forreference use by the public. Codes and standards areusually copyrighted and may be purchased from theoriginating organization or, if they are AmericanNational Standards, from-
American National Standards Institute11 West 42'd StreetNew York, NY 10036-8002www.ansi.org212-642-4900
Legally binding regulatory requirements are statedonly in laws; NRC regulations; licenses, includingtechnical specifications; or orders, not InNUREG-series publications. The views expressedIn contractor-prepared publications in this series arenot necessarily those of the NRC.
The NUREG series comprises (1) technical andadministrative reports and books prepared by thestaff (NUREG-XXXX) or agency contractors(NUREG/CR-XXXX), (2) proceedings ofconferences (NUREG/CP-XXXX), (3) reportsresulting from international agreements(NUREG/IA-XXXX), (4) brochures(NUREGIBR-XXXX), and (5) compilations of legaldecisions and orders of the Commission and Atomicand Safety Licensing Boards and of Directors'decisions under Section 2.206 of NRC's regulations(NUREG-0750).
DISCLAIMER: This report was prepared as an account of work sponsored by an agency of the U.S. Government.Neither the U.S. Government nor any agency thereof, nor any employee, makes any warranty, expressed orimplied, or assumes any legal liability or responsibility for any third party's use, or the results of such use, of anyInformation, apparatus, product, or process disclosed in this publication, or represents that Its use by such thirdparty would not infringe privately owned rights.

NUREG/CR-6889BNL-NURiEG-74978-2005
Seismic Analysis of Simplified PipingSystems for the NUPEC UltimateStrength Piping Test Program
Manuscript Completed: September 2005Date Published: December 2005
Prepared byG. DeGrassi and C. Hofmayer
Brookhaven National LaboratoryUpton, NY 11973-5000
S. Ali, NRC Project Manager
Prepared forDivision of Engineering TechnologyOffice of Nuclear Regulatory ResearchU.S. Nuclear Regulatory CommissionWashington, DC 20555-0001NRC Job Code N6076

ABSTRACT
The Nuclear Power Engineering Corporation (NUPEC) of Japan has conducted a multi-year test programfor the Ministry of Economy, Trade and Industry (METI) of Japan to investigate the behavior of typical
Nuclear Power Plant (NPP) piping systems under large seismic loads. The objectives of this program are
to develop a better understanding of the elasto-plastic response and ultimate strength of nuclear piping
systems, to ascertain the seismic safety margins in current piping design codes, and to assess new code
allowable stress rules. The test program consisted of a series of static and dynamic material tests, pipingcomponent tests, simplified piping system tests, and large scale piping tests. As part of collaborative
efforts between the United States and Japan on seismic issues, the U.S. Nuclear Regulatory Commission(NRC) and the Brookhaven National Laboratory (BNL) participated in this program by performing both
pre-test and post-test analysis for selected tests, and by evaluation of program results. This reportpresents a summary of the NUPEC tests, describes the BNL post-test analyses of selected simplifiedpiping system tests, and discusses the insights gained from this program.
iii

FOREWORD
This report documents the collaborative efforts between the U.S. Nuclear Regulatory Commission (NRC)and the Nuclear Power Engineering Corporation of Japan (NUPEC) under the NRC-NUPEC agreementin the area of seismic engineering research. Under contract to the NRC, Brookhaven National Laboratory(BNL) participated in this program and performed this study. This piping test program is one of a seriesof large-scale seismic testing programs of nuclear power plant (NPP) structures, systems and componentsconducted by NUPEC. The research conducted and information exchanged under this collaborative agreementhave allowed the NRC to obtain valuable seismic data from large-scale test programs that are not availableanywhere else in the world. In addition, this program has enhanced interactions with various Japaneseorganizations to promote the exchange of information and awareness of ongoing seismic research in Japan.
The NUPEC Ultimate Strength Piping Test Program was a multi-year program to investigate the behaviorof NPP piping systems under large seismic loads. The objectives were to develop a better understandingof the elasto-plastic response and ultimate strength of nuclear piping systems, ascertain the seismic safety marginsin current piping design codes, and assess new code-allowable stress rules. The program included staticand dynamic loading tests of piping material specimens and piping components, and seismic shaking table testsof piping systems. The seismic shaking tests involved small "simplified" piping system test specimen configurations,as well as large-scale representative piping system configurations. In both series of seismic tests, the specimenswere shaken to levels well above typical design earthquake excitation levels. A summary description of these testsand their results is included in this report.
The NRC's primary contribution to this collaborative effort was the analysis of selected simplified piping systemtest runs. Specifically, the analyses included (1) linear analyses and stress evaluations in accordance withthe piping design rules of the American Society of Mechanical Engineers (ASME) Boiler and Pressure Vessel Code,and (2) nonlinear analyses to predict the response of simplified piping systems under beyond-design-basis levelsof earthquake motion. The results of the linear analyses provided comparative information on the minimumsafety margins in various types of piping components provided by different versions of the ASME Codeincluding the latest NRC-endorsed version (1993) and the most recent version (2004) which is still undergoingNRC review. The nonlinear analyses focused on the capability of current theoretical methods and computer programsfor predicting the response of piping systems under large earthquake loads. Investigations using differentmaterial plasticity models demonstrated the difficulty of accurately predicting the piping response when it issubjected to large earthquake loads, and the importance of validating the analytical model against test data.
From a regulatory standpoint, it is essential to understand the limitations and sensitivities of these nonlinearanalysis methods and the importance of validating these methods against test data. The NUPEC tests haveprovided valuable test data, which can be used to benchmark these analytical models and methods to providea better understanding of their limitations. The NRC is continuing the collaborative efforts on the UltimateStrength Piping Test Program and will analyze the large-scale piping system test runs and compare the resultswith test data. Further insights from these efforts will be provided in a followup report.
Carl . Paperie DirectoOffice of Nuclear Regulatory ResearchU.S. Nuclear Regulatory Commission
V

CONTENTS
Page
Abstract .................
Foreword ............. v
Executive Summary ............ xi
A cknow ledgm entsv....................................................................................................................................... xv
1.0 INTRODUCTION ..
2.0 DESCRIPTION OF NUPEC TEST PROGRAM .. 3
2.1 Introduction .3
2.2 Material Tests .3
2.3 Piping Component Tests .3
2.4 Simplified Piping System Tests .4
2.5 Large-Scale Piping System Tests .6
3.0 BNL LINEAR ANALYSES AND CODE EVALUATIONS . .27
3.1 Introduction .27
3.2 ASME Code Criteria .27
3.3 Linear Analysis and Evaluation of Simplified Piping Systems .29
4.0 BNL COMPONENT TEST NONLINEAR ANALYSES . .39
4.1 Introduction .39
4.2 Development of Piping Elbow Model .39
4.3 Development of Plasticity Models .40
4.4 Determination of Material Parameters .41
4.4.1 Bilinear Kinematic Hardening Model .41
4.4.2 Multilinear Kinematic Hardening Model .42
4.4.3 Chaboche Nonlinear Kinematic Hardening Model .42
4.5 Elbow Static Cycling Test Nonlinear Analysis .43
5.0 BNL SIMPLIFIED PIPING TEST NONLINEAR ANALYSES . .47
5.1 Introduction .47
5.2 Development and Pre-Test Analysis of Two-Dimensional Simplified Piping SystemModel .47
5.3 Additional A-2 Simplified Piping System Test Investigations .48
5.4 Final A-2 Simplified Piping System Test Analyses and Comparisons .50
5.5 Final Two-Dimensional and Three-Dimensional Simplified Piping System TestAnalyses. 51
vii

6.0 CONCLUSIONS AND RECOMMENDATIONS ...................................................... 77
7.0 REFERENCES ...................................................... 79
Figures
2-1 Test Specimens from the NUPEC Material Tests ...................................................... 10
2-2 Monotonic Loading Stress-Strain Curve for STS410 Carbon Steel ............................................. 11
2-3 Uniaxial Cycling Test Hysteresis Curves for STS410 Carbon Steel ............................................. 11
2-4 Cyclic Stress-Strain Curve for STS410 Carbon Steel ...................................................... 12
2-5 Static Elbow Cycling Test Setup ...................................................... 12
2-6 Static Elbow Cycling Test Strain Gage Locations ...................................................... 13
2-7 Elbow Static Cycling Test SE4 Hoop Strain vs. Cycle at Elbow Flank ....................................... 13
2-8 Dynamic Elbow Test Setup ...................................................... 14
2-9 Model A Simplified Piping System Test Setup ...................................................... 15
2-10 Model A Test Instrumentation ...................................................... 16
2-11 Model A Test Strain Gage Locations ...................................................... 16
2-12 Model B Simplified Piping System Test Setup ...................................................... 17
2-13 Model B Test Instrumentation ...................................................... 18
2-14 Model B Test Strain Gage Locations ...................................................... 18
2-15 A-I Test Acceleration Time History Input Motion ...................................................... 19
2-16 A-2 Test Acceleration Time History Input Motion ...................................................... 19
2-17 B-I Test Acceleration Time History Input Motion (Horizontal) ................................................... 20
2-18 B-2 Test Acceleration Time History Input Motion (Vertical) ...................................................... 20
2-19 B-3 Test Acceleration Time History Input Motion (Horizontal and Vertical) .............................. 21
2-20 A-2 Test - Pipe Center Displacement - DI (X) ...................................................... 22
2-21 A-2 Test - Elbow A Opening Displacement - D2(L) ...................................................... 22
2-22 A-2 Test - Hoop Strain at Elbow A Flank - SAD-3H ...................................................... 23
2-23 A-2 Test - Axial Strain a Elbow A Flank - SAD-3A ...................................................... 23
2-24 B-3 Test - Pipe Center Horizontal Displacement - DI(X) ...................................................... 24
2-25 B-3 Test - Pipe Center Vertical Displacement - DI (Z) ...................................................... 24
2-26 B-3 Test - Hoop Strain at Nozzle - SA16-2H ...................................................... 25
2-27 B-3 Test - Axial Strain at Nozzle - SA17-2A ...................................................... 25
2-28 Large Scale Piping System Test Setup ...................................................... 26
3-1 Simplified Piping System Test - Models A and B Linear Elastic ANSYS Piping ElementModels.34
viii
3-2 A-I Test Horizontal Response Spectrum (2% and 5% Damping) .............................................. 35
3-3 A-2 Test Horizontal Response Spectrum (2% and 5% Damping) .............................................. 35
3-4 B-I Test Horizontal Response Spectrum (2% and 5% Damping) .............................................. 36
3-5 B-2 Test Vertical Response Spectrum (2% and 5% Damping) .............................................. 36
3-6 B-3 Test Horizontal Response Spectrum (2% and 5% Damping) .............................................. 37
3-7 B-3 Test Vertical Response Spectrum (2% and 5% Damping) .............................................. 37
4-1 SEA Component Test Elbow Specimen .............................................. 44
4-2 SEA Test ANSYS Shell Element Model .............................................. 44
4-3 BKIN and MKIN Model Stress-Strain Curves .............................................. 45
4-4 CHAB Model Stress-Strain Curve .............................................. 45
4-5 Elbow Static Cycling Test SE4 - Hoop Strain vs. Number of Cycles at Elbow Flank ................ 46
5-1 ANSYS Model A Elasto-Plastic Shell and Beam Element Model ................................................ 55
5-2 A-2 Nonlinear Simulation Analysis Results - Displacement at Pipe Center - DI (X) .................. 56
5-3 A-2 Nonlinear Simulation Analysis Results - Hoop Strain at Elbow Flank - SAD-3H ............... 57
5.4 ANSYS Model B Elasto-Plastic Shell and Beam Element Model ................................................ 58
5.5 A-I Test Pipe Center Displacement Comparison - DI(X) ............................................................ 59
5-6 A-I Test Hoop Strain at Elbow A Flank Comparison - SAD-3H ................................................. 60
5-7 A-I Test Hoop Strain at Elbow A Flank Inside Surface Compared to Test Hoop Strain atOutside Surface - SAD-3H ................................................................. 61
5-8 A-2 Test Pipe Center Displacement Comparison - DI (X) ............................................................ 62
5-9 A-2 Test Elbow A Opening Displacement Comparison - D2(L) .................................................. 63
5-10 A-2 Test Hoop Strain at Elbow A Flank Comparison - SAD-3H ................................................. 64
5-11 A-2 Test Axial Strain at Elbow A Flank Comparison - SAD-3A ................................................. 65
5-12 B-I Test Pipe Center Horizontal Displacement Comparison - DI(X) ............... ........................... 66
5-13 B-i Test Hoop Strain at Nozzle Comparison - SA16-2H ............................................................. 67
5-14 B-I Test Axial Strain at Nozzle Comparison - SA17-2A ............................................................. 68
5-15 B-2 Test Pipe Center Vertical Displacement Comparison - DI (Z) ............................................... 69
5-16 B-3 Test Pipe Center Horizontal Displacement Comparison - DI (X) .......................................... 70
5-17 B-3 Test Pipe Center Vertical Displacement Comparison - DI(Z) ............................................... 71
5-18 B-3 Test Hoop Strain at Nozzle Comparison - SA16-2H ............................................................. 72
5-19 B-3 Test Axial Strain at Nozzle Comparison - SA 17-2A ............................................................. 73
5-20 B-3 Test Hoop Strain at Elbow A Flank Comparison - SAD-7H ................................................. 74
5-21 B-3 Test Hoop Strain at Elbow A Flank Inside Surface Compared to Test Hoop Strain atOutside Surface - SAD-7H ................................................................. 75
ix
Tables
2-1 NUPEC Static Piping Component Test Load Cases ............................................ 7
2-2 NUPEC Dynamic Piping Component Test Load Cases ............... .............................. 7
2-3 NUPEC Simplified Piping System Test Load Cases ............................................ 8
2-4 NUPEC Large-Scale Piping System Test Load Cases ............................................. 9
3-1 A-I Test Maximum Code Stresses and Margins ............................................ 32
3-2 A-2 Test Maximum Code Stresses and Margins ............................................ 32
3-3 B-I Test Maximum Code Stresses and Margins ............................................ 33
3-4 B-2 Test Maximum Code Stresses and Margins ............................................ 33
3-5 B-3 Test Maximum Code Stresses and Margins ............................................ 33
5-1 Summary of Post-Test Analysis Results and Test Comparisons ............................................ 54
x

EXECUTIVE SUMMARY
This report presents the results of BNL collaboration efforts on the NUPEC Ultimate Strength Piping TestProgram. NUPEC conducted a multi-year test program to investigate the behavior of typical NPP pipingsystems under large seismic loads. NUPEC's objectives were to develop a better understanding of theelasto-plastic response and ultimate strength of nuclear piping systems, to ascertain the seismic safetymargins in current piping design codes, and to assess new code allowable stress rules. This test programincluded monotonic and cyclic loading tests of piping material specimens, static and dynamic tests ofpiping components such as elbows and tees, seismic shaking table tests of two simple piping systems andof a representative large-scale piping system.
NRC and BNL participated in this NUPEC program under a collaboration agreement between the UnitedStates and Japan on seismic issues. As part of the collaboration, BNL performed pre-test and post-testanalyses for selected tests. NUPEC presented their test results to NRC and BNL and provided selectedtest data in electronic format. Periodic technical meetings were held in Japan and the U.S. during thecourse of the program to discuss and exchange ideas on the test program plans, to review and evaluate thetest results, and to review and evaluate both pre-test and post-test analyses. This report provides asummary of the NUPEC tests, describes the BNL post-test analyses, and discusses the insights gainedfrom this program.
A major goal of the NUPEC test program was to perform a seismic proving test of a representative NPPlarge-scale piping system. In order to gain a better understanding of the behavior of piping under severeseismic loads, NUPEC first carried out a series of material and piping component tests and shaking tabletests of small (simplified) piping systems. The material specimen tensile tests provided stress-straincurves and basic material strength properties including yield and ultimate stresses, percent elongation andultimate strain. Strain-controlled cycling tests were also performed which provided cyclic stress-straincurves and stress-strain hysteresis curves for incremental cycling amplitudes. The piping component testsincluded static and dynamic cycling tests of pressurized elbows, tees, nozzles and reducers. The testswere carried out at high strain levels and illustrated the accumulation of ratcheting strain. The specimenswere cycled until a through-wall crack occurred.
The simplified piping system tests were designed to excite the systems to seismic levels well above thetypical design earthquake levels in order to induce elasto-plastic response in the system's components.The test systems were simple two-dimensional (Model A) and three-dimensional (Model B) geometricconfigurations of 65 mm (2 12 inch) nominal diameter pipe. The Model A pipe routing configuration wasin the horizontal plane and was excited on a shaking table in the horizontal direction. The Model Brouting'was in the horizontal and vertical planes and was subjected to horizontal, vertical, or simultaneoushorizontal and vertical seismic motions. The piping systems were pressurized and instrumented withaccelerometers, displacement sensors and strain gages at critical locations which were monitored duringeach test. A number of tests to high strain levels were carried out to investigate different loadings anddesign variations. There were no failures reported during the application of any single time history.However, NUPEC repeated selected high input level tests for both a Model A and a Model B specimen toinduce failure. In these tests, cracking at an elbow was observed in the Model A configuration after fivetests at a high seismic level. For the Model B, 18 applications of a high level seismic input resulted in acrack at a nozzle weld. In both cases, the failures were attributed to fatigue ratcheting.
In the final phase of the test program, NUPEC carried out a series of shaking table tests on arepresentative large-scale piping system. The test specimen was a 200 mm (8 inch) nominal diameterSchedule 40 carbon steel pipe. It included straight pipe, nine elbows, a tee, and a 1000 kg (2200 lb)added mass representing a valve. The system was pressurized and supported by nozzles, an anchor, fivetwo-directional restraints, and a spring hanger. The three-dimensional routing of the piping was
xi

representative of nuclear power plant piping systems. The system was instrumented with accelerometers,displacement sensors, and strain gages at critical locations.
Two series of tests were performed: a design confirmation test and an ultimate strength test. For thedesign confirmation test, the first input motion was selected to induce a maximum stress equal to theJapanese Code primary stress limit of 3Sm. Additional design confirmation tests were then performedusing the same test specimen with the seismic input incrementally increased up to a maximum elastically-calculated stress of 13.5 Sm in the system. The tests were conducted at room temperature andsimultaneous horizontal and vertical seismic input motions were applied in all test runs. No evidence ofpipe failure was observed.
The ultimate strength test used a similar but modified piping test specimen. An additional mass wasadded and a support was removed. The intent of these modifications was to induce failure in the system.The pipe was internally pressurized and the tests were performed at room temperature. Horizontalseismic input motion corresponding to a maximum elastically-calculated stress level of 24 Sm was applied.The test was repeated until failure occurred. During the fifth test run, a through-wall crack developed inan elbow. An examination confirmed that the failure was the result of fatigue ratcheting.
In accordance with the collaboration agreement, BNL performed finite element analyses for selectedsimplified piping test runs. The BNL analyses had two major objectives. First, linear analyses wereperformed in accordance with ASME Code requirements. Since the ASME seismic evaluationrequirements have been undergoing significant changes in recent years, a comparative study was carriedout in which the piping systems were analyzed and evaluated according to three different Code versions.They include the latest NRC-endorsed version (1993 Addenda), the 1994 Addenda which incorporated analternative higher seismic stress allowable which was not endorsed by NRC, and the most recent 2004Edition which reinstated the original (1993) stress allowable but introduced an alternative method forcalculating seismic stresses in certain piping components. Since the NUPEC simplified piping testsloaded the piping systems to stress levels above ASME Code allowables, the analyses were used toidentify the degree to which the calculated stresses exceeded the Code allowable stresses. The ratios ofcalculated to allowable stress define the minimum margins of safety provided by different versions of theASME Code rules. The BNL study includes a comparison of the ratios calculated in accordance with thedifferent rules which provides a measure of the relative safety margins between different code versions.Additional analyses and Code evaluations are recommended for other tests in the NUPEC program,including those in which the simplified and the large-scale piping systems were tested to failure, toprovide further substantiation of Code margins.
The second major objective of the BNL analysis was to perform nonlinear analyses to investigate andevaluate the adequacy of the latest commercially available methods and computer programs for predictingthe elasto-plastic response of piping systems subjected to large earthquake loads. BNL used the ANSYScomputer program for performing these analyses. ANSYS is a computer program commonly used by thenuclear industry which has been enhanced in recent years to include a number of improvements in itsnonlinear analysis capability. Among these improvements was the inclusion of the Chaboche nonlinearkinematic hardening model. This plasticity model was expected to provide better simulation of the strainratcheting behavior that a pressurized pipe is expected to exhibit under seismic loading than is possiblewith classical linear hardening models. BNL utilized results of the NUPEC material tests to developinput parameters for the piping models. As part of the development process, BNL first created a finiteelement model of a piping elbow that was subjected to static cycling tests in the NUPEC component testprogram. Three sets of simulation analyses were carried out using three different plastic hardeningmodels: bilinear kinematic hardening, multilinear kinematic hardening, and Chaboche nonlinearhardening. The results of the analyses confirmed that the first two linear hardening models did not
xii

adequately predict the strain ratcheting behavior observed in the test. The Chaboche nonlinear modelprovided the most accurate simulation of strain ratcheting behavior.
ANSYS models were developed for the two-dimensional (Model A) and the three-dimensional (Model B)simplified piping systems. Preliminary seismic time history analyses were first performed for the ModelA high seismic level (A-2) test run. A number of studies were performed to investigate the sensitivity ofmodeling and analysis parameters on the results. The studies demonstrated the importance of accuratelymodeling the piping system to predict the correct system dynamic characteristics in an elasto-plasticanalysis. Small changes in system frequencies resulted in significant differences in response. Analyseswere also conducted using the two linear kinematic hardening models and the Chaboche nonlinearhardening model. Comparisons of time history results to test data clearly showed that the Chabochemodel predicted displacement and strain ratcheting with the greatest accuracy.
The Chaboche model was used in all subsequent nonlinear analyses of the simplified piping tests.A total of five analyses were performed: two levels of horizontal seismic time history input motion for thetwo-dimensional system (test runs A-I and A-2), and a horizontal, a vertical, and a combined horizontaland vertical seismic input motion for the three-dimensional system (test runs B-i, B-2 and B-3).Displacements and strains at critical locations were compared to test measurements. The application ofthe Chaboche nonlinear kinematic hardening model to the simulation analyses of the other four simplifiedpiping system tests demonstrated that the displacement time history responses were predicted withreasonably good accuracy. Accurate simulation of strain and strain ratcheting was achieved in some butnot all cases which indicates that even the Chaboche nonlinear model has limitations which need to bebetter understood. From a regulatory standpoint, these analyses demonstrated the importance ofunderstanding the limitations and sensitivities of nonlinear analysis methods and of commonly appliedplasticity models. Further studies to investigate the limitations of plasticity models on representativelarge-scale piping systems may provide additional insights.
The NRC and BNL are continuing the collaboration efforts with Japan and plan to analyze the large-scalepiping system test models and compare the results with the test data. Further insights from thiscollaboration effort will be provided in a follow-up report.
xiii

ACKNOWLEDGMENTS
The research program described in this report was sponsored by the Office of Nuclear RegulatoryResearch of the U.S. Nuclear Regulatory Commission. The authors would like to express their gratitudeto Dr. Syed Ali and Dr. Andrew Murphy, NRC Project Managers, for the technical and administrativesupport they have provided in performing this study.
This research program was performed as part of the Implementing Agreement between the U.S. NuclearRegulatory Commission and the Nuclear Power Engineering Corporation of Japan in the Area of SeismicEngineering Research. This agreement is an item of the Implementing Arrangement between the UnitedStates Nuclear Regulatory Commission and the Nuclear and Industrial Safety Administration of Japan forCooperation in the Field of Nuclear Regulatory Matters and Nuclear Safety Research and Development.
All of the test results and information about the test models included in this report were provided byNUPEC and are greatly appreciated. The authors especially thank Dr. Kenichi Suzuki, Program Manager,Seismic Engineering Center of NUPEC, for his support and technical guidance throughout thecollaborative study. The authors also wish to acknowledge the helpfulness and cooperation provided byMr. Hiroshi Abe and Dr. Yoshio Namita of NUPEC, Mr. Koichi Tai of Mitsubishi Heavy Industries, andMr. Tatsuya Fujiwaka of IHI Heavy Industries.
The authors also express special thanks to Ms. Susan Signorelli for her secretarial help throughout thisprogram and in the preparation of this report.
xv

1.0 INTRODUCTION
The Nuclear Power Engineering Corporation (NUPEC) of Japan conducted a multi-year test program forthe Ministry of Economy, Trade and Industry (METI) of Japan to investigate the behavior of typicalNuclear Power Plant (NPP) piping systems under large seismic loads. The objectives of this programwere to develop a better understanding of the elasto-plastic response and ultimate strength of nuclearpiping systems, to ascertain the seismic safety margins in current piping design codes, and to assess newcode allowable stress rules. The test program consisted of a series of static and dynamic material tests,piping component tests, simplified piping system tests, and large scale piping tests.
As part of collaborative efforts between the United States and Japan on seismic issues, the U.S. NuclearRegulatory Commission (NRC) and the Brookhaven National Laboratory (BNL) participated in thisprogram. The collaboration program included a series of periodic technical meetings held in Japan andthe U.S. to discuss and exchange ideas on the test program plans, to review and evaluate the test results,and to review and evaluate both pre-test and post-test analyses. In accordance with the collaborationagreement, NUPEC provided their test results to NRC and BNL in the form of presentations and alsoprovided selected test data for test runs analyzed by BNL in electronic format. NRC agreed to have BNLperform pre-test and post-test analyses for selected tests and provide the results in a series of presentationsand reports.
The purpose of this report is to present a summary of the NUPEC test program, to describe the BNL post-test analyses performed to date, and to discuss the insights gained from the program. Section 2.0 of thisreport provides a description and summary results of the NUPEC test program which consisted of fourphases of testing: material tests, piping component tests, simplified piping system tests, and large-scalepiping system tests. Section 3.0 presents the BNL linear seismic piping analysis and ASME Codeevaluations for selected simplified piping system tests. These analyses identify the highest stressedcomponents and the degree to which the maximum stresses exceed Code allowables. By performing theevaluations in accordance with different versions of the Code, the minimum margins to failure associatedwith the NRC endorsed Code version (1993 Addenda) are calculated and compared with the marginsbased on the 1994 Addenda and the latest 2004 Edition.
The results of the BNL nonlinear analyses are presented in Sections 4.0 and 5.0. Section 4.0 focuses onthe development of an accurate nonlinear plasticity model. Analyses of an elbow component test wereperformed using two linear hardening models and a nonlinear hardening model. Comparison of theanalysis results to test data demonstrated the nonlinear model's superior capability in predicting strainratcheting compared to the linear models. Section 5.0 presents the results of the post-test analyses for thetwo-dimensional (Model A) and the three-dimensional (Model B) simplified piping system tests andcompares key displacements and strains to test measurements. A summary of conclusions includingregulatory insights and lessons learned from the program, and recommendations for further research arepresented in Section 6.0.
I

2.0 DESCRIPTION OF NUPEC TEST PROGRAM
2.1 Introduction
A major goal of the NUPEC test program was the performance of a seismic proving test of arepresentative large-scale piping system. In order to gain a better understanding of the piping behaviorprior to performing the proving test, NUPEC conducted a series of material and piping component staticand dynamic tests, and simplified piping system seismic tests. This chapter provides a summarydescription of each of these series of tests.
2.2 Material Tests
NUPEC carried out a series of static monotonic loading and cyclic loading tests to develop stress-straincurves and properties for typical piping materials. The materials included carbon steel (grades STS410and SCV410), stainless steel (grade SUS304TP), and low-alloy steel (STPA24). Typical test specimensare shown in Figures 2-1(a) and 2-1(b). The tests were performed at room temperature and at 300'C(5721F). In the monotonic loading tests, the specimens were tensile tested to failure. The results of thetests provided the stress-strain curves and basic material properties including yield strength, ultimatestrength, percent elongation, percent area reduction, and ultimate strain. A typical stress-strain curve forSTS410 carbon steel is shown in Figure 2-2. In the cyclic loading tests, the specimens were subjected tostrain-controlled incremental cycling in consecutive blocks of twenty increasing amplitude cyclesfollowed by twenty decreasing amplitude cycles. Within each block of cycles, the strain amplitude wasincrementally increased linearly from 0% to a maximum of 2.5% strain (5% strain range) at 20 cycles,and then incrementally decreased back to 0% strain. These tests provided stress-strain hysteresis curvesfor the four piping materials at room temperature and at 300'C (5721F). They also provided cyclic stress-strain curves for the materials for strains up to 2.5%. A typical series of hysteresis curves for STS410carbon steel are shown in Figure 2-3. A typical cyclic stress-strain curve is shown in Figure 2-4.
NUPEC also carried out a series of low-cycle strain-controlled ratcheting fatigue tests for typical pipingmaterials at room temperature and at 300'C (5720F). Both uniaxial and biaxial loading tests wereperformed. The uniaxial tests also used the test specimen shown in Figure 2-l(b), as well as the samefour materials identified above. A unique aspect of the uniaxial fatigue tests is that in some of the testruns, an accumulated mean strain was artificially induced at a given rate per cycle to simulate theratcheting strain that may develop in components. Test run variations included different cyclic strainranges, mean strain accumulation rates, and temperatures. Test results provided data on strain versusnumber of cycles for different strain ranges and mean strain accumulation rates. They demonstrated thathigher mean strain accumulation rates result in shorter fatigue lives for all materials and temperatures.The biaxial tests used a miniature pipe specimen shown in Figure 2-1(c) to simulate the stress field ofpiping components subjected to internal pressure and seismic loading. These tests were performed forSTS410 carbon steel and SUS304TP stainless steel specimens. Test run variations included internalpressure, displacement amplitude, and temperature. The test results demonstrated that the test specimensexperienced circumferential swelling due to ratcheting and developed through-wall circumferential cracksin all but two cases in which longitudinal through-wall cracks developed. The test results were plotted onS-N diagrams (strain range versus number of cycles to failure), and on Dd-Df diagrams (where Df =(failure cycles)/(failure cycles without ratcheting) and Dd = (accumulated strain)/(fracture strain)) [1, 2].
2.3 Piping Component Tests
In the second phase of the program, NUPEC conducted static and dynamic tests on typical pipingcomponents which included elbows, tees, nozzles and reducers. A total of sixteen static tests wereperformed. A typical test setup for a static elbow test is shown in Figure 2-5. A summary of the test
3

conditions for each load case is presented in Table 2-1. Test specimen variations included componenttype, material, diameter, and pipe schedule. All tests were conducted at room temperature except for oneelbow test which was conducted at 300 C (5720F). The test specimens were subjected to either cyclic ormonotonic loads. Nearly all of the tests were deflection controlled with the exception of one elbow testwhich was load controlled. In the monotonic loading tests, the specimens were unpressurized and loadedto failure to determine the lower bound collapse moment. In the cyclic loading tests, the test specimenswere pressurized to induce an internal pressure stress equal to Sm, and then subjected to quasi-staticsinusoidal displacements until a fatigue crack developed. The applied displacement amplitudes wereselected to induce a maximum strain range of 3% in all cases but one, in which a larger displacementamplitude corresponding to a 6% strain range was applied. The specimens were cycled until through-wallcracks were detected. The test specimens were instrumented with strain gages at critical locations asillustrated in Figure 2-6. Load cells and displacement transducers were used to monitor force-deflectiondata as shown in Figure 2-5. NUPEC reported the monotonic test results as plots of load versusdeflection and strain versus deflection up to the collapse load. The cyclic test results were reported asplots of load-deflection hysteresis curves, strain distributions at critical component sections, andmaximum strain versus number of cycles. The strain versus cycle plots illustrated the accumulation ofratcheting strain during the tests. A typical plot of strain versus number of cycles up to failure for the SE-4 test is shown in Figure 2-7.
The component dynamic tests were performed on a seismic shaking table. The test specimens weresubjected to either sinusoidal or seismic wave acceleration input motions. A large mass on rollers wasattached to one end of the test specimen. A typical test setup for a dynamic elbow test is shown in Figure2-8. A total of twelve dynamic load tests were carried out. A summary of the test conditions is presentedin Table 2-2. Test specimen variations included pipe component type, material (STS410 carbon steel orSUS304TP stainless steel), and diameter. All tests were conducted at room temperature. All specimenswere pressurized to induce a stress level of either Sm or 0.5 Sm. The acceleration input levels wereselected to induce a maximum strain range of 3% in ten load cases and 1.5% in two load cases. Thespecimens were tested until though-wall cracking was observed. The test specimens were instrumentedwith strain gages at critical locations are shown in Figure 2-6. Accelerometers and displacementtransducers were used to monitor acceleration input and response and displacement response as shown inFigure 2-8. The test results were reported as plots of load-deflection hysteresis curves, displacement timehistories, and strain time histories. The strain versus time plots illustrated the accumulation of ratchetingstrain during the tests.
2.4 Simplified Piping System Tests
In the third phase of the program, NUPEC conducted a series of simplified piping system shaking tabletests to investigate the elasto-plastic response of small systems with typical piping components underlarge seismic excitations. These tests included two-dimensional test model configurations (Model A) andthree-dimensional configurations (Model B). In the two-dimensional configuration, the pipe routing wasin the horizontal plane and was subjected to single-direction horizontal seismic input motion. A typicalModel A simplified piping system test setup is shown in Figure 2-9. The system consists of three straightpipe runs connected by two long radius elbows. The pipe was 65 mm (2-1/2 inch) Schedule 40 carbonsteel grade JIS STS410. The system was supported at both ends by specially designed ball bearingpinned supports. The system was pressurized to 19.8 MPa (2870 psi) to induce a pressure stress equal toSm. Two 200 kg (440 lb) concentrated masses and two 30 kg (66 lb) masses were clamped to the pipe toprovide the desired dynamic characteristics for the system. The larger weights were on rollers whichprovided vertical gravity support. The system was instrumented with accelerometers, displacementsensors, and strain gages at critical locations as shown in Figures 2-10 and 2-11.
4

Pipe routing for the three-dimensional configuration (Model B) was identical to the Model A routing inthe horizontal plane with the addition of a branch line in the vertical plane as shown in Figure 2-12. Thebranch line was connected to the horizontal run pipe with a tee, and consisted of a riser pipe, a long radiuselbow, and a horizontal straight pipe which terminated at a nozzle. An additional 30 kg (66 lb)concentrated mass was attached to the horizontal portion of the branch line. The system was supported byball bearing pinned supports at the ends of the lower horizontal run and by the fixed nozzle at the end ofthe upper branch pipe. Instead of using roller supports at the large masses, variable spring hangers wereused to provide gravity support to the system without constraining vertical motion. The system waspressurized to 19.8 MPa (2870 psi). In this three-dimensional configuration, the Model B piping could besubjected to horizontal, vertical, or simultaneous horizontal and vertical seismic input motion. Thesystem was instrumented with accelerometers, displacement sensors, and strain gages at critical locationsas shown in Figures 2-13 and 2-14.
The basic seismic input excitations for the tests were selected to represent typical horizontal and verticalbuilding floor response spectra for Japanese PWR and BWR plants. However, the time scales wereadjusted to provide near resonant responses and the amplitudes of the seismic waves were modified toobtain the desired large elasto-plastic responses. The tests were performed at two excitation levels. Thebasic level identified as "medium" was intended to produce a maximum strain range of 1.5% withequivalent pipe stress of 6 Sm to 9 Sm and an anticipated fatigue life of 1000 cycles. The higher inputlevel identified as "large" was selected to produce a maximum strain range of 3% corresponding toequivalent pipe design stress of 10 Sm to 12 Sm and a fatigue life of 60 to 300 cycles.
NUPEC conducted a number of tests of both Model A and Model B specimens to investigate differentloading and design variations. Table 2-3 provides a summary of the load cases. In all cases, the testspecimen was a 65 mm (2-V2 inch) Schedule 40 pipe pressurized to 19.8 MPa (2870 psi). The basic two-dimensional test (A-I) subjected the pipe to a single horizontal direction medium level seismic load. Intest A-2, a large level seismic load was applied. In test A-3, one of the pinned supports was changed to afixed support. In test A-4, the frequency of excitation was reduced to about one-half of the resonantfrequency. Test A-5 used a stainless steel instead of carbon steel test specimen. In test A-6 an actuatorwas used at one of the pinned supports to provide independent support motion. Seismic acceleration timehistory input motions for the A-I and A-2 load cases are shown in Figures 2-15 and 2-16.
The three-dimensional test (Model B) load cases subjected the test specimens to horizontal, vertical andsimultaneous horizontal and vertical motions as summarized in Table 2-3. Test B-i subjected the pipe toa single horizontal direction medium level seismic load. Test B-2 subjected the pipe to a verticaldirection medium level seismic load. In test B-3, simultaneous horizontal and vertical medium levelseismic motions were applied. In test B-4, a large level seismic motion was applied. Finally in test B-5,lower frequency horizontal and vertical seismic input motions were applied simultaneously. Seismicacceleration time history input motions for the B-I, B-2 and B-3 load cases are shown in Figures 2-17, 2-18, and 2-19.
The piping systems were monitored during each test to measure accelerations, displacements, and strainsat selected locations. Representative time history response plots for the A-2 test including displacementsat the pipe center, elbow A opening and closing displacements, and hoop and axial strains at the elbow Aflank are shown in Figures 2-20 though 2-23. Representative B-3 test time history responses includinghorizontal and vertical displacements at the pipe center, and hoop and axial strains at the nozzle areshown in Figures 2-24 through 2-27. The plots illustrate the accumulation of permanent deformationsand strains that occurred during the tests. There were no failures reported during the application of asingle seismic time history. However, NUPEC repeated selected high input level tests to induce failure.NUPEC reported that cracking at the elbow A location was observed after five tests of the A-2 high levelseismic time history. Cracking at the nozzle occurred after 18 applications of the B-4 high level seismic
5

time history. For both the two-dimensional and three-dimensional tests, the failures were attributed tofatigue ratcheting.
2.5 Large-Scale Piping System Tests
In the final phase of the test program, NUPEC performed a series of seismic shaking table tests on arepresentative large-scale piping system. The tests were performed using the large high performanceshaking table at the Tadotsu Engineering Laboratory. The test specimen was a 200 mm (8 inch) nominaldiameter) Schedule 40 carbon steel (STS410) pipe. It included straight pipe, nine elbows, a tee, and a1000 kg (2200 lb) added mass representing a valve. The system was supported by nozzles, an anchor,five two-directional restraints, and a spring hanger. The three-dimensional routing of the piping systemrepresented typical configuration characteristics of safety-related Japanese nuclear power plant pipingsystems as illustrated in Figure 2-28. The system was instrumented with accelerometers, displacementsensors, and strain gages at critical locations.
Two series of tests were performed using two different test specimens. The first was a designconfirmation test and the second was an ultimate strength test. The seismic input motion was selectedbased on the Japanese "S2" seismic wave for a PVYTR with modified time pitch and excitation level toachieve the desired test responses. For the design confirmation test, the first input motion was selected toinduce a maximum stress equal to the Japanese Code primary stress limit of 3Sm. Additional designconfirmation tests were then performed using the same test specimen in which the seismic input wasincrementally increased until a maximum elastically-calculated stress of 13.5 Sm was reached. In all tests,the piping was internally pressurized to induce a hoop stress equal to the design stress intensity Sm. Thetests were conducted at room temperature and simultaneous horizontal and vertical seismic input motionswere applied in all test runs. No evidence of pipe failure was observed. A summary of the test cases ispresented in Table 2-4.
The ultimate strength test used a similar but slightly modified test specimen. An additional 1000 kg(2200 lb) mass was added and a two-directional support was removed. These modifications were neededin order to induce failure at the highest stressed elbow within the shaking capability of the Tadotsushaking table. The pipe was internally pressurized and the tests were performed at room temperature. Asindicated in Table 2-4, horizontal seismic input motion corresponding to a maximum elastically-calculated stress level of 24Sm was applied. The test was repeated until failure occurred. During the fifthtest run, a through-wall crack developed in the elbow. An examination confirmed that the failure was theresult of fatigue ratcheting.
6

Table 2-1 NUPEC Static Piping Component Test Load Cases
Test Component Matenal O.D. Thickness Internal Ternp. Load Load Load Control ViewpointNo. Type Pressure Wave Level Direction Type
SE-1 Cyclic Elbow Basic CaseSm Room Deflection (Carbon Steet)
SE-2 200A Sch40 Temp. Cyclic Load Load Control
SE-3 (A) None 3005 Large Temperature
SE-4 65A Pipe Daimeter
SE-5 200A Srh20 Cyclic DOameler/Tuckness
SE-6 SGV41 IO 400A sTD In-plane Deflection Ratio
SE-7 S 20 Elbow Basic Case
SE-t TP Extra Load Level
SE-9 STD None Room S Monotonic Lower Collapse LoadTemp___Deflection ________
ST-I STS41 0 200A4 Sch40TO Tee Basic Case(A) 200A Sm L arge Cyclic
ST-2 Tee Deflection Diameterl TticknessSGV410 400AI STD Ratio
-T-3 400A Pore Monotonic Lower Collapse Load
SN-1 Bend Cyclic Nozzle Basic CaseNozzle 200AN Sch4O Sni Large Tron Deflection
St-2 N te STS4 I10 20500A/ Sc4 Sr ag Tors o elefon Loaa Directlion
-3 (A) Sct2 None M onotonic Lower Collapse Load__ __S_ end Deflection _ _ _ _ _ _ _ _
St-I Reducer 200 Sctt40 Sm Large Cyclic Reducer Basic Case1_ SOA_ .Deflection
Note) Load Level-Extra Large (around 6% In Max. Strain Range). Large (around 3% In Max. Strain Range), Small (Current Design Allowable Level)O.D.--O OutsideDiameter(65A.2.SB. 1sOA-68. 200A885 250A=t08. 40OA.168)
Table 2-2 NUPEC Dynamic Piping Component Test Load Cases
Test Componenl Material O.0. Thickness Internal Temp. Load Load Load Control V owporitNo. Type Pressure Wave Level Direction Type
_ _tSress -I
DE-1 200A Sine Elbow Basic CaseLarge (Carbon Steel)
DE-2 Sm Seismic Load WaveSTS410
DE-3 (A) Sine Mdi.LaLei
DEt- 0.5Sm Internal Pressure
DE-5 Elbo In-laneLevelDE-5 Elbow 65A seismic Large ln-ptane Diameter
oE-6 200A Sm Room Sine Acceleration Elbow Basic CaseTemp. (Stainless Sleet)
DE-7 SUS304 - Sch40 Seismic Load Wave
DETt Middle load LevelSine
DE-9 .0.5m Internal PressureLevel
or- T ee ZQOA/ Tee B~asic Case* ~~200A Lrg
ON-1 None STS41O 200A Sm Seismic Nozzle Basic Case(A) 250A Bend
DR-i Reducer gOON Reducer Basic case
Note) Load Level--- Large (around 3% in Max. Strain Range). Middte (around 1.5% In Max Strain Range). Small (Curnent Design Afowable Level)
7

Table 2-3 NUPEC Simplified Piping System Test Load Cases
Test No A-1 A-2 A-3 A-4 A-S A-6
o Pipe size:2 I/t'Xsch4O(07S.3mmX5.2em) Yt X
Conceptual drawing o Stress due to internal P ji rtA -ttesiof piping system pressure ( A- nanelG0,,
2D-PIPlng o Stress due to dead weight /I'"' e 12D-Pptn S 0.55. rh af1nnm'sys tem .r fed1.nl
Investigulion Purpose of the test BDse data Loading condition Urn-symmetric piP'g roul Lower freouency Input Uaterial Forced displacementon sieato- (Test parameter) (symmetric pipire route) [refer A-t1 (reafr A-l. A-b] (refer A-l1 [refer A-t] [refer A-3]
plasticbehtlvior ot wave type artificiel seismic wane artificial seismic wave artificial seismic wove artificial seismic wove artificial seismic wave artificial seismic wane
siodi nt including resonance Including resonance including resonance including resonance including resonancepipingfirlqeno q inludn LwfeecCOnyonents condition ncy frequency frequnency freuncy I _din _ Low frequency frequency frequency
direction V (fonced disalacement * Y)
Loading Ievel Medium Large Medium Medium Medium medium
P1p5 material JIS:SIS4i0 JIS:STS4I0 JIS:SYS4I0 JIS:SS1410 JIS:SUS304TP JIS:SIS4I0(Carbon steil) (Carbon steel) (Carbon steel) (Carbon strut) (equivalent 51312 TP304) (Carbon steil)
Test No B-1 B-2 B-3 8-4 B-S
aPipe sfzt :-l/Z'Xsch40 z(461. 3emXS. 2mm) Y x
Conceptual drnwing a Stress due to Internalof piping syetetn tSmu s
o Stress due to dead weight3D-Piplng :S 0.ssm
system * !aidII~a~aI *na
Base date Loading direction Loeding direction Loading condition Lower frequency InputInvest(gatlon Purpose of the test (horizontal) (vertical) (vertical 4 horizontal) (vertical t horizontal) (vertical t horloontal)
en dynailc (Test Plraneter) (rofer A-li [refer B-li (refer B-l. B-2i [refer A-2. B-31 (refer A-t. B-3]behavior of
piping wane type artificial seismic wave artificiul seismic wave artificial seismic wane urtificial seismic wave artificial sesmice wavespite loadiny g n inducing resonance Inducing resonance Inducing resonance inducing resonance inducing resonance
condition frI uec f1 requency frequency frequency frequency frequency
direction Y Z Y. Z Y. Z Y. Z
Loading level tedloum Medium medium Large nedium
Pipe materiaI JIS:STS410 JIS:STS410 JIS:STS110 JIS:STS410 JIS:STS410_ _ *S (Curbon steel) (Carbon steel) (Carbon steel) (Carbon steel) (Carbon steel)
8

Table 2-4 NUPEC Large-Scale Piping System Test Load Cases
Test Case Excitation Excitation Design Stress DominantWave Direction Level Frequency
DM1-_ Sweep Horizontal (Elastic)
Preliminary Sweep Vertical (Elastic)
Test Seismic Horizontal (-DM2- 1,2) OfresonanceDM1-2Ofreoac
Design Method Seismic Vertical (=DM2-1,2)
Confirmation Allowable DM2-1 Seismic H + V 3Sm(-S2 limit) Off-resonance
Test Stress Test DM2-2 Seismic H + V 4.5Sm
Elasto-Plastic DM4-1 Seismic H+ V 6Sm
Response DM4-2(1) Seismic H + V 1.5Sm On-resonanceTest DM 4-2(2) Seismic H + V 1 3.5Sm
Preliminary US1 Sweep Horizontal (Elastic)
Ultimate Test Sweep Vertical (Elastic)
Strength Test Ultimate US2 Seismic Horizontal 24Sm On-resonance
Strength Test
9

(a) Uniaxial Static Monotonic Loading Test Specimen
(b) Uniaxial Cyclic Loading Test Specimen
0o. < Detail A
(c) Biaxial Ratcheting Fatigue Test Specimen
Dimensions shown in mm; I mm = 0.03937 in
Figure 2-1 Test Specimens from the NUPEC Material Tests
10

---
EtE
to'
5UU
450
400 -
350-
300 -
150 - Io
100
50
0.00 0.50 1.00 1.50
Strain (%)
2.00 2.50 3.00
Figure 2-2 Monotonic Loading Stress-Strain Curve for STS410 Carbon Steel(I N/mm 2= 145 psi)
600
400
200
E
z
so
0
-200
-400
-600 _--3.00 -2.00 -1.00 0.00 1.00 2.00
Strain (%)
3.00
Figure 2-3 Uniaxial Cycling Test Hysteresis Curves for STS410 Carbon Steel(I N/mm2 = 145 psi)
I1I

500
450
a-
_______ ____I_
350 -
'300 1 l
200 l
150 ___
0.00 0.50 1.00 1.50
Strain (%)
2.00 2.50 3.00
Figure 2-4 Cyclic Stress-Strain Curve for STS410 Carbon Steel(I N/mM2 =145 psi)
Fatigue Testing Machine
Dimension shown in mm;I mm = 0.03937 in
Figure 2-5 Static Elbow Cycling Test Setup
12

DC 20
25-B
Section D
SD-2A liol* SD-IASD-21- SD-IH
120* 6SD3A SDOASD3H 85 - *-85 SD-BH
60SDA 0SD-4H ' SD-SA
; SD-5H
Section C
SC-3H- SC-6H
Sections B, F, SB.1A* SF-1A
, SB.SA* SF-SA
* Strain Gage Location
SD-lA
Strain 7/ Direction
SectionNumrber
A: Axial
H: Hoop
Figure 2-6 Static Elbow Cycling Test Strain Gage Locations
18
16
14
12
.5 10
m'U
C 80
6
4
2
0
0 20 40 60 80 100 120 140 160 180 200
Cycle (N) /
Figure 2-7 Elbow Static Cycling Test SE-4 Hoop Strain vs. Cycle at Elbow Flank
13

*-' Acceleration
-* ~ *Displacement
200A x S401117
Length dimensions shown in mm; 1I mm= 0.03937 in
Figure 2-8 Dynamic Elbow Test Setup
14

(30kg)
Length dimensions shown in mm;1 mm = 0.03937 in; I kg = 2.2 Ibm
Figure 2-9 Model A Simplified Piping System Test Setup
is

A2(X.Y)
A4(X) ; Vibration TableP1 ; Internal Pressure
Al
Acceleration: 7ch lL DDisplacement: 4ch kTemperature: 1chPressure : Ich
A3 C. Y)
Figure 2-10 Model A Test Instrumentation
j 1
Scc.AI
A. tc.A
ElbowA . V1,4wII.... .4 II, -- - 1-d , ,
11 e r1IT _ =,(
5 ec.A5
;7S cl. _in
Sc.C Scc.DSec.B a 2r Sec.E
2* Sec.F
Sec.D
F o. M~IAMaAO~ o..%
S-MA r-.SD-& SO-4A
; 30-M
T . . -- , , , w ,III
Elbow BSec.AS
'S\ Sec.A7 LIMV
Sec.C,E X
SC4H SCSE41
Sec.B,F ' * Strain gange location
(j) Strain 1 floop
, " SecID \DirectionVlf4A Number
Strain gauge channel:Elbow: 22chx 2elbows-44chStraight Pipe: 2chx 8sections-16ch
Figure 2-1 1 Model A Test Strain Gage Locations
16

Nozzle
A'
Variable
Small Mass
Large M~ass )Length dimensions shown in mm;As (200kg) I mm = 0.03937 in; I kg = 2.2 Ibm
Figure 2-12 Model B Simplified Piping System Test Setup
17

A2(X.Y)
fD4)Ti: Themlo-Couple
A5(XY): Vibration Table '
P1: Internal Pressure
A-A'
Figure 2-13 Model B Test Instrumentation
0 Strain gauge location
60' !
Sec.C
X A: AxialI \/N H:Hoop
120- | W'.
-S SDF 4 = -5
Bs,60 I.
Sec.D
1,x, At.=Jl.- U
Strain gauge channel:Elbow:9ch. lelbow+3chs 2elbows=lSchNozzle:8ch- Isection+4chb 2sections=16chStraight Pipe :2ch. 16sections=32ch
A -A'
Figure 2-14 Model B Test Strain Gage Locations
18

1SO0O
10000 + ±
cE
I
e0
5000
0
4- 4 -4-
I ,11, I
] 1 "I "r'-b(UU - I4 _ _ _ _
-10000-~
0 50 100 ISO 200 250
1 minIsec 2 = .03937 in/sec2 Time (sec)
Figure 2-15 A-1 Test Acceleration Time History Input Motion
0
-C
0 50 100 150 200
1 mm/sec2 = .03937 in/sec2 Time (sec)
Figure 2-16 A-2 Test Acceleration Time History Input Motion
250
19

8000
6000
4000
i 20001
E1 01-0
.0 -2000
_ I I -I _- l _
I.1111~ I
0 20 40 60 80 100I mrnnec2 = .03937 Wnlsec2 Time (sec)
Figure 2-17 B-I Test Acceleration Time History Input Motion (Horizontal)
120
4000
-4 2000
EE
.24
< .2000
0 20 40 60 80 100
1 mm/sec2 =.03937 in/sec2 Time (sec)
Figure 2-18 B-2 Test Acceleration Time History Input Motion (Vertical)
120
20

2000
E
200
-4000
-6000
-80000 20 40 60 80 100 120
1 mmtsec2 = .03937 in/sec
2 ime (sec)
8000
6000 - === _ -_
|Vertical|4000-
200
0C 0 R~ TT
-2000
-4000
0 20 40 60 80 100 120
1 mm/sec2 = .03937 in/sec
2 Time (sec)
Figure 2-19 B-3 Test Acceleration Time History Input Motion (Horizontal and Vertical)
21

E,
.50
.150
0 50 100 150 200 250
1 mm =.03937 in Time (sec)
Figure 2-20 A-2 Test - Pipe Center Displacement - DI (X)
30
-15
-20
15a LLL __
0 50 too ?50 200 250
1 mm = .03937 in Time (sEc)
Figure 2-21 A-2 Test - Elbow A Opening Displacement - D2(L)
22

50 100 ISO 200
Time (sec)
250
Figure 2-22 A-2 Test - Hoop Strain at Elbow A Flank - SAD-3H
4. a
UU .
2.50-
2.00
1.50
1.00
0.50 A ___- L___._ ______ _____,______ __-_I_
________-_______
0 50 100 150 200 250
Time (sec)
Figure 2-23 A-2 Test - Axial Strain at Elbow A Flank - SAD-3A
23

1100.
Jl I80 4
l
40
? 20
.EA
00F3 -20 -
-40 -
-60
-80
-100
~II
Ik II . I
I !0 20 40 60 80 100
1 mm - .03937 in Time (sec)
Figure 2-24 B-3 Test - Pipe Center Horizontal Displacement - DI(X)
120
8
vE
a,
0 20 40 60 80 100
1 mm =.03937 in Time (sec)
Figure 2-25 B-3 Test - Pipe Center Vertical Displacement - DI(Z)
120
24

2.00
. _,
I.75 - _ _ _ _ _ _ _ _ _ _ _ _ _ _ _ _ _ _ _ _ _
.50 - I _ _ __ _ _
.2 5 _ _ _ _ _ _ _ _ _ _ _ _ _ _ _ _ _ _ _ _ _ _ _ _ _ _ _ _ _ _ _ _ _ _ _ _ __ _ _ _ _ _ _ _ _ __I
02
0.75
0.50 -&-V
0.25
0.00
-0.25 -~_ _ _ _ _ _ _ _ _ _ _ _ _ _ _
0 20 40 60
Time (sec)
80 100 120
Figure 2-26 B-3 Test - Hoop Strain at Nozzle - SA I 6-2H
2.00
20 40 60 80 100
Time (tec)
120
Figure 2-27 B-3 Test - Axial Strain at Nozzle - SA I 7-2A
25

I 3-D routeE
u *[1'1',
I:
High pressure coreHigh pressure corespray system
I Nozzle
Han
Residual heat removal system
flooder system
IHeavy weight(Valve)
removal system
Figure 2-28 Large Scale Piping System Test Setup
26

3.0 BNL LINEAR ANALYSES AND CODE EVALUATIONS
3.1 Introduction
BNL conducted a series of linear elastic seismic analyses and ASME Code evaluations for the NUPECsimplified piping system tests. The primary objective of these studies was to calculate and compare theminimum factors of safety to failure in piping systems designed in accordance with different versions ofthe Code. In 1994, the ASME Code rules for seismic design of piping underwent a major revision basedon a number of studies. Due to NRC staff concerns regarding the technical basis for the revisions, thisCode version was not endorsed by the NRC. As a result of efforts to resolve the staff's concerns, theCode Committee proposed new rules in 2001. The new rules were approved with some additionalchanges and were incorporated into the 2004 Edition of the ASME Code.
Since the simplified piping system tests were expected to load the piping systems to stress levels beyondCode allowables, the test results would provide data on minimum safety margins in critical pipingcomponents designed in accordance with different Code rules. During the pre-test analysis phase of thisprogram, BNL performed linear response spectrum analyses using the defined seismic wave inputmotions and carried out the Code evaluations in accordance with the NRC-endorsed (1993) Code rules,the 1994 revised rules and the 2001 proposed rules. During the test program, NUPEC determined that thedamping values for the simplified piping systems were lower than anticipated and subsequently revisedthe table input motions in order to achieve the desired output. Therefore, during the post-test analysisphase of the program, BNL repeated these calculations using the revised seismic table motions and thedifferent versions of the ASME Code rules. However, for these evaluations, the final 2004 rules wereused in place of the proposed 2001 rules. The post-test analysis results are presented below.
3.2 ASME Code Criteria
The latest version of the ASME Code Piping Design Criteria endorsed by NRC is the 1992 Editionincluding the 1993 Addenda. The piping design rules are defined in Section III, Division 1, SubsectionsNB, NC, and ND for Class 1, 2 and 3 components, respectively. Stress limits for piping subjected toseismic and other Level D loads are given in paragraphs NB/NC/ND-3656. For Class I piping, the Codestress equation for Level D primary stresses is as follows:
Bi PD"+ B 2 DoS Mj•<3. Os (3-1)2t 21(3l)
where:
P = pressureDo = outside diametert = wall thicknessB1, B2 = primary stress indicesI = moment of inertiaM; = resultant momentS = allowable stress intensity
The resultant moment term in the above equation includes deadweight, seismic and other Level Dmoments. The revised 1994 Addenda to the Code provided an alternate stress limit which was 50%higher than the old limit which could be applied when certain additional conditions were met. The newequation was:
27

B PDO +B 2 Do ME < 45S (3-2)2t 21
The resultant moment term, ME, in the above equation includes deadweight, seismic inertia and other"reversing" Level D moments. Additional conditions for application of this equation included thefollowing:
(1) The analysis must be based on the linear elastic response spectrum method with 5% damping and15% peak broadening.
(2) The ratio of outside pipe diameter to wall thickness shall not exceed 50.(3) Stress due to weight moments is limited to 0.5 Sm.(4) Stress due to seismic anchor motion moments is limited to 6 Sm.(5) Stress due to seismic anchor motion longitudinal forces is limited to Sm.(6) Maximum pressure during the SSE must not exceed the design pressure.
In 2001, the following changes were proposed to the alternate Level D primary stress limit equation:
BL P2 °+B2 DO ME <3.OSm (3-3)2t 21
where:
B2' = B2 for all piping components except:
B 2 ' = 3/4 B2 for elbows, bends, and teesB2'= 1.33 for girth butt welds between items which do not have nominally identical
thicknesses.
When this equation is used, the same additional conditions must be met, except that the ratio of outsidepipe diameter to wall thickness shall not exceed 40. This equation reinstated the original 3.0 Sm stresslimit but modified the stress indices for critical components. Compared to the 1993 Code, for straightpipes, the equation is identical to equation (3-1). For elbows, bends and tees, the change is approximatelyequivalent to using a stress limit of 4.0 Sm in equation (3-1). For girth butt welds at equipment nozzles,the change is approximately equal to a stress limit of 2.25 Sm in equation (3-1).
Equation (3-3) and the new B2' stress indices for seismic loads listed above were acceptable to the NRCstaff and would have been formally endorsed. However, ASME comments submitted March 22, 2004, onthe proposed 10 CFR 50.55a rulemaking (Federal Register Volume 69, Number 4, January 7, 2004)indicated that these B2' stress indices were a typographical error that will be corrected by an errata.According to the ASME position, the criteria should be B2' = 2/3 B2 for elbows, bends, and tees.Subsequently, the following alternate Code stress equation for seismic and other "reversing" stresses waspublished in the 2004 Edition of the ASME Code as follows:
B, 2t ° B2'10 ME 3OS,,m (3-4)
where:
28

B2'= B2 for all piping components except:
B2' = 2/3 B2 for elbows, bends, and teesB2' = 1.33 for girth butt welds between items which do not have nominally identical
thicknesses.
As in Equations (3-2) and (3-3) above, the resultant moment term, ME, includes deadweight, seismicinertia and other "reversing" Level D moments. Additional conditions for application of this equation arethe same as those for Equation (3-3):
(1) The analysis must be based on the linear elastic response spectrum method with 5% damping and15% peak broadening.
(2) The ratio of outside pipe diameter to wall thickness shall not exceed 40.(3) Stress due to weight moments is limited to 0.5 Sm.(4) Stress due to seismic anchor motion moments is limited to 6 Sm.(5) Stress due to seismic anchor motion longitudinal forces is limited to Sm.(6) Maximum pressure during the SSE must not exceed the design pressure.
Compared to the 1993 Code, for straight pipes, this equation is identical to equation (3-1). For elbows,bends and tees, the change is approximately equivalent to using a stress limit of 4.5 Sm in equation (3-1).For girth butt welds at equipment nozzles, the change is approximately equivalent to a stress limit of 2.25Sm in equation (3-1). Although this alternate stress criterion has been published in the 2004 Edition of theASME Code, to date, it has not been endorsed by the NRC.
3.3 Linear Analysis and Evaluation of Simplified Piping Systems
The two-dimensional (Model A) and three-dimensional (Model B) simplified piping systems wereanalyzed and evaluated using ASME Code seismic criteria by applying linear analysis methods andassumptions in accordance with nuclear industry practice. For consistency with the nonlinear simulationanalyses performed under this program, the ANSYS general purpose finite element analysis code [3] wasused. Both the Model A and Model B piping specimens were modeled using ANSYS three-dimensionallinear elastic straight pipe (PIPEI 6) and curved pipe (PIPE18) elements as shown in Figures 3-1 (a) and 3-I (b). MASS21 elements were used to represent the added masses attached to the pipes. For the pre-testanalyses, it was assumed that the added masses would also provide additional stiffness to the pipes.Therefore, over the length of the added masses, the pipe's cross-sectional properties were modified toreflect the rigid stiffness of the added masses. However, frequency test results for the actual pipingspecimens demonstrated that this assumption resulted in excessively stiff piping models with higherfrequencies than were observed in the tests. Therefore, for the post-test analyses, the stiffnesses at thelocations of the added masses were not included. This modeling assumption is consistent with the finalnonlinear models as discussed in Section 5.3 of this report. In Model B, the nozzle was represented by aseries of straight pipe elements with cross-sectional properties of the nozzle. The spring hangers inModel B were represented by linear spring elements (COMBIN14). Model A boundary conditionsincluded vertical translational restraint at the large mass rollers and restraint of all translations andhorizontal axis rotations at the pinned supports. In Model B, the nozzle end nodes and spring hangerground attachment point nodes were fully restrained, and pinned support point nodes were restrained fromall translations and from rotations about the horizontal axes.
Linear response spectrum analyses were performed in accordance with industry practice and regulatoryguidelines [4] for piping design with only two exceptions: (1) since actual piping dimensions had beenprovided by NUPEC, as-built rather than design dimensions were used in the models; and (2) since theinput motion was defined and the objective was to identify minimum margins to failure, unbroadened
29

instead of broadened response spectra were applied in the analyses. The response spectra for two-dimensional simplified piping tests A-1 and A-2 are shown in Figures 3-2 and 3-3. The response spectrafor the three-dimensional piping tests B-i, B-2 and B-3 are shown in Figures 3-4 through 3-7. The modaldamping values used in the analyses were consistent with the practices and requirements of the respectiveCode version. The 1993 Code version did not specify a damping value for analysis. For this case, twodifferent analyses were performed with damping values based on industry practice. In the first analysis,two percent damping was used based on NRC Regulatory Guide 1.61 for pipe diameters less than 12inches (300 mm). In the second analysis, frequency dependent damping values based on ASME CodeCase N-41 I damping were used. These values are 5 percent for modes with frequencies less than 10 Hzand 2 percent for modes with frequencies greater than 20 Hz. For frequencies between 10 Hz and 20 Hz,the damping values are linearly interpolated between 2 and 5 percent. For the 1994 and 2004 Codeversions, both analyses used the Code-specified value of five percent damping.
Linear analyses were carried out for pressure, deadweight and seismic loading. For each test case, theresults were post-processed to calculate stresses in accordance with the three different code versions. Thehighest stresses in the critical components (elbows for Model A; elbows, tee, and nozzle for Model B)were determined in accordance with the different equations, stress indices and stress allowables of eachcode version. The component with the largest ratio of stress to allowable stress was identified as thecritical component. The results for each load case are summarized in Tables 3-1 though 3-5.
In order to properly interpret the results of these analyses, it should be noted that the "margins" presentedin Tables 3-1 through 3-5 represent the ratios of the highest stress in a piping system (calculated inaccordance with the specific code version rules which include the stress equation, stress indices, anddamping) divided by the allowable stress (defined by the specific code version). Since none of thesimplified piping systems failed during a single seismic load application, they should not be interpreted asmargins to failure. Instead they should be considered minimum margins to failure or minimum Codestress margins. For example, Table 3-1 shows that the piping system in test A-I was able to sustain amaximum stress equal to 2.99 times the Code allowable without failure according to the rules of 1993ASME Code and R.G .1.61 damping. The same test shows that the piping system was able to sustain amaximum stress of 1.20 times the Code allowable according to the 2004 ASME Code rules. Had the testbeen conducted to higher stress levels resulting in failure the calculated margins to failure would havebeen proportionally higher.
In addition to providing information on minimum margins to failure, the results provide a measure of therelative safety margins between the different code versions. The margins in Table 3-1 indicate that the1994 and 2004 Code rules would provide essentially equal margins to failure while the 1993 rules with N-411 damping would provide 50% greater margin. The 1993 rules with R.G. 1.61 damping would provideabout 150% greater margin. The margin comparisons can be used to evaluate the relative conservatismsbetween the different Code versions.
For both the A- I and A-2 tests, the highest stresses were at Elbow A. Since the level of input excitationwas greater in the A-2 test, the margins were also greater for all code versions. The 1994 and 2004 Codecalculations provided nearly identical margins of 1.83 and 1.84, respectively. The 1993 Code calculationsprovided margins of 2.74 with N-411 damping and 3.56 with R.G. 1.61 damping.
For the Model B tests, the stresses and margins were generally lower. In the B-I and B-3 tests, thehighest stresses were either at the tee or at the nozzle weld. Stresses at these locations were very close invalue in nearly all cases except for the 2004 code stress calculation which has lower stress indices for teesand higher indices for nozzle welds. In the B-2 vertical motion test, the stresses were always highest atthe nozzle weld but the magnitudes were lower and the margins were less than one in all cases. Thehighest margins were in the B-3 (horizontal + vertical) tests. The 2004 Code calculations provided a
30

margin of 1.76 at the nozzle weld. The other code versions also provided highest stresses at the nozzlewelds. The margin based on the 1994 Code was less than one (0.91). The margins based on the 1993version were 1.37 with N-411 damping and 1.85 with R.G. 1.61 damping.
In summary, the linear analyses described above demonstrated that the NUPEC simplified piping systemhigh level seismic tests subjected the piping components to stresses well above Code allowables. Byperforming analyses and evaluations in accordance with different versions of the Code rules, minimummargins to failure were determined, and the relative differences in safety margins between the differentversions were compared for the tested components. Based on the 2004 Code rules, these evaluationsdemonstrated minimum margins to failure of 1.84 for elbows and 1.76 for nozzle welds. The mostconservative margins were provided by the 1993 Code version with R.G. 1.61 damping. Thoseevaluations demonstrated minimum margins to failure of 3.56 for elbows and 1.85 for nozzle welds. Itshould be clearly noted, however, that these margins are simply minimum safety margins based on thelimited simplified piping system test data. Since no pipe failures were observed during a single test, theactual margins to failure are higher. As discussed in Section 2.4 of this report, NUPEC conducted tests tofailure for a Model A and a Model B piping system. For the Model A test, a crack at the Elbow Alocation occurred after five high level seismic tests. For Model B, a nozzle crack was observed after 18applications of a high level seismic time history. The failures in both cases were attributed to fatiguecracking.
31
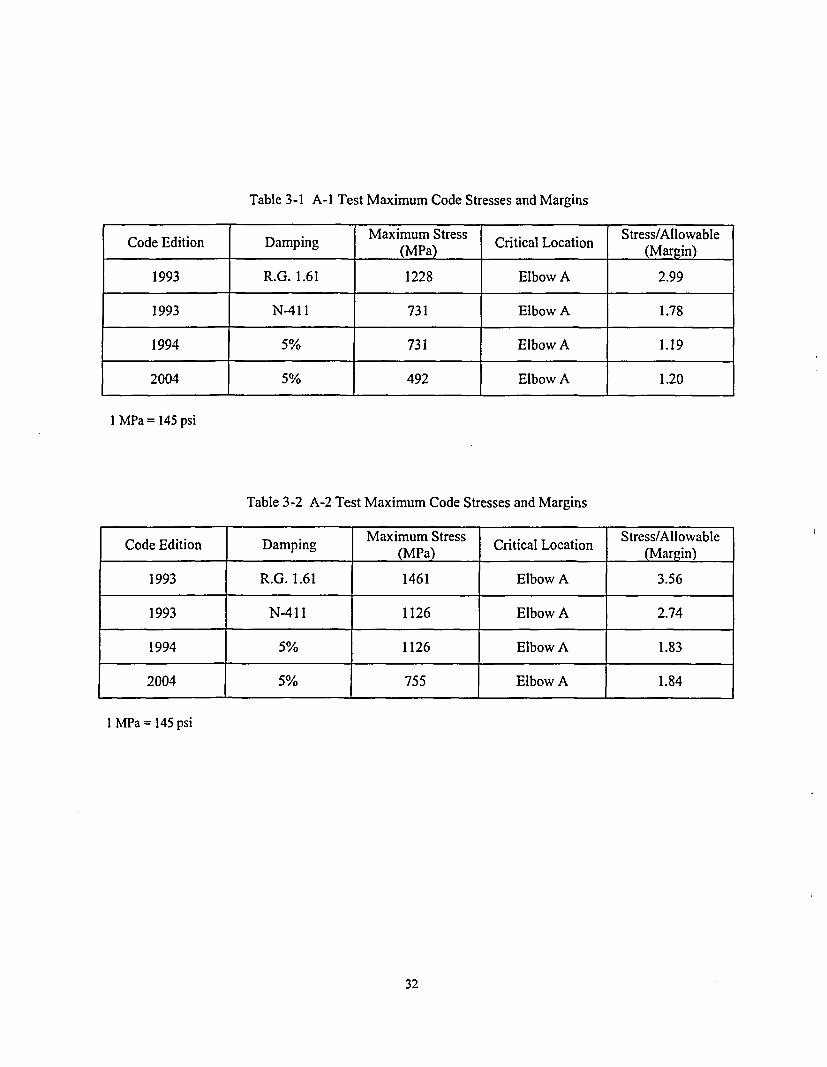
Table 3-1 A-i Test Maximum Code Stresses and Margins
I MPa = 145 psi
Table 3-2 A-2 Test Maximum Code Stresses and Margins
Code Edition Damping Maximum Stress Critical Location Stress/AllowableCoe(MPa) Cnia oain(Margin)
1993 R.G. 1.61 1461 Elbow A 3.56
1993 N-411 1126 Elbow A 2.74
1994 5% 1126 Elbow A 1.83
2004 5% 755 Elbow A 1.84
I MPa = 145 psi
32

Table 3-3 B-I Test Maximum Code Stresses and Margins
Code Edition Damping Maximum Stress (MPa) Critical Stress/AllowableCode _______ Elbow Tee Nozzle Location (Margin)
1993 R.G. 1.61 564 733 728 Tee 1.78
1993 N-411 405 536 539 Nozzle Weld 1.31
1994 5% 405 536 539 Nozzle Weld 0.87
2004 5% 274 424 692 Nozzle Weld 1.68
I MPa = 145 psi
Table 3-4 B-2 Test Maximum Code Stresses and Margins
Code Edition Damping Maximum Stress (MPa) Critical Stress/AllowableElbow Tee Nozzle Location (Margin)
1993 R.G. 1.61 117 124 262 Nozzle Weld 0.64
1993 N-411 98 109 226 Nozzle Weld 0.55
1994 5% 98 109 226 Nozzle Weld 0.37
2004 5% 70 93 276 Nozzle Weld 0.67
1 MPa = 145 psi
Table 3-5 B-3 Test Maximum Code Stresses and Margins
Maximum Stress (MPa) Critical Stress/AllowableCod eEdition Damping Elbow Tee Nozzle Location (Margin)
1993 R.G. 1.61 577 747 759 Nozzle Weld 1.85
1993 N-411 413 544 564 Nozzle Weld 1.37
1994 5% 413 544 564 Nozzle Weld 0.91
2004 5% 280 430 725 Nozzle Weld 1.76
I MPa = 145 psi
33

Elbow C
NozzleElbow A
Elbow A
Elbow B
Elbow B
(a) Model A (b) Model B
Figure 3-1 Simplified Piping System Test- Models A and BLinear Elastic ANSYS Pipe Element Models
34

- -
4.5
FCa0FI2 2.5 _____a_
0.5 J - -=
0 _ l I l l
0 2 4 6 8 10
Frequency (Hz)
12 14 16 18 20
Figure 3-2 A-i Test Horizontal Response Spectrum (2% and 5% Damping)
.r
a
0f
I2 4 6 8 10 t2 14 16 18
Frequency (Hz)
Figure 3-3 A-2 Test Horizontal Response Spectrum (2% and 5% Damping)
35

T
02
0
7 A __ I _
6 _ _ _ _ _ _ _ _ _ _ _ _ _ _ _
11T - apigA__
3- 1 apn
0I0 2 4 6 8 10
Frequency (Hz)12 14 16 18 20
Figure 3-4 B-i Test Horizontal Response Spectrum (2% and 5% Damping)
2.5
T
0
1.5
0.5
0 2 4 6 8 10
Frequency (Hz)12 14 16 18 20
Figure 3-5 B-2 Test Vertical Response Spectrum (2% and 5% Damping)
36

T
20
aI
00
.-C
7 I
4 A__
3 _________
3
I0
0 2
Figure 3-6
4 6 8 10 12 14 16 18
Frequency (Ha)
B-3 Test Horizontal Response Spectrum (2% and 5% Damping)
20
22 .
00j .
0 2 4 6 8 10 12 14 16 18
Frequency (Hz)
Figure 3-7 B-3 Test Vertical Response Spectrum (2% and 5% Damping)
37
20

4.0 BNL COMPONENT TEST NONLINEAR ANALYSES
4.1 Introduction
A major goal of the NRC/BNL collaboration effort was the performance of pre-test and post-test analysesfor selected piping component and piping system tests. The objective of these analyses was to investigateand evaluate the adequacy of current commercially available methods and computer programs forpredicting the elasto-plastic response of piping systems subjected to large earthquake loads. Uponinitiation of the collaborative effort, NUPEC indicated that the ABAQUS computer program would beused by NUPEC to perform their analyses. In order to complement the NUPEC analytical effort, BNLselected the ANSYS computer program [3] for performing these analyses. ANSYS is a widely used,general-purpose finite element analysis program. In recent years, the program was enhanced to include anumber of improvements in its nonlinear analysis capability. Among these improvements was theinclusion of the Chaboche nonlinear kinematic hardening model [5]. This plasticity model was expectedto provide better simulation of the strain ratcheting behavior that a pressurized pipe is expected to exhibitunder seismic loading than is possible with classical linear hardening models.
The major focus of the BNL simulation analyses was on the prediction of selected simplified pipingsystem test responses. These included the two-dimensional Model A test load cases A-I and A-2, and thethree-dimensional Model B test load cases B-1, B-2, and B-3. However, in order to develop, calibrate andtest elasto-plastic elbow components for the simplified piping system nonlinear models, analyses wereperformed to simulate the elbow component static cycling test SEA. Results of the NUPEC material testswere used to develop the plastic material properties needed in the component and piping analyses. Thefollowing sections describe the modeling and analysis approach, and the analysis results for the elbowcomponent test.
4.2 Development of Piping Elbow Model
The overall flexibility and dynamic properties of a piping system are typically dependent on the flexibilityof the elbows in the system. Furthermore, under large seismic deformations, the largest plastic strains areexpected to be concentrated in the elbows. Therefore, the development of accurate detailed finiteelement models of the piping system elbows was a critical step in the simulation analysis. A shellelement model of the elbow used in static component test SEA was first developed and compared withthe test data. The test specimen was a 65 mm (2 1/2 inch) Schedule 40 carbon steel long radius elbow. Ateach end, the elbow was welded to a short section of straight pipe which terminated at a welded flange.Details of the specimen configuration are shown in Figure 4-1 and the test setup is shown in Figure 2-5.As-built measurements of the specimen outer diameter and wall thickness at various cross-sections wereprovided by NUPEC. The pipe was filled with water and pressurized to 19.8 MPa (2870 psi). The testwas conducted at room temperature. Cyclic displacement of -15.5 mm (LO.6 in) was applied at the endsof the specimen at a frequency of one cycle/min.
The ANSYS finite element model of the SEA test elbow is shown in Figure 4-2. The model utilizedANSYS SHELLI81 large strain shell elements to represent the pipe wall. This element is appropriate foranalyzing thin to moderately-thick shell structures. It is a four-noded element with six degrees offreedom at each node. This type of element is well suited for linear, large rotation, and large strainnonlinear applications. The element can be used with all ANSYS kinematic hardening plasticity modelsincluding Chaboche nonlinear kinematic hardening. The triangular option of this element was used torepresent the flanges at the ends of the pipe. ANSYS elastic pipe elements (PIPEI6) with rigid stiffnessproperties were used to represent the end links that connect the pipe to the test fixture. Since the testspecimen was symmetric about two perpendicular planes, a quarter model with appropriate symmetry
39

boundary conditions was used. The pipe diameter and thickness of the shell element model was based onan average of the as-built values provided by NUPEC.
The elastic and plastic material properties for the elbow models were based on NUPEC material test datafor carbon steel (STS410) specimens. The elastic modulus used for all models was 203,000 MPa (29.4 x10⁶ psi) which was based on a monotonic tension test (MTT-1-1). The stress-strain curve for this test isshown in Figure 2-2. The development of plasticity parameters was dependent on the plasticity model.Analyses were performed using three different plastic hardening models. The development of theplasticity parameters for the pipe is described in the next section.
4.3 Development of Plasticity Models
Plasticity theory provides a mathematical relationship that characterizes the elasto-plastic response ofmaterials. The theory considers three basic components: the yield criterion, the flow rule, and thehardening rule. The yield criterion determines the stress level at which yielding is initiated. The flowrule determines the direction of plastic straining. The hardening rule describes the changes in the yieldsurface with progressive yielding, so that the stress states for subsequent yielding can be established. TheANSYS program provides several options for characterizing elasto-plastic material behavior. Inperforming the simulation analyses under this collaboration program, three different plasticity optionswere investigated: classical bilinear kinematic hardening, multilinear kinematic hardening, and nonlinearkinematic hardening. These options are based on the von Mises yield criterion, the associated flow rule,and different variations of kinematic hardening models as described below.
The kinematic hardening rule assumes that the difference between yield stresses under tension andcompression loadings remains constant. Under plastic deformation, the elastic domain will retain aconstant size but will move about in the stress space by translation. This translation can be characterizedin terms of the location of the center of its elastic domain or yield surface, which is also referred to as abackstress. The ANSYS classical bilinear kinematic hardening option is based on the linear kinematichardening rule introduced by Prager [6]. This theory assumes that the center of the yield surface moveslinearly with plastic strain. For the simple case of uniaxial loading, this rule is expressed by the followingincremental equation:
da = Codep (4-1)
where a is the center of the yield surface (backstress), ep is the plastic axial strain, and CO is a materialconstant equal to the plastic modulus. The total stress during plastic flow is expressed as follows:
a = a ± CO (4-2)
where ais the total axial stress and o0 is the yield stress, and the sign is dependent on the direction ofplastic flow. In applying the bilinear kinematic hardening (BKIN) option of ANSYS, the material stress-strain curve is represented as a bilinear curve in which the first slope represents the elastic modulus up tothe yield stress, and the second slope represents a linear plastic modulus. When a material is loaded intothe plastic range and subsequently unloaded, the reverse path follows the elastic slope back to a range oftwice the yield stress and then follows the plastic slope.
The multilinear kinematic hardening (MKIN) option in ANSYS is based on the Besseling multilayermodel [7]. When this rule is applied, the stress-strain curve is represented by several linear segments.This allows for a more accurate representation of a stress-strain curve. Under reversed loading, the loadpath again follows the elastic slope back to twice the yield stress and then follows the path of the multiple
40

plastic slopes. However, using either rule, the plastic modulus is always the same for loading andunloading and is unaffected by the presence of a mean stress. As a result, for a prescribed uniaxial stresscycle with a mean stress, the loading and reversed loading hysteresis curves will always produce a closedloop with no ratcheting.
The nonlinear kinematic hardening option (CHAB) in ANSYS is based on the work of Chaboche [5] whoproposed the superposition of several "decomposed" Armstrong-Frederick hardening rules. Armstrongand Frederick [8] had introduced a nonlinear kinematic hardening rule with a "recall" term whichintroduced a fading memory effect of the strain path. For the case of uniaxial tension-compressionloading, the translation of the yield surface is expressed by the following incremental equation:
da = Cdcp -yadep I(4-3)
where C and y are material dependent constants. In applying this rule, the plastic modulus, H, isexpressed by the following equation:
H=C:Fra (4-4)
In this equation, the negative sign is used for the forward loading curve and the positive sign is used forthe reverse loading curve. This rule provides an exponential plastic modulus. For a uniaxial stress cyclewith mean stress, this rule produces changes in shape between forward and reverse loading paths.Therefore the loop does not close and ratcheting occurs. A disadvantage of this model, however, is thatan experimental stress-strain curve is not necessarily exponential in nature and an attempt to simulate itby a single exponential equation does not yield a good fit. In addition, for a high strain range, the modeldoes not produce a constant plastic modulus as exhibited in experiments, but will instead always stabilizeto a zero plastic modulus.
In order to improve the simulation of the hysteresis loop, Chaboche proposed the superposition of threehardening rules. The first rule (a,) should simulate the initial high plastic modulus at the onset ofyielding; the second rule (a2) should simulate the transient nonlinear portion of the curve; and the thirdrule (a3) should be a linear hardening rule (y3 = 0) to represent the subsequent linear part of the hysteresiscurve at a high strain range. As is the case for the single Armstrong-Frederick rule, for a uniaxial stresscycle with mean stress, the rule will also produce a change in shape between the forward and reverseloading paths which results in ratcheting. However, because of the incorporation of the linear kinematichardening rule (a3), this model will eventually approach the complete shakedown of ratcheting which isnot in agreement with experimental results. The ratcheting simulation can be improved by assigning asmall value to y3, which introduces a slight nonlinearity which will improve the ratcheting simulationwithout producing a noticeable change in the hysteresis loop. The procedure for defining the parametersis described in the next section.
4.4 Determination of Material Parameters
The NUPEC material tests provided the basic material parameters needed for each of the three plasticityoptions investigated. The methodology used to define the parameters is described below.
4.4.1 Bilinear Kinematic Hardening Model
The stress-strain curve from a monotonic uniaxial tensile test of an STS41O carbon steel test specimenwas used to define the parameters for the bilinear kinematic hardening (BKIN) model. The parametersincluded modulus of elasticity, yield stress, and plastic modulus. Consistent with the theory, the plastic
41

modulus was assumed to be constant and was approximated from the slope of the stress-strain curve fromthe yield strain to 3 percent strain as shown in Figure 4-3. The values used for this model were 203000MPa (29.4 x 10⁶ psi) for the elastic modulus, 1220 MPa (177000 psi) for the plastic modulus, and 270MPa (39000 psi) for the yield stress.
4.4.2 Multilinear Kinematic Hardening Model
The cyclic stress-strain curve developed from a uniaxial strain cycling test of an STS410 carbon steel testspecimen was used to define the parameters for the multilinear kinematic hardening (MKIN) model. Thestress-strain curve was approximated by nine linear segments from zero to 2.5 percent strain as shown inFigure 4-3.
4.4.3 Chaboche Nonlinear Hardening Model
The Chaboche (CHAB) model required the definition of elastic modulus, yield stress, and the C1 and Yiconstants for each of the three Armstrong-Frederick hardening rules. A procedure for determination ofthe C and y parameters was described by Bari and Hassan [9]. All parameters, except for y3, weredetermined from the stress-strain hysteresis curves generated from a strain-controlled uniaxial straincycling test of an STS410 carbon steel test specimen shown in Figure 2-3. The procedure specifies thatthe decomposed backstress terms (a, or a2) should start from -C7/yi at the starting plastic strain -so, andreach a value of C/y, at the final plastic strain cp,. The third linear backstress term should go through theorigin. The equations used for the loading part of the hysteresis curve are as follows:
3
a = 0oe + Eaz (4-5)
; = Ci [I - 2 expl- Yi (up - (- c, for i = 1 and 2 (4-6)y i
a 3 = C3 cp (4-7)
where £pI is the strain limit of the stable hysteresis loop. The procedure first required the selection of ahysteresis loading curve with a reasonably large strain range. The yield stress and yield strain were thenestimated from the curve and the curve was adjusted for elastic strain to produce a stress versus plasticstrain plot. Using the above equations, the C, and yi parameters were selected to match this test curve. Aspreadsheet program was used to compare the loading part of the hysteresis test curve to the a curvefrom Eq. (4-5). The C3 parameter was first selected to match the slope of the linear segment of thehysteresis curve at a high strain range. The C, parameter was next selected as a large value such that theslope of a, nearly matched the plastic modulus at initial yielding, and the corresponding Ty value was alsoa large value to stabilize the hardening of a, immediately. The C2 and y2 parameters were selected by trialand error to match the overall shape of the curve. Additional adjustments to C, and y, were then made tomatch the initial slope of the test curve as well as the stress at both the start and end points. Figure 4-4illustrates the contribution of each rule to the simulation of the stress-strain curve, and compares the finalanalytical stress-stress curve to the test curve. As suggested in [9], the final parameter, y3, may bedetermined from a uniaxial ratcheting test to provide a best fit. However, for this analysis effort, thisparameter was determined from the results of an elbow component test strain cycling test as describedbelow. The parameters determined for the simulation analyses using the Chaboche nonlinear hardeningmodel were as follows: ao= 270 MPa (39000 psi), E 203000 MPa (29.4 x 10⁶ psi), C, = 70000 MPa(10.2 x 10⁶ psi), C2 = 30000 MPa (4.35 x 10⁶ psi), C 3 = 1200 MPa (174000 psi), y7 = 3500, y2 = 210, y3
=1.
42

4.5 Elbow Static Cycling Test Nonlinear Analysis
As a preliminary test of the ANSYS shell element elbow model, a nonlinear static cycling analysis wasperformed to simulate the elbow component test SE-4. The quarter elbow model shown in Figure 4-2was subjected to a constant internal pressure of 19.8 MPa (2870 psi) and equivalent cyclic enddisplacements of 1 5.5 mm (±0.6 in) were imposed statically for 185 cycles. A separate analysis wasperformed for each of the three plastic hardening rules as described below. Additional analysesinvestigated the significance of geometric deformation effects by applying the large deflection analysisoption in ANSYS and comparing results against those obtained using the small deflection analysis option.These studies demonstrated that the changes in geometric configuration due to elbow ovalization had avery small effect on elbow load deflection characteristics and on strain ratcheting. Therefore these effectswere judged to be insignificant within the range of this application, and the final analyses presented belowwere based on small deflection theory.
For in-plane loading of elbows, the maximum strain is expected to occur at the elbow flank. The outersurface of the elbow flank was instrumented with strain gages which were monitored during the test. Inthe SEA test, the elbow was cycled until crack penetration occurred at the flank at 185 cycles. The hoopstrain versus cycle history measured during the test is shown in Figure 4-5(a). As expected, significantstrain ratcheting was observed during the test. As shown in the Figure 4-5(a), the rate of strain ratchetingwas highest during initial cycling and then leveled off to a nearly constant rate until failure. Shakedowndid not occur. At failure, the accumulated hoop strain was nearly 15 percent.
The corresponding strain histories predicted by the ANSYS nonlinear analyses using the three plastichardening models are shown in Figures 4-5(b), 4-5(c), and 4-5(d). Using the bilinear kinematic hardeningmodel (BKIN), initial strain ratcheting was overpredicted during the first ten cycles. The rate of strainthen leveled off to zero (shakedown) with no additional strain accumulation. At 185 cycles, theaccumulated strain was about 7 percent. The multilinear kinematic hardening model (MKIN) analysispredicted shakedown after only five cycles with a total strain accumulation of only 2 percent at 185cycles.
As described in Section 4.4.3 above, the parameters needed for the Chaboche nonlinear kinematichardening model (CHAB) were determined from a strain-controlled uniaxial strain cycling test of anSTS410 carbon steel test specimen with the exception of the y3 parameter. This parameter was chosen byperforming parametric studies which varied the ys parameter and selecting the value that provided the bestmatch to the strain ratcheting results. The first analysis used a value of y3 equal to zero. The hoop strainversus cycle history is shown in Figure 4-5(d). This curve provided a better simulation of the initial strainratcheting behavior but also gradually leveled off and achieved shakedown with an accumulated strain of8 percent. Results of analyses using yv values of I and 2 are also shown in Figure 4-5(d). These strainhistories more accurately simulated the test results by leveling off to a nearly constant rate of ratcheting.The analysis with a yj value of I provided the best match to test results and was used in subsequentanalytical models.
43
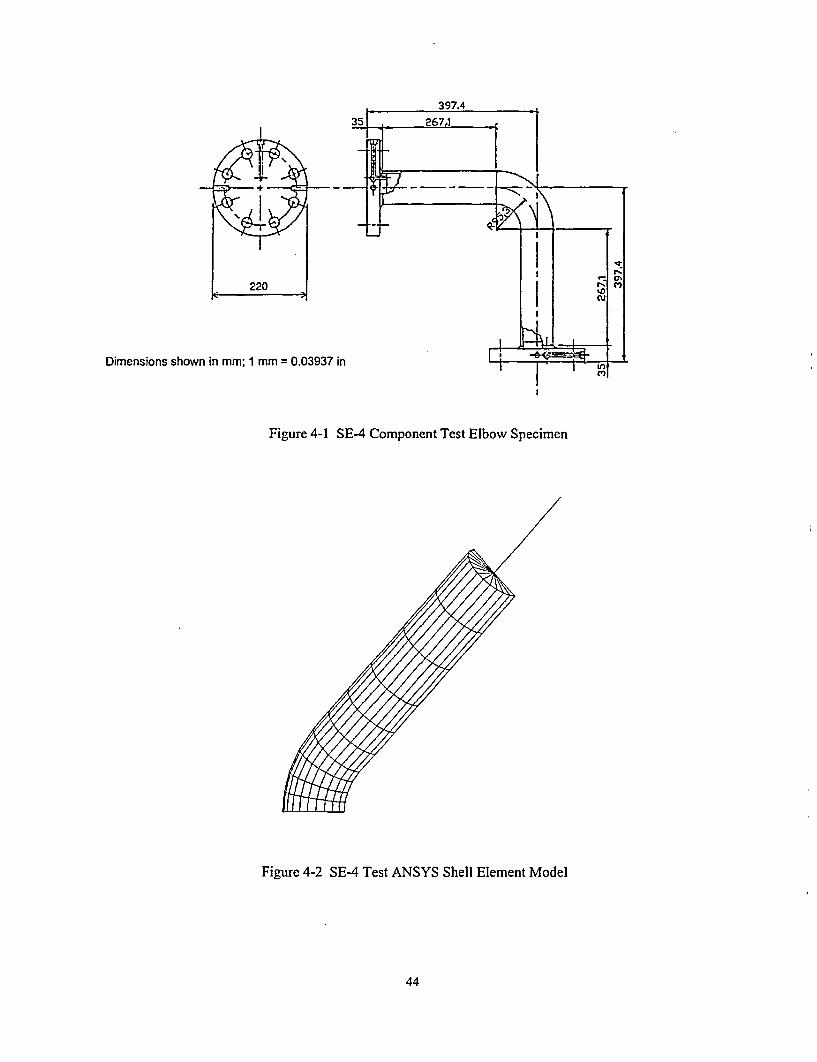
Dimensions shown in mm; 1 mm = 0.03937 in
Figure 4-1 SEA Component Test Elbow Specimen
Figure 4-2 SEA Test ANSYS Shell Element Model
44

Soo -AL-4500 _400 _2 _ _ 7 7 _ _ _ _ _ _ _ _
E2 300
-250a,0- 200
150
100
50
__ __ __ _ - __ __ __ __ _ __ __ __ _ M notonr c Test -
BKIN Model
-_ *. Cydic Test
lMKIN Model I
o a-
0.00 0.501 N/mm2 = 145 psi
1.00 1.50 2.00 2.50
Strain (%)
3.00
Figure 4-3 BKIN and MKIN Model Stress-Strain Curves
500
400
300
"E 200
z
E 100
0
-100
Test - I
I I_
/ O3 I
I I-200-3.0% -2.0% -1.0% 0.0%
Plastic Strain (%)
1.0% 2.0% 3.0%
1 N/mm 2= 145 psi
Figure 4-4 CHAB Model Stress-Strain Curve
45

16E
1 4
- 1 1
n
U~c
00I
-ilI-4
4 _________
2 -- -- = L ==
a
0 20 40 60 80 100 120 140 160 180 200
Cycle (N)
0 20 40 60 80 100 120 140 160 180 200
Cycle (N)
F.0UC
0M
18~
16 - -
14 (c)MN Model j1 2 1 -= -4-f -l2- III10 I __.I
aj8 ___ __-.. _.. _ ._- -8 .I- -- --- - -
4 -
2 WAM UIIMu
o 1111I1117IlHmrmNmmDUU IlllD1111111 INi~l INiiimlll l
C
00Ct
0 20 40 60 80 100 120 140 160 180 200
Cycle (N)
0 20 40 60 80 100 120 140 160 180 200
Cycle (N)
Figure 4-5 Elbow Static Cycling Test SE-4 - Hoop Strain vs. Number of Cycles at Elbow Flank
46

5.0 BNL SIMPLIFIED PIPING SYSTEM TEST NONLINEAR ANALYSES
5.1 Introduction
Initial analytical models of the piping systems and components utilized the ANSYS straight and curvedplastic pipe line elements. Preliminary analyses, however, demonstrated that the curved plastic pipeelements were not adequate for simulating the elbow strain ratcheting behavior observed in the tests. As aresult, the final models incorporated detailed shell element representations of elbows and other pipingcomponents expected to experience plastic deformation. The elbow models were based on the shellelement elbow models developed for the SE4 component test. The following sections describe themodeling and analysis approach, analysis results, and comparisons to test results.
5.2 Development and Pre-Test Analysis of Two-Dimensional Simplified Piping System Model
The ANSYS model of the two-dimensional Model A Simplified Piping System test specimen shown inFigure 2-9 consisted of a combination of elements. Because of symmetry about the horizontal plane, onlythe top half of the system was modeled and appropriate symmetry boundary conditions were defined atthe horizontal mid-plane. The ANSYS model is shown in Figure 5-1. The elbows were modeled in thesame manner as the SEA4 test elbow model described in Section 4.2 above using ANSYS SHELL181large strain shell elements to represent the pipe wall. These elements were used to represent the elbowsplus a 100 mm (4 in) length of straight pipe at each end of the elbows. Since it was anticipated that theplasticity would be localized to the elbows, the remaining straight pipes were represented by two-dimensional linear elastic beam elements (BEAM3) with dimensional properties equivalent to the cross-sectional properties of half the pipe. The transition from the straight pipe shell model to the straight pipebeam model was achieved through a series of rigid beam elements arranged in a wheel spokeconfiguration as shown in the elbow detail in Figure 5-1. The shell element representation of theadditional length of straight pipe at the ends of the elbow was needed to ensure that the constraints at thetransition from shell to beam elements did not inhibit elbow ovalization required for appropriatecharacterization of elbow flexibility. The selection of the 100 mm (4 in) length considered the guidanceprovided in the ASME Code, Section 111, Subsection NB-3686.2 which states that the code elbowflexibility equations are applicable only if there are no flanges or stiffeners from the end of the elbow towithin a distance equal to the mean radius of the pipe. For this case, a 100 mm (4 in) length isapproximately three times the mean radius. Additional static load deflection analyses comparing a fullshell element model to this combination shell element/beam element model verified the adequacy of thesimplified shell/beam element model. ANSYS MASS2 1 elements with half the actual masses representedthe added masses attached to the piping system. Symmetry boundary conditions were specified toconstrain vertical translation and horizontal axis rotations for all nodes in the horizontal (x-y) plane.Horizontal translational restraints were defined at the two pinned support points.
I
During the pre-test analysis phase of the program, seismic analyses were performed to predict theresponses for the A-l and A-2 tests. A primary objective of these analyses was to investigate andcompare responses using the three different plasticity models described in Section 4.3 and to select thebest model for application in the post-test analysis. The analyses applied the ANSYS nonlinear fulltransient analysis option which utilizes the Newton-Raphson iteration procedure and the Newmark timeintegration method to solve the nonlinear equations of motion. An internal pressure of 19.8 MPa (2870psi) was applied to the system. System damping was defined in terms of Rayleigh damping coefficientsbased on the expected modal damping value of 3 percent provided by NUPEC. The expected inputmotions were defined as x-direction digitized acceleration time histories of the shaking table divided into4000 equal time increments. Duration times were 191.6 seconds for the A-1 test and 215.6 seconds forthe A-2 test. Since the ANSYS program does not accept base acceleration input motion, the input wasapplied as an equivalent force time history to a fictitious large mass of 10" kg (2.2 x 10" Ibm) connected
47

to the support points. The ANSYS automatic time stepping option was applied with an integration timestep upper limit of one quarter of the input motion load step (.012 sec. for A-i and .0135 sec. for A-2).Both the A-i and A-2 analyses were performed for each of the three plastic hardening models. Keyresponses including displacements, rotations, stresses and strains at critical locations were saved at everyload step for comparison with test results. Differences in both displacement and strain ratcheting resultswere observed between the different plasticity models.
During preliminary testing of the two-dimensional Model A simplified piping system, NUPECdetermined that the system modal damping was lower than expected (1.8 percent versus 3 percent). As aresult of this finding, NUPEC revised the final table acceleration input motions to achieve their targetstrain levels. Because of this change, a comparison between the BNL pre-test analysis results and testresults was not meaningful. NUPEC made adjustments to both the time and acceleration level scales ofthe input motions and provided the new inputs, as well as the test results, to BNL for post-test analysis.Using the same methodology and the analytical model with Chaboche nonlinear kinematic hardening,BNL repeated the A-2 test analysis with the new seismic input motion and lower damping values. Acomparison of these post-test analysis results to test results showed that the analysis significantlyunderpredicted displacements and strains. Peak displacement at the center of the pipe predicted byanalysis was 50 mm (2 in) versus 178 mm (7 in) recorded in the test. The analysis predicted no strainratcheting compared to 3.4 percent accumulated strain observed in the test. A series of additionalanalytical studies to investigate and identify the source of the underprediction and improve the accuracyof the simulation were initiated.
5.3 Additional A-2 Simplified Piping System Test Analytical Investigations
A series of additional A-2 test simulation analyses were carried out to examine the sensitivity of results tochanges in various modeling and analysis parameters. The initial series of analyses investigated changesin analysis parameters. The following changes were considered:
* Reduction in integration time step from .015 sec. to .003 sec.* Reduction in output time step from .09 sec. to .03 sec.
The analyses with the above reduced time steps showed no significant differences in results.
The load application method was investigated next. The original analysis had applied the baseacceleration input time history as an equivalent force time history to a large fictitious base mass. Twoalternate methods of load application were investigated:
* A displacement time history was calculated by performing a double integration of theacceleration input time history. This was applied directly to the model as a displacement inputtime history at the support points.
* The acceleration time history was converted to a set of equivalent inertia force time histories andapplied directly to the concentrated masses in the piping system model.
Both the displacement time history and the equivalent inertia force time history analyses showed nosignificant differences in results. It was noted, however, that the inertia force time history analysis wasmore efficient and this method was applied in subsequent analyses.
Variations in material parameters were investigated next as follows:
* A 10% reduction in modulus of elasticity to better match the Model A test frequency
48

* A 20% and a 40% reduction in yield stress to induce more plasticity* A modal damping ratio of 0% (vs. 1.8%) to induce greater amplified response* Application of bilinear kinematic hardening model vs. Chaboche model
The results of these analyses showed small differences in results. The case with no damping providedslightly higher displacement but no strain ratcheting. The case with 40% reduction in yield stressdemonstrated a small amount of strain ratcheting but no increase in displacement. The other casesprovided nearly identical results to the original analysis.
All of the analyses were underpredicting the global seismic response of the system. Further investigationswere conducted to establish additional reference information that may assist in understanding the causefor the underprediction. Additional analyses were performed with increased input motion. Theseanalyses demonstrated that a close match to test results can be achieved by increasing the amplitude of theinput acceleration time history by a factor of two to three times the A-2 input motion. A linear elastictime history analysis was also performed to establish an elastic baseline analysis. The elastic analysisconsidered no material (plasticity) or geometric (large deflection) nonlinearities. The analysis providedunexpected results. The maximum deflection was nearly twice the deflection predicted by the nonlinearanalysis. Since the linear analysis had removed the geometric as well as the material nonlinearities,additional analyses were performed to identify the source of the difference. The elasto-plastic analysiswas repeated with no geometric nonlinearity (small deflection theory) and the elastic analysis wasrepeated with geometric nonlinearity (large deflection theory). A comparison of deflection resultsdemonstrated that the differences were due to the application of small deflection versus large deflectiontheory. Within the same geometric assumption cases, the differences in peak deflections between elasticand elasto-plastic analyses were relatively small. However, within the elastic and elasto-plastic cases,small deflection theory predicted almost twice the deflection than predicted by large deflection theory.Although these results demonstrated that application of small deflection theory would provide increaseddeflections closer to test, they were still below test results and additional investigations were needed.
Investigations on the sensitivity of results to dimensional variations were conducted next. The A-2 modelused as-built dimensions for straight pipes and elbows based on average as-built diameter and wallthickness measurements provided by NUPEC. A comparison with nominal dimensions showed that theas-built thickness used in the model was 30% higher than nominal. This difference may be significantsince it results in a stiffer, higher frequency system and lower strain in the elbow. To investigate thesensitivity of response to dimensional variations, the system was reanalyzed using nominal pipedimensions. A frequency analysis demonstrated that by using nominal dimensions, the model provides amuch closer match to the test frequency. The original as-built dimension model had a fundamentalfrequency of 2.34 Hz compared to the test frequency of 2.2 Hz. The nominal dimension model had afrequency of 2.18 Hz. The seismic analysis of the nominal dimension model with small deflection theoryprovided the closest match to both displacement and strain ratcheting test results than was observed in anyprevious analysis. Based on these results, further discussions were held with NUPEC to verify theparameters used in the BNL model.
BNL compared key modeling parameters between the ANSYS model and the NUPEC ABAQUS model.The as-built dimensions were found to be nearly identical, so there was no justification for using nominaldimensions. Other parameters and modeling assumptions were also compared. A difference in themodeling of added masses was identified. Both models included concentrated masses at the pipe nodeslocated at the centers of gravity of the added masses. The BNL model assumed that the added massesstiffened the pipe along their length and modified the cross-sectional properties of the pipe to correspondto the rigid stiffness of the added mass. The NUPEC model did not increase the stiffness of the pipealong the length of the added mass. Therefore, additional analyses were performed to investigate theeffect of this difference. Frequency analysis of the A-2 model without the added mass stiffness showed a
49

reduction in piping system frequency which more closely matched the test specimen frequency. Anonlinear seismic analysis of this modified model using small deflection theory showed excellentcomparisons to test displacements and strain ratcheting. Subsequent analyses for the simplified pipingsystems discussed in the following sections used this modeling assumption and were based on smalldeflection analysis.
Some additional analyses were performed to investigate why small deflection analysis was providingbetter results than large deflection analysis. Large deflection analysis was originally used to account forthe effects of elbow ovalization on elbow stiffness. This change in cross-sectional geometry results indecreased elbow stiffness on closing and increased elbow stiffness on opening. In theory, a largedeflection analysis should account for this change. A model of the SE4 elbow was statically loaded byapplying displacements in opening and closing directions using small deflection and large deflectionanalyses. A plot of force versus deflection showed that for small deflections, both analyses predicted thesame elbow stiffness in both the opening and closing directions, as expected. At larger deflections, thelarge deflection analysis predicted higher elbow stiffness upon opening and lower stiffness upon closing.The same effect was observed with an elastic model and an elasto-plastic model. These analysesdemonstrated that the ANSYS elbow model behaved as expected for large and small deflection analysis.A similar static analysis was performed for the A-2 piping system model. In these analyses, the center ofthe pipe was displaced in the positive and in the negative x-directions. In both directions, the largedeflection analysis predicted about 40% higher stiffness at all values of displacement. This was observedfor both elastic and elasto-plastic models. The higher initial stiffness seen in the large deflection analysisis believed to be an anomaly. At small deflections, the geometric effect is insignificant, and a largedeflection analysis should provide the same results as a small deflection analysis. It appears that the largedeflection analysis of the A-2 model introduces artificial stiffening which does not represent the actualbehavior of the system and provides erroneous results. The higher stiffness would explain the reduceddynamic global response of the piping system seen in the original analysis. The cause of this anomaly isunknown. There may be incompatibilities between the different elements used in the model, but furtherinvestigations are needed to ascertain the root cause of this problem.
As noted above, subsequent simplified piping system analyses used small deflection analysis. Althoughthis type of analysis does not account for the geometric effects of elbow ovalization, the effect wasbelieved to have a small impact on the results. Some additional analyses were performed to support thisassumption. Since large deflection analysis provided reasonable results for the SEA4 elbow, this modelwas further analyzed to compare large deflection analysis with small deflection analysis results. The loadversus deflection curves from the monotonic loading analyses of the elbow describe above had alreadydemonstrated that the difference in elbow stiffness between large and small deflection analysis was small.Additional static cycling analyses simulating the SEA test were carried out. A comparison of resultsdemonstrated that the large deflection cycling analysis predicted only a slight increase in elbowequivalent stiffness along with a slight increase in strain ratcheting in the elbow. The differences inresults were less than 10 percent. Since the strain levels in the elbow tests were comparable to the strainlevels in the simplified piping system test, it was therefore concluded that within the range of interest, asmall deflection analysis of the simplified piping system model would provide a reasonable level ofaccuracy in the results.
5.4 Final A-2 Simplified Piping System Test Analyses and Comparisons
Final nonlinear seismic analyses of the A-2 test were carried out based on the methodology describedabove using each of the three plastic hardening models. Comparisons of displacements and elbow straintime history results between the test and the different models are shown in Figures 5-2 and 5-3. Asshown in Figure 5-2(a), test measurements indicated peak displacements of +170 mm (+6.7 in) and -178mm (-7 in) at the pipe center with a permanent deformation of-12 mm (-0.47 in) at the end of the test.
so

The BKIN model (Figure 5-2(b)) predicted displacements of +1 46 mm (+5.75 in) and -166 mm (-6.54 in)with +2 mm (+0.08 in) permanent deformation. The MKIN model (Figure 5-2(c)) predicted +165/-161mm (+6.5/-6.34 in) and -6 mm (-0.24 in) permanent deformation. The CHAB model (Figure 5-2(d))predicted +162/-167 mm (+6.38/-6.57 in) and -6 mm (-0.24 in) permanent deformation. A closeexamination of the displacement time history plots shows that the Chaboche nonlinear kinematichardening model predicts the closest match to the test displacement time history, although the multilinearkinematic hardening model also produces a reasonably good match.
A comparison of the Elbow A flank strain time history results shows more significant differences. Asshown in Figure 5-3(a), the test results indicated hoop strain ratcheting in the elbow for the first 125seconds of motion. By the end of the test, the accumulated strain was 3.35%. The BKIN model (Figure5-3(b)) overpredicted the strain ratcheting with shakedown occurring at 75 seconds with a final permanentstrain of 5.5%. The MKIN model (Figure 5-3(c)) also predicted strain ratcheting during the first 75seconds but the final permanent strain only reached 1.3%. Finally, the CHAB model (Figure 5-3(d))initially underpredicted the test strain ratcheting response during the first 50 seconds but continuedratcheting until 125 seconds with a final accumulated strain of 3.25% by the end of the test. Anexamination of the strain time history plots clearly shows that the Chaboche nonlinear kinematichardening model provided the best simulation of the strain ratcheting observed in the test. These findingsdemonstrated the superior performance of the Chaboche plasticity model in predicting both globaldisplacement and local strain ratcheting response. Therefore, the remaining post-test analyses were basedon the Chaboche model.
5.5 Final Two-Dimensional and Three-Dimensional Simplified Piping System Test Analyses
The same analytical methodology, plastic hardening model, material properties, and modelingassumptions used in the final A-2 analysis were applied in the post-test simulation analyses for the two-dimensional A-I test and for the three-dimensional B-I, B-2 and B-3 simplified piping system tests. TheA-1 analysis used the same half-symmetry, combination shell and beam element model shown in Figure5-1. Revised equivalent inertia force time histories at the concentrated masses corresponding to the lowerlevel acceleration time history input for the A-I test were calculated and applied to the model. Theanalysis results are discussed below.
For the three-dimensional Model B tests, a new ANSYS finite element model based on the test specimenconfiguration shown in Figure 2-12 was developed. The Model B specimen consisted of a similar run ofpipe in the horizontal plane as Model A with an additional branch line in the vertical plane whichterminated at a nozzle. It included an additional concentrated mass and relied on spring hangers ratherthan rollers for gravity support. The system was also pressurized to 19.8 MPa (2870 psi). Because of thethree-dimensional configuration, a full model rather than a half-symmetry model was needed. TheANSYS model is shown in Figure 5-4. The three elbows were modeled using ANSYS SHELLI81 largestrain shell elements around the entire circumference of the pipe wall. A 100 mm (4 in) length of straightpipe was included at each end of the elbows. The same types of shell elements were used to model thenozzle plus 300 mm (12 in) of straight pipe. It was assumed that the plasticity would be localized to theelbow and nozzle, so the remainder of the piping system was modeled using three-dimensional elasticstraight pipe elements (PIPE 16). The straight pipe elements were connected to the elbow and nozzle shellelement models by a series rigid beam elements arranged in a wheel spoke configuration as shown inFigure 5-4. ANSYS MASS21 elements were used to represent the added masses in the system.Boundary conditions included full constraint of all degrees of freedom at the end of the nozzle andrestraint of translations and horizontal axes rotations at the pinned supports. Constant vertical forces wereapplied at the spring hanger attachment points to provide gravity support. Loads due to gravity and aninternal pressure of 19.8 MPa (2870 psi) were applied to the system. System damping was defined interms of Rayleigh damping coefficients corresponding to the measured modal damping of 0.7 percent
51

from the test. The analyses were performed in the same manner as the Model A analyses using theANSYS nonlinear full transient analysis option. The actual horizontal and vertical acceleration timehistory input motions from the NUPEC tests were used to develop equivalent inertial force time historiesat the concentrated masses. In the B-1 analysis, the forces were applied in the horizontal x-direction. Inthe B-2 analysis, they were applied in the vertical z-direction. In the B-3 analysis, the horizontal andvertical forces were applied simultaneously. The results of these analyses are discussed below.
NUPEC provided simplified piping system digitized test data at selected critical locations for comparisonto BNL analysis results. This included displacement and strain time history response data. Table 5-1summarizes the selected types of data and measurement locations. Plots of analysis and test time historyresults are shown in Figures 5-5 through 5-21 with analysis results shown on top for comparison to thetest results shown on the bottom. A summary of the comparisons is presented below.
A-I Test:
The comparison of test vs. analysis displacements at the pipe center shown in Figure 5-5 shows excellentagreement. The test indicated a slight negative permanent deformation which was not predicted by theanalysis. Figure 5-6 compares hoop strains at the outside surface of the Elbow A flank. It shows that theanalysis significantly underpredicts strain ratcheting in this case. Figure 5-7 shows the inside surfacestrain time history from analysis compared to the outside surface test strain time history (all testmeasurements were on the outside surfaces). This is not a one-to-one comparison, but demonstrates thatthe analytical model predicts a comparable amount of strain ratcheting at this elbow location.
A-2 Test:
A comparison of test vs. analysis displacements at the pipe center shown in Figure 5-8 shows excellentagreement in terms of overall shape of the plots, peak displacements and permanent deformation. Thecomparison of Elbow A opening displacements shown in Figure 5-9 also shows similar agreement. Thecomparison of Elbow A hoop strains shown in Figure 5-10 shows very good overall agreement. Thecomparison of axial strains at the same elbow location (Figure 5-1 1) shows that the analysisunderpredicted the strain cyclic amplitudes and strain ratcheting. The magnitude of strain ratcheting inthe axial direction, however, was much lower than in the hoop direction.
B-I Test:
A comparison of test vs. analysis horizontal displacements at the pipe center shown in Figure 5-12 showsgood agreement in terms of overall shape of the plots, peak displacements and permanent deformation.The comparison of hoop strains at the nozzle shown in Figure 5-13 shows that the analysis significantlyoverpredicted the ratcheting strain. The strain cyclic amplitudes, however, were observed to be small andappeared comparable between analysis and test. The comparison of axial strains at the nozzle location(Figure 5-14) shows comparable strain cyclic amplitudes and some overprediction of strain ratcheting.
B-2 Test:
Figure 5-15 shows that the peak vertical displacements at the pipe center were somewhat overpredictedby the analysis. The vertical displacements, however, were of smaller magnitude than the displacementsin the horizontal motion tests. Both analysis and test showed no permanent deformation at the end of thetest.
52

B-3 Test:
A comparison of test vs. analysis horizontal displacements at the pipe center presented in Figure 5-16shows good agreement in terms of overall shape of the plots, peak displacements and permanentdeformation. The comparison of vertical displacements presented in Figure 5-17 shows that the analysisoverpredicts the test results. The vertical displacements, however, were of smaller magnitude than thehorizontal displacements and the permanent deformation at the end of the test predicted by analysis wascomparable to test. The comparison of hoop strains at the nozzle shown in Figure 5-18 was consistentwith the B-1 test comparisons, which showed that the analysis significantly overpredicted ratchetingstrain. As in the B-i comparisons, the strain cyclic amplitudes were observed to be small and appearedcomparable between analysis and test. The comparison of axial strains at the nozzle location presented inFigure 5-19 shows comparable strain cyclic amplitudes but overprediction of strain ratcheting. In thiscase, it was noted that in comparison with the B-i test axial strains shown in Figure 5-14, the strainratcheting observed in the B-3 test was less than half of the strain ratcheting observed in the B-i test,despite the similar input excitation level in the horizontal direction. Furthermore, the analyses predictednearly identical axial strain ratcheting for the B- 1 and B-3 tests as expected. NUPEC, however,investigated and confirmed that the B-3 axial strain data was correct. The comparison of hoop strains atthe Elbow A flank (Figure 5-20) shows comparable cyclic strain amplitudes, but the analysisunderpredicted strain ratcheting. In Figure 5-21, hoop strain at the inside surface of the Elbow A flank iscompared to the hoop strain at the outside surface of the Elbow A flank. Although this is not a one-to-onecomparison, it demonstrates that the analytical model predicts a comparable amount of strain ratcheting atthis elbow location.
In summary, the comparisons of simplified piping system post-test simulation analysis resultsdemonstrated that displacement time history response was predicted with good accuracy. Accurateprediction of seismic strain and strain ratcheting was achieved in some cases, but in other cases, bothoverpredictions and underpredictions were observed.
53

Table 5-1 Summary of Post-Test Analysis Results and Test Comparisons
Test Data Location Figure
Displacement at Center of Pipe DI(X) 5-5
A-1 Hoop Strain at Elbow A SAD-3H 5-6
Hoop Strain at Elbow A (Inside Surface) SAD-3H 5-7
Displacement at Center of Pipe DI(X) 5-8
Opening Displacement of Elbow A D2(L) 5-9A-2
Hoop Strain at Elbow A SAD-3H 5-10
Axial Strain at Elbow A SAD-3A 5-11
Horizontal Displacement at Center of Pipe DI(X) 5-12
B-i-I Hoop Strain at Nozzle Section A16 +90° SA16-2H 5-13
Axial Strain at Nozzle Section A17 +90° SA17-2A 5-14
B-2-1 Vertical Displacement at Center of Pipe DI(Z) 5-15
Horizontal Displacement at Center of Pipe DI(X) 5-16
Vertical Displacement at Center of Pipe DI(Z) 5-17
Hoop Strain at Nozzle Section A16 +90° SA16-2H 5-18
B-3Axial Strain at Nozzle Section A17 +900 SA17-2A 5-19
Hoop Strain at Elbow A Section D -85° SAD-7H 5-20
Hoop Strain at Elbow A Section D -85° (Inside Surface) SAD-7H 5-21
54

Elbow ADetail
Elbow B
Figure 5-1 ANSYS Model A Elasto-Plastic Shell and Beam Element Model
55

200
ISO -
100}
50E o
oi -50 -
*100 -
CL
.1a.-'150==^L
j 5s
mm = .03937 in F e me (s..) N O 200 2e0 i200
s:A a i2 o
100 Ti 150(sec)
Figure5-2 A-2NonlinearSimulationAnalysisResults - Displacement at Pipe Center- DI(X)
200 250
56
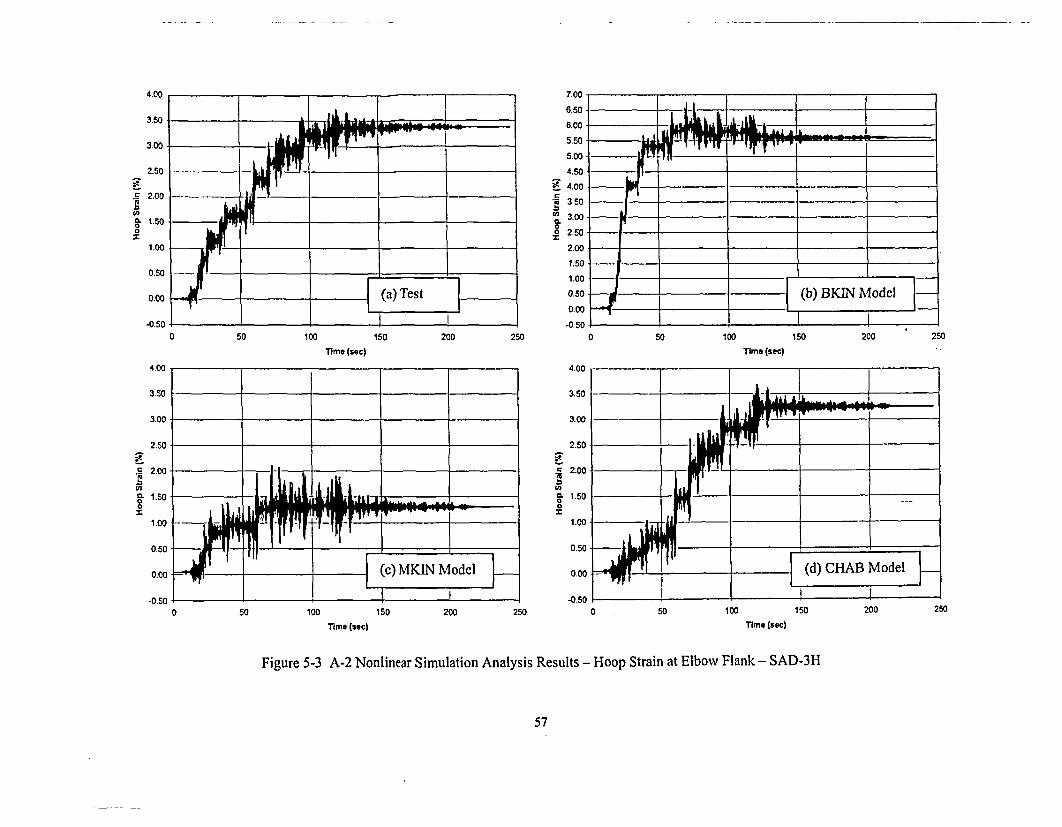
4.00 7.00
6.50
6.00
ZMS
'
0
0Z
OC
8.V0.00Z
C
a.000x
U.UU
4.50
4.00
3.50
3.00
2.50
2.00
1.50
1.00
0.50
0.00
-0.50
-II
-,-I
I _,
. ! I0 50 100 150 200 250 0 50 100 150 200 250
Time (sec) Time (sec)4.00
7
a.00C
0 50 100 150 200
Time (sec)
250 0 . 50 100 150 200Time (sec)
250
Figure 5-3 A-2 Nonlinear Simulation Analysis Results - Hoop Strain at Elbow Flank - SAD-3H
57

Elbow CDetail
NozzleDetail --
, Elbow A
vBail
..i.
Figure 5-4 ANSYS Model B Elasto-Plastic Shell and Beam Element Model
ElboMDet;
58

ANSYS A-1 Analysis Results (a1d2 Model)Pipe Center Displacement
E
0.
a
0 50 100 150 200 250
Time (sec)1 mm = .03937 in
A-1 Test ResultsPipe Center Displacement
V
E
2a
0 50 100 150 200
1 mm = .03937 in Time (sec)
250
Figure 5-5 A-I Test Pipe Center Displacement Comparison - DI(X)
59

ANSYS A-1 Analysis Results (al d2 Model)Hoop Strain at Elbow A Flank
2
en
-0.50 so 100 150 200
Time (sec)
250
A-1 Test ResultsHoop Strain at Elbow A Flank
S-
S
Tra
0 50 100 150 200 250
rime (sec)
Figure 5-6 A-I Test Hoop Strain at Elbow A Flank Comparison - SAD-3H
60

ANSYS A-1 Analysis Results (a1d2 Model)Hoop Strain at Elbow A Flank Inside Surface
F
.5
2I
50 100 150 200
Time (sec)
250
A-1 Test ResultsHoop Strain at Elbow A Flank
Fr2W(A
0 50 100 150 200
Time (sec)
250
Figure 5-7 A-I Test Hoop Strain at Elbow A Flank Inside Surface Compared to Test Hoop Strain atOutside Surface - SAD-3H
61

ANSYS A-2 Analysis Results (a2d41 Model)Pipe Center Displacement
0r
,E
0
-100
-200so 100 IS1 200 250
1 mm = .03937 in Time (sec)
A-2 Test ResultsPipe Center Displacement
E
E0.E0
U0
-2000 so 100 150 200
1 mm = .03937 in rime (sec)
250
Figure 5-8 A-2 Test Pipe Center Displacement Comparison - DI(X)
62

ANSYS A-2 Analysis Results (a2d41 Model)Elbow A Opening Displacement
E 10E
E 5Ut
. 0a
-200 50 100 150 200 250
1 mm = .03937 in Time (sec)
A-2 Test ResultsElbow A Opening Displacement
E10E
E 5
.E 0a
0 50 100 150 200
1 mm = .03937 in Time (sec)
250
Figure 5-9 A-2 Test Elbow A Opening Displacement Comparison - D2(L)
63

ANSYS A-2 Analysis Results (a2d41 Model)Hoop Strain at Elbow A Flank
S0
In
0 50 100 150 200 250
Time (sec)
A-2 Test ResultsHoop Strain at Elbow A Flank
Fc
I,>
0 50 100 150 200 250
Time (sec)
Figure 5-10 A-2 Test Hoop Strain at Elbow A Flank Comparison - SAD-3H
64

ANSYS A-2 Analysis Results (a2d41 Model)Axial Strain at Elbow A Flank
S7£
0 50 100 150 200
Time (sec)
250
A-2 Test ResultsAxial Strain at Elbow A Flank
0 50 10o 150 200
Time (sec)
250
Figure 5-1 1 A-2 Test Axial Strain at Elbow A Flank Comparison - SAD-3A
65

ANSYS B-1-1 Analysis Results (b1d2 Model)Pipe Center Displacement
E 20
Ec
.n -20a
0 20 40 60 80 100
1 mm = .03937 in rime (sec)120
B-1-1 Test ResultsPipe Center Displacement DI (X)
_ 20
E 0
-
.- -20B
0 20 40 60 80 100
1 mm = .03937 in Time (sec)
120
Figure 5-12 B-I Test Pipe Center Horizontal Displacement Comparison - DI(X)
66

ANSYS B-1-1 Analysis Results (bId2 Model)Hoop Strain at Nozzle Section SA16-2H
U)
6 1 __
5
4
3
0 20 40 60 80 100 12C
Time (sec)
B-1-1 Test ResultsHoop Strain at Nozzle Section SA16-22H
6.00
5.00
4.00 -
3.00
2.00 - I i I
1 .0 0 _ _ - _ _ _ _ _ _ fn nn _ _ _ _ _ _ _ _ _ _ _ _
cT
0 20 40 60 80 100 120
Time (sec)
Figure 5-13 B-I Test Hoop Strain at Nozzle Comparison - SA16-2H
67

ANSYS B-1-1 Analysis Results (bld2 Model)Axial Strain at Nozzle Section SA117-2A
so
2.5
2
IT WI 1w PF-
4.50 20 40 60 so 100 120
Time (sec)
B-1-1 Test ResultsAxial Strain at Nozzle Section SA117-2A
2S
2I
-0.500 20 40 60 80 100
Time (sec)
120
Figure 5-14 B-I Test Axial Strain at Nozzle Comparison - SA17-2A
68

ANSYS B-2-1 Analysis Results (b2d2 Model)Pipe Center Displacement
25
I _ I I i I
I
-E
EC
a.
15
5
-5 -- 2
-10 - II
-12 0 I 1
-20 _ _ _
0 20 40 60
Time (sec)
80 100 120
I mm =.03937 in
B-2-1 Test ResultsPipe Center Vertical Displacement
25
E
e.0.
an
0 20 40 60 80 100
1 mm = .03937 in Time (sec)
120
Figure 5-15 B-2 Test Pipe Center Vertical Displacement Comparison - DI(Z)
69

ANSYS B-3 Analysis Results (b3d2 Model)Pipe Center Horizontal Displacement
-E
E0
a1
-1000 20 40 60 s0 100
1 mm = .03937 in Time (sec)
120
B-3 Test ResultsPipe Center Horizontal Displacement
E
ZE0
v0
0 20 40 60 80 100
1 mm = .03937 in Time (sec)120
Figure 5-16 B-3 Test Pipe Center Horizontal Displacement Comparison - DI(X)
70

ANSYS 8-3 Analysis Results (b3d2 Model)Pipe Center Vertical Displacement
25 - _ ]_ _ _ --
15
10*
E SE
E 0-
00
-10I
-15
- �- +
vE
EE120.
a
-20 l } ll}
0 20 40 60 80 100 12
1 mm = .03937 in Time (sec)
B-3 Test ResultsPipe Center Vertical Displacement
25
20
15
-5
.15 I l
*20 _ _ _ L -
25 . ___
0
0
1 mm=.03937 in20 40 60
Time (sec)
80 100 120
Figure 5-17 B-3 Test Pipe Center Vertical Displacement Comparison - D1(Z)
71
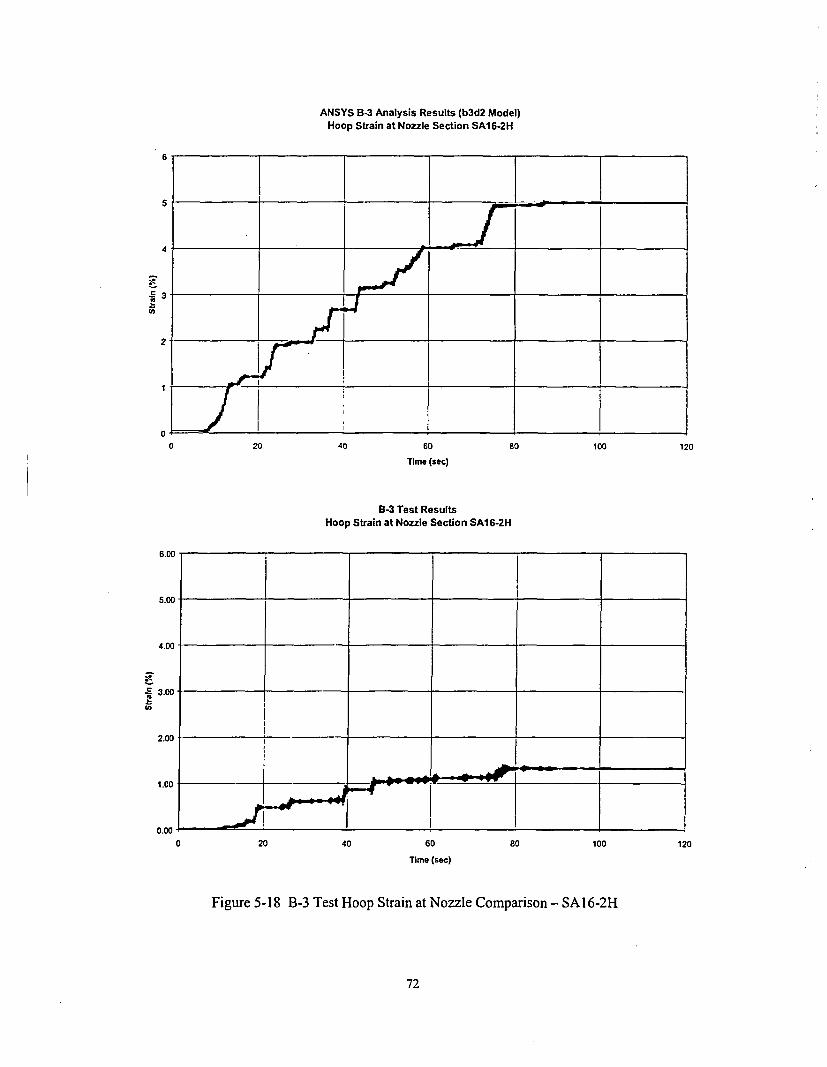
ANSYS B53 Analysis Results (b3d2 Model)Hoop Strain at Nozzle Section SAI 6-2H
F.520ch
5 ~
4 -
3 1
2-
'I _ _.-- Il
0 20 40 60
Time (sec)
80 100 120
B-3 Test ResultsHoop Strain at Nozzle Section SA116-2H
6.00
.S
0 20 40 60 80 100
Time (sec)
Figure 5-18 B-3 Test Hoop Strain at Nozzle Comparison - SA I 6-2H
120
72

ANSYS B-3 Analysis Results (b3d2 Model)Axial Strain at Nozzle Section SA17-2A
--i.52Irn
20 40 60 80 100
Time (sec)
B-3 Test ResultsAxial Strain at Nozzle Section SA17-2A
120
7
1.50 -
1.00
0.50 i j 1- -
Adnr - -- -
oo Adsr I0.00s I
0 20 40 60 80 100 120
Time (sec)
Figure 5-19 B-3 Test Axial Strain at Nozzle Comparison - SA17-2A
73

ANSYS B-3 Analysis Results (b3d2 Model)Hoop Strain at Elbow A Flank
Jo_
0 20 40 60 80 100
Time (sec)
B-3 Test ResultsHoop Strain at Elbow A Section SAD-7H
120
-A
2Ioa
-0.5020 40 60 80 100
Time (sec)
120
Figure 5-20 B-3 Test Hoop Strain at Elbow A Flank Comparison - SAD-7H
74

ANSYS B-3 Analysis Results (b3d2 Model)Hoop Strain at Elbow A Flank Inside Surface
S
EI
0 20 40 60 80 100
Time (sec)
B-3 Test ResultsHoop Strain at Elbow A Section SAD-7H
120
-0.500 20 40 60 80 100
Time (sec)
120
Figure 5-21 B-3 Test Hoop Strain at Elbow A Flank Inside Surface Compared to Test Hoop Strain atOutside Surface - SAD-7H
75

6.0 CONCLUSIONS AND RECOMMENDATIONS
The NUPEC Ultimate Strength Piping Test Program has provided valuable new test data on high levelseismic elasto-plastic behavior and failure modes for typical nuclear power plant piping systems. TheNUPEC program was a comprehensive program which included basic piping material tests, pipingcomponent static and dynamic tests, simplified piping system seismic tests, and shaking table seismictests of a representative large-scale piping system to levels well above the typical design earthquake. Aselected number of component and piping system tests including the large-scale piping test were carriedout to failure. The test specimens were heavily instrumented to record displacements, accelerations andstrains versus time at critical locations. The component and piping system tests demonstrated the strainratcheting behavior that is expected to occur when a pressurized pipe is subjected to cyclic seismicloading. All pipe failures that were observed in this test program were characterized as through-wallcracks which occurred as a result of fatigue ratcheting. This report provides a summary of testsperformed under this program and selected test results which were used by BNL for comparison to post-test analysis.
The test data generated under this program augments the database of existing information on full-scalepiping system and component seismic tests performed in the U.S. Although the NUPEC program wasgeared toward demonstrating margins in Japanese piping design, there are a number of similarities inmaterials and design requirements that make the test results applicable to U.S. piping designs. Technicaljustification for recent changes in the ASME Code piping design rules relied primarily on data collectedunder the EPRI/NRC Piping and Fitting Dynamic Reliability Program. The NUPEC data may beevaluated in the same manner to provide additional technical justification from an independent testprogram. As reported in Section 3.0 of this report, BNL performed linear analyses and code evaluationsfor selected simplified piping system tests. Linear analysis methods were applied in accordance withcurrent and earlier ASME Code requirements. The results demonstrated that the highest level NUPECsimplified piping seismic tests subjected the piping components to stress levels above Code allowablesand illustrated the differences in minimum stress margins between recent revisions of the Code. Based onthe latest NRC endorsed ASME Code rules (1993) and Code Case N-41 I damping, the analyses showedminimum margins of 2.74 for elbows and 1.37 for nozzle welds. For the same test runs analyzed andevaluated according to the 2004 ASME Code rules, the analyses showed minimum margins of 1.84 forelbows and 1.76 for nozzle welds. Additional analyses and Code evaluations could be performed forother tests including the large-scale piping test to provide further substantiation of Code margins.
The NUPEC Ultimate Strength Piping Test Program also provided excellent test data for benchmarkinginelastic analysis methods and computer codes. The BNL post-test nonlinear analyses described inSections 4.0 and 5.0 of this report provided useful insights into the application of state-of-the-art elasto-plastic analysis methods for predicting the seismic response of a piping system.
The nonlinear analyses demonstrated that the use of classical linear kinematic hardening rules (whichhave been applied in NPP nonlinear analyses) may not be adequate for predicting the strain ratchetingbehavior in piping systems. The application of either bilinear or multilinear kinematic hardening rules inthe analysis of static elbow component cycling predicted high rates of initial strain ratcheting withshakedown occurring after only five to ten cycles. The tests demonstrated lower initial strain ratchetingeventually stabilizing to a constant rate of ratcheting without shakedown. The application of theChaboche nonlinear kinematic hardening model provided an improved strain ratcheting simulation. Theelbow cycling simulation analysis demonstrated that the Chaboche model more closely predicted theinitial ratcheting followed by a constant rate of ratcheting in subsequent cycles as observed in the test.For the A-2 simplified piping system test, the Chaboche model also provided the most accurate overallsimulation of strain ratcheting behavior. The accurate simulation of ratcheting is particularly importantfor Code evaluation of piping based on plastic or equivalent plastic analyses that rely on demonstration of
77

shakedown. For prediction of displacement response, the A-2 simplified piping system analyses showedthat the Chaboche model also provided the best simulation although the multilinear kinematic hardeningmodel also provided a reasonably good match. The application of the Chaboche nonlinear kinematichardening model to the simulation analyses of the other four simplified piping system tests demonstratedthat the displacement time history response was predicted with reasonably good accuracy. Accuratesimulation of strain and strain ratcheting was achieved in some but not all cases which indicates that eventhe Chaboche nonlinear model has limitations which need to be better understood. From a regulatorystandpoint, the reviewer must be aware of the limitations of commonly applied plasticity models. To gainfurther understanding of the model limitations, the NRC staff may consider additional studies toinvestigate the limitations of plasticity models on representative large-scale piping systems.
The difficulty in achieving precise test simulations during the preliminary A-2 simplified piping systemanalyses illustrated the importance of accurately modeling the piping system to predict correct systemdynamic characteristics (frequencies and mode shapes) in an elasto-plastic analysis. In a linear responsespectrum analysis of a piping system, modeling uncertainties such as dimensional variations in the systemmay be accounted for by peak broadening. This is important when the fundamental frequency of thesystem is on a steep slope of the response spectrum and a small shift in frequency can result in a largeincrease in response. In a nonlinear analysis, a small change in frequency of the model may have an evenmore significant impact on the response since it may lead to plastic strain ratcheting response versuselastic response. The application of 15% peak broadening may not provide sufficient safety marginswhen inelastic analysis is performed. Further studies to investigate the sensitivity of response due tomodeling uncertainties for large scale piping systems may provide additional insights.
78

7.0 REFERENCES
1. K. Suzuki, et al., Seismic Proving Test of Ultimate Piping Strength, ICONE-9, Paper No. 155,2001.
2. K. Suzuki, et al., Seismic Proving Test of Ultimate Piping Strength, ICONE-IO, Paper No. 22225,2002.
3. ANSYS, User's Manual, Release 5.6., ANSYS Inc., Canonsburg, PA 15317, U.S.A.
4. U.S. Nuclear Regulatory Commission, Standard Review Plan for the Review of Safety AnalysisReports, NUREG-0800, Sections 3.7.3 and 3.9.2, Revision 2, 1989.
5. Chaboche, J.L., Time Independent Constitutive Theories for Cyclic Plasticity, InternationalJournal ofPlasticity, Vol. 2, pp. 149-188, 1986.
6. Prager, W., A New Method of Analyzing Stresses and Strains in Work Hardening Plastic Solids,Journal of Applied Mechanics, Vol. 23, pp. 493-496, 1956.
7. Besseling, J.F., A Theory of Elastic, Plastic and Creep Deformations of an Initially IsotropicMaterial, Journal ofApplied Mechanics, Vol. 25, pp. 529-536, 1958.
8. Armstrong, P.J. and Frederick, C.O., A Mathematical Representation of the Multiaxial BauschingerEffect, CEGB Report No. RD/B/N 731, 1966.
9. Bari, S. and Hassan, T., Anatomy of Coupled Constitutive Models for Ratcheting Simulations,International Journal of Plasticity, Vol. 16, pp. 381-409, 2000.
79

NRC FORM 335 U.S. NUCLEAR REGULATORY COMMISSION 1. REPORT NUMBER(9.2004) (Assigned by NRC, Add Vol., Supp., Rev.,NRCMD 3.7 and Addendum Numbers, If any.)
BIBLIOGRAPHIC DATA SHEET NUREGICR-6889(See instructions on the reverse) BNL-NUREG-74978-2005
2. TITLE AND SUBTITLE 3. DATE REPORT PUBLISHED
Seismic Analysis of Simplified Piping Systems for the NUPEC Ultimate Strength Piping Test MONTH YEAR
Program December 2005
4. FIN OR GRANT NUMBER
N-60765. AUTHOR(S) 6. TYPE OF REPORT
DeGrassi, G., Hofmayer, C. Technical
7. PERIOD COVERED (Inclusive Dates)
0. PERFORMING ORGANIZATION - NAME AND ADDRESS (Il NRC, provide Division. Office orRegion. US NuclearRegulatory Commission, and mailing address; if contractor,provide name and mailing address )
Brookhaven National LaboratoryEnergy Sciences and Technology DepartmentUpton, NY 11973-5000
9. SPONSORING ORGANIZATION - NAME AND ADDRESS (IfNRC, type 'Same aJs above'; icontractor, provide NRC Division, Office or Region, U.S. Nuclear Regulatory Commission,and mailing address.)
Division of Engineering TechnologyU. S. Nuclear Regulatory CommissionWashington, D.C. 20555-0001
10. SUPPLEMENTARY NOTES
Sved A. Ali. Proaram Manaqer. . . . . . ..11. ABSTRACT (200 words or less)
The Nuclear Power Engineering Corporation (NUPEC) of Japan has conducted a multi-year test program for the Ministry ofEconomy, Trade and Industry (METI) of Japan to investigate the behavior of typical Nuclear Power Plant (NPP) piping systemsunder large seismic loads. The objectives of this program are to develop a better understanding of the elasto-plastic responseand ultimate strength of nuclear piping systems, to ascertain the seismic safety margins in current piping design codes, and toassess new code allowable stress rules. The test program consisted of a series of static and dynamic material tests, pipingcomponent tests, simplified piping system tests, and large scale piping tests. As part of collaborative efforts between the UnitedStates and Japan on seismic issues, the U.S. Nuclear Regulatory Commission (NRC) and the Brookhaven National Laboratory(BNL) participated in this program by performing both pre-test and post-test analysis for selected tests, and by evaluation ofprogram results. This report presents a summary of the NUPEC tests, describes the BNL post-test analyses of selectedsimplified piping system tests, and discusses the insights gained from this program.
12. KEY WORDS/DESCRIPTORS (List words or phrases that will assist researchers in locating the report.) 13. AVAILABILITY STATEMENT
Seismic Analysis, seismic testing, piping design, ASME code evaluation, fatigue ratcheting, plasticity, unlimitedkinematic hardening, fatigue failure. 14. SECURITY CLASSIFICATION
(This Page)
unclassified(This Report)
unclassified15. NUMBER OF PAGES
16. PRICE
NRC FORM 335 (9-2004) PRINTED ON RECYCLED PAPER

Printedon recycleds
paper
Federal Recycling Program

NUREG/CR-6889 SEISMIC ANALYSIS OF SIMPLIFIED PIPING SYSTEMS FOR THE NUPEC ULTIMATESTRENGTH PIPING TEST PROGRAM
DECEMBER 2005
UNITED STATESNUCLEAR REGULATORY COMMISSION
WASHINGTON, DC 20555-0001
OFFICIAL BUSINESS