nureg/cr-6831, examination of spent pwr fuel rods - nrc
TRANSCRIPT
NUREG/CR-683 1ANL-03/17
Examination of SpentPWR Fuel Rods after15 Years in Dry Storage
Argonne National Laboratory
U.S. Nuclear Regulatory CommissionOffice of Nuclear Regulatory ResearchWashington, DC 20555-0001

AVAILABILITY OF REFERENCE MATERIALSIN NRC PUBLICATIONS
NRC Reference Material
As of November 1999, you may electronically accessNUREG-series publications and other NRC records atNRC's Public Electronic Reading Room athtto:/lwww.nrc.aov/readinu-rrn.html. Publicly releasedrecords include, to name a few, NUREG-seriespublications; Federal Register notices; applicant,licensee, and vendor documents and correspondence;NRC correspondence and Internal memoranda;bulletins and information notices; inspection andinvestigative reports; licensee event reports; andCommission papers and their attachments.
NRC publications in the NUREG series, NRCregulations, and Title 10, Energy, In the Code ofFederal Regulations may also be purchased from oneof these two sources.1. The Superintendent of Documents
U.S. Government Printing OfficeMail Stop SSOPWashington, DC 20402-0001Internet bookstore.gpo.govTelephone: 202-512-1800Fax: 202-512-2250
2. The National Technical Information ServiceSpringfield, VA 22161 -0002www.ntis.gov1-800-553-6847 or, locally, 703-605-6000
A single copy of each NRC draft report for comment isavailable free, to the extent of supply, upon writtenrequest as follows:Address: Office of the Chief Information Officer,
Reproduction and DistributionServices Section
U.S. Nuclear Regulatory CommissionWashington, DC 2055540001
E-mail: [email protected]: 301-415-2289
Some publications In the NUREG series that areposted at NRC's Web site addresshttp://www.nrc.pov/readinp-rm/doc-collections/nurepsare updated periodically and may differ from the lastprinted version. Although references to material foundon a Web site bear the date the material was accessed.the material available on the date cited maysubsequently be removed from the site.
Non-NRC Reference Material
Documents available from public and special technicallibraries include all open literature items, such asbooks, journal articles, and transactions, FederalRegister notices, Federal and State legislation, andcongressional reports. Such documents as theses,dissertations, foreign reports and translations, andnon-NRC conference proceedings may be purchasedfrom their sponsoring organization.
Copies of Industry codes and standards used In asubstantive manner in the NRC regulatory process aremaintained at-
The NRC Technical LibraryTwo White Flint North11545 Rockvllle PikeRockville, MD 20852-2738
These standards are available in the library forreference use by the public. Codes and standards areusually copyrighted and may be purchased from theoriginating organization or, if they are AmericanNational Standards, from-
American National Standards Institute11 West 42 d StreetNew York, NY 10036-8002www.ansi.org212-642-4900
Legally binding regulatory requirements are statedonly in laws; NRC regulations; licenses, includingtechnical specifications; or orders, not inNUREG-series publications. The views expressedin contractor-prepared publications in this series arenot necessarily those of the NRC.
The NUREG series comprises (1) technical andadministrative reports and books prepared by thestaff (NUREG-XX)O() or agency contractors(NUREGICR-XXXX), (2) proceedings ofconferences (NUREG/CP-XXXX), (3) reportsresulting from international agreements(NUREGIIA-XXXX), (4) brochures(NUREGIBR-XXXX), and (5) compilations of legaldecisions and orders of the Commission and Atomicand Safety Ucensing Boards and of Directors!decisions under Section 2.206 of NRC's regulations(NUREG-0750).
DISCLAIMER: This report was prepared as an account of work sponsored by an agency of the U.S. Government.Neither the U.S. Government nor any agency thereof, nor any employee, makes any warranty, expressed orimplied, or assumes any legal liability or responsibility for any third party's use, or the results of such use, of anyInformation, apparatus, product, or process disclosed in this publication, or represents that its use by such thirdparty would not infringe privately owned rights.

NUREG/CR-6831ANL-03/17
Examination of SpentPWR Fuel Rods after15 Years in Dry Storage
Manuscript Completed: August 2003Date Published: September 2003
Prepared byRE. Einziger, H. Tsai, M.C. Billone, B.A. Hilton'
Argonne National Laboratory9700 South Cass AvenueArgonne, IL 60439
'Argonne National Laboratory-WestP.O. Box 2528Idaho Falls, ID 83403
S. Basu, NRC Project Manager
Prepared forDivision of Systems Analysis and Regulatory EffectivenessOffice of Nuclear Regulatory ResearchU.S. Nuclear Regulatory CommissionWashington, DC 20555-0001NRC Job Code Y6248

NUREG/CR-6831, has been reproducedfrom the best available copy.

EXAMINATION OF SPENT PWR FUEL RODS AFTER15 YEARS IN DRY STORAGE
R. E. Einziger, H. Tsai, M. C. Billone, and B. A. Hilton
ABSTRACT
For =15 years 15 x 15 PWR fuel(35.7 GWdIMTU) was stored in a dry inert-atmosphere Castor V/21 cask as peakcladding temperatures decreased from=350 to 1500C. Before storage, the loadedcask was subjected to extensive thermal-benchmark tests, during which time the peaktemperatures were >4000C. The cask wasopened to examine the fuel rods fordegradation and to determine if they weresuitable for extended storage. In the centralregion of the fuel column, the measuredhydrogen content of the cladding isconsistent with the thickness of the oxidelayer. At higher elevations, there is lesshydrogen than would be expected from the
oxide thickness. Migration of hydrogen tothe cooler ends of the rod probably occurredduring dry storage. The volume of hydridesvaries azimuthally around the cladding butall of the hydrides appear to have retained acircumferential orientation. Little or nocladding creep occurred during thermal-benchmark testing and dry storage. Post-storage creep testing indicated that thecladding retains significant creep ductilityafter dry-cask storage. It is anticipated thatthe creep would not increase appreciablyduring additional storage because of the lowtemperature after 15 years. Based on theSurry fuel rod data, no deleterious effects of15-years of dry cask storage were observed.
iii

CONTENTS
Abstract...................................................................................................................................... iii
Executive Summary ............................................................... ix
Foreword ................................................................................................................................ .. xi
Acknowledgments..................................................................................................................... xiii
Abbreviations............................................................................................................................ xv
1 Introduction and Objectives ........................................................... 1
2 Test Conditions and Materials .......................................................... 3
2.1 Storage Conditions ...................................................... 3
2.1.1 Performance Testing ................ ...................................... 3
2.1.2 Extended Dry Storage .................. .................................... 4
2.2 Fuel Description ...................................................... 5
2.3 Characterization of Surry Fuel Prior to Storage .......................................... 6
3 Poststorage Examinations ........................................................... 9
3.1 Fuel Rod Selection and Sampling Locations .................................................... 9
3.2 Profilometry ..................................................... 11
3.3 Fission Gas Analysis and Void Volume Determination .................... . 12
3.4 Metallography and Hydrogen Analysis ..................................................... 12
3.4.1 Fuel Pellet Condition ..................................................... 13
3.4.2 Oxide Layers and Fuel-Cladding Gap .................................................. 14
3.4.3 Hydrogen Content, Distribution, and Orientation ............................... 15
V

3.5 Microhardness M easu rem ents ...................................................... 18
3.6 Poststorage Thermal Creep Tests ..................................................... 18
3.6.1 Thermal Creep Apparatus ......................... ............................ 18
3.6.2 Thermal Creep Test Matrix and Summary of Results ............. ............. 19
3.6.3 Hoop Thermal Creep Strain vs. Time ................................................... 21
4 Implications for Extended Dry Storage ........................................ .................... 25
4.1 Assessment of Creep during Pre-storage Tests and Long-Term Storage ........ 25
4.1.1 Method 1: Baseline and Measurement Uncertainty .............................. 25
4.1.2 Method 2: Creep Code Calculatioms .................................................... 26
4.1.3 Method 3: Comparison with Prestorage Turkey Point Diameters ....... 27
4.1.4 Method 4: Comparison with Maximum Potential Creep-down ........... 28
4.2 Fuel Rod Stress ..................................................... 29
4.3 Hydride Redistribution and Reorientation ...................................................... 29
4.3.1 Comparison of Surry Hydride Distribution with Other Fuels ......... ..... 30
4.3.2 Reorientation ..................................................... 31
4.4 Cladding Annealing ..................................................... 31
4.5 Post-storage Residual Creep Strain and Strain Rate ......................................... 32
5 Conclusions and Recommendations ............................................................. 35
5.1 Conclusions ............................................................ 35
5.2 Recommendations ............................................................. 36
6 References ............................................................. 37
APPENDICES
A Fuel Rod Sectioning Diagrams ............... .............................................. A- 1
VA

B Profilometry ............................................................ B-1
B.1 Methodology ............................................................ B-3
B.2 Average Rod Diameter Profiles ........................... .................................. B-4
C Fuel Rod Gas Analysis Data ............................................................ C-1
C.1 Introduction ............................................................ C-3
C.2 Calibration and Testing Methodology ............................................................ C-5
D Metallographic Data ............................................................ D-1
E Baseline Comparative Data ............................................................ E-1
F Thermal Creep Test ............................................................ F-1
F.1 Test Apparatus ............................................................ F-4
F.2 Test Conduct ............. F-10
F.3 Surry Post-Storage Thermal Creep Tests . F-15
FIGURES
1. Estimated Temperature of Assembly T 1I during Extended Dry-storage Period ............ 5
2. Cutting Diagram for Metallographic, Microhardness, and HydrogenContent Characterization of Rod H9 from Surry-2 Assembly Ti 1 . ................................ 10
3. Averaged Outer-diameter Profile of Rod H9 (from Surry-2 Assembly TI 1) afterExtensive Thermal Benchmark Testing and =1 5 years of Dry-cask Storage in He ....... I 1
4. Cross-sectional Mosaic of Rod H9: (A) 1000 mm above Midplane, (B)Approximate Midplane .14
5. Cladding Outer-surface Oxide Layers of Rod H9 from Surry-2 AssemblyT 1 at: (A) Approximate Fuel Midplane, and (B) =I000 mm above Midplane .15
6. Hydride Structure in Fuel Rod Cladding of Assembly TI 1 at Two Elevations:(A) Midplane of Rod H9, (B) ;500 mm above Midplane of Rod H9, (C)Approximate Midplane of Rod G6, and (D) s500 mm above Midplane of Rod G6 17
7. Thermal Creep Data for Irradiated and Dry-cask-stored Surry Cladding Sample C9
Vii

I
Tested at 400'C and 190-MPa Hoop Stress for 1873 h, Followed by 693 hat 250 MPa ............................................................ 23
8. Thermal Creep Data for Irradiated and Dry-cask-stored Surry CladdingSample C8 Tested at 380'C and 220-MPa Engineering Hoop Stress for 2180 h ........... 23
9. Thermal Creep Data for Irradiated and Dry-cask-stored SurryCladding Sample C6 Tested at 380'C and 190-MPa Engineering HoopStress for 2348 h ............................................................ 24
10. Thermal Creep Data for Irradiated and Dry-cask-stored Surry CladdingSample C3 Tested at 360'C and 220-MPa Engineering Hoop Stress for 3305 h .......... 24
TABLES
1. Time/Temperature History of Assembly TI 1 from Castor-V/21 Cask ........................ 4
2. Sample Identification Matrix for Surry Rods after Extended Dry Storage .................. 10
3. Rod Volume, Internal Pressure (at 270C) and Fission Gas Release ............. ............... 13
4. Surry-2 Assembly T 1 Cladding Outer Oxide Layer Thickness (gm) at 0, 500,and 1000 mm above the Fuel Midplane .15
5. Hydrogen Content (wppm) at 0, 500, and 1000 mm above the Fuel Midplaneand Standard Deviation of Data for Surry Fuel Rod Cladding and Turkey Point3-Cycle Fuel .18
6. Thermal Creep Test Matrix and Predicted Creep Strains for Test Timesof Six, Nine and Twelve Calendar Months (Based on July 18, 2001Sponsor/Peer Review Meeting) ........................................................... 20
7. Surry Cladding Thermal Creep Test Matrix and Summary of Results ........................ 21
8. Variation of Averaged Rod Diameters from Assembly to Assembly and within anAssembly before Storage ............................................................ 25
9. Predicted Creep Strains after Various Test and Storage Periods ................ ................. 26
10. Global and Average Rod Diameters -- Uncorrected for oxide growth -- at2-3 m Elevation from Bottom of Rod .............................. ............................. 27
11. Summary of Storage Creep Estimates for Various Calculation Methods .................... 29
viii

EXECUTIVE SUMMARY
For =15 years Dominion Generation's SurryNuclear Station 15 x 15 Westinghousepressurized water reactor (PWR) fuel wasstored in a dry inert-atmosphere Castor V/21cask at the Idaho National Environmentaland Engineering Laboratory (INEEL) atpeak cladding temperatures that decreasedfrom =350 to 1500C. The U02 fuel pelletshad an initial enrichment of 3.11% and anominal density of 95% theoretical. Thecladding was cold-worked/stress-relievedZircaloy-4. The rods were fabricated withan internal He pressure of 2.86 MPa at=300 K. Assembly T11, chosen forexamination, was irradiated for three cyclesto achieve an average bumup of35.7 GWdIMTU and an assembly-averagedfast (E>1 MeV) neutron fluence that wascalculated to be 6.38 x 1025 n/m2. The fuelhad cooled =1300 days before it was loadedinto the cask. Before storage, the loadedcask was subjected to extensive thermal-benchmark tests, during which time the peaktemperatures were >400TC. The cask wasopened to examine the fuel rods fordegradation and to determine if they weresuitable for extended storage. No fuel rodbreaches and no visible degradation orcrudloxide spallation from the fuel rodsurface were observed.
Twelve rods were removed from the centerof the T1 l assembly and shipped fromINEEL to Argonne-West for profilometricscans. Four of these rods were punctured todetermine the fission gas release from thefuel matrix, internal pressure, and voidvolume in the rods. Three of the 4 rodswere cut into S segments each, and thenshipped to Argonne-East for detailedexamination. The results from theprofilometry (12 rods), gas releasemeasurements (4 rods), metallographicexaminations (5 samples from 2 rods),
microhardness (3 samples from 1 rod), andhydrogen content determination (3 samplesfrom 1 rod) are reported. Thermal creeptests on 4 samples from 2 rods have beencompleted. Creep strains and strain ratesgathered to date are presented as a functionof temperature, hoop stress, and time. Thedata indicate that the Surry cladding retainssignificant creep ductility after dry-caskstorage.
Although only limited prestoragecharacterization is available, severalconclusions can be drawn. Based on acomparison with characterization of FloridaPower Turkey Point rods with similarcharacteristics (dates of service, assemblytype, fuel manufacturer, approximateenrichment [2.56%], and burnup[=28 GWd/MTU]), it appears that little or nofission gas was released from the fuel pelletsduring either the thermal-benchmark tests orthe long-term storage. In the central regionof the fuel column, where the axialtemperature gradient in storage is small, themeasured hydrogen content of the claddingis consistent with the thickness of the oxidelayer. At -1 mi above the fuel midplane,where a steep temperature gradient existedin the cask (with the temperature decreasingto a much lower value at the top of the rod),less hydrogen is present than would beexpected from the oxide thickness thatdeveloped in-reactor. The volume ofhydrides varies azimuthally around thecladding, and, at some elevations, thehydrides appear to be segregated somewhatto the inner and outer cladding surfaces. Itis not possible, however, to determine if thissegregation occurred in-reactor, duringtransportation, during the thermal-benchmark tests, or during the dry-storageperiod. Migration of hydrogen to the coolerends of the rod during dry storage probably
LX

------------- L-
occurred and may signal a higher thanexpected concentration in those regions. It ismost significant that all of the hydridesappear to have retained the circumferentialorientation typical of prestorage PWR fuelrods.
The Surry cladding exhibits a residual creepstrain of >1% for thermal creep testtemperatures of 380*C (220 MPa) and 400*C(190 MPa). A residual creep strain of =6%was achieved in the 400(C sample afterraising the stress level to 250 MPa for=700 h. Although the creep rate increasedduring the 700 h because of wall thinning,the deformation was uniform around thecircumference of the cladding. Inasmuch asno symmetric or asymmetric bulging of thecladding was observed - a precursor tofailure - the residual creep life of the 400'Csample is >6%. Secondary creep rates thatspan two orders of magnitude were
measured for the five creep tests. Thesedata are useful not only for codebenchmarking, but also for determining thestress and temperature sensitivity of thecreep rate.
Because prestorage diameter measurementson the actual test rods are lacking, fourmethods of analysis were undertaken toestimate that little or no cladding creepoccurred during thermal-benchmark testingand dry storage. It is anticipated that thecreep would not increase significantlyduring additional storage because of the lowtemperature after 15 years, continualdecrease in temperature from the reductionin decay heat, and concurrent reductions inpressure and stress.
Based on the Surry data, no deleteriouseffects on fuel and cladding were observedafter 15-years of dry cask storage.
x

FOREWORD
The original license and the certificate of compliance (CoC) for spent nuclear fuel dry storage casks aredue to expire for many commercial nuclear power plants in the next few years. The Spent Fuel ProjectOffice (SFPO) of the United States Nuclear Regulatory Commission (NRC) is developing revisions tointerim staff guidance (ISGs) for review of technical documents to be submitted by licensees in supportof their applications for renewal of licenses and CoCs. The renewal of licenses and CoCs for the existingcasks would cover an additional period of 20 to 100 years and would require development of a technicalbasis for continued safe performance under the extended service conditions. Consistent with the aboveand the regulatory requirements of 10 CFR Part 72 for storage and handling of spent fuel, the acceptancecriteria for spent fuel in storage casks in ISG- 11 are being revised. Revision 2 of ISG- 11 recognizescreep to be the dominant mechanism for cladding deformation under normal conditions of storage andrecommends that the maximum cladding temperature during storage and for short-term vacuum dryingand cask backfilling operations be limited to 4000C to assure that the extended storage does not result ingross rupture of fuel cladding.
The NRC Office of Nuclear Regulatory Research (RES) at NRC initiated an experimental researchprogram in November 2000 to provide a technical basis for the aforementioned revision. Specifically,the program involved post-storage characterization and creep testing of representative pressurized waterreactor (PWR) fuel rods from the Surry nuclear power plant, stored for over 15 years in CASTOR drycasks. The results indicate that significant residual creep capacity remains in fuel cladding after the initialstorage period. With decreasing temperature and stress during the extended storage, the cladding is likelyto experience a small amount of additional creep and will likely not result in gross rupture in the event ofa cladding breach. Thus, the results support the recommendation of 4000C as the maximum allowablecladding temperature for extended storage, noting that it refers to the beginning of storage life. Therecommended temperature also limits the amount of hydride reorientation in the radial direction duringthe extended storage. Hydrides, which result from clad oxidation during in-reactor operation, contributeto a loss of clad ductility if oriented radially in large quantities in cladding. The Surry PWR cladding didnot exhibit any appreciable amount of radial reorientation.
The research results reported herein suggest the viability of spent fuel cladding to remain as a barrier tofission product release during extended storage up to 100 years in a dry cask environment. The resultsalso suggest the likelihood of spent fuel cladding to retain sufficient structural integrity after the extendedstorage period for safe transfer to a final repository. Finally, the results provide a sound technical basisfor granting an extension of cask licenses and CoCs, thereby reducing regulatory burden on licenseeswhile maintaining safety of spent fuel storage. Note the results are valid for spent fuel with a burnuplimit of 45 GWd/MTU. RES is currently conducting a similar experimental program for high burnupspent fuel cladding (burnup in excess of 45 GWd/MTU). The results from the high burnup program willbe reported separately in the future.
Farouk Eltawila, DirectorDivision of Systems Analysis and Regulatory Effectiveness
xi

ACKNOWLEDGEMENTS
The authors acknowledge the support of theU.S. Nuclear Regulatory Commission (R.Kenneally, S. Basu, H. Scott, K. Gruss, andC. Interrante), the Electric Power ResearchInstitute (J. Kessler, A. Machiels), the U.S.Department of Energy (J. Price), and of BSC(P. Pasupathi, D. Stahl and E. Siegmann).The staff of the Idaho NationalEnvironmental and Engineering Laboratory
(INEEL) test area north (TAN) facility isacknowledged for retrieving the fuel.Particularly valuable to the success of thisproject were the thermal-creep modelingpredictions provided by C. Beyer of thePacific Northwest National Laboratory(PNNL), P. Bouffioux (EdF), J. Rashid(ANATECH Corp.) and E. Siegmann(BSC).
xiii

ABBREVIATIONS
AGHCFANL-EANL-WASTMATM
Alpha Gamma Hot Cell FacilityArgonne National Laboratory, EastArgonne National Laboratory, WestAmerican Society for Testing and MaterialsApproved Test Material
Battelle Memorial InstituteBechtel SAIC Company
Calvert Cliffs
BMIBSC
CC
DOEDOE-RWDPH
ECPEdFEPRI
GASRGWd/MTU
U.S. Department of EnergyU.S. Department of Energy -Radioactive WasteDiamond Pyramid Hardness
Element Contact ProfilometerElectricite de FranceElectric Power Research Institute
Gas Assay Sample and RechargeGigawatt days per metric ton of Uranium
HFEF
INEEL
LWR
MPa
Hot Fuel Examination Facility
Idaho National Environmental and Engineering Laboratory
Light Water Reactor
Megapascal
NISTNRCNRC-NMSS
PBRPNNLpsiPWR
TANTP
YMP
National Institute of Standards and TechnologyU. S. Nuclear Regulatory CommissionU. S. Nuclear Regulatory Commission - Nuclear Materials Safety and Safeguards
Pilling-Bedworth RatioPacific Northwest National LaboratoryPounds per square inch (a = absolute, g = gauge)Pressurized Water Reactor
Test Area NorthTurkey Point
Yucca Mountain Project
xv
1 INTRODUCTION AND OBJECTIVES
Some of the original licenses issued by theU.S. Nuclear Regulatory Commission(NRC) for 20 years of dry storage of lightwater reactor (LWR) fuel are coming up forrenewal soon. Because the opening of adeep geological repository may be delayed,consideration is being given to interim drystorage of perhaps up to 100 years.Material-related issues exist with respect tothe potential long-term behavior of the dry-cask storage system (cask, basket, seals,fuel, etc.). The principal fuel issues arewhether spent-fuel cladding remains a viablebarrier to fission product release and, if not,to what extent the fuel itself may provide adegree of fission product retention in thecask storage environment. A corollary issueis whether the fuel rods will retain sufficientintegrity after 20+ years of dry storage to besafely transferred to a final repository.
An Electric Power Research Institute (EPRI)report, "Data Needs for Long-Term DryStorage of LWR Fuel" (Ref. 1), identifiedseveral specific questions about fuel rodbehavior. These include:
1. Has there been a change in themechanical properties, especially theductility, of the cladding?
2. What is the extent of cladding creepunder storage conditions?
3. Has detrimental hydrogen pickup orhydride reorientation occurred in thecladding?
4. How much cladding annealing hasoccurred?
5. Has gas release from the fuel to theplenum been enhanced?
6. Has release of volatile fission productsbeen enhanced?
Questions 1-4 are germane to maintainingcladding integrity during storage,subsequent handling during transfers, andoff-normal events that may occur in thelifetime of the cask. Questions 5 and 6 aregermane to environmental effects within thecask and the impacts these effects will haveon subsequent safe handling. Themechanical properties of the cladding aremost relevant in addressing the issue ofintegrity. Environmental effects will bemore relevant and important if themechanical properties have degradedsignificantly or if degradation phenomenahave been enhanced because of theenvironment.
In the mid-1980s, the U.S. Department ofEnergy (DOE) procured a Castor V/21 dry-storage cask for testing at the Idaho NationalEnvironmental and Engineering Laboratory(INEEL). The primary purpose of thetesting was to benchmark modeling codes bymeasuring the thermal and radiologicalcharacteristics of the cask; it was notintended to examine fundamental fuelbehavior. Therefore, prior to the tests, thefuel had undergone only minimalcharacterization: visual examination of theoutside of the assemblies and ultrasonicexamination to ensure that no breached rodswould be included. The cask was loadedwith as-irradiated assemblies from the SurryNuclear Station and then tested in a series ofconfigurations under various cover gases.During the tests, the temperature withinseveral fuel assemblies was monitored with
1
I------------ J_
a thermocouple probe inserted into a guidetube, and the cover gas was periodicallyanalyzed to determine if any rod leaks haddeveloped. No leaks were found. Thedetails of these tests have been reported inseveral documents (Refs. 2-4). The caskremained on the storage pad at INEEL for15 years, with the fuel in an essentially
inert atmosphere (He/<1% air).
In an effort to determine if any degradationhad occurred during the storage period, theNRC, EPRI, and DOE jointly funded aproject to open the Castor cask, visuallyinspect the fuel and cask internals, andconduct both nondestructive and destructiveexaminations of the fuel rods that hadundergone prototypical long-term storage(Ref. 5).
In-cask observations of the fuel consisted ofvisual examinations and crud evaluation.The fuel rods appeared to be unchanged bythe long storage duration and the precedingthermal-benchmark testing. No evidence ofappreciable cladding creep or rod bow wasobserved. Some crud/oxide was stilladhering to the rods; no crud appeared tohave fallen into either the spacers or caskbottom. No deleterious behavior (e.g., rodbulging or cracking) was observed thatwould indicate that continued long-termstorage would not be safe (Ref. 6)
Any changes in fuel rod characteristics afterirradiation, such as cladding creep, hydrideprecipitation, oxide growth, and fission gasrelease, would be a result of integrated time-at-temperature-dependent kinetic processesthat occur during the rod's residence in thestorage cask as well as during prior handing(cask loading, drying, transportation, etc.).Based on temperature alone, the centerassembly in the Castor cask would be thechoice for further examination. Thisassembly has an average burnup of31.5 GWd/MTU and experienced a peaktemperature during thermal-benchmarktesting of 4250C, whereas the burnup in theTi1 assembly in the adjacent location washigher (35.7 GWdIM1'U). Based on themeasurements made in the He atmosphereand the vertical orientation of the caskduring the performance-testing phase, thedifference in temperature between thepositions was only 100C. Therefore thehigher burnup assembly Ti 1 was chosen forfurther examination.
Twelve rods, selected on the basis of theirease of removal, were extracted for furthercharacterization and testing. This reportdescribes the results of the fuel and claddingcharacterization, as well as the implicationsof these results for long-term (i.e., beyond20 years) dry-cask storage. Supportingdocumentation on methods and resultsappears in Appendices A-F.
2

2 TEST CONDITIONS AND MATERIALS
2.1 Storage Conditions
The behavior of the spent fuel is governedby its time at temperature and the storageatmosphere. The Surry rods underwent twotypes of storage, which contributed to theoverall fuel and cladding condition. Therods were initially part of a thermal-performance-testing program, during whichthey were stored for short periods of timeunder various atmospheres (He, N2, andvacuum) in horizontal and verticalorientations. Each combination produced adifferent maximum temperature andtemperature profile. After this testing, therods were stored vertically in the CastorV/21 cask, outdoors, on a concrete pad for14.2 years, in a He atmosphere with<1% air, under conditions of decreasingtemperature due to decreasing decay heat.After the cask was initially opened, the fuelrods spent another six months in the cask inan air atmosphere.
2.1.1 Performance Testing
The Castor cask was monitored withthermocouple probes during the thermal-benchmarking testing phase to determine thetemperature profiles as a function of axialelevation and radial position within the cask.In an upright orientation, the hottest fueloccurred in the center five assemblies(Ref. 2). In addition, there was a thermalgradient along the fuel rods. The hottest
elevation was typically near the caskmidplane. The temperature dropped offsignificantly toward the top and bottom ofthe cask (Ref. 4).
Before complete loading, the fuel rods spent-200 h in air at a significantly reducedtemperature. During the cask performancetests (Refs. 2-4), the fuel rods were in He,N2 and vacuum atmospheres in bothhorizontal and vertical configurations. Thepeak cladding temperature, adjusted for theposition of Assembly Ti 1 in the cask, variedin each configuration (Ref. 3), as indicatedin Table 1. At the completion of the caskperformance tests, the fuel spent -2880 hvertically in a 70%-HeI30%-air atmosphere(Ref. 3). The temperature was not measuredduring this time but is assumed to be theweighted average of the temperaturesmaintained in the vertical orientation withthe partial He and N2 atmospheres duringthe performance-testing runs. Followingthermal-performance testing, the cask wasfilled with a He/<1% air atmosphere.
Cover gas samples were taken periodicallythroughout the performance-testing periodand storage duration to look for cask leaksand fuel rod breaches (Ref. 3). In all cases,the intended atmospheres were maintained(Table 1). The moisture level in the caskwas <0.03 vol. % in all cases.
3

Table 1. Time/Temperature History of Assembly T 1I from Castor-V/21 Cask (Ref. 3)
Configuration Cover Gas Peak Cladding T, C | Duration, hVertical Air Reduced T 200Vertical He 344 119Vertical N2 359 43Vertical Vacuum 415 72
Horizontal He 357 93Horizontal N2 398 72
Vertical 70% He/30% Air 348 2880Vertical Het<I% Air' 344 - 155 1.3 x I
'After the cask was initially opened at 14.2 years, the fuel was left in the cask forthe last 6 months in a hot cell air atmosphere.
2.1.2 Extended Dry Storage
During storage, temperature decreases wereconsistent with the reduction in decay heat.Because the time between the end of theperformance testing and the start of theextended dry storage was short, the initialtemperature for the extended storage shouldbe nearly the same as that measured duringthe performance testing in the sameconfiguration, with the same cover gas (He),i.e., =344WC. (If one compares the measuredtemperatures in the vertical configurationwith He and N2 and makes a linearinterpolation, one can see that the <1% air inthe cask-storage atmosphere has aninsignificant effect on the thermalconductivity of the gas mixture and, hence,on the temperature.) Temperature was notmeasured during the extended storage.However, when the cask was opened after=14.2 years, with the lid off and the caskcontaining air from the hot cell, athermocouple probe inserted into theassembly a few feet down to the hot spotmeasured a temperature of 1550C (Ref. 6).In all likelihood, this temperature was belowthe temperature expected in the closed cask.The HYDRA thermal-hydraulic code, whichwas verified during the performance-testing
period, is no longer readily available tocalculate better time/temperature profilesafter storage. The use of other verifiedcodes such as COBRA-SFS would requireadditional work outside the scope of thisstudy.
Two methods were used to develop atemperature profile, which could be used tocalculate creep deformation for the storageperiod. In the first method, the profile waspinned at 3440C at the start of extendedstorage and 1550C at 14.8 years, when somefuel rods were removed from the cask. Theambient temperature, which was set at 380Cto represent the summer hot month in IdahoFalls, was expected to occur by 100 years.The actual temperature at 14.8 years wasprobably higher because the temperaturewas measured with the cask open and thefuel subjected to additional conductive andconvective cooling. Hence, the actualtemperature profile is probably higher, andthis approximation represents a lowertemperature bound. The followingtemperature profile was obtained:
T (t) = 308 exp (-0.064 t) + 309, (1)
where T is in K and t is in years.
4
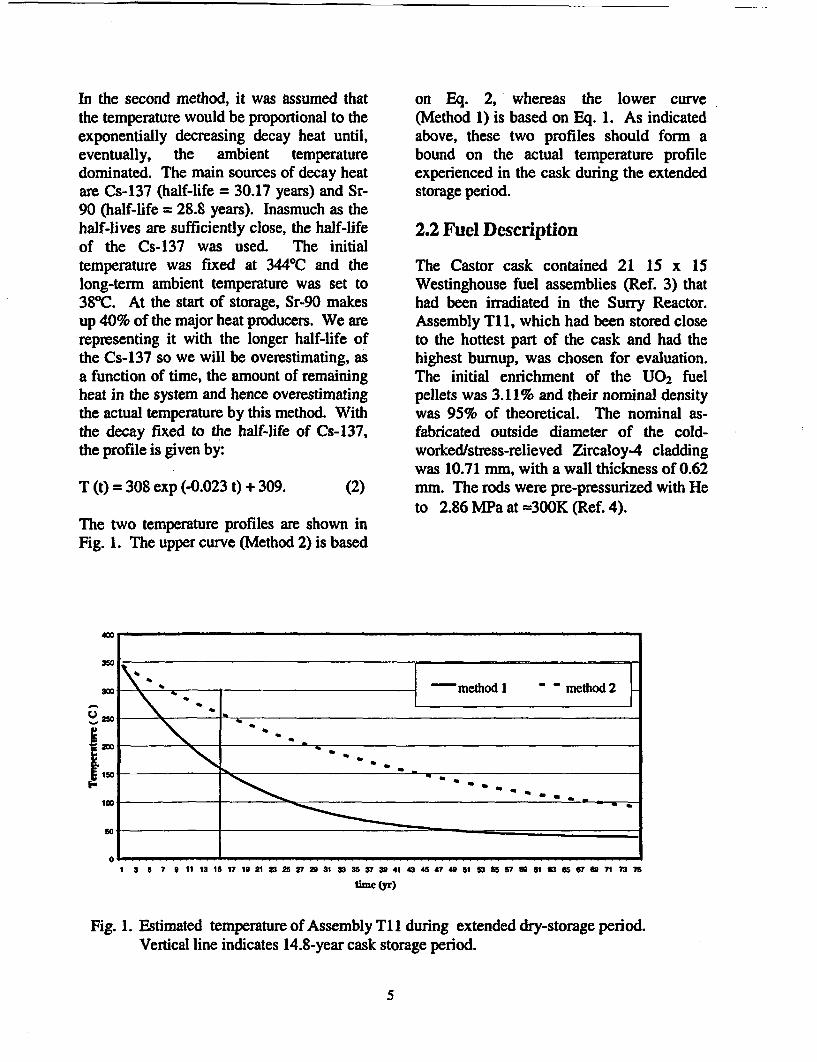
In the second method, it was assumed thatthe temperature would be proportional to theexponentially decreasing decay heat until,eventually, the ambient temperaturedominated. The main sources of decay heatare Cs-137 (half-life = 30.17 years) and Sr-90 (half-life = 28.8 years). Inasmuch as thehalf-lives are sufficiently close, the half-lifeof the Cs-137 was used. The initialtemperature was fixed at 3440C and thelong-term ambient temperature was set to38'C. At the start of storage, Sr-90 makesup 40% of the major heat producers. We arerepresenting it with the longer half-life ofthe Cs-137 so we will be overestimating, asa function of time, the amount of remainingheat in the system and hence overestimatingthe actual temperature by this method. Withthe decay fixed to the half-life of Cs-137,the profile is given by:
on Eq. 2, whereas the lower curve(Method 1) is based on Eq. 1. As indicatedabove, these two profiles should form abound on the actual temperature profileexperienced in the cask during the extendedstorage period.
2.2 Fuel Description
The Castor cask contained 21 15 x 15Westinghouse fuel assemblies (Ref. 3) thathad been irradiated in the Surry Reactor.Assembly Ti 1, which had been stored closeto the hottest part of the cask and had thehighest burnup, was chosen for evaluation.The initial enrichment of the U02 fuelpellets was 3.11% and their nominal densitywas 95% of theoretical. The nominal as-fabricated outside diameter of the cold-worked/stress-relieved Zircaloy-4 claddingwas 10.71 mm, with a wall thickness of 0.62mm. The rods were pre-pressurized with Heto 2.86 MPa at =300K (Ref. 4).
T (t) = 308 exp (-0.023 t) + 309. (2)
The two temperature profiles are shown inFig. 1. The upper curve (Method 2) is based
1 3 5 7 9 II 13 15 17 19 21 23 25 27 2 31 33 35 37 39 41 43 45 47 49 51 53 55 57 59 51 133 67 s69 71 73 75
tim (yr)
Fig. 1. Estimated temperature of Assembly Ti1 during extended dry-storage period.Vertical line indicates 14.8-year cask storage period.
5
i
The assembly was irradiated for three cyclesand achieved an assembly-average burnupof 35.7 GWdIMTU. The assembly-averagedfast neutron fluence (E>1 MeV) wascalculated to be 6.38 x 10e n/r 2 (Ref. 7).(Note: the fast fluence within the axial testsection regions is -8% higher.) Theassembly, discharged in November 1981,was in wet storage until it was transported toINEEL and loaded into the Castor cask inJuly 1985, with a decay heat of 1.1 kW.Because rod-to-rod temperature profileswere not available, the center 12 rods in theassembly were assumed to be the hottestrods and were chosen for examinationbecause of their ease of extraction from theassembly.
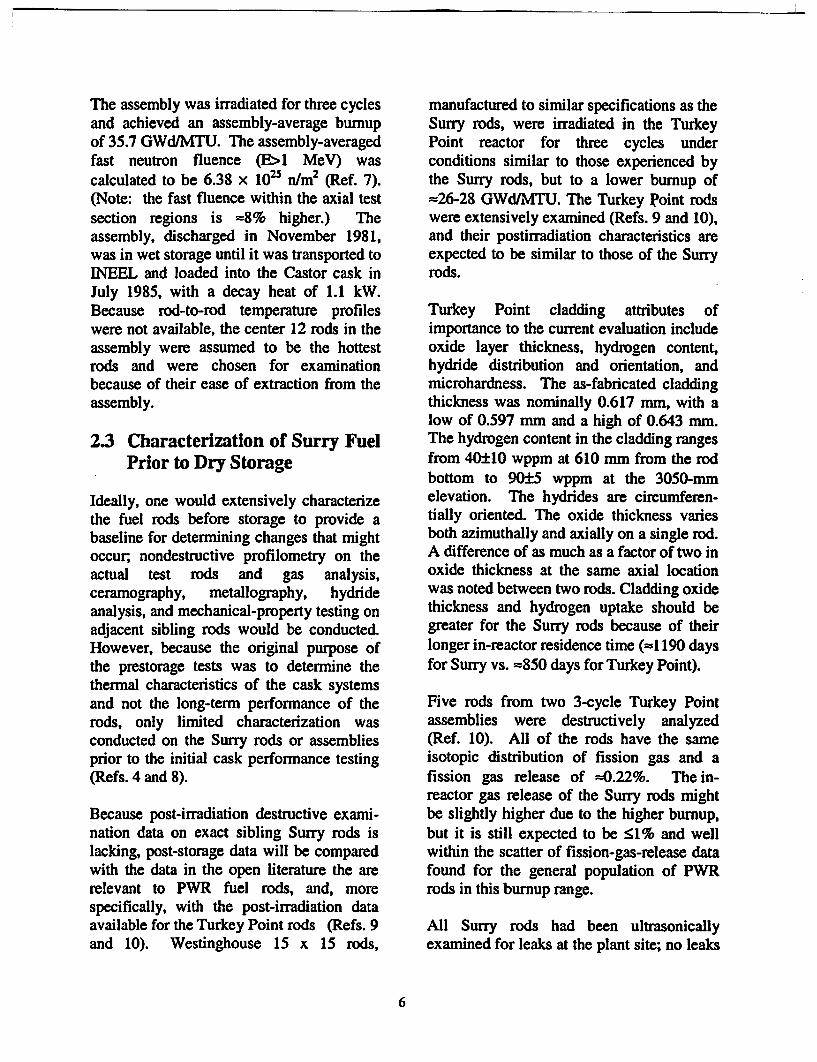
2.3 Characterization of Surry FuelPrior to Dry Storage
Ideally, one would extensively characterizethe fuel rods before storage to provide abaseline for determining changes that mightoccur, nondestructive profilometry on theactual test rods and gas analysis,ceramography, metallography, hydrideanalysis, and mechanical-property testing onadjacent sibling rods would be conducted.However, because the original purpose ofthe prestorage tests was to determine thethermal characteristics of the cask systemsand not the long-term performance of therods, only limited characterization wasconducted on the Surry rods or assembliesprior to the initial cask performance testing(Refs. 4 and 8).
Because post-irradiation destructive exami-nation data on exact sibling Surry rods islacking, post-storage data will be comparedwith the data in the open literature the arerelevant to PWR fuel rods, and, morespecifically, with the post-irradiation dataavailable for the Turkey Point rods (Refs. 9and 10). Westinghouse 15 x 15 rods,
manufactured to similar specifications as theSurry rods, were irradiated in the TurkeyPoint reactor for three cycles underconditions similar to those experienced bythe Surry rods, but to a lower burnup of-26-28 GWdIMTU. The Turkey Point rodswere extensively examined (Refs. 9 and 10),and their postirradiation characteristics areexpected to be similar to those of the Surryrods.
Turkey Point cladding attributes ofimportance to the current evaluation includeoxide layer thickness, hydrogen content,hydride distribution and orientation, andmicrohardness. The as-fabricated claddingthickness was nominally 0.617 mm, with alow of 0.597 mm and a high of 0.643 mm.The hydrogen content in the cladding rangesfrom 40±10 wppm at 610 mm from the rodbottom to 90±5 wppm at the 3050-mmelevation. The hydrides are circumferen-tially oriented. The oxide thickness variesboth azimuthally and axially on a single rod.A difference of as much as a factor of two inoxide thickness at the same axial locationwas noted between two rods. Cladding oxidethickness and hydrogen uptake should begreater for the Surry rods because of theirlonger in-reactor residence time (-1 190 daysfor Surry vs. -850 days for Turkey Point).
Five rods from two 3-cycle Turkey Pointassemblies were destructively analyzed(Ref. 10). All of the rods have the sameisotopic distribution of fission gas and afission gas release of -0.22%. The in-reactor gas release of the Surry rods mightbe slightly higher due to the higher burnup,but it is still expected to be <1% and wellwithin the scatter of fission-gas-release datafound for the general population of PWRrods in this burnup range.
All Surry rods had been ultrasonicallyexamined for leaks at the plant site; no leaks
6

were found. Full-length black-and-whitevideos of Assembly Ti1 and seven otherassemblies, and color still pictures of all foursides of two assemblies (V05 and V27),were taken at INEEL. The videos providedlittle information about the condition of therods. The photos showed an orange/reddishcrud, thought to be Fe20 3, on Assembly V05(Ref. 4). This is somewhat unusual becausetypical crud on PWR rods is a gray Fe304magnetite. Videos and color stills of thesame assemblies were taken after the Castor-V/21 performance tests, just before thecommencement of long-term storage.
Under a rod consolidation project alsoconducted at INEEL, linear profilometry at900 orientations was performed on selectedrods from 36 similar Surry assemblies. Themaximum, minimum, and average diametersalong the two orientations for each of the 36assemblies have been reported (Ref. 8). Thedifference between the maximum andminimum rod outer diameter for any oneSurry assembly ranged between 0.03 and0.06 mm (0.3 and 0.6% of the as-fabricatedrod diameter). The average rod diameter forthe set of assemblies varied by as much as0.06 mm or 0.6%.
7
3 POSTSTORAGE EXAMINATIONS
3.1 Fuel Rod SelectionSampling Locations
and
Twelve Surry rods taken from the CastorV/21 cask were transferred from the INEELTest Area North (TAN) facility to theArgonne National Laboratory-West(ANL-W) Hot Fuel Examination Facility(HFEF), where profilometry was performedto help determine if any creep had occurredduring dry storage. All 12 rods exhibitedsimilar cladding diameter profiles(uncorrected for in-reactor oxide growth).Four rods with marginally higher diameterswere chosen for fission gas release, internalpressure, and void volume determinations.These data are needed to determine thecladding stress, which is the driving forcefor creep. Choosing the rods with thelargest diameters was intended to lead to theselection of those rods that might haveexperienced some thermal creep duringpostirradiation performance testing and drystorage. In reality, the differences found inthe profilometry proved to be insignificantrelative to experimental uncertainty. Thus,the selection of Rods H9, G6, H7, and G9for gas analysis was somewhat arbitrary.Similarly, the internal gas pressures for thefour rods were too close to allowdiscrimination in choosing three of the fourrods for detailed characterization.
The three rods with the highest measuredinternal pressure, H9, G6, and H7, weresectioned into five segments (=0.84 m each)per rod for transport to the Alpha GammaHot Cell Facility (AGHCF) at ArgonneNational Laboratory-East (ANLE).Starting from the bottom of the rod, the firstfour segments (identified as E, D, C, and Bby ANL-E) are each =840 mm long and the
fifth segment (identified as A), whichcontains the plenum region, is =530-mmlong. Paint marks were placed by ANL-Wnear the top of each segment to uniquelydefine its orientation. The segments wereplaced by ANL-W in shipping tubessupplied by ANL-E. These tubes wereengraved with the following information:Surry, rod number, and A/G Number (AlphaGamma Hot Cell number used to trackspecimens). Detailed instructions forsegmentation, labeling and shipment wereprovided in hot cell instructions IPS-368-00-00 (H. C. Tsai, November 27, 2000). Thus,the tubes for rods H9 and G6 are labeled(591-A, 591-B, 591-C, 591-D and 591-E),and (592-A, 592-B, 592-C, 592-D, and 592-E), respectively.
The rod segments from two of the three rodswith the largest diameters and highest gaspressures, H9 and G6, were sectioned toobtain specimens for creep testing, hydrogendetermination, and metallographic exami-nation for oxide thickness, claddingthickness, hardness, and hydride analysis.A few sections were also prepared fortensile testing. Limited ceramographicexamination of the fuel was conductedbecause the rods were not breached and nochange in the structure of the irradiated fuelwas expected at the storage temperatures.When selecting specific locations forsamples, we considered uniformity ofburnup and fast fluence, proximity to theaxial regions from which the creep sampleswere to be prepared, significant outer-surface oxidation, and the highesttemperatures experienced during thermal-performance testing and storage. The sampleidentification matrix is given in the Table 2.
9

Table 2. Sample Identification Matrix for Surry Rods after Extended Dry Storage
Test Type Number Rod H9 Rod G6of Rods
Oa 50)a 10002 Oa 500aProfilometry 12Gas analysis 4
Ceramography - 591C- 591C-C12 591B-B2 592C-C4 592C-C12C4
Oxide thickness - 591C- 591C-C12 591B-B2 592C-C4 592C-C12C4
Hydride - 591C- 591C-C12 591B-B2 592C-C4 592C-C12orientation - C4
Hydrogen content - 591C- 591C-C13 591B-B33__ __ __ _ ___ CS _
Microhardness 591C- 591C-C12 591B-B21-Si___ _ _ IC4 I I
'Nominal distance (mm) of metallographic samples above fuel midplane.
The fuel midplane is at 1847 mm from thebottom of the rod. Sample C4 is atz5-18 mm above the fuel midplane andSample C5 is at =19-32 mm above the fuelmidplane. Samples C12 and C13 are=530-543 mm and -544-557 mm,
respectively, above the fuel midplane. Thecutting diagram for Rod H9 segment 591Cis shown in Figure. 2. Cutting diagrams forRod Segments 591B and 592C are shown inAppendix A.
Sectioning Diagran for the Mid-Segmient of Surry Rod H9 (A/G591DH. C. Tsai, IPS-373-00-00, 3/20/01
Fig. 2. Cutting diagram for metallographic, microhardness, and hydrogen analysischaracterization of Rod H9 from Surry-2 Assembly Ti . Samples C4 (metallographyand microhardness) and C5 (hydrogen analysis) are at approximately the fuel midplane.Samples C12 (metallography and microhardness) and C13 (hydrogen analysis) are=500 mm above the fuel midplane
10

3.2 Profilometry
Linear profilometry traces of each rod wereobtained at 0, 45, 90, and 1350 relativeorientations at =2.5-mm intervals along thelength, starting at -330 mm from the top ofthe rod. The cladding diameter wasmeasured to an accuracy of 2.5 x 10⁻³ mm.Averaging the four linear traces generatedthe cladding outer-diameter profile for RodH9 (Fig. 3). Although not apparent in theindividual traces, the averaged profilereveals discernible, albeit small, dipsassociated with the grid spacers of theassembly. Similar profiles were obtainedfor all 12 rods (see Appendix B). Theaverage decrease in cladding diameter of the12 rods 1 m from the bottom of the rod is=0.06±0.01 mm relative to the nominal as-fabricated diameter of 10.71 mm. Thiscreepdown (=0.6%) is typical for PWR rods
E
, 10.70
E
l0.65 A A
> 10.00 80D 1000 15
with the Surry fuel cladding gap and aburnup of =36 GWd/MTU (Ref. 9).
Some of the profiles show an increase indiameter along the upper half of the rodrelative to the lower half of the rod. Basedon creepdown alone, one would expect theprofile of the rod in an as-irradiated state tobe reasonably flat in the middle 2.5 m of thefuel column, where the fast fluence isrelatively uniform. The diameter increase inthe upper half of the rods, measured afterstorage, is probably due to the increase inoxide layer thickness with axial location.
When the cladding oxidizes in the reactor,the thickness of the oxide formed is greaterthan the metal layer that is oxidized. Tocompare the as-measured postirradiationdiameter profile with a preirradiation profileor to compare the diametral growth
00 20M 2a 3000 3500 4000
Location (mm, from rod bottom)
Fig. 3. Averaged outer-diameter profile of Rod H9 (from Surry-2 Assembly TI 1)after extensive thermal benchmark testing (=350- 415'C) and =15 years ofdry cask storage in He (=344 -< =1550 C). The nominal as-fabricatedcladding outer diameter is 10.71 mm.
from various locations on the same rodwhere differing rates of oxidation may haveoccurred, the as-measured postirradiation
diameter profile must be corrected for oxidegrowth. The oxide layer thickness is dividedby the Pilling-Bedworth ratio (PBR) to
11

L
determine the effective thickness of Zircaloythat had oxidized. For this cladding, a PBRof 1.75 (Ref. 11), which accounts for the=10% porosity in the oxide layer, was used.The measured outer diameter of the claddingis then corrected by subtracting twice thedifference between the oxide and metalthickness. The oxide thickness wasmeasured at selected locations on the upperhalf of Rods H9 and G6. When thecorrection for the oxide layer was made, arelatively uniform creepdown of 0.6% wasobtained for the middle 2.5 m of the fuelcolumn.
3.3 Fission Gas Analysis and VoidVolume Determination
swelling. The relative measurement errorsof the void volumes and of the gas pressuresare <3%. The internal gas composition inall four rods is essentially the same: 96-98%He fill gas with small amounts of 02(<0.01%) and N2 (<0.03%). The poststorageisotopic composition of Xe and Kr are,within experimental error, the same as thepostirradiation ratios for the Turkey Pointfuel rods. The fission gas release valuesranged from 0.4 to 1.1%, which is largerthan the postirradiation fission gas releasemeasured (0.22%) for the lower-burnupTurkey Point rods, but well within the rangereported in the literature for rods of this typeand burnup. Complete isotopic andchemical composition of the internal rodgases are given in Appendix C.
Cladding creep during storage is driven bythe stress induced by the rod internal gaspressure. This pressure is due primarily tothe initial He fill gas and, to a lesser extent,the fission gas released from the fuel into therod void volume. The void volume, gascomposition and inventory, and fission gasisotopic composition were measured on fourof the rods to determine internal rodpressure and to estimate the extent ofmaximum possible fission gas release duringthe storage period.
The measured internal gas pressures rangedfrom 3.43 to 3.61 MPa at 270C, which is-0.7 MPa higher than the initialpreirradiation gas pressure (see Table 3).The void volumes ranged from 19.53 to20.39 x 10' m3 , which is typical forWestinghouse 15 x 15 rods. The decrease invoid volume with burnup is caused by acombination of cladding creepdown and fuel
3.4 Metallography andAnalysis
Hydrogen
The procedures for sample cutting,preparation, and examination for bothmetallography and hydrogen analysis aredocumented in the AGHCF OperationsManual (AGHCF-PROG-204, 205, 206, and207, August 2001). Etching of the sample isused to bring out certain features, such ashydrides in the cladding. For hydrides, anacid etch (45 ml H20 2 + 45 ml HN03 +10 ml HF) is applied for 3 s. For the Surrycladding, the samples were re-etched for anadditional 3 s, and no change in the hydrideimaging was observed. Generally, a 50-75X photomosaic is prepared for the fuelrod cross-section observed on the Leitz-MM5RT Metallograph. Higher magnifica-tions are used to image the cladding oxidethickness and the hydride morphology.
12

Table 3. Rod Volume, Internal Pressure (at 270C) and Fission Gas Release
Rod Void Internal Gas Fission Gas Fission Gas Fission GasVolume, Pressure, Release, Contribution to Partial
ml xlO0 MPa % Void Pressure, Pressure,% MPa
T11-H9 19.76 3.61 1.08 3.61 0.129T1 I-G6 19.53 3.51 0.39 1.36 0.047T11-H7 20.29 3.43 0.88 3.01 0.102T11-G9 20.02 3.44 0.49 1.65 0.056Turkey 22 1 3.5 ± 0.1 0.22 ± 0.01 0.50 0.017Point
Generally, oxide thickness photo-micrographs are taken at eight evenly spacedlocations around the cladding, covering atotal of =45% of the cladding circumference.A similar procedure is used for the hydridemorphology photomicrographs. Themagnification of the metallograph iscalibrated semiannually and/or aftermaintenance. A traceable 25-mm stagemicrometer standard (KR-812) is used. Thecalibration is needed to put the correct scalemarkers on the photomicrographs.
For the cladding hydrogen analysis, the fuelis removed chemically through the use of anitric acid bath. Depending on theanticipated hydrogen content, the cladding issubdivided by transverse and radial cuts sothat each sample is small enough to precludedetector overload. Eight such measurementsof the hydrogen content are performed withthe Leco Model RH-404 hydrogendeterminator. These measurements are thenaveraged to obtain the hydrogen content ofthe sample (e.g., C5) in wppm. Thedeterminator is calibrated before each set ofmeasurements. A titanium standard isprovided by the manufacturer forcalibration. The procedure for measuringthe hydrogen content of Zircaloy cladding isbased on the manufacturer's instruction
manual and specific methods recommendedfor refractory metals (ASTM E-1447,Standard Test Method for Determination ofHydrogen in Titanium and Titanium Alloysby the Inert Gas Fusion ThermalConductivity Method).
3A.1 Fuel Pellet Condition
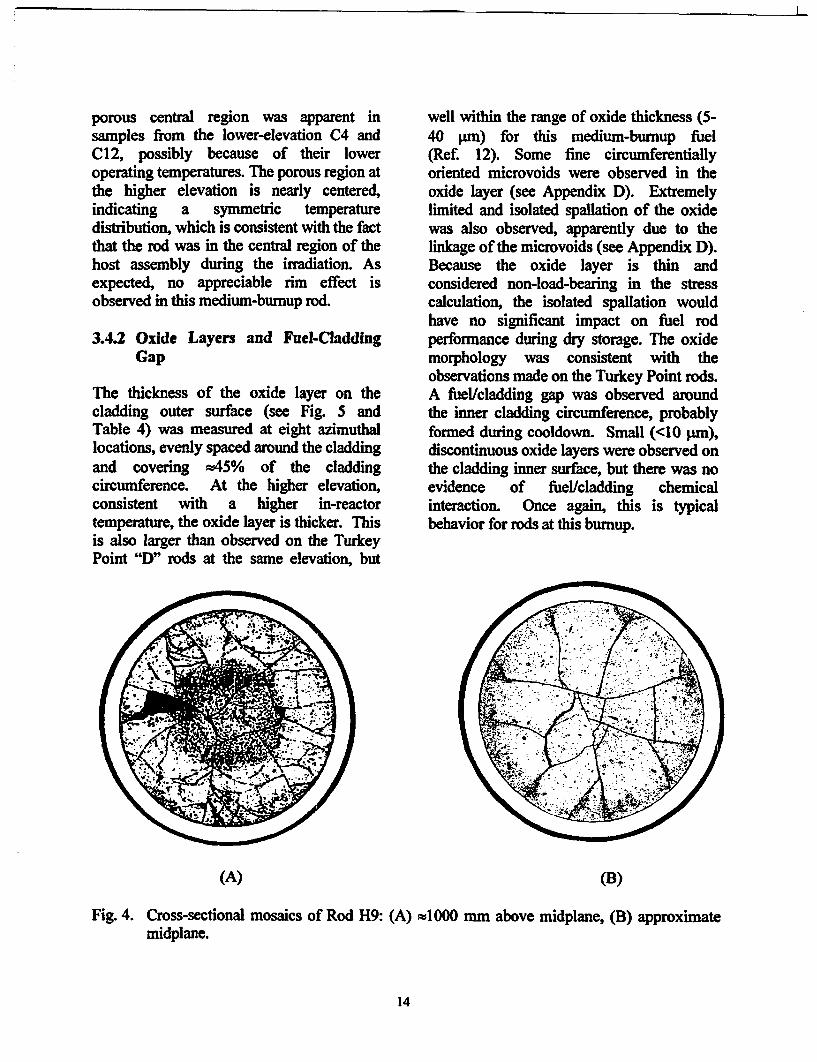
Changes in the condition of the fuel pelletswere not expected because there was nocladding breach, and the temperature of thefuel during storage was lower than thetemperature of the fuel during reactoroperation. Transverse ceramographicsamples were taken from Rod H9 at the rodmidplane, =500 mm above the midplane,and =1000 mm above the midplane.Samples were taken from Rod G6 at 0 and500 nmm above the midplane. Cross-sectional mosaics (see Fig. 4) depict a pelletwith multiple cracks, which is prototypicalof this medium-burnup PWR fuel. Becauseof the extensive cracking, which occurredduring reactor operation, several fuelfragments fell out of the cladding during thesectioning, leaving irregularly shaped voids(dark areas). The central region of the fuel(r/r. < 0.5) at the higher elevation containeda greater density of fission gas bubbles;hence the darker appearance. No such
13
I
porous central region was apparent insamples from the lower-elevation C4 andC12, possibly because of their loweroperating temperatures. The porous region atthe higher elevation is nearly centered,indicating a symmetric temperaturedistribution, which is consistent with the factthat the rod was in the central region of thehost assembly during the irradiation. Asexpected, no appreciable rim effect isobserved in this medium-burnup rod.
3.4.2 Oxide Layers and Fuel-CladdingGap
The thickness of the oxide layer on thecladding outer surface (see Fig. 5 andTable 4) was measured at eight azimuthallocations, evenly spaced around the claddingand covering z45% of the claddingcircumference. At the higher elevation,consistent with a higher in-reactortemperature, the oxide layer is thicker. Thisis also larger than observed on the TurkeyPoint "D" rods at the same elevation, but
well within the range of oxide thickness (5-40 gm) for this medium-burnup fuel(Ref. 12). Some fine circumferentiallyoriented microvoids were observed in theoxide layer (see Appendix D). Extremelylimited and isolated spallation of the oxidewas also observed, apparently due to thelinkage of the microvoids (see Appendix D).Because the oxide layer is thin andconsidered non-load-bearing in the stresscalculation, the isolated spallation wouldhave no significant impact on fuel rodperformance during dry storage. The oxidemorphology was consistent with theobservations made on the Turkey Point rods.A fuel/cladding gap was observed aroundthe inner cladding circumference, probablyformed during cooldown. Small (<10 pim),discontinuous oxide layers were observed onthe cladding inner surface, but there was noevidence of fuel/cladding chemicalinteraction. Once again, this is typicalbehavior for rods at this burnup.
(A) (B)
Fig. 4. Cross-sectional mosaics of Rod H9: (A) m1000 mm above midplane, (B) approximatemidplane.
14

Table 4. Surry-2 Assembly Ti I Cladding Outer Oxide Layer Thickness (pm) at 0, 500, and1000 mm above the fuel centerline
Rod 0 mm 500 mm 1000 mmOxide Metala Oxide Metal Oxide Metal
H9 24±4 14±2 33±8 19±4 40±5 23±3
G6 22±6 13±3 26±3 15±2 NM
TP-Dcrange 4-7 2.5 ±1 5 - 8 3.7±1 8-2 5.7±1%Based on oxide/metal thickness ratio = 1.75bNM = not measuredCTP-D = Turkey Point D assemblies
-I .IN-- -, -
(A) (B)
Fig. 5. Cladding outer-surfice oxide layer of Surry-2 Rod H9 from assembly T 1I at: (A)approximate fuel midplane, and (B) ,1000 mm above midplane. Scale = 50 pm.
3.4.3 Hydrogen Content, Distribution,and Orientation
Eight determinations of hydrogen contentwere made at each elevation using Lecofusion extraction analysis. The results aregiven in Table 5. Van Swam et al. (Ref. 11)
indicates that the hydrogen pickup factordecreases with increased oxide thickness.For the range of oxide thicknesses measuredon the Surry rods, the pickup factor isreasonably constant between 16 and 24%.For the Turkey Point rods, the factor isbetween 20 and 30%. The H2 content was
15

calculated for the measured oxide thicknessusing the average pickup factors. Withinmeasurement uncertainty of the oxidethickness and pickup factor, good agreementwas observed between the measured andcalculated hydrogen content of Rod H9 axiallocations. In the central region of the fuelcolumn, where the axial temperaturegradient in storage is small, the measuredhydrogen content of the cladding isconsistent with the thickness of the oxidelayer. At =1 m above the fuel midplane,where the axial temperature gradient towardthe end of the rod is steeply decreasing,there is less hydrogen than would beexpected from the oxide thickness thatdeveloped in-reactor.
Adjacent cladding samples were etched tocharacterize hydride distributions. Six toeight azimuthal regions were imaged at theapproximate fuel rod midplane, =500 mmabove midplane, and =1000 mm abovemidplane along Rod H9 and at theapproximate fuel rod midplane and =500mm above the midplane along Rod G6.The density and radial location of hydridesvaried both axially and azimuthally (seeAppendix D and Fig. 6).
Hydrides at the midplane of Rod H9 arepredominately in the inner and outercladding surface regions. At progressivelyhigher elevations, hydrides start to appear inthe central part of the cladding as well. At1 m above the midplane, the hydrides tendto be evenly distributed across the claddingwidth. The hydrides in the cladding of RodG6 are also predominately in the inner andouter cladding surface regions at the rodmidplane. Unlike Rod H9, the hydridesremain in the inner and outer claddingsurface regions at the 500-mm elevation.Without baseline photomicrographs of theSurry cladding after reactor discharge, it is
difficult to determine from metallographicimages if radial or axial redistribution ofhydrogen was a result of the prestoragetesting (T < =414'C) and/or dry-cask storage(T < 350-C).
When the concentration of hydrogen in solidsolution in the Zircaloy matrix exceeds thesolubility limit, the excess hydrogenprecipitates as hydrides. Cladding ismanufactured with a texture such that thehydrides precipitate in a circumferentialdirection upon reactor cooldown. At 414'C,almost all (220 - 250 wppm) of the hydrogenmeasured at the fuel midplane would havebeen in solid solution (Ref. 13). As thetemperature decreased over time, thehydrogen in solid solution would eventuallyprecipitate as hydrides according to thehydrogen precipitation solvus (Ref. 14). Atthe initial dry-cask-storage temperature(=350 C), =100 wppm of the 250 wppmwould have re-precipitated as hydrides. Forthe end-of-storage conditions, i.e.,temperature of =150'C, essentially all of thehydrogen would have re-precipitated ashydrides.
The hydrides are in the form of longcircumferential stringers. Although noradial hydrides are observed near theoxide/cladding interface, it is clear thatsmall segments of the hydrides are orientedat angles between 0 and 90 from thecladding radius. This also holds true for thehydrides within the inner cladding region.These are only very small hydrides, andthere is no evidence of significantreorientation. At a few of the azimuthalorientations =500 mm above the midplaneon Rod G6, some of the long hydrides aresurrounded by very small, randomlyorientated precipitates.
16

l ---
(A)
(C) (D)
Fig. 6. Hydride structure in fuel rod cladding of Assembly T II at two elevations:(A) approximate midplane of Rod H9, (B) s500 mm above midplane of Rod H9,(C) approximate midplane of Rod G6, and (D) f5OO mm above midplane of Rod G6.
I
17
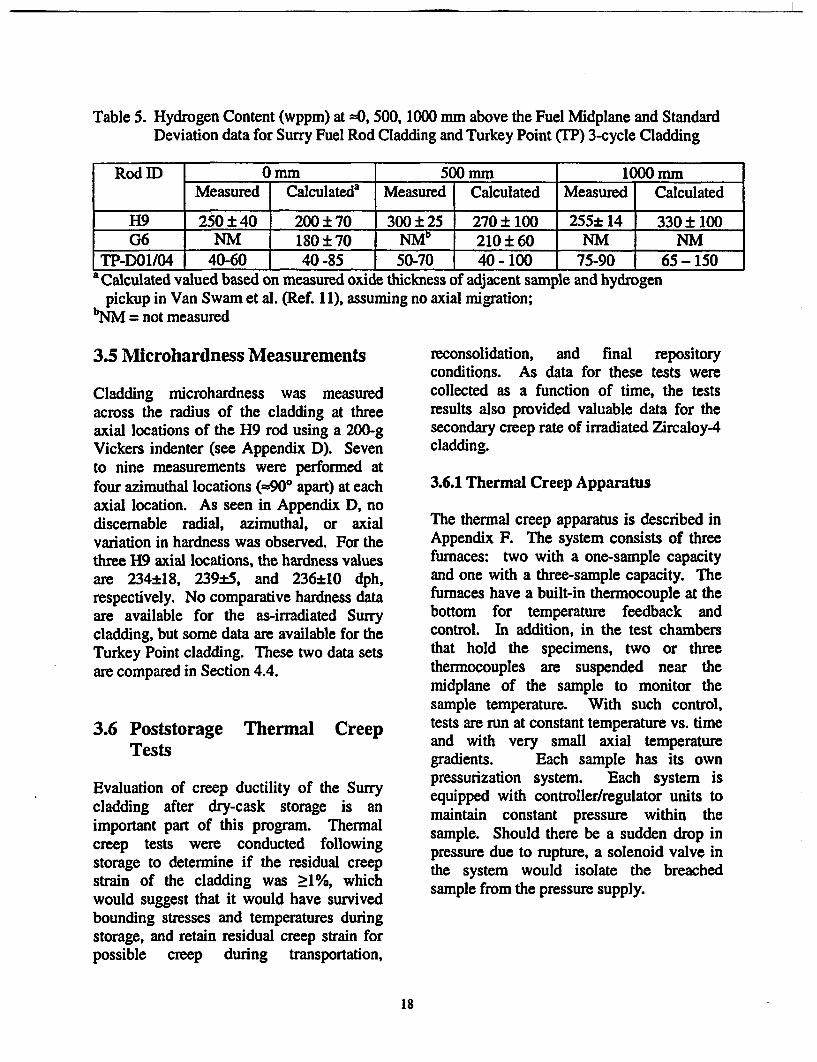
Table 5. Hydrogen Content (wppm) at =O, 500, 1000 mm above the Fuel Midplane and StandardDeviation data for Surry Fuel Rod Cladding and Turkey Point (TP) 3-cycle Cladding
Rod ID 0 mm 500 mm 1000 mmMeasured Calculateda Measured Calculated Measured Calculated
H9 250 40 200± 70 300 ±25 270 ± 100 255± 14 330± 100G6 NM 180±70 NMb 210±60 NM NM
TP-DO1/04 40-60 40 -85 50-70 40 - 100 75-90 65 -150a Calculated valued based on measured oxide thickness of adjacent sample and hydrogen
pickup in Van Swam et al. (Ref. 11), assuming no axial migration;'NM = not measured
3.5 Microhardness Measurements
Cladding microhardness was measuredacross the radius of the cladding at threeaxial locations of the H9 rod using a 200-gVickers indenter (see Appendix D). Sevento nine measurements were performed atfour azimuthal locations (=900 apart) at eachaxial location. As seen in Appendix D, nodiscernable radial, azimuthal, or axialvariation in hardness was observed. For thethree H9 axial locations, the hardness valuesare 234±18, 239±5, and 236±10 dph,respectively. No comparative hardness dataare available for the as-irradiated Surrycladding, but some data are available for theTurkey Point cladding. These two data setsare compared in Section 4.4.
reconsolidation, and final repositoryconditions. As data for these tests werecollected as a function of time, the testsresults also provided valuable data for thesecondary creep rate of irradiated Zircaloy-4cladding.
3.6.1 Thermal Creep Apparatus
The thermal creep apparatus is described inAppendix F. The system consists of threefurnaces: two with a one-sample capacityand one with a three-sample capacity. Thefurnaces have a built-in thermocouple at thebottom for temperature feedback andcontrol. In addition, in the test chambersthat hold the specimens, two or threethermocouples are suspended near themidplane of the sample to monitor thesample temperature. With such control,tests are run at constant temperature vs. timeand with very small axial temperaturegradients. Each sample has its ownpressurization system. Each system isequipped with controller/regulator units tomaintain constant pressure within thesample. Should there be a sudden drop inpressure due to rupture, a solenoid valve inthe system would isolate the breachedsample from the pressure supply.
3.6 PoststorageTests
Thermal Creep
Evaluation of creep ductility of the Surrycladding after dry-cask storage is animportant part of this program. Thermalcreep tests were conducted followingstorage to determine if the residual creepstrain of the cladding was >1%, whichwould suggest that it would have survivedbounding stresses and temperatures duringstorage, and retain residual creep strain forpossible creep during transportation,
18
3.6.2 Thermal Creep Test Matrix andSummary of Results
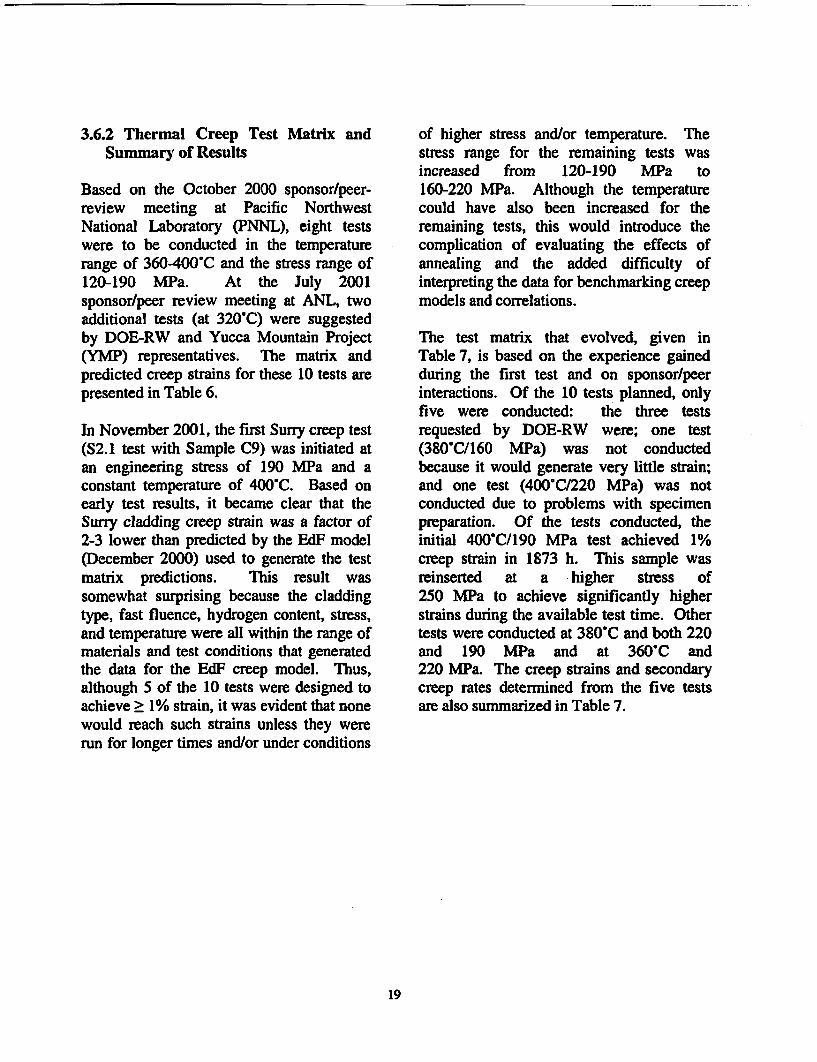
Based on the October 2000 sponsor/peer-review meeting at Pacific NorthwestNational Laboratory (PNNL), eight testswere to be conducted in the temperaturerange of 360-400'C and the stress range of120-190 MPa. At the July 2001sponsor/peer review meeting at ANL, twoadditional tests (at 320C) were suggestedby DOE-RW and Yucca Mountain Project(YMP) representatives. The matrix andpredicted creep strains for these 10 tests arepresented in Table 6.
In November 2001, the first Surry creep test(S2.1 test with Sample C9) was initiated atan engineering stress of 190 MPa and aconstant temperature of 400'C. Based onearly test results, it became clear that theSurry cladding creep strain was a factor of2-3 lower than predicted by the EdF model(December 2000) used to generate the testmatrix predictions. This result wassomewhat surprising because the claddingtype, fast fluence, hydrogen content, stress,and temperature were all within the range ofmaterials and test conditions that generatedthe data for the EdF creep model. Thus,although 5 of the 10 tests were designed toachieve > 1% strain, it was evident that nonewould reach such strains unless they wererun for longer times and/or under conditions
of higher stress and/or temperature. Thestress range for the remaining tests wasincreased from 120-190 MPa to160-220 MPa. Although the temperaturecould have also been increased for theremaining tests, this would introduce thecomplication of evaluating the effects ofannealing and the added difficulty ofinterpreting the data for benchmarking creepmodels and correlations.
The test matrix that evolved, given inTable 7, is based on the experience gainedduring the first test and on sponsor/peerinteractions. Of the 10 tests planned, onlyfive were conducted: the three testsrequested by DOE-RW were; one test(380-C/160 MPa) was not conductedbecause it would generate very little strain;and one test (400'C/220 MPa) was notconducted due to problems with specimenpreparation. Of the tests conducted, theinitial 400-C/190 MPa test achieved 1%creep strain in 1873 h. This sample wasreinserted at a higher stress of250 MPa to achieve significantly higherstrains during the available test time. Othertests were conducted at 380'C and both 220and 190 MPa and at 360'C and220 MPa. The creep strains and secondarycreep rates determined from the five testsare also summarized in Table 7.
19
I
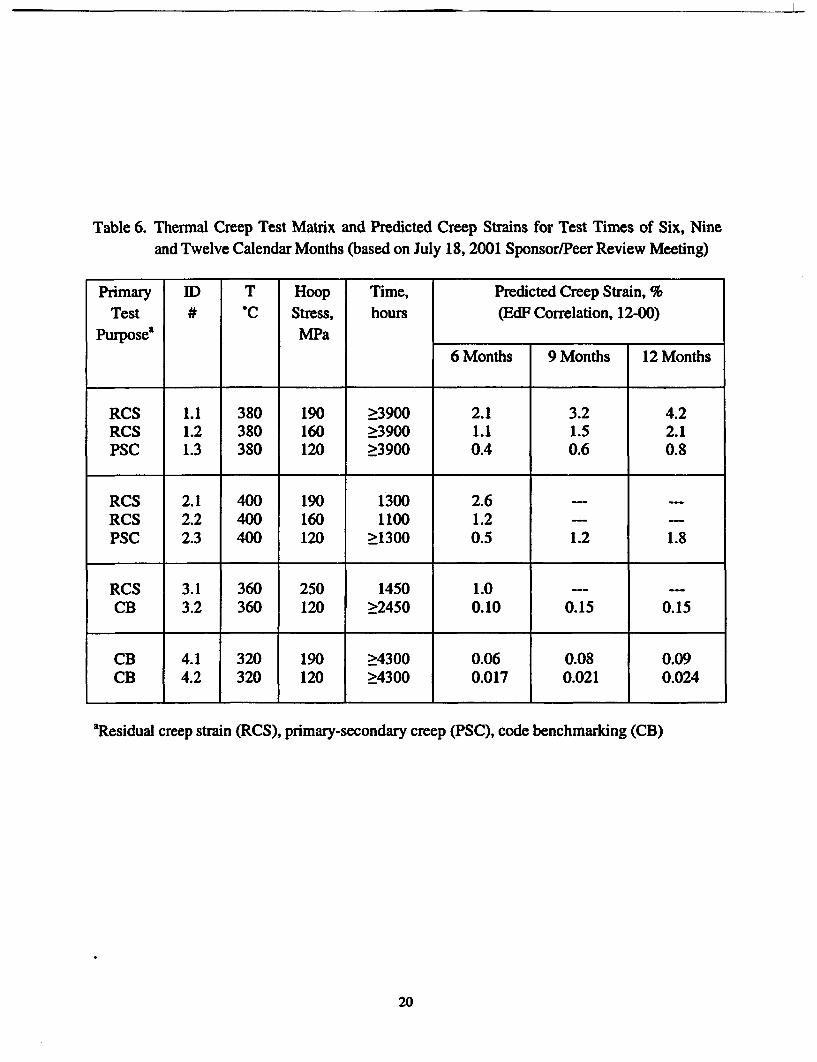
Table 6. Thermal Creep Test Matrix and Predicted Creep Strains for Test Times of Six, Nineand Twelve Calendar Months (based on July 18, 2001 Sponsor/Peer Review Meeting)
Primary ID T Hoop Time, Predicted Creep Strain, %Test # C Stress, hours (EdF Correlation, 12-00)
Purpose' MPa6 Months 9 Months 12 Months
RCS 1.1 380 190 >3900 2.1 3.2 4.2RCS 1.2 380 160 >3900 1.1 1.5 2.1PSC 1.3 380 120 >3900 0.4 0.6 0.8
RCS 2.1 400 190 1300 2.6 _ _RCS 2.2 400 160 1100 1.2 _PSC 2.3 400 120 >1300 0.5 1.2 1.8
RCS 3.1 360 250 1450 1.0 _-CB 3.2 360 120 >2450 0.10 0.15 0.15
CB 4.1 320 190 >4300 0.06 0.08 0.09CB 4.2 320 120 >4300 0.017 0.021 0.024
aResidual creep strain (RCS), primary-secondary creep (PSC), code benchmarking (CB)
20

Table 7. Surry Cladding Thermal Creep Test Matrix and Summary of Resultsa
Test Sample T, Hoop Total Initiation Accumulated SecondaryID ID 'C Stress, Time, Date Hoop Strain, Creep Rate,
MPa hours 104 %/h
1.1 C8 380 220 2180 03-02 1.10 4.51.2 C6 380 190 2348 03-02 0.35 0.88
1.3 -- 380 160 -- --
2.1 C9 400 190 1873 11-01 1.04 4.92.2 400 220 _ _2.3 C9 400 250 693 05-02 5.83 >49
3.1 C3 360 220 3305 02-02 0.22 0.42
3.2 360 TBDb TBD TBD --- --
4.1 _ 320 TBD TBD TBD _4.2 _ 320 TBD TBD TBD _
aAll tests were terminated by August 1, 2002.b To be determined
3.6.3 Hoop Thermal Creep Strain vs.Time
Hoop strains due to creep are determinedfrom periodic measurements of the averageouter diameter of the cladding sample vs.time. These measurements are made off-line at room temperature by firstdepressurizing the sample, to avoid thepotential for hydride reorientation, and thencooling it. A laser profilometer is used tomeasure the azimuthal and axial variation ofthe 76-mm-long cladding tubing. Theazimuthal values are averaged at each axiallocation. The five azimuthally-averaged
values within the middle =40 mm of thesample are then averaged to obtain theaverage diameter of the cladding sample forconversion to creep strain. Details of thespecimen design and the azimuthal and axialvariations of sample diameter are presentedin Appendix F.
The hoop creep strain at the sample outersurface is determined by the average changein diameter, normalized to the initialdiameter (AD/Do). The 25-30-jim outerdiameter oxide layer is assumed to have noresistance to creep. Also, the creep strainwithin the base metal is assumed to lead to
21

no volume change, to be isotropic, and in aplane-strain state (i.e., no creep in the axialdirection). These standard assumptions leadto a creep strain distribution across the wallthat varies inversely with the square of theradial position. Correcting for the oxidelayer thickness - a very small correction --and averaging the creep strain across thecladding wall leads to the followingrelationship for the wall-averaged hoopstrain (Eac) for the Surry cladding:
eo, = 1.13 (AD/D.) (3)
2180 h, the wall-averaged hoop creep strainis 1.10% and the secondary creep rate is4.5 x 10-4 o/h. In comparing the creepstrain of C8 with that of C9, (see Figs. 7 and8) it is noted that the strain histories aresimilar for the two samples. This similaritysuggests that a 20'C drop in temperature iscompensated by a 30 MPa increase in hoopstress.
Figure 9 shows the time history of the creepstrain for Sample C6 at 380'C and 190 MPaengineering hoop stress. It appears that thissample is also in the secondary creep regimeafter 2348 h at a wall-averaged hoop strainof 0.35%. The secondary creep rate is8.8 x 1075 %b/h.
Figure 10 shows the time history of thecreep strain for Sample C3 at 360'C and220-MPa engineering hoop stress. Thecladding is very creep resistant at thistemperature level. Sample C3 appears to bein secondary creep regime after 3305 h at anaverage hoop strain of 0.22%. Thesecondary creep rate is 54.2 x 10⁻⁵ %Ih.
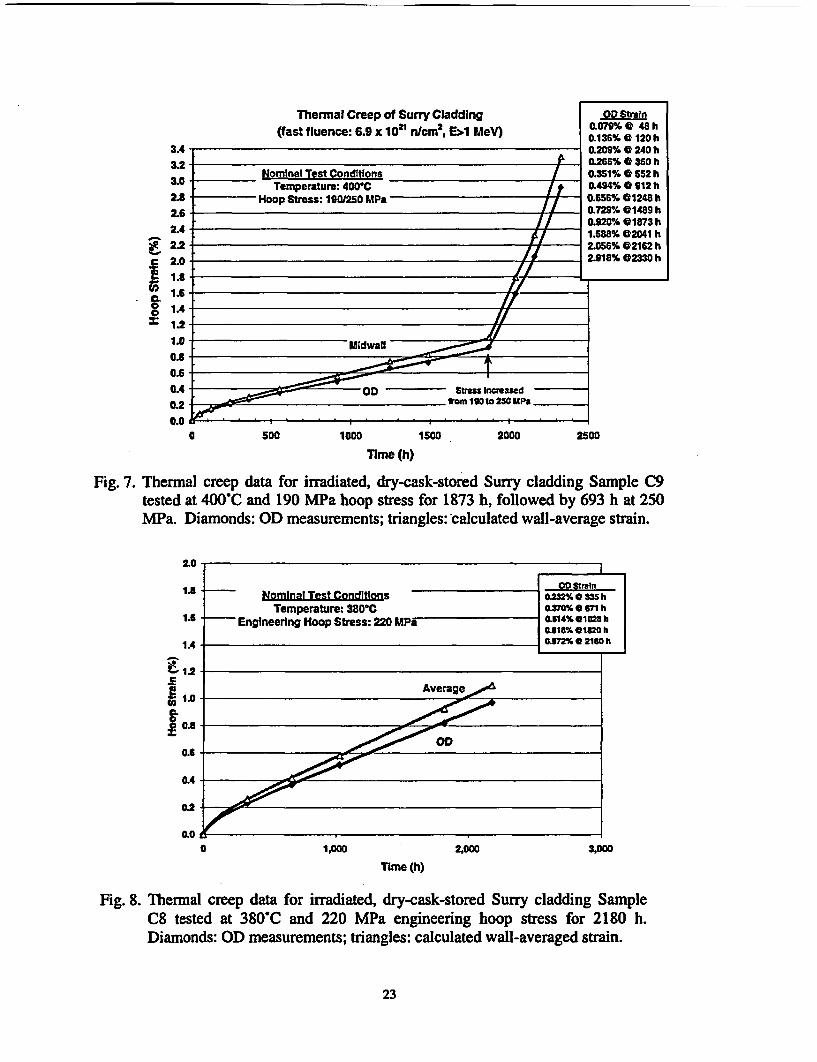
Figure 7 shows the time variation of both e*and AD/Do for Sample C9, which wassubjected to 400C and 190 MPa hoop stressfor 1873 h, followed by 693 h at 400'C andthe elevated engineering hoop stress of 250MPa. The wall-averaged creep strain andsecondary creep rate at the end of the 1873 hwere 1.04% and 4.9 x 10⁴ %/h, respectively.The creep stain rate during the period ofelevated stress was > =50 x 104 %/h, withthe total accumulated creep strain = 5.83%.
Figure 8 shows the time history of the creepstrain for Sample C8 at 380'C and 220 MPaengineering hoop stress. It appears thatsecondary creep has been obtained. After
22
E
as
3.'
2.4
2.42.I
1.4
1.111.Ia.'a.'a.'O.:
I -2-
I.I-
I-
2-
Thennal Creep of Surry Cladding(fast fluence: 6.9 x 10²¹ n6cm, EA1 MeV)
Nominal Test ConditionsTemperature: 4001C / t
* Hoop Stress: 1901250 MPa
- 11~~~~~~~~O
OD Straln0.079% 0 48 h0.136% 0 120 h0.209% 0 240 h0.266% 0 360 h0.351% 0 552 h0.494% 0 912 h0656% 01248 h0.729% 01489 h
920%@ 01873 h1.588% 02041 h2.056% 02162 h2.918% 2330 h
dr v .ID
I
I . - OD ~~~~~0 Sims Incemased
I ' *GM~~~~~~~~~~~frn 13Gbl 250 LIPARs
a 500 1000 1500 2000 2500
Time (h)
Fig. 7. Thermal creep data for irradiated, dry-cask-stored Surry cladding Sample C9tested at 400*C and 190 MPa hoop stress for 1873 h, followed by 693 h at 250MPa. Diamonds: OD measurements; triangles: calculated wall-average strain.
2.0
OD Strain1.3 NomInal Test Conditions 0J2M % @35 h
Temperature: 380-C 0o3 m 671 h1.6 Engineering Hoop Stress: 220 UPa I.514% 01028 h
0J918 W 01620 h
IA -. 972% O 2160 h
1.2
iE .02 - Average0
0.6- 0
0.4-
0.2
0.0a 1,000 2,000 3,000
Time (h)
Fig. 8. Thermal creep data for irradiated, dry-cask-stored Surry cladding SampleC8 tested at 380'C and 220 MPa engineering hoop stress for 2180 h.Diamonds: OD measurements; triangles: calculated wall-averaged strain.
23

1.0
I0.9
0.8
0.7
z 0.6
a.t o
8 0.4x
Nominal Test ConditionsTemperature: 380WC
Engineering Hoop Stress: 190 MPaW&00% @335 h
-IO.184%102~h1
0LV 02U.2h
Average- = 4
01
0.0 e-0-00"_ .0 500 1000 1500 2000 2500 3000
Time (h)
Fig. 9. Thermal creep data for irradiated and dry-cask-stored Surry cladding sample C6tested at 380 C and 190 MPa engineering hoop stress for 2348 h. Diamonds: ODmeasurements; triangles: calculated wall-averaged strain.
1.0
0.9 -
0.8 -
0.7
'-0.6
0.5.0 0.5(a
0.4
0.3-
0.2
0.1
0.0I
-
- Nominal Test ConditionsTemperature: 36WC
- Engineering Hoop Stress: 220 MPa
PO HO a1
0.013% after 49 h0.042% after 217 h0.091% after 721 h0.117% after 1272 h0.122% after 1629 h0.194% after 3305 h
Average
0 1.000 2,000
Time (h)
3.000 4,000
Fig. 10. Thermal creep data for irradiated, dry-cask-stored Surry claddingsample C3 tested at 360'C and 220 MPa engineering hoop stress for3305 h. Diamonds: OD measurements; triangles: calculated wall-averaged strain.
24
4 IMPLICATIONS FOR EXTENDED DRY STORAGE
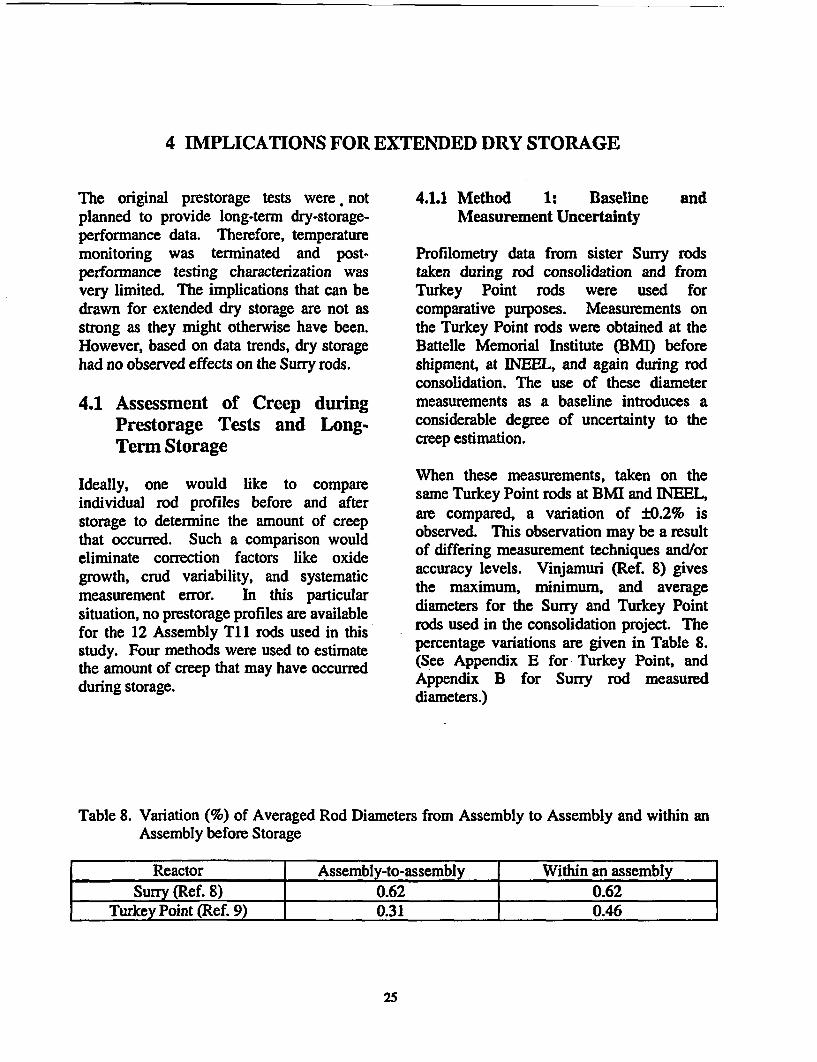
The original prestorage tests were, notplanned to provide long-term dry-storage-performance data. Therefore, temperaturemonitoring was terminated and post-performance testing characterization wasvery limited. The implications that can bedrawn for extended dry storage are not asstrong as they might otherwise have been.However, based on data trends, dry storagehad no observed effects on the Surry rods.
4.1.1 Method 1: BaselineMeasurement Uncertainty
and
4.1 Assessment of CreepPrestorage Tests andTerm Storage
duringLong.
Profilometry data from sister Surry rodstaken during rod consolidation and fromTurkey Point rods were used forcomparative purposes. Measurements onthe Turkey Point rods were obtained at theBattelle Memorial Institute (BMI) beforeshipment, at INEE, and again during rodconsolidation. The use of these diametermeasurements as a baseline introduces aconsiderable degree of uncertainty to thecreep estimation.
When these measurements, taken on thesame Turkey Point rods at BMI and INEEL,are compared, a variation of ±0.2% isobserved. This observation may be a resultof differing measurement techniques and/oraccuracy levels. Vinjamuri (Ref. 8) givesthe maximum, minimum, and averagediameters for the Surry and Turkey Pointrods used in the consolidation project. Thepercentage variations are given in Table 8.(See Appendix E for Turkey Point, andAppendix B for Surry rod measureddiameters.)
Ideally, one would like to compareindividual rod profiles before and afterstorage to determine the amount of creepthat occurred. Such a comparison wouldeliminate correction factors like oxidegrowth, crud variability, and systematicmeasurement error. In this particularsituation, no prestorage profiles are availablefor the 12 Assembly Ti rods used in thisstudy. Four methods were used to estimatethe amount of creep that may have occurredduring storage.
Table 8. Variation (%) of Averaged Rod Diameters from Assembly to Assembly and within anAssembly before Storage
Reactor Assembly-to-assembly Within an assemblySurry (Ref. 8) 0.62 0.62
Turke Point (Ref. 9) 0.31 0.46
25

Inasmuch as measurements were made indifferent facilities and the rods lackedtracking numbers through these tests, it isimpossible to know which rod or assemblyto use as a baseline. Thus creep strains basedon any profile chosen for a basis ofcomparison may be as much as ± 0.6-0.9%different from the actual creep strains. Inother words, > 0.9% creep strain would haveto occur before it could be concluded withreasonable certainty that any thermal creephad occurred during performance testing andstorage.
4.1.2 Method 2: Creep Code Calculations
Thermal creep predictions, which use theYMP creep code (Ref. 15), were made usingthe performance testing temperatures inTable 1 and the two long-term temperatureprofiles developed earlier. The stresscalculation was based on measured
parameters of an outside rod diameter =10.71 - (0.06 ± 0.01) mm, internal rodpressure at room temperature =3.5 ± 0.1 MPa, and cladding thickness(without oxide) = 0.596 mm. Based on thehardness measurements, it is assumed thatno significant irradiation annealing of thecladding had taken place. Table 9 gives thecalculated creep after various times.
Depending on the assumed temperatureprofile, 30 and 50% of any creep wouldhave occurred during the long-term storage(0.03 and 0.08 % creep strain). Consideringthat this and other creep correlationspredicted cumulative creep strain two tothree times higher than measured (asreported above), one would expect thatsignificantly less than 0.16% creep occurredduring the prestorage thermal-benchmarktests and the long-term storage of this fuel.
Table 9. Predicted Creep Strains after Various Test and Storage Periods
Cumulative CreepTemperature Duration Strain after Total Creep during
OC h Duration Duration
344 119 0.012 0.012359 43 0.0 15 0.003415 72 0.032 0.017357 93 0.037 0.005398 72 0.047 0.010348 2880 0.081 0.034
344- 155 1.3 x 10 0.113a 0.032a344- 155 1.3 x 10 0.164b 0.083w
a Temperature profile for Method 1 in Fig. 1.b Temperature profile for Method 2 in Fig. 1.
26

If the ratio of the creep during performancetesting and extended dry storage calculatedby Method 2 is reasonable, between 0.03and 0.08% creep may have taken placeduring the extended storage period. This isfurther reduced to 0.01 - 0.04% creep if onetakes into account the fact that the predictivecreep equations were a factor of 2-3 highwhen compared with the creepmeasurements presented in this report forthe same Surry cladding.
4.1.3 Method 3: Comparison withPrestorage Turkey Point Diameters
An estimate of the maximum creep can beobtained by comparing the after-storagediameters with the minimum diameter thatmay have existed before storage. Thediameters of 20 Turkey Point rods weremeasured by spiral profilometry afterirradiation and water storage (transportationin a water-filled cask) before dry storage.Average profile plots are available (Ref. 8)with error limits indicative of the rodovality. The hottest region in the verticalstorage cask with a He atmosphere wasbetween 2 and 3 m from the bottom of the
Table 10. Global and Average Rod Diameters --
Elevation from Bottom of Rod
fuel. This elevation is where one wouldexpect the maximum creep strain to occurduring storage. With the estimates from theplots as a basis, the maximum, minimum,and average diameter for each rod in the 2-3m elevation was tabulated (see Appendix Efor Turkey Point, Appendix B for Surry).The global (worst case for a collection ofrods) and average values over the set of rodsin these tables are summarized in Table 10.
The worst case would be a comparison ofthe global maximum from the Surry rodswith the global minimum from the TurkeyPoint rods, which is 0.6%. If we comparethe average Surry maximum with theaverage Turkey Point minimum, this dropsto 0.3%. When corrected for the differencebetween oxide growth in the Surry andTurkey point rods, this estimated worst-casecreep strain is reduced to 0.4 and 0.1%,respectively. Comparison of the averagesimplies that no creep occurred duringperformance testing and storage. Theuncertainty in the baseline, as shown above,indicates that these values are all essentiallyzero.
Uncorrected for Oxide Growth - at 2-3-m
Maximum Raw Average Raw Minimum RawAssembly Diameter Diameter Diameter
mm mm mmTurkey Point global 10.765 Not Applicable 10.638
Turkey Point average 10.721 10.678 10.650
Surry global' 10.700 Not Applicable 10.645Surry averageb )10.679 10.670 10.656
"Turkey Point rod diameters measured prior to storage.
Surry rod diameters measured after 15 years storage.
27

4.1.4 Method 4: Comparison withMaximum Potential Creepdown
Another way to evaluate thermal creep thatmay have occurred after reactor discharge isto compare the after-storage profiles withthe minimum diameter that could haveoccurred due to in-reactor creepdown.During irradiation at a radially averaged fueltemperature of =780 0C (Ref. 16), thediameter of the as-fabricated pellet,9.385 mm (Surry drawings), would haveincreased -0.7% due to thermal expansion(Ref. 17). If the pellet formed a mandrel forthe cladding, the outer cladding diameter(not accounting for oxide growth and pelletridges) would be the diameter of this pelletplus two times the cladding thickness(0.617 mm) or 10.685 mm. Depending onwhether this value is compared with theglobal or average maximum Surry diameters(see Table 10), the maximum creep wouldbe between 0 and 0.13%.
The estimated maximum creep is furtherreduced if the expansion due to oxidegrowth is taken into account. Thiscorrection was made at the three locationswhere the oxide thickness was measured onthe upper half of Surry Rods H9 and G6 (see
Table 4). The oxide layer thickness wasdivided by a PBR of 1.75 (Ref. 11), whichaccounts for the -10% porosity in the oxide,to determine the effective thickness ofZircaloy that had been oxidized. Themeasured outer diameter of the cladding wasthen reduced by twice the differencebetween the oxide that had formed and theoxidized metal. As expected, the correcteddiameters exhibit a reasonably flat profile.When the corrected diameters, withuncertainty (minimum metal oxidized), arecompared with an initial in-reactorcreepdown diameter of 10.685 mm, withinexperimental error, no creep occurred duringdry storage.
The creep strain estimates shown inTable 11 are well below 1%. If any thermalcreep occurred, it was probably during eitherthe performance testing phase or the initialstorage years when the temperature washottest and the stress highest. The currentstorage temperature in the Castor cask issubstantially lower then the initial storagetemperature and will continue to drop duringextended storage.
28

Table 11. Summary of Storage Creep Estimates for Various Calculation Methods
Method Maximum Creep, % Minimum Creep, %Ia ~~0.9 0
4b 0 0
2c 0.08 0.032ad 0.04 0.013e 0.4 0.1
aBaseline and measurement uncertainty.
bComparison with maximum potential creepdown.
CCreep code calculations.
dSame as method2 except it has a correction to the creep correlation.
eComparison with Turkey Point diameters measured before storage.
4.2 Fuel Rod Stress
Stress on the cladding due to the rod internalpressure is the driving force for claddingcreep. For the Surry rods, most of theinternal pressure is due to the He fill gas. Itis not possible to partition the amount offission gas released during in-reactoroperation and during dry storage. Therelease occurs both by a diffusive processdriven by the temperature gradient acrossthe fuel and by cracking/rehealing during in-reactor startups and shutdowns. In-reactor,the temperature gradient is greater and thetemperature is higher, hence, the diffusioncoefficient is higher. The measured fissiongas release in the Surry rods is within therange expected for the in-reactor release offission gas. In all likelihood, all of therelease occurred in-reactor. Any furtherrelease that may have occurred duringstorage would be substantially lowerbecause of the lower diffusion constants andwould have an insignificant effect oninternal pressure and cladding stress. Thus,the stress on the cladding would decrease
with time as the internal pressure decreaseswith temperature.
4.3 Hydride RedistributionReorientation
and
As the cladding is heated during drying ofthe cask and initial storage at highertemperatures, much of the hydrogenintroduced into the cladding duringirradiation goes into solid solution in theZircaloy matrix. As the cladding coolsduring storage, hydrogen in solid solutionwill precipitate as hydrides as the solubilitylimit is exceeded. Depending on the stresslevels in the cladding, the cladding textureand cooling rates, these hydrides may becircumferential or radial. Excessivehydrogen content or radially orientedhydrides may degrade the mechanicalproperties of the cladding.
The Castor V/21 cask initially supports alarge axial temperature gradient at the topand bottom of the fuel rods. The measuredhydrogen content of the cladding in the
29

and bottom of the fuel rods. The measuredhydrogen content of the cladding in thecenter of the fuel column, where the axialtemperature gradient is small, agrees withthe hydrogen level expected from thegeneration of the measured oxide layer. Thehydrogen content of a region of the rod thatwas in the steep in-cask temperaturegradient was less than expected from thethickness of the oxide layer that formed in-reactor. This finding indicates thathydrogen may have migrated during drystorage into the cooler ends of the rods.This migration probably took place early instorage when both the temperature and thetemperature gradient were the largest.
This migration has not been confirmed bymeasurement. However, it would berelatively straightforward to measure thehydrogen level at 1.5 m and in the coolerplenum region to determine the extent ofaxial hydrogen migration in Rod H9. Theeffect of the re-precipitation of this excesshydrogen as the rods cool further duringstorage has not been evaluated.
4.3.1 Comparison of Surry HydrideDistribution with Other Fuels
Because no postirradiation or prestorageinformation is available about the hydridesin the Surry cladding, two similar PWRfuels that bracket the burnup of the Surryfuel are used as a comparative baseline.Metallographic examination of the TurkeyPoint PWR cladding, which is of the samedesign as Surry but at lower burnup(--28 GWd/MTU) and hydrogen content(<100 wppm), reveals a very small fractionof hydrides branched in the radial directionfollowing reactor discharge and cooling(Ref. 10). For this fuel, at similar axialelevations to the metallographic specimenstaken on the Surry cladding, the hydrideswere uniformly distributed, and appeared
much shorter than those found in the Surryrods. Both Surry rods containedapproximately five times as much hydrogenas the Turkey Point rods at the sameelevation. This is due to the higher burnup(i.e., longer in-reactor residence time) of theSurry rods.
A standard 14 x 14 Combustion Engineering4-cycle Calvert Cliffs (CC) PWR assembly(ATM-106) with a peak burnup of46 GWd/MTU (Ref. 18) was used forcomparative purposes. The peak burnupwas -10 GWd/MTU higher than that of theSurry rods. The cladding of the CC rod wasSandvik Zircaloy-4, but the initial conditionof the cladding was not given. At 41 mabove the fuel midplane, both the Surry andCC rods showed circumferential hydridesrather evenly distributed across the claddingwall. The hydrides were in the range of 500gm long in both cases. It is difficult toquantitatively measure the amount ofhydrides. It did appear that the CC rodscontained more hydrides than the Surry rodsat this elevation. In neither case was thereany evidence of radial hydrides.
No metallographic specimens are availablefor the CC rods that correspond to themetallographic samples taken on the Surryrods at 500 mm above fuel midplane. CCsamples, which are -280 mm above and410 mm below the midplane, are verysimilar and probably represent the midplanehydride structure. At these locations, atleast an order of magnitude fewer hydridesare present in the CC rods than in the Surryrods. The hydrides are much shorter,possibly concentrated a little more in thecenter of the cladding, with very few andvery small radial hydrides present. This isconsiderably different from the midplanehydride structure seen on the Surry rods.
30
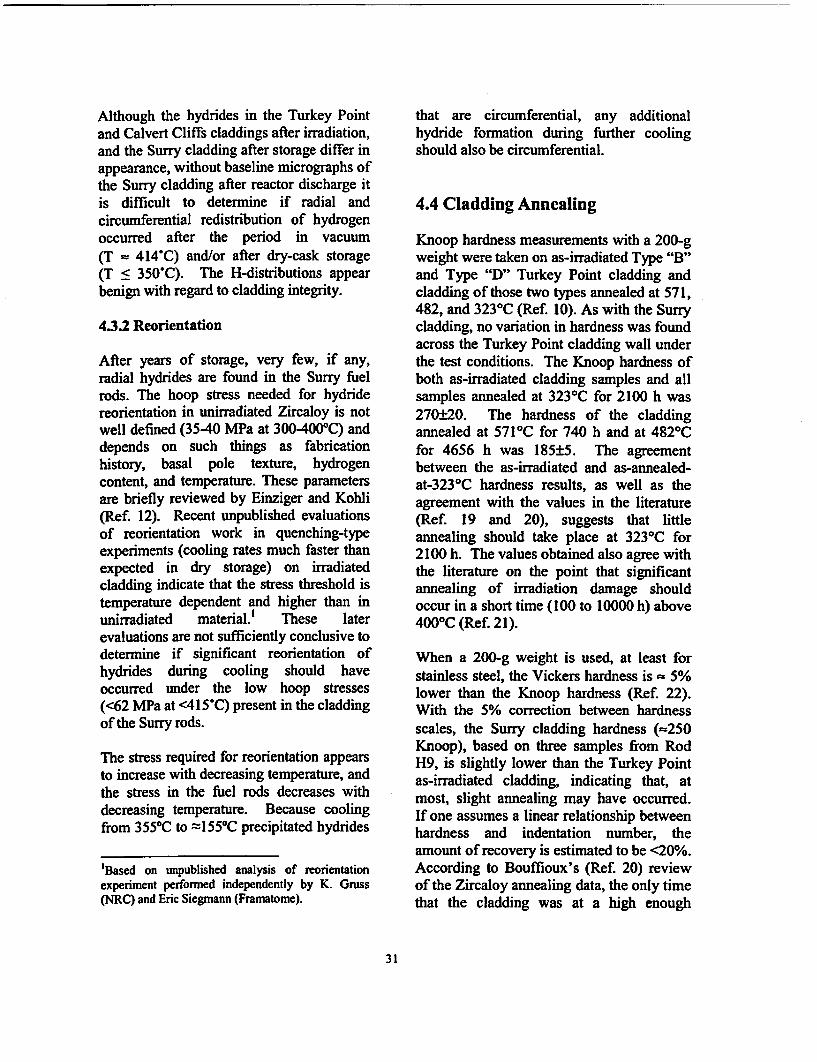
Although the hydrides in the Turkey Pointand Calvert Cliffs claddings after irradiation,and the Surry cladding after storage differ inappearance, without baseline micrographs ofthe Surry cladding after reactor discharge itis difficult to determine if radial andcircumferential redistribution of hydrogenoccurred after the period in vacuum(T = 414'C) and/or after dry-cask storage(T < 350'C). The H-distributions appearbenign with regard to cladding integrity.
4.3.2 Reorientation
After years of storage, very few, if any,radial hydrides are found in the Surry fuelrods. The hoop stress needed for hydridereorientation in unirradiated Zircaloy is notwell defined (35-40 MPa at 300-400"C) anddepends on such things as fabricationhistory, basal pole texture, hydrogencontent, and temperature. These parametersare briefly reviewed by Einziger and Kohli(Ref. 12). Recent unpublished evaluationsof reorientation work in quenching-typeexperiments (cooling rates much faster thanexpected in dry storage) on irradiatedcladding indicate that the stress threshold istemperature dependent and higher than inunirradiated material.' These laterevaluations are not sufficiently conclusive todetermine if significant reorientation ofhydrides during cooling should haveoccurred under the low hoop stresses(<62 MPa at <415'C) present in the claddingof the Surry rods.
The stress required for reorientation appearsto increase with decreasing temperature, andthe stress in the fuel rods decreases withdecreasing temperature. Because coolingfrom 3550C to =1550C precipitated hydrides
'Based on unpublished analysis of reorientationexperiment performed independently by K. Gruss(NRC) and Eric Siegmann (Framatome).
that are circumferential, any additionalhydride formation during further coolingshould also be circumferential.
4.4 Cladding Annealing
Knoop hardness measurements with a 200-gweight were taken on as-irradiated Type "B"and Type "D" Turkey Point cladding andcladding of those two types annealed at 571,482, and 3230C (Ref. 10). As with the Surrycladding, no variation in hardness was foundacross the Turkey Point cladding wall underthe test conditions. The Knoop hardness ofboth as-irradiated cladding samples and allsamples annealed at 3230C for 2100 h was270±20. The hardness of the claddingannealed at 571IC for 740 h and at 4821Cfor 4656 h was 185±5. The agreementbetween the as-irradiated and as-annealed-at-323°C hardness results, as well as theagreement with the values in the literature(Ref. 19 and 20), suggests that littleannealing should take place at 3231C for2100 h. The values obtained also agree withthe literature on the point that significantannealing of irradiation damage shouldoccur in a short time (100 to 10000 h) above4000 C (Ref. 21).
When a 200-g weight is used, at least forstainless steel, the Vickers hardness is - 5%lower than the Knoop hardness (Ref. 22).With the 5% correction between hardnessscales, the Surry cladding hardness (-250Knoop), based on three samples from RodH9, is slightly lower than the Turkey Pointas-irradiated cladding, indicating that, atmost, slight annealing may have occurred.If one assumes a linear relationship betweenhardness and indentation number, theamount of recovery is estimated to be <20%.According to Bouffioux's (Ref. 20) reviewof the Zircaloy annealing data, the only timethat the cladding was at a high enough
31

I
temperature for a long enough time for anyannealing to occur was in vacuum when thetemperature excursion to 415'C occurred.Even in that situation, the annealing wouldbe expected to be small because the durationwas short. However, without baseline dataon the hardness of the specific H9 Surrycladding after reactor discharge, it isdifficult to assess annealing by comparingthe hardness of the H9 Surry cladding withcladding irradiated to lower neutron damagelevels and possibly at lower in-reactortemperatures.
If each temperature profile proposed earlierwere bounded by an isothermal period at344 C until the temperature dropped to325'C and then stayed at 325'C for theremainder of the 15 years of storage,Bouffioux's plot (Ref. 20) would stillpredict no recovery during the duration ofthe extended dry storage. Any recovery thatmay have occurred was probably during theperformance testing, when the temperaturereached as high as 415'C for 72 h, and notduring the extended storage. At the evenlower temperatures expected for continuedstorage (<1500C), no additional recovery isexpected. Perhaps the strongest argument infavor of the idea that little, if any, annealingoccurred is that the cladding hardness valuesare relatively uniform from midplane to -1m above midplane.
secondary creep rates. However, becauseboth the primary creep strain and thesecondary creep rates of the poststored Surrycladding were factors of 2-3 below mostmodel predictions, residual post-storagestrains > 1% were achieved in only three ofthe tests, whereas secondary creep appearedto be achieved in all five tests.
A hoop creep strain of 1% and a secondarycreep rate of (4.8 x 0 4 %/h) were achievedafter 1873 h at 400'C and 190 MPaengineering hoop stress. After reinsertingthe sample at 400'C and a significantlyhigher engineering hoop stress (250 MPa)for 693 h, the total hoop strain for thissample was -6% without failure at asecondary creep rate of -50 x 104 %/h,followed by an increase in creep rate due towall thinning. This wall thinning wasuniform around the circumference of thecladding, suggesting that local instability,which would be a precursor to failure, hadnot yet occurred. Such a creep strain wouldbe more than adequate for upper bound dry-cask-storage and final-repository conditions.However, these results do not address thepossibility of lower thermal creep strain lifeat lower temperatures (e.g., < 360'C). Asecond sample tested at 380 C and 220 MPa,also achieved 1% thermal creep strain andsecondary creep (4.5 x 10⁴ %/h) within thetest duration of 2180 h. This result isencouraging because both the temperatureand the stress values are reasonable upperbounds for dry-cask-storage conditions.
The other two tests, at 380'C/190-MPa and360'C/220-MPa, achieved strains of only0.35% at 2348 h and 0.22% at 3305 h,respectively. These samples appear to haveachieved secondary creep with creep rates of0.88 x 104 %/h for the 380*C/190-MPa testand 0.42 x 10d4 %/h for the test at360'C and 220-MPa. Additional datapoints, closer together in time, would be
4.5 Post-storage ResidualStrain and Strain Rate
Creep
The primary purpose of the post-storagethermal creep tests was to demonstrate thatthe Surry cladding would have adequateresidual creep strain to survive upperbounddry-cask storage conditions (•4001C, <150MPa) and upperbound repository conditions.Inasmuch as creep data were recorded vs.time, valuable data were also generated toestablish primary creep strains and
32

needed to determine the secondary creeprate more precisely. However, for theselow-strain tests, it was not cost-effective toincrease the number of data points per test.Both of these results are useful forvalidating models and correlations forpredicting creep during dry-cask storage.
Because NRC-SFPO ISG-1 1 Rev. 2 (Ref.23) recommends 400 C as an uppertemperature limit for vacuum drying,transfer, and dry storage, additional tests at400C (160 MPa and 220 MPa) are planned.
33

5 CONCLUSIONS AND RECOMMENDATIONS
5.1 Conclusions
Surry reactor PWR fuel rods(35.7 GWdVMVI') that were stored for -15years at an initial temperature of -3501C(with temperatures reaching as high as4151C during <72 h of performance testing)in a Castor-V/21 cask have been evaluated.After visual examination, the diametralprofiles of 12 rods were measured and thegas inside four rods was analyzed forpressure, volume, composition, and isotopiccontent. Based on the results of theprofilometry and gas analysis, three rodswere sectioned and shipped to ANL-E formore detailed characterization.Metallography, microhardness, andhydrogen determination have beencompleted at three axial locations of Rod H9and metallography has been completed attwo locations of Rod G6. The mainconclusions are:
1) It appears that the Surry rodsexperienced very little thermal creepduring thermal-benchmark testingand dry-cask storage. The creepwould not increase significantlyduring additional storage because ofthe low temperature after 15 years,the continual decrease in temperaturedue to the reduction in decay heat,and the concurrent reduction inpressure and stress. Comparing post-storage Surry rod diameters with therange of diameters measured forSurry and Turkey Point rods prior tostorage introduces considerableuncertainty in the attempt to quantifythermal creep that may haveaccumulated during storage.Predictions from a best-estimatemodel suggest that the thermal creepduring storage should be <0.1%.
This prediction is supported when acorrection is made for oxide layerthickness and when the diameterreadings along a single Surry Rod(E9) are compared.
2) Within experimental uncertainty, noadditional fission gas appears to havebeen released during the storageperiod.
3) No evidence of hydrogen pickup orhydride reorientation is noted duringthe storage period. The limitedhydrogen-content data (3 axiallocations of Rod H9) suggest thathydrogen may have migrated axiallyfrom above the fuel midplane to thecooler upper ends of the rods. Atleast two additional hydrogenmeasurements, e.g., at 1.5 m and inthe plenum region, would be neededto confirm this hypothesis. Theeffects of such migration on thelong-term stability of the rods in drystorage are undetermined.
4) Little, if any, claddingoccurred during theperformance period orstorage period.
annealingprestorageextended-
5) The Surry cladding has residualcreep strain >1% for thermal creeptest temperatures of 380*C (220MPa) and 400*C (190 MPa). Aresidual creep strain of -6% wasachieved in the 400 C sample afterraising the stress level to 250 MPafor -700 h. Although the creep rateincreased during the 700 h due towall thinning, the deformation was
35

IUI
uniform around the circumference ofthe cladding. Inasmuch as nosymmetric or asymmetric bulging ofthe cladding was observed - aprecursor to failure - the residualcreep strain of the 400'C sample is>6%. Secondary creep rates thatspan two orders of magnitude weremeasured for the five creep tests.These data are useful not only forcode benchmarking, but fordetermining the temperature andstress sensitivity of the creep rate.
5.2 Recommendations
During the course of this research,additional work has been identified thatwould support both the criteria for dry caskstorage licensing and the applications for drycask storage license renewal. These areasinclude: generating additional creep data at4000C, investigating possible axialmigration of hydrogen during dry caskstorage, investigating the degree of hydridereorientation that may occur duringcooldown under stress, and performing post-creep ductility/toughness tests.
It would be very useful to generate morecreep data at 4000C to supplement the dataat 190 MPa and 250 MPa. To supportthe ISG-1I Rev 2 (Ref.23) recommendationof 400'C as an upper temperature limit forvacuum drying, transfer and storage, It isrecommended that new creep tests at 4000Cand 160 and 220 MPa be conducted.
plenum region. Both of these locationswould have lower storage temperatures thanthe midplane and 0.5-m-above-midplanepositions. If the trend of decreasinghydrogen content with axial elevationcontinued, this would strongly support theaxial migration of hydrogen during storage.
Although all of the current creep samplesare routinely depressurized prior to cooling,hydride reorientation could be investigatedby cooling some of the creep samples whilemaintaining the internal pressure. SamplesC2 and C6 tested at 3600C1220-MPa and380TC/190-MPa would be ideal for thispurpose, as neither sample has accumulatedvery much creep strain. Followingcooldown under these stresses,metallographic analysis should be performedat the specimen midplane to determine thedegree of hydride reorientation.
Three point bend tests have been proposedto measure the ductility/toughness ofthe Surry cladding prior to and after creeptesting. Creep sample C8 (380TC1220-MPa)has achieved 1% creep strain and would be agood candidate for post-creep ductilitytesting. One of the new 4000C samples(220 MPa) will achieve greater than 1%creep strain in a reasonable time frame. Itshould be used as the second post-creepsample to be subjected to the three-pointbend ductility test.
Hydrogen content measurements were madeon Rod H9 cladding samples at =0, 0.5 and1.0 m above the midplane. Although the1.0-m location had a thicker oxide layer, thecladding contained less hydrogen.Additional hydrogen measurements of theas-received Surry Rod H9 cladding shouldbe taken at 1.5 m above midplane and the in
36

6 REFERENCES
1. Einziger, R. E., D. L. Baldwin, and S. G.Pitman. "Interim report. Data Needs forLong-Term Dry Storage of LWR Fuel."TR-108757, Electric Power ResearchInstitute: Palo Alto, CA. April 1998.
2. McKinnon, M. A. and V. A. Deloach."Spent Nuclear Fuel Storage -Performance Tests and Demonstrations."PNL-8451, Pacific NorthwestLaboratory: Richland, WA. April 1993
3. McKinnon, M. A., and A. L. Doherty."Spent Nuclear Fuel Integrity duringDry Storage - Performance Tests andDemonstrations." PNNL- 11576, PacificNorthwest National Laboratory:Richland, WA. June 1997
4. Dziadosz, D., et al. "The CASTOR-V/21 PWR Spent-Fuel Storage Cask:Testing and Analysis." EPRI NP-4887/PNL-5917, Electric Power ResearchInstitute: Palo Alto, CA. November 1986
5. Kenneally, R. M. and J. H. Kessler."Cooperative Research Program on DryCask Storage Characterization."Proc. ICONE 8, 8th InternationalConference on Nuclear Engineering:Baltimore, MD. April 2,2000
6. "Dry Cask Storage CharacterizationProject: Interim Progress Report -October 2001." EPRI report 1003010.Electric Power Research Institute: PaloAlto, CA. October 2001
7. Moore, Ernie. V.<ernie moore~dom.com> "Ti 1Fluence Calculation," July 13, 2001,[personal e-mail], (July 13, 2001)
8. Vinjamuri, K., M., et al. "Dry RodConsolidation Technology Project at theINEEL." EGG-WM-8059. Idaho Falls,ID. April 1988
9. Davis, R. B. "Pre-Test NondestructiveExamination Data Summary Report onTurkey Point Spent Fuel AssembliesDOI, D04, and D06 for the Climax -Spent Fuel Test." HEDL-T.ME 80-83,UC-70, Hanford EngineeringDevelopment Laboratory: Richland,WA. January 1981
10. Atkin, S. D. "Destructive Examinationof 3-Cycle LWR Fuel Rods from TurkeyPoint Unit 3 for the Climax - Spent FuelTest." HEDL-TME 80-89, UC-70,Hanford Engineering DevelopmentLaboratory: Richland, WA. June 1981
1. Van Swam, L. F. et al. "Behavior ofZircaloy4 and Zirconium LinerZircaloy-4 Cladding at High Burnup."Proc. International Topical Meeting onLWR Fuel Performance, PortlandOregon. P. 421. American NuclearSociety: LaGrange Park, IL. March1997
12. Einziger, R. E., and R. Kohli. "Low-Temperature Rupture Behavior ofZircaloy-Clad PWR Spent Fuel RodsUnder Dry Storage Conditions," Nucl.Technol. Vol. 67. p. 107. Oct. 1984
13. Kearns, J. J. "Terminal Solubility andPartitioning of Hydrogen in the AlphaPhase of Zirconium, Zircaloy-2 andZircaloy-4." J. Nucl. Mater. Vol. 22.pp. 292-303. 1967
37

I
14. Kammenzind, B.F., et al. "HydrogenPickup and Redistribution in Alpha-Annealed Zircaloy-4," Zirconium in theNuclear Industry: Proc. EleventhInternational Symposium, ASTM STP1295, E. R. Bradley and G. P. Sabol,Eds., American Society for Testing andMaterials: Conschocken, PA. pp. 338-370. 1996.
15. Commercial Radioactive WasteManagement System M & 0 2000c."Clad Degradation - Summary andAbstraction."ANL-WIS-MD-000007 REV 00 ICN 01.Las Vegas, Nevada: CRWMS M&O.ACC: MOL.20001024.0229, Dec 2000.
16. O'Donnell, G. M., H. H. Scott, and R. 0.Meyer. "A New Comparative Analysisof LWR Fuel Designs." NUREG-1754.Nuclear Regulatory Commission:Washington, DC. Dec. 2001
17. Fink, J. K., M. C. Chasnov, and L. L.Leibowitz. "Thermodynamic Propertiesof U0 2." ANL-CEN-RSD-80-3.Argonne National Laboratory: Argonne,IL. April 1981
18. Guenther, R. J., et al. "Characterizationof Spent Fuel Approved TestingMaterial-ATM-106." PNL-5109-106,Pacific Northwest Laboratory: Richland,WA. Oct. 1988.
19. Northwood, D. 0. and U. Kosasih."Hydride and Delayed HydrogenCracking in Zirconium and its Alloys."Inter. Met. Rev. Vol. 28. No.2. p. 92.1983.
20. Bouffioux, P. and L Lefras. '"ffect ofHydriding on the Residual Cold WorkRecovery and Creep of Zircaloy 4Cladding Tubes." Proc. LWR FuelPerformance Meeting, Park City, Utah.American Nuclear Society: LaGrangePark, IL. April 10, 2000.
21. Adamson, R. B. "Irradiation Growth ofZircaloy," Proc. 3Pl Int. Conf. Zircaloy inthe Nuclear Industry, Quebec City,Canada, August 10-12, 1976, ASTMSTP 633, p. 326, A. L. Lowe and G. W.Parry, Eds., American Society forTesting and Materials: Conschocken,PA. 1977
22. Tate, D. R. Trans. Am. Soc. Met.. Vol.35. 1945.
23. Nuclear Regulatory Commission (U.S.),Spent Fuel Project Office. "Interim StaffGuidance - 11, Rev. 2 - CladdingConsiderations for the Transportationand Storage of Spent Fuel." Washington,D.C. August 2002.
38

APPENDIX A
FUEL ROD SECTIONING DIAGRAMS
Figures
A.1 Cutting Diagram for the Characterization of Mid-Segment of Rod H9 fromSurry-2 Assembly TII ................................................... A-3
A.2 Cutting Diagram for the Characterization of Second-from-Top Segmentof Rod H9 from Surny-2 Assembly TII ............................................... A-4
A.3 Cutting Diagram for the Characterization of Mid-Segment of Rod G6 fromSurry-2 Assembly TII ................................................... A-4
A.4 Cutting Diagram for the Characterization of Second-from-Top Segmentof Rod G6 from Surny2 Assembly TII ............................................... A-5
A-l

Each of the three fuel rods was cut intofive segments at ANL-W and shipped toANL-E for further fuel and claddingcharacterization, as well as creep testing.The cutting diagrams forcharacterization of rods H9 and G6 areshown in Figs. A.1 to A.4 (dimensionsgiven in inches). For Figs. A.1 and A.3,the fuel column midplane is 178 mm(7 in.) from the segment bottom andgrid spacer 4 is 330 mm (13 in.) from thesegment bottom. Therefore, thesesegments represent the top 330 mm(13 in.) of Grid Span 3 and the bottom
580 mm (23 in.) of Grid Span 4. Thesegments shown in Figs. A.2 and A.4contain the rest of Grid Span 4 (=100
mm) and all of Grid Span 5. Themetallography and hardness are fromsamples C4 (near midplane) and C12(2500 mm or 20 in. above midplane).The hydrogen analyses are from samples(C5 and C13) next to these. Themetallography and hardness sample B2(=1000 mm or 40 in. above themidplane) is from Section 591C. Thehydrogen analyses sample B3, isadjacent to sample B2. The samecharacterization cutting diagrams havebeen established for the middle (592C)and second-from-top (592B) segments ofRod G6.
Sectioning Diagrar for the Mid-Segrent of Surry Rod H9 (A/G5910H. C. Tsai, IPS-373-00-00,. 3/20/01
Fig. A.1 Cutting Diagram for the Characterization of Mid-Segment of Rod H9 fromSurry-2 Assembly TIll. C4 (metallography and microhardness) and C5(hydrogen analysis) are located at about the core midplane within Grid Span3. C12 (metallography and microhardness) and C13 (hydrogen analysis) arelocated =500 mm above the fuel midplane within Grid Span 4.
A-3

I
Sectioning Diagram for the 2nd frorm Top Segment of Surry Rod H9 (A/G 591B)
H. C. Tsai, IPS-373-00-00, 10/15/2001
IUTTUI
Fig. A.2 Cutting Diagram for the Characterization of Second-from-Top Segment ofRod H9 from Surry-2 Assembly TI1. B2 (metallography and microhardness)and B3 (hydrogen analysis) are located at 41000 mm above the fuel midplanewithin Grid Span 5.
Sectioning Diagram for the Mid-Segment ofH. C. Tsai, IPS-392-00-00,
Surry Rod G6 (A/G 592C)9/21/01
Dnnrom ti
Wimc -\ ,- 5929 ec _\ /_92~
39M III 3~~~~~~92C4 rl 5912C7
4�ax'r "I~ ar.I
Fig. A.3 Cutting Diagram for the Characterization of Mid-Segment of Rod G6 fromSurry-2 Assembly T1l. C2 (metallography and microhardness) and C3(hydrogen analysis) are located at about the core midplane within Grid Span3. C5 (metallography and microhardness) and C6 (hydrogen analysis) arelocated =500 mm above the fuel midplane within Grid Span 4.
A-4

Sectioning Diagram for the 2nd from Top Segmrent of Surry Rod G6 (A/G 592B)H. C. Tsai, IPS-373-00-00, 9/24/01
Fig. A.4 Cutting Diagram for the Characterization of Second-from-Top Segment ofRod G6 from Surry-2 Assembly Til. B2 (metallography and microhardness)and B3 (hydrogen analysis) are located at =1000 mm above the fuel midplanewithin Grid Span 5.
A-5

APPENDIX B
PROFILOMETRY
B.1 Methodology .............................................. B-3
B.2 Average Rod Diameter Profiles ............................................... B-4
Table
B.1 Diameter (mm) of Surry Rods Taken from Data at 2-3 m andat 1 m from the Bottom of the Rods ............................................... B-4
Figures
B.1 Average Diameter Profile of Surry Unit No.2 Rod Ti -F7 .B-5
B.2 Average Diameter Profile of Surry Unit No. 2 Rod T I-F8 .B-5
B.3 Average Diameter Profile of Surry Unit No. 2 Rod Ti l-F9 .B-6
B.4 Average Diameter Profile of Surry Unit No. 2 Rod Ti I-G6 ................... B-6
B.5 Average Diameter Profile of Surry Unit No. 2 Rod T I-G7 .B-7
B.6 Average Diameter Profile of Surry Unit No. 2 Rod Ti I-G9 .B-7
B.7 Average Diameter Profile of Surry Unit No. 2 Rod Ti 1-7 .B-8
B.8 Average Diameter Profile of Surry Unit No. 2 Rod Ti I-H9 .B-8
B.9 Average Diameter Profile of Surry Unit No. 2 Rod TI 1-8 .B-9
B.10 Average Diameter Profile of Surry Unit No. 2 Rod Ti 1-9 .B-9
B.11 Average Diameter Profile of Surry Unit No. 2 Rod T 10 i .. B-10
B.12 Average Diameter Profile of Surry Unit No. 2 Rod Ti I-J8 .B-10
B-1

B.1 Methodology
The profile of a rod is simply thedistribution of its apparent diameter as afunction of axial position at a givenangle of rotation. The profile of an as-fabricated rod would be nearly uniform;however, irradiation will causedistortions in the profile. This is trueeven if the profile changes are quitesmall, on the order of only tens ofmicrons. The process of measuring theprofile of a rod is called profilometry,and the device used is called aprofilometer. At ANL-West an ElementContact Profilometer (ECP) is used. Forthe Surry rods, the ECP was conductedat four azimuthal angles (0, 45, 90, and1350) with multiple axial scans todetermine the outer diameter axialprofiles and to quantify ovality. Thescans were performed over an axialregion from -3.1 m axial height to thebottom of the rod at axial intervals notcoarser than 2.5 mm. The ECP wascalibrated at the beginning and end ofevery day of use to a NIST-traceablestandard such that the error is within±0.0051 mm. Because of other factorsassociated with the overall ECP process,HFEF prefers to set error bands of±0.013 mm on the ECP data for full-length LWR rods.
The HFEF ECP generates a profile byallowing a horizontally opposed pair ofprecision linear transducers to lightlytouch the outer surface of the rod. Eachtransducer is tipped with a precision-ground sapphire rod (about 3.18-mmdiameter by 19-mm long) whoselongitudinal axis is perpendicular to theaxis of the rod, creating a tangentialpoint of contact. Two pairs of notchedspring-loaded guide rollers (one 76 mmabove and one 76 mm below the
measurement point) position the rodcorrectly with respect to the line ofaction of the transducers. Small bows inthe direction of the line of action of thetransducers are accommodated bydisplacement of the virtual center of thetransducer pair, and small bows in thedirection of the longitudinal axis of theparallel sapphires are accommodated bythe 19-mm length of the sapphires.Symmetrical placement of the guiderollers about the measurement pointminimizes any profile error caused byinclination of the rod's longitudinalcenterline with the line of action of thetransducers.
A profile is obtained by pulling the rodvertically through the gauging systemand recording the difference between theopposing transducer signals. Whencalibrated with certified plug-gaugestandards, an accurate measure of profilevs. axial and azimuthal position isobtained. No attempt is made totranslate the axial measurementcoordinate (stage z) to a reference on therod itself. Such a translation must beinferred by examining the profile datafor landmark features, such as profilechanges at capsule-to-end-plug welds.All profilometry data are logged on adedicated computer and are distributedas electronic files.
The ECP is installed on a standard HEfEFexamination stage (located at station5M), which provides all the necessarymotions and in-cell support services.The profilometer system is co-locatedwith the bow and length measurementsystem on a common platform mountedto the vertical column of the stage. Only
B- 3

one type of measurement may beperformed at a time.
B.2 AverageProfiles
Rod Diameter averaging was done to determine theminimum, average, and maximumdiameters over the axial region 2-3 mfrom the bottom of the fuel rod (TableB.1). Also given is the average at I mfrom the bottom.
The profilometry traces at 0, 45, 90, and1350 were averaged to generate the plotsshown in Figs. B.1 to B.12. Further
Table B.1 Diameter (mm) of Surry Rods Taken from Data at 2-3 m and at 1 m from theBottom of the Rods
Maximum Average Minimum Average at 1-rnRod (2-3 m) (2-3 m) (2-3 m) Evaluation
mm mm mm mmJ8 10.675 10.672 10.657 10.65010 10.680 10.673 10.655 10.65019 10.677 10.662 10.645 10.64218 10.682 10.675 10.653 10.650H9 10.672 10.667 10.652 10.660H7 10.680 10.671 10.655 10.660G9 10.700 10.690 10.677 10.665F8 10.675 10.663 10.652 10.645F9 10.676 10.669 10.656 10.650G6 10.683 10.671 10.658 10.660G7 10.678 10.671 10.660 10.652F7 10.672 10.665 10.654 10.635
Global 10.700 - 10.645 -
Average 10.679 10.670 10.656 10.651
B- 4

10.74
10.72 As-fabricated Diameter-
210.70
10.68
*j10.66
> 10.64
10.62* Grid Spacer
10.600 500 1000 1500 2000 2500 3000 3500 4000
Elevation from Bottom of Rod, mmn
Fig. B.1 Average Diameter Profile of Surry Unit No.2 Rod Tll-F7
10.74
10.72 tAs-fabricated Diameter
I 10.70
10.68
10.66
< 10.64
10.62* Grid Spacer
10.600 500 1000 1500 2000 2500 3000 3500 4000
Elevation from Bottom of Rod, mm
Fig. B.2 Average Diameter Profile of Surry Unit No. 2 Rod Ti 1-F8
B- 5

I
10.74
10.72 As-fabricated Diameter -
10.70
10.68
10.66
10.64A6 A A A A
10.62* Grid Spacer,10.60
0 500 1000 1500 2000 2500 3000 3500 4000
Elevation from Bottom of Rod, mm
Fig. B.3 Average Diameter Profile of Surry Unit No. 2 Rod Ti1l-F9
10.74.
10.72 tAs-fabricated Diameter
10.70
10.68
10.66
t 10.64A A ~ ~Al A A la
10.62A Grid Spacer
10.60 - I.*.. a. .0 500 1000 1500 2000 2500 3000 3500 4000
Elevation from Bottom of Rod, mm
Fig. B.4 Average Diameter Profile of Surry Unit No. 2 Rod T1 1-G6
B- 6

10.74
10.72 -As-fabricated Diameter
|.10.70
t 10.68
10.66
10.64£ A A A a A
10.62 A Grid Spacer
10.60....................0 500 1000 1500 2000 2500 3000 3500 4000
Elevation from Bottom of Rod, mm
Fig. B.5 Average Diameter Profile of Surry Unit No. 2 Rod Ti 1-G7
10.74.
10.72 - As-fabricated Diameter -
E 10.70
10.68
10.66
4 10.64A A A A A A
10.62* Grid Spacer
10.600 500 1000 1500 2000 2500 3000 3500 4000
Elevation from Bottom of Rod, mm
Fig. B.6 Average Diameter Profile of Surry Unit No. 2 Rod TI 1-G9
B- 7

a)
10.74
10.72
10.70
10.68
10.66
10.64
10.62
.6n10 500 1000 1500 2000 2500 3000 3500 4000
Elevation from Bottom of Rod, mm
Fig. B.7 Average Diameter Profile of Surry Unit No. 2 Rod TI 1-H7
I
a)
10.74
10.72
10.70
10.68
10.66
10.64
10.62
10.600 500 1000 1500 2000 2500 3000 3500 4000
Elevation from Bottom of Rod, mm
Fig. B.8 Average Diameter Profile of Surry Unit No. 2 Rod TI1l-H9
B- 8

EA
:1a)
10.74
10.72
10.70
10.68
10.66
10.64A A . A A
10.62Grid Spacer
10.60... .. ,..| ..... l.......0 500 1000 1500 2000 2500 3000 3500 4000
Elevation from Bottom of Rod, mm
Fig. B.9 Average Diameter Profile of Surry Unit No. 2 Rod Ti 1-I8
e2sx
I)
Co
U)
10.74
10.72
10.70
10.68
10.66
10.64
10.62
1060f0 500 1000 1500 2000 2500 3000 3500 4000
Elevation from Bottom of Rod, mm
Fig. B. 10 Average Diameter Profile of Surry Unit No. 2 Rod TI1l-19
B- 9
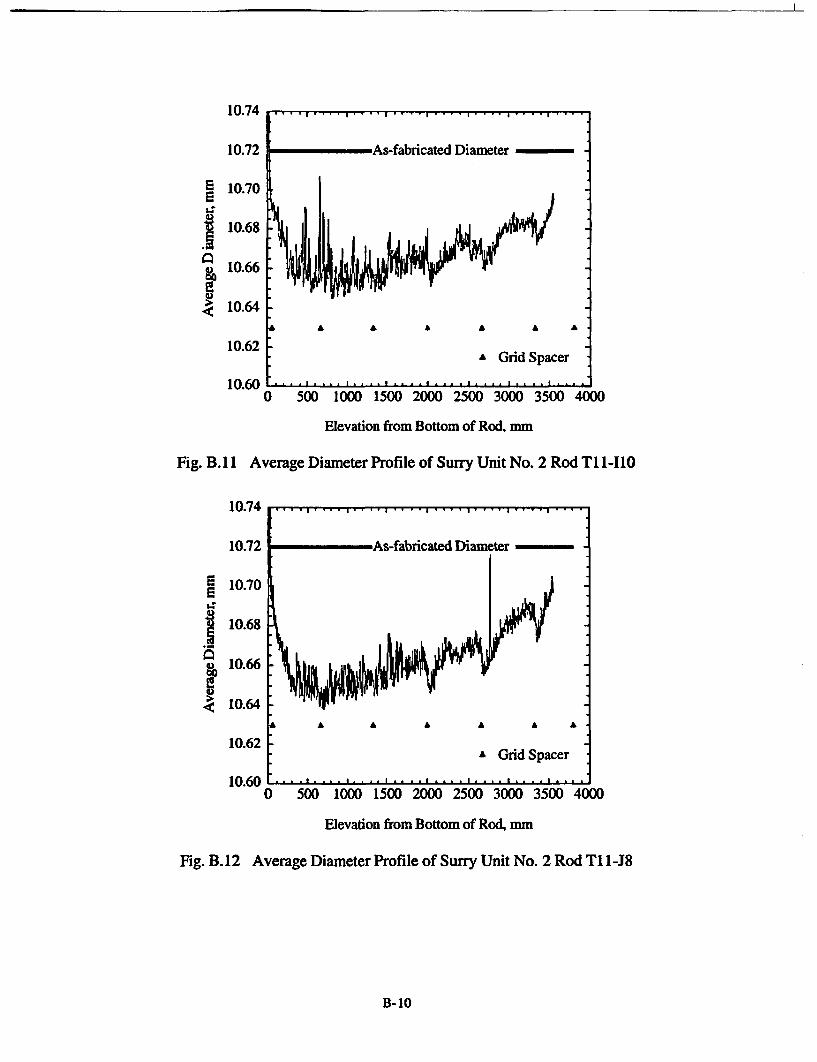
10.74
Ea.9
.1
ba
10.72
10.70
10.68
10.66
10.64
10.62
10.600 500 1000 1500 2000 2500 3000 3500 4000
Elevation from Bottom of Rod, mm
Fig. B.11 Average Diameter Profile of Surry Unit No. 2 Rod T1-I10
10.74
2s
I._
aI-
0
10.72
10.70
10.68
10.66
10.64
10.62
10.600 500 1000 1500 2000 2500 3000 3500 4000
Elevation from Bottom of Rod, mm
Fig. B.12 Average Diameter Profile of Surry Unit No. 2 Rod Ti 1-J8
B- 10

APPENDIX C
FUEL ROD GAS ANALYSIS DATA
C.1 Introduction........................................................................... C-3
C.2 Calibration and Testing Methodology ............................................. C-5
Tables
C.1 Void Volume, Internal Gas Pressure and Fission Gas Releaseof Surry Unit 2 Fuel Rods Irradiated to 35.7 GWd/tU Burnupand Stored for 15 Years in Dry Cask Storage .................................... C4
C.2 Internal Gas Chemical Composition (mol %) of Surry Unit 2 Fuel RodsIrradiated to 35.7 GWd/tU Burnup and Stored for 15 Yearsin Dry Cask Storage ..................................................... C4
C.3 Internal Fission Gas Isotopic Composition (at. %) of Surry Unit 2Fuel Rods Irradiated to 35.7 GWd/tU Burnup and Stored for15 years in Dry Cask Storage ..................................................... C-5
C- 1

C.1 INTRODUCTION
The void volumes and internal gaspressures determined by Gas AssaySample and Recharge (GASR)l aresummarized in Table C.1. The voidvolumes and the internal gas pressures ofthe four fuel rods examined areessentially the same. The void volumesrange from 19.53 to 20.39 cm3 (1.192-1.244 in.3), and the internal gas pressuresrange from 3.39 to 3.56 MPa (498-523psia). The relative errors (i.e., thestandard deviation of the mean dividedby the mean) of the void volumes and ofthe gas pressures are less than 3%. Theinternal gas pressures are approximately0.6 MPa higher than the as-fabricatedgas pressure. The increase in internalgas pressure is similar to that reportedfor PWR fuel rods of the same designand burnup at the time of reactordischarge. Hence, it appears that nosignificant release of fission gas from thefuel occurred during the dry storageperiod.
The chemical and fission gas isotopiccompositions are presented in Tables C.2and C.3, respectively. The Xecomposition is between 1.5 and 3.2mol%, and the Kr fraction is between0.11 and 0.37 mol%. The Xe/Kr ratioranges from 9.0 to 11.4 for the four fuelrods. The fission gas compositions arewithin the range of values reported forPWR fuel rods irradiated to similarburnup, indicating that no significantamount of fission gas was released fromthe fuel during the dry storage period.
The fission gas inventory of fuel rods H9(FA-434) and H7 (FA-512) wasapproximately a factor of two highercompared to that of fuel rods G6 (FA-467) and G9 (FA-719). The isotopicfractions are similar for the four rodsexamined and are within the expecteddistribution for fuel rods with thisburnup.
The fission gas release, for the four fuelrods examined, was calculated from themeasured void volume, internal gaspressure, and gas chemical compositionand from the calculated averageassembly burnup (see Table C.1). Thefission gas release corresponds with thefission gas inventory, being two times ashigh for fuel rods H9 (FA-434) and H7(FA-512) as compared to fuel rods G6(FA-467) and G9 (FA-719). The fissiongas releases for these two sets of rods are=1% and =0.5%, respectively, which iswithin the range of data reported in theliterature.
'R. S. Wisner, 'Hot Fuel Examination FacilityNorth (HFEF/NORTH) Fuel Element PlenumPuncturing and Gas Sampling System,"Proceedings of the 36th Conference on RemoteSystems Technology, Vol. 2, American NuclearSociety, 1988.
C- 3

Table C. 1 Void Volume, Internal Gas Pressure,' b and Fission Gas Release of Surry Unit2 Fuel Rods Irradiated to 35.7 GWd/tU BurnupC and Stored for 15 Years inDry Cask Storage
Fuel Rod ID No. Void Volume Internal Gas Pressure Fission GasReleasee
cm3 in.3 MPa psia %T11-H9 (FA-434) 19.76 1.206 3.56 523 1.08
T1I-G6 (FA-467) 19.53 1.192 3.46 509 0.39
TH1-H7 (FA-512) 20.29 1.238 3.39 498 0.88
T1 1-G9 (FA-719) 20.39 1.244 3.40 499 0.49
aVoid volume and internal gas pressure measurements were obtained at a systemtemperature of 300±1 K.
bRelative error (standard deviation of mean divided by the mean) of void volume andinternal gas pressure measurements was less than 3%.
cAverage assembly burnup as calculated by Dominion Generation.dAs-fabricated internal gas pressure was 2.83 MPa (415 psia).eFission gas release was derived from the measured void volume, internal gas pressure,fission gas composition, and from the calculated assembly average burnup.
Table C.2 Internal Gas Chemical Compositiona (mol %) of Surry Unit 2 Fuel RodsIrradiated to 35.7 GWd/tU Burnupb and Stored for 15 Years in Dry CaskStorage
Fuel Rod H2 He N2 02 Ar CO2 Xe Kr Xe/KrID No. Ratio
T11-H9 0.01c 96.1 0.01 ND 0.26 0.01 3.25 0.36 9.0(FA434) I IIT11-G6 0.01 98.3 0.02 ND 0.33 0.01 1.25 0.11 11.4(FA-467)T 1I-H7 NW 96.7 0.03 ND 0.27 0.01 2.72 0.29 9.4(FA-512)T11-G9 0.01 98.1 0.02 0.01 0.25 0.01 1.50 0.15 10.0(FA-719)aThe relative error (standard deviation of mean divided by the mean) of the chemicalcomposition was <8%, except at very low mole percentage (i.e., <0.03%), for which therelative error was 15%.bAverage assembly burnup as calculated by Dominion Generation.cComposition was <0.01 mol% based on the resolution limit of instrument.dND = not detected
C- 4
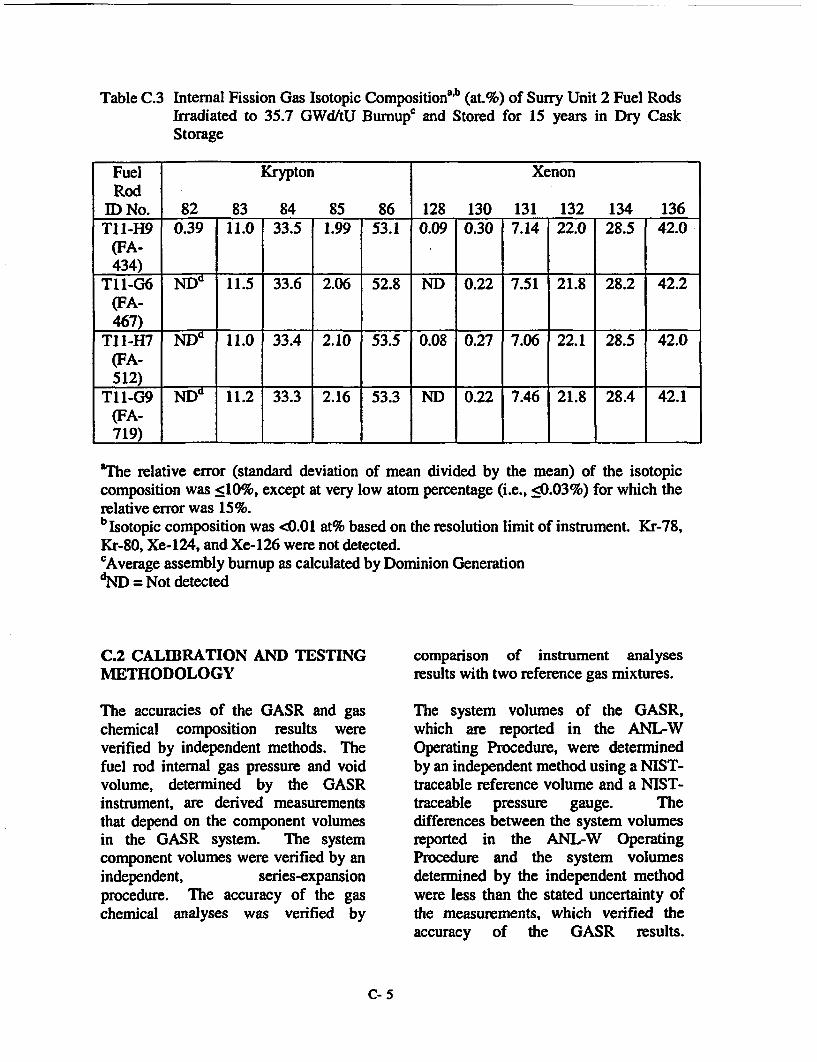
Table C.3 Internal Fission Gas Isotopic Compositionab (at.%) of Surry Unit 2 Fuel RodsIrradiated to 35.7 GWdltU Burnupc and Stored for 15 years in Dry CaskStorage
Fuel Krypton XenonRod
ID No. 82 83 84 85 86 128 130 131 132 134 136T 1-H9 0.39 11.0 33.5 1.99 53.1 0.09 0.30 7.14 22.0 28.5 42.0
(FA-434)h _
T11-G6 ND" 11.5 33.6 2.06 52.8 ND 0.22 7.51 21.8 28.2 42.2(FA-467)
TI I-H7 ND 1 1.0 33.4 2.10 53.5 0.08 0.27 7.06 22.1 28.5 42.0(FA-512)
T1-G9 NW 11.2 33.3 2.16 53.3 ND 0.22 7.46 21.8 28.4 42.1(FA-7 1 9 ) _ _ _ _ _ _ _ _ _ _ _ _ _ _ _ _ _ _ _ _ _ _ _ _ _ _
"The relative error (standard deviation of mean divided by the mean) of the isotopiccomposition was <10%, except at very low atom percentage (i.e., -<0.03%) for which therelative error was 15%.b Isotopic composition was <0.01 at% based on the resolution limit of instrument. Kr-78,Kr-80, Xe-124, and Xe-126 were not detected.cAverage assembly burnup as calculated by Dominion GenerationdND = Not detected
C.2 CALIBRATION AND TESTINGMETHODOLOGY
comparison of instrument analysesresults with two reference gas mixtures.
The accuracies of the GASR and gaschemical composition results wereverified by independent methods. Thefuel rod internal gas pressure and voidvolume, determined by the GASRinstrument, are derived measurementsthat depend on the component volumesin the GASR system. The systemcomponent volumes were verified by anindependent, series-expansionprocedure. The accuracy of the gaschemical analyses was verified by
The system volumes of the GASR,which are reported in the ANL-WOperating Procedure, were determinedby an independent method using a NIST-traceable reference volume and a NIST-traceable pressure gauge. Thedifferences between the system volumesreported in the ANL-W OperatingProcedure and the system volumesdetermined by the independent methodwere less than the stated uncertainty ofthe measurements, which verified theaccuracy of the GASR results.
C- 5

I
Therefore, the system volumes reportedin the ANL-W Operating Procedurewere used for data reduction of the gasassay sample analysis.
The accuracy of the gas chemicalanalyses was verified by comparison ofinstrument analysis results with theNIST-certified composition of tworeference gas mixtures. The gasmixtures were selected to bracket the
range of fission gas compositionsexpected for a PWR fuel rod similar indesign and burnup to the Surry fuel rodsthat were examined. The compositionswere nominally 4.0%Xe-0.4%Kr-bal Heand 0.4%Xe-0.004%Kr-bal He. The gaschemical analyses were within the stateduncertainty of the measurements, whichverified the accuracy of the massspectrometry results.
C- 6

APPENDIX D
METALLOGRAPHIC DATA
Tables
D.1 Summary of Hydrogen Content for Surry Rod H9 Cladding ..................... D-3
D.2 Summary of Hardness Data for Surry Rod H9 Cladding ......................... D-4
Figures
Transverse Micrographs of the Fuel
D.1 through D.3 - Cross sections for H9 fuel and cladding at approximatelythe fuel midplane, a location -500 mm above the fuel midplane,and a location =1000 mm above the fuel midplane ................................. D-5
D.4 and D.5 - Cross sections for G6 fuel and cladding at approximately thefuel midplane and at a location -500 mm above the fuel midplane ............... D-8
Cladding
Inner-surface Oxide MicrographsO
D.6 Inner-surface oxide layer at the fuel-cladding interface at oneapproximate midplane circumferential location for Rod H9 ...................... D-10
D.7 and D.8 - Inner surface oxide layer at four circumferentiallocations at =500 mm above the fuel midplane for Rod H9 ....................... D-1 1
D.9 Inner surface oxide layer at two circumferential locationsat =1000 mmn above the fuel midplane for Rod H9 ................................. D-13
D.10 and D. II - Inner surface oxide layer at four circumferentiallocations at approximately the fuel midplane for Rod G6 ........................ D-14
D.12 and D.13 - Inner surface oxide layer at four circumferentiallocations at =500 mm above the fuel midplane for Rod G6 ....................... D-16
For both outer-surface cladding oxide layer and hydrides, there are between two and eight locationsaround the circumference that are imaged for each axial location. These are designated Area 1 through 8
D-1
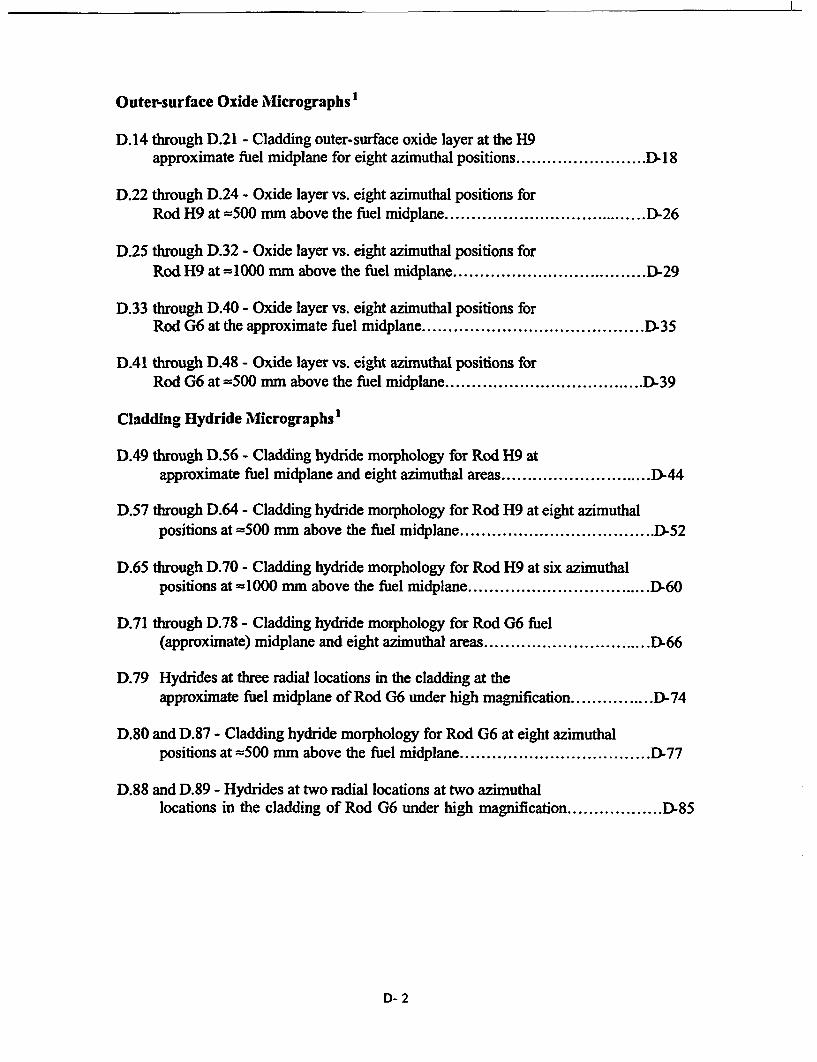
Outer-surface Oxide Nficrographs 1
D.14 through D.21 - Cladding outer-surface oxide layer at the H9approximate fuel midplane for eight azimuthal positions ......................... )- 18
D.22 through D.24 - Oxide layer vs. eight azimuthal positions forRod H9 at =500 mm above the fuel midplane ....................................... D-26
D.25 through D.32 - Oxide layer vs. eight azimuthal positions forRod H9 at =1000 mm above the fuel midplane ..................................... D-29
D.33 through D.40 - Oxide layer vs. eight azimuthal positions forRod G6 at the approximate fuel midplane .......................................... a35
D.41 through D.48 - Oxide layer vs. eight azimuthal positions forRod G6 at =500 mm above the fuel midplane ...................................... D-39
Cladding Hydride Micrographs I
D.49 through D.56 - Cladding hydride morphology for Rod H9 atapproximate fuel midplane and eight azimuthal areas ............................. D-44
D.57 through D.64 - Cladding hydride morphology for Rod H9 at eight azimuthalpositions at 500 mm above the fuel midplane ..................................... D52
D.65 through D.70 - Cladding hydride morphology for Rod H9 at six azimuthalpositions at =1000 mm above the fuel midplane ................................... D-60
D.71 through D.78 - Cladding hydride morphology for Rod G6 fuel(approximate) midplane and eight azimuthal areas ................................ a66
D.79 Hydrides at three radial locations in the cladding at theapproximate fuel midplane of Rod G6 under high magnification ................ D-74
D.80 and D.87 - Cladding hydride morphology for Rod G6 at eight azimuthalpositions at =500 mm above the fuel midplane ................................. D-77
D.88 and D.89 - Hydrides at two radial locations at two azimuthallocations in the cladding of Rod G6 under high magnification .................. D-85
D- 2

Table D.1 Summary of Hydrogen Content (wppm) for Surry Rod H9 Cladding
Sample 591C-C5(=25 mm abovefuel midplane)Oxide = 24 pm
334237237238233221242240
Sample 591C-C13(=530 mm abovefuel midplane)Oxide = 33 pm
345294284304319276294283
Sample 591B-B3(=1020 mm above
fuel midplane)Oxide = 40 Am
25226123327326225124924624027224627025513
Average =Std Dev =
24835
30023
D-3

Table D.2 Summary of Hardness Data for Surry Rod H9 Cladding
591C4 Vickers Hardness (DPH)
Inside edge
Outside edge
O' 901 1801 2700232 230 24423f 23 24A 23424 2 243 24423A 23 23N 23324( 24 244 23823 233 233 248231 245 241 233231 24 238
250234 24C- 2411 239
Std Deviation ___ I _5 6pverall Avg. I 2391pverall SD I I
591C12 Vickers Hardness (DPH)
Inside edge
Outside edge
0 900 180 270'
221 221 23 211244 244 2 23C23 2 241 2 221244 231 23C 22225C 248 249 23024 237 228 22224 237 245 23323 255 233238 239
Avg 1 235 238 24[ 225Std Deviation Ia g s 8
pverall Avg. I 2361Dverall SD I 101
591B2 Vickers Hardness (DPH)
Inside edge
Outside edge
o1 901 180" 270°
2212 240 213 246237 225 206 233234 246 19 238241 24 21 249250 240 24 230240 241 20 244243 2!M 19 240245 = __ 253
Avg 1 238 24' 2121 243Std Deviation 8 11 A 7|
l3verall Avg. 1 2341pverall SD | 1
D-4

Fig. D.1 Cross-sectional mosaic of Rod H9 at the approximate fuel midplane.JPG file = 591C4 Fuel Mosaic.
D-5

St~~~~~~~~~~~
Fig. DI Cross-sectional mosaic of Rod H9 at =500 mm above the fuel midplane.
JPG file = 591C12 Fuel Mosaic.
D-6

-r.
Fig. D.3 Cross-sectional mosaic of Rod H9 at lOOO mm above the fuel midplane.JPG file = 591B2 Fuel Mosaic.
D-7

Fig. D.4 Cross-sectional mosaic of Rod G6 at the approximate fuel midplane.
Fig. D.4 Cross-sectional mosaic of Rod G6 at the approximate fuele midplane.JPG file = 592C4 Fuel Mosaic. 703341
D-8

Fig. D.5 Cross-sectional mosaic of Rod G6 at W500 mm above the fuel midplane.JPG file = 592C12 Fuel Mosaic. ET7043342
D-9

n
702029 591 C4
Fig. D.6 Cross-sectional view of Rod H9 fuel-cladding interface and cladding inner-surface oxide layer located at about the midplane (area 4). Scale marker =
50 jim. JPG file = 591C4 ID Oxide.
D-1O
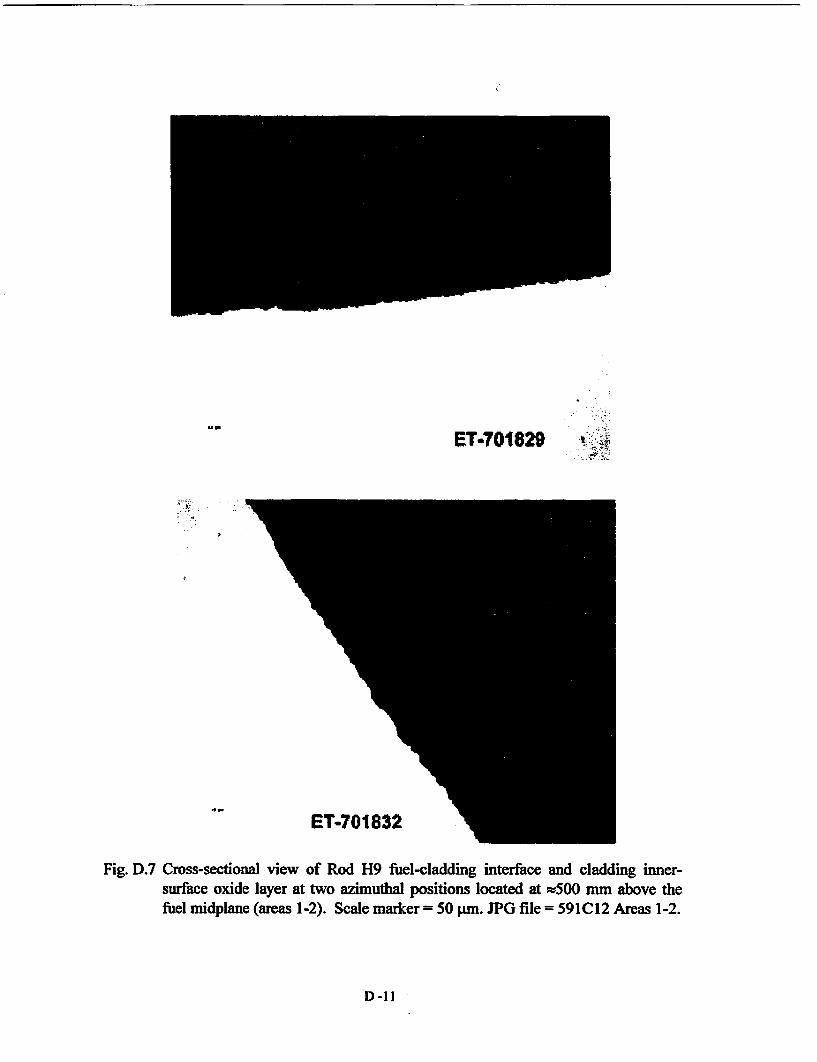
ET-701829
.0_
Fig. D.7 Cross-sectional view of Rod H9 fuel-cladding interface and cladding inner-surface oxide layer at two azimuthal positions located at s500 mm above thefuel midplane (areas 1-2). Scale marker = 50 pm. JPG file = 591C12 Areas 1-2.
D-11

-
ET'-701817
ET-701820
Fig. D.8 Cross-sectional view of H9 fuel-cladding interface at two azimuthal positionslocated at m5OO mm above the fuel midplane (areas 34). Scale marker =50 jum. JPG file = 59IC12 ID Oxide Areas 34.
D-12
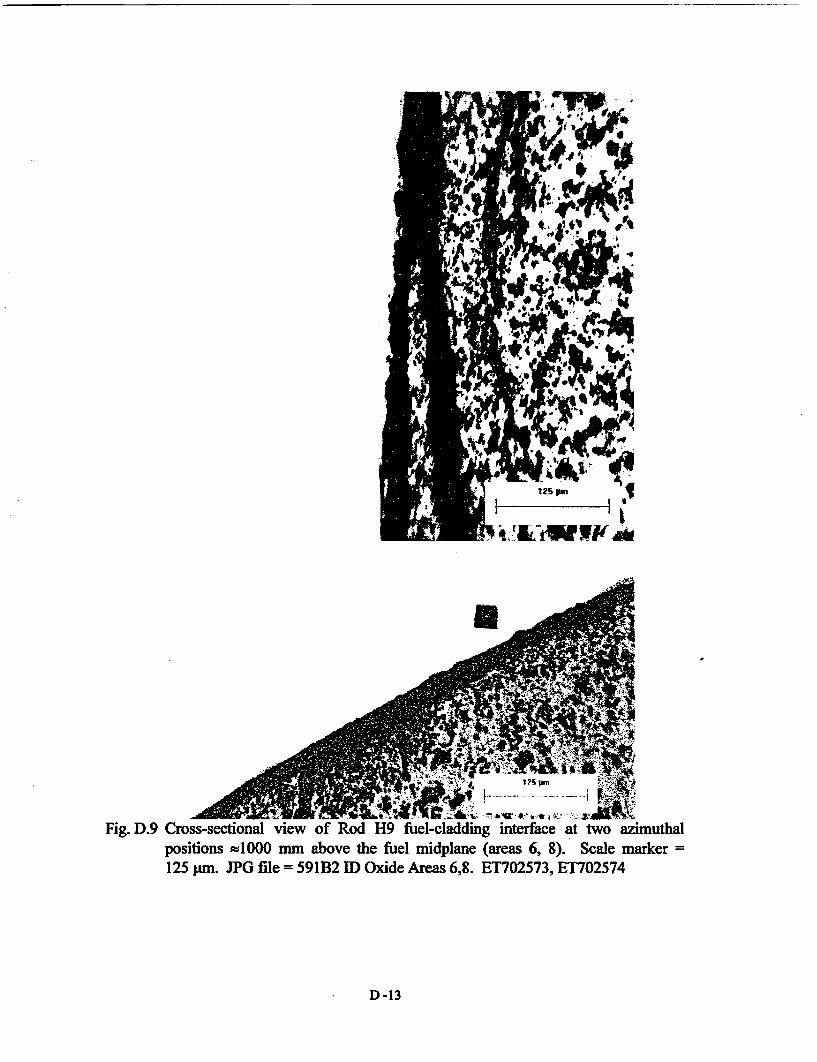
1 7% pm
_H- * - - M a SWFig. D.9 Cross-sectional view of Rod H9 fuel-cladding interface at two azimuthal
positions =1000 mm above the fuel midplane (areas 6, 8). Scale marker =125 pm. JPG file = 591B2 ID Oxide Areas 6,8. ET702573, ET702574
D -13

Fig. D.10 Cross-sectional view of Rod G6 fuel-cladding interface and cladding inner-surface oxide layer at two azimuthal positions located at the approximate fuelmidplane (areas 1-2). Scale marker= 50 jmn.JPG file = 592C4 ID Oxide Areas 1, 2. ET703240, ET703241
D-14

Fig. D.1 1 Cross-sectional view of Rod G6 fuelcladding interface and cladding inner-surface oxide layer at two azimuthal positions at the approximate fuelmidplane (areas 3-4). Scale marker= 50 gim.JPG file = 592C4 ID Oxide Areas 3,4. ET703242, ET703243
D -15

Fig. D.12 Cross-sectional view of Rod G6 fuel-cladding interface and/or cladding innersurface oxide layer at two azimuthal positions located at f500 mm above thefuel midplane (areas 2-4). Scale marker = 100 gm.JPG file = 592C12 ID Oxide Areas 2,4. ET7031 11, ET703117
D-16
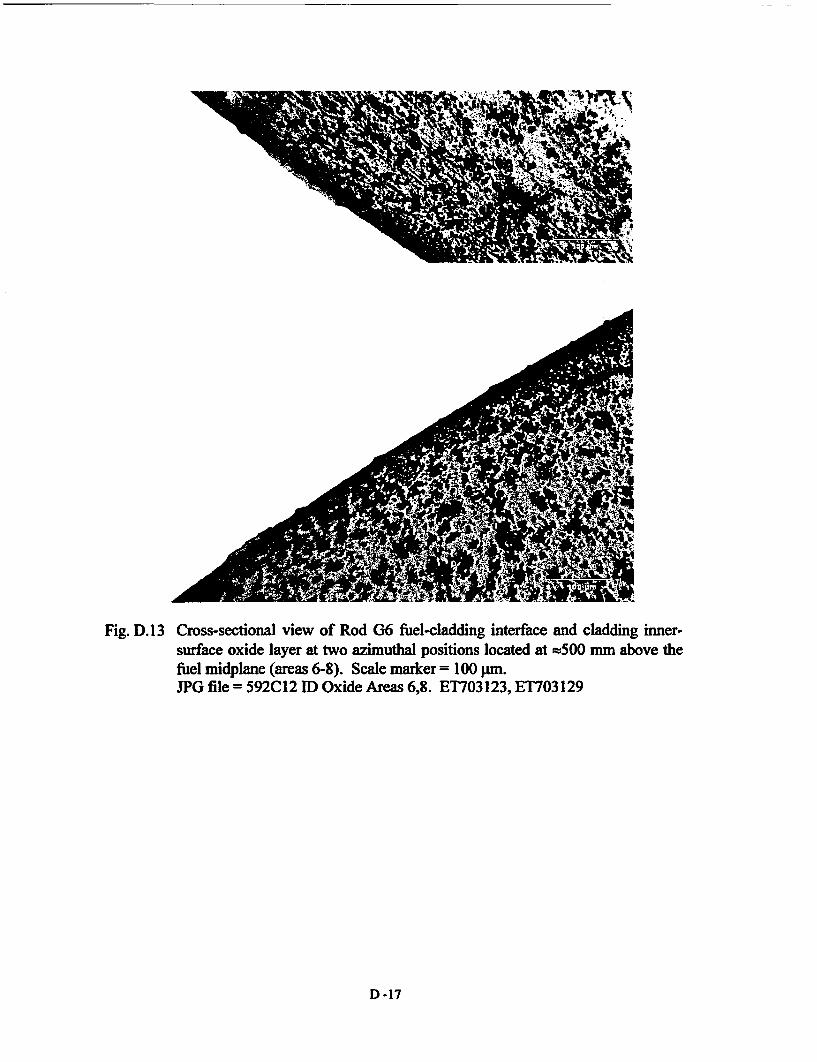
Fig. D.13 Cross-sectional view of Rod G6 fuel-cladding interface and cladding inner-surface oxide layer at two azimuthal positions located at =500 mm above thefuel midplane (areas 6-8). Scale marker = 100 pr.JPG file = 592C12 ID Oxide Areas 6,8. ET703123, ET703129
D -17

I
Fig. D.14 Cross-sectional view of Rod H9 cladding outer-surface oxide layer at theapproximate fuel midplane (area 1). Scale marker= 50 ptm.JPG file = 591C4 OD Oxide Area 1.
D-18

. F..
Fig. D.15 Cross-sectional view of Rod H9 cladding outer-surface oxide layer at theapproximate fuel midplane (area 2). Scale marker = 50 pm.JPG file = 591C4 OD Oxide Area 2.
D -19

Fig. D.16 Cross-sectional view of Rod H9 cladding outer-surface oxide layer at theapproximate fuel midplane (area 3). Scale marker = 50 pm.
JPG file = 591C4 OD Oxide Area 3.
D-20
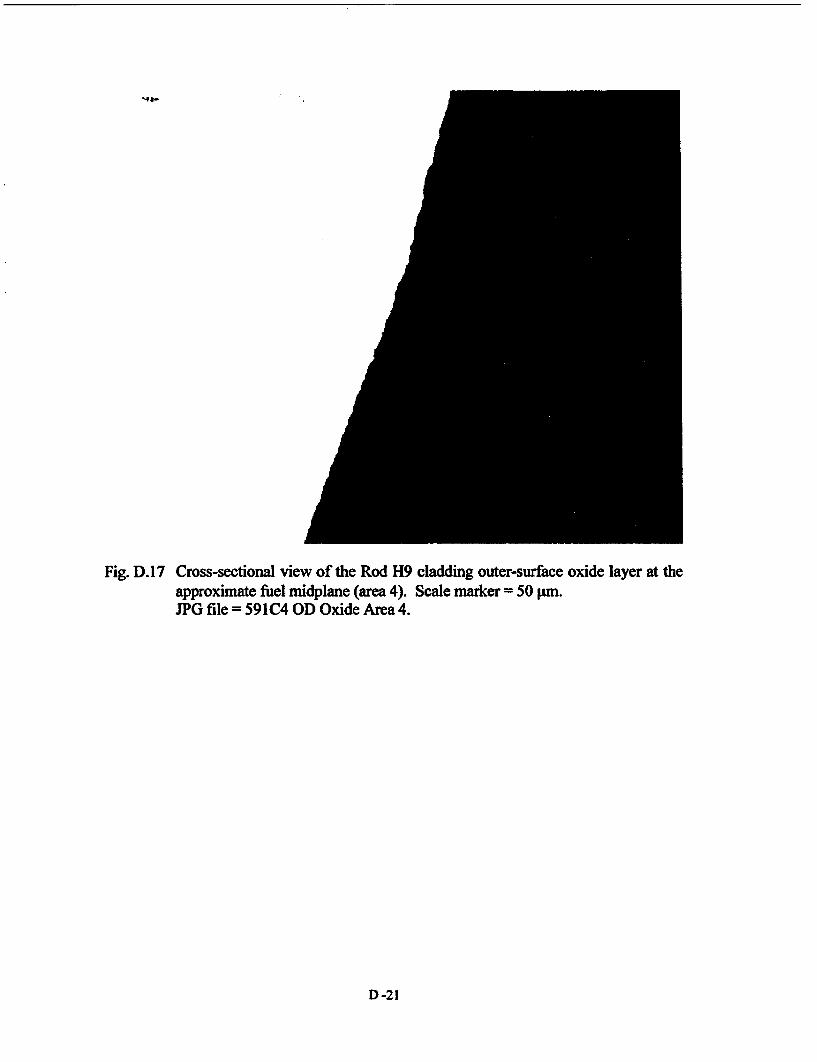
*4 a-
Fig. D.1 7 Cross-sectional view of the Rod H9 cladding outer-surface oxide layer at theapproximate fuel midplane (area 4). Scale marker = 50 pm.JPG file = 591C4 OD Oxide Area 4.
D -21
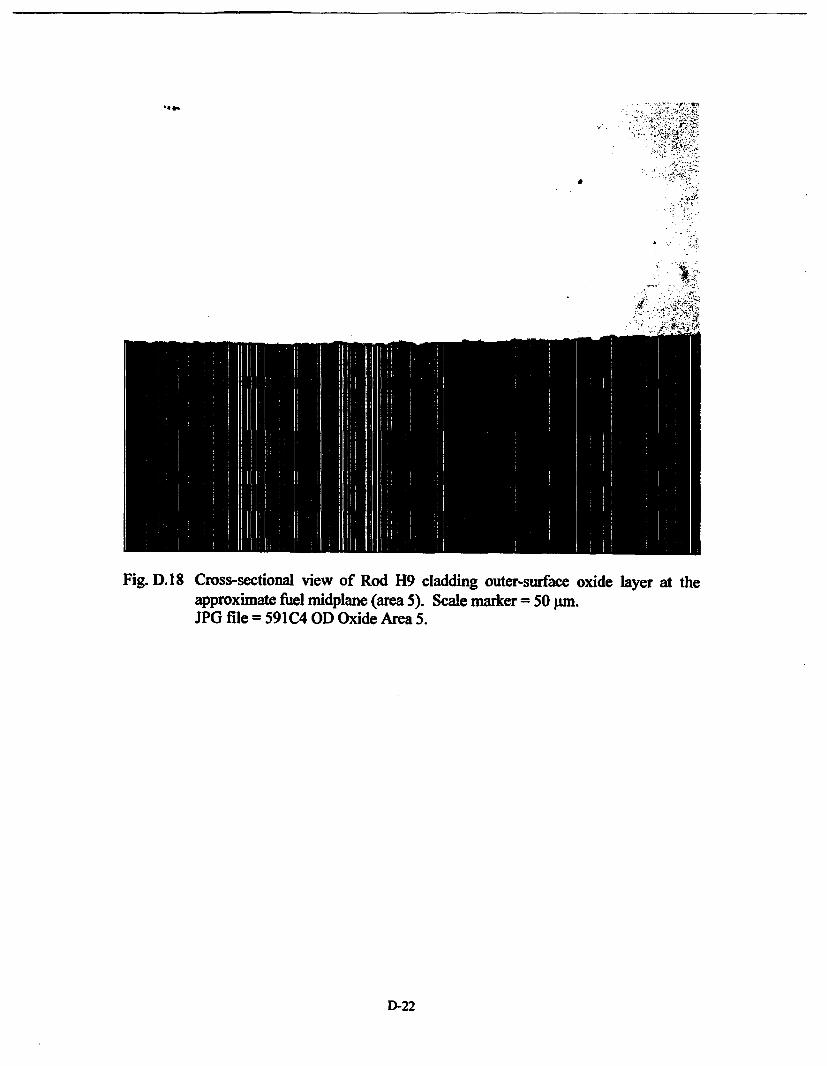
I
*4 I-
Fig. D. 18 Cross-sectional view of Rod H9 cladding outer-surface oxide layer at theapproximate fuel midplane (area 5). Scale marker= 50 pm.JPG file = 591C4 OD Oxide Area 5.
D-22

1 -H
%4 .--
-9,
Fig. D. 19 Cross-sectional view of Rod H9 cladding outer-surface oxide layer at theapproximate fuel mildplane (area 6). Scale marker = 50 pam.JPG file = 591C4 OD Oxide Area 6.
D -23

Fig. D.20 Cross-sectional view of Rod H9 cladding outer-surface oxide layer at theapproximate fuel midplane (area 7). Scale marker= 50 pm.JPG file = 591C4 OD Oxide Area 7.
D-24

Fig. D.21 Cross-sectional view of Rod H9 cladding outer-surface oxide layer at theapproximate fuel midplane (area 8). Scale marker = 50 pm.JPG file = 591C4 OD Oxide Area 8.
D -25

ET-701837
ET-701834
ET-701831
Fig. D.22 Cross-sectional view of Rod H9 cladding outer-surface oxide layer at,500 mm above the fuel midplane (areas 1-3). Scale marker = 50 Am.JPG file = 591C12 OD Oxide Area 1-3.
D-26

a
ET-701822
ET-701825I,
ET-701828
Fig. D.23 Cross-sectional view of Rod H9 cladding outer-surface oxide layer atf500 mm above the fuel midplane (areas 4-6). Scale marker = 50 pn.JPG file = 591C12 OD Oxide Area 4-6.
D -27

ET-701812
ET-701816
. 45
Fig. D.24 Cross-sectional view of Rod H9 cladding outer-surface oxide layer at=500 mm above the fuel midplane (areas 7-8). Scale marker = 50 pm.JPG file = 591C12 OD Oxide Area 7-8.
D-28

Fig. D.25 Cross-sectional view of Rod H9 cladding outer-surface oxide layer at'-1000 mm above the fuel midplane (area 1). Scale marker = 50 pm.JPG file = 591B2 OD Oxide Area 1. ET702544.
Fig. D.26 Cross-sectional view of Rod H9 cladding outer-surface oxide layer at#1000 mm above the fuel midplane (area 2). Scale marker = 50 pm.JPG file = 591B2 OD Oxide Area 2. ET702545.
D -29

Fig. D.27 Cross-sectional view of Rod H9 cladding outer-surface oxide layer atsw000 mm above the fuel midplane (area 3). Scale marker = 50 pm.JPG file = 591B2 OD Oxide Area 3. ET702546.
D-30

Fig. D.28 Cross-sectional view of Rod H9 cladding outer-surface oxide layer atm1000 mm above the fuel midplane (area 4). Scale marker = 50 PM.JPG file = 591B2 OD Oxide Area 4. ET702547.
Fig. D.29 Cross-sectional view of Rod H9 cladding outer-surface oxide layer at=1000 mm above the fuel midplane (area 5). Scale marker = 50 pm.JPG file = 591B2 OD Oxide Area 5. ET702548.
D -31
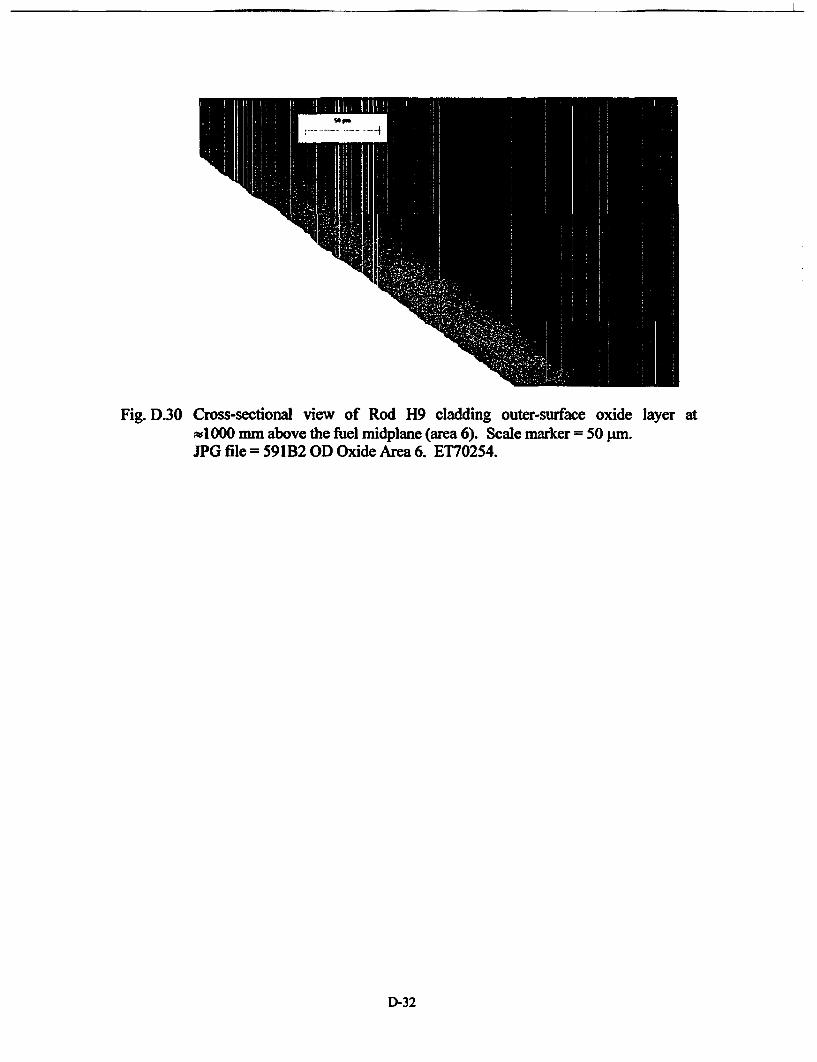
Fig. D.30 Cross-sectional view of Rod H9 cladding outer-surface oxide layer atm1000 mm above the fuel midplane (area 6). Scale marker = 50 pm.JPG file = 59lB2 OD Oxide Area 6. ET70254.
D-32
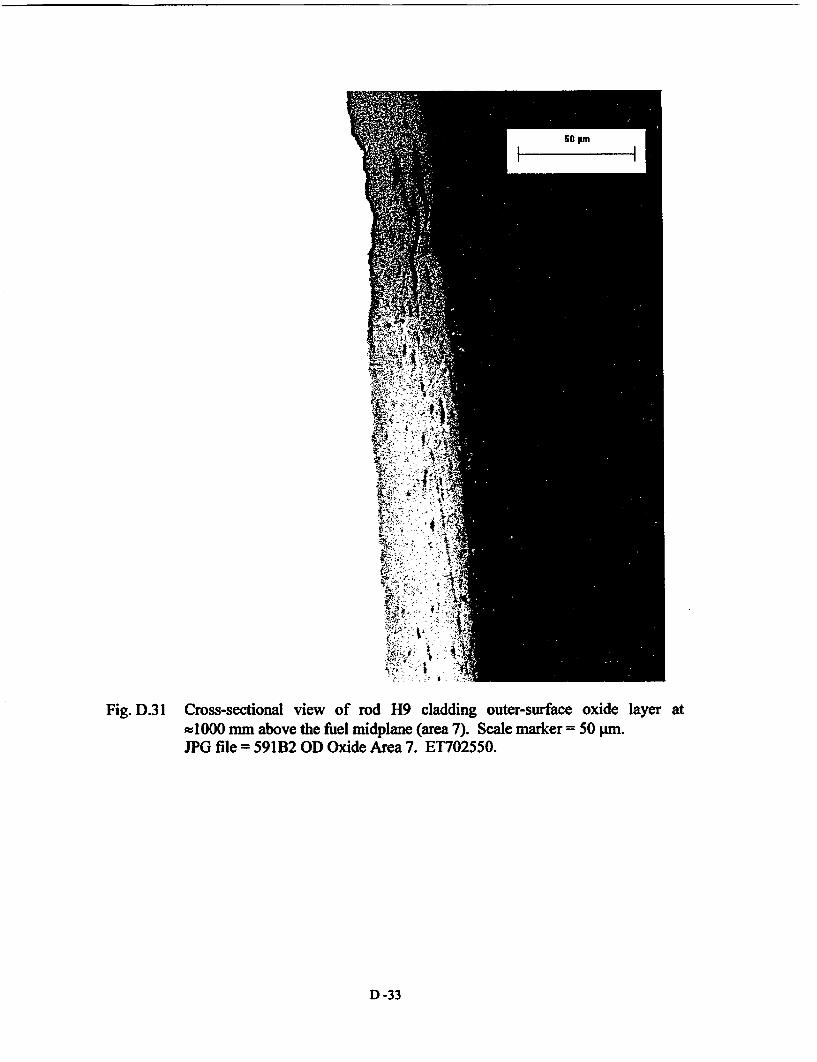
Fig. D.31 Cross-sectional view of rod H9 cladding outer-surface oxide layer at=1000 mm above the fuel midplane (area 7). Scale marker = 50 pm.JPG file = 591B2 OD Oxide Area 7. ET702550.
D -33

*2 2
Fig. D.32 Cross-sectional view of Rod H9 cladding outer-surface oxide layer atz1000 mm above the fuel midplane (area 8). Scale marker = 50 tLm.JPG file = 591B2 OD Oxide Area 8. ET702551.
D-34

100 Pm
Fig. D.33 Cross-sectional view of Rod G6 cladding outer-surface oxide layer at theapproximate fuel midplane (area 1). Scale marker = 100 pm.JPG file = 592C4 OD Oxide Area 1. ET703148.
Fig. D.34 Cross-sectional view of Rod G6 cladding outer-surface oxide layer at theapproximate fuel midplane (area 2). Scale marker = 100 pm.JPG file = 592C4 OD Oxide Area 2. ET703151.
D -35

I
Fig. D.35 Cross-sectional view of Rod G6 cladding outer-surface oxide layer at theapproximate fuel midplane (area 3). Scale marker = 100 pm.JPG file = 592C4 OD Oxide Area 3. ET703 154.
D-36

Fig. D.36 Cross-sectional view of Rod G6 cladding outer-surface oxide layer at theapproximate fuel midplane (area 4). Scale marker = 100 pSn.JPG file = 592C4 OD Oxide Area 4. ET703157.
Fig. D.37 Cross-sectional view of Rod G6 cladding outer-surface oxide layer at theapproximate fuel midplane (area 5). Scale marker = 100 PM.JPG file = 592C4 OD Oxide Area 5. ET703160.
D -37

Fig. D.38 Cross-sectional view of Rod G6 cladding outer-surface oxide layer at theapproximate fuel midplane (area 6). Scale marker = 100 pm.JPG file = 592C4 OD Oxide Area 6. ET703 163.
Fig. D.39 Cross-sectional view of Rod G6 cladding outer-surface oxide layer at theapproximate fuel midplane (area 7). Scale marker = 100 PM.JPG file = 592C4 OD Oxide Area 7. ET703 166.
D-38

Fig. D.40 Cross-sectional view of Rod G6 cladding outer-surface oxide layer at theapproximate fuel midplane (area 8). Scale marker = 100 PM.JPG file = 592C4 OD Oxide Area 8. ET703169.
Fig. D.41 Cross-sectional view of Rod G6 cladding outer-surface oxide layer ats500 mm above the fuel midplane (area 1). Scale marker = 100 pm.JPG file = 592C12 OD Oxide Area 1. ET703107.
Fig. D.42 Cross-sectional view of Rod G6 cladding outer-surface oxide layer atx500 mm above the fuel midplane (area 2). Scale marker = 100 pm.JPG file = 592C12 OD Oxide Area 2. ET7031 10.
D -39

Fig. D.43 Cross-sectional view of Rod G6 cladding outer-surface oxide layer atz50O mm above the fuel midplane (area 3). Scale marker = 100 pm.JPG file = 592C12 OD Oxide Area 3. ET703113.
D-40
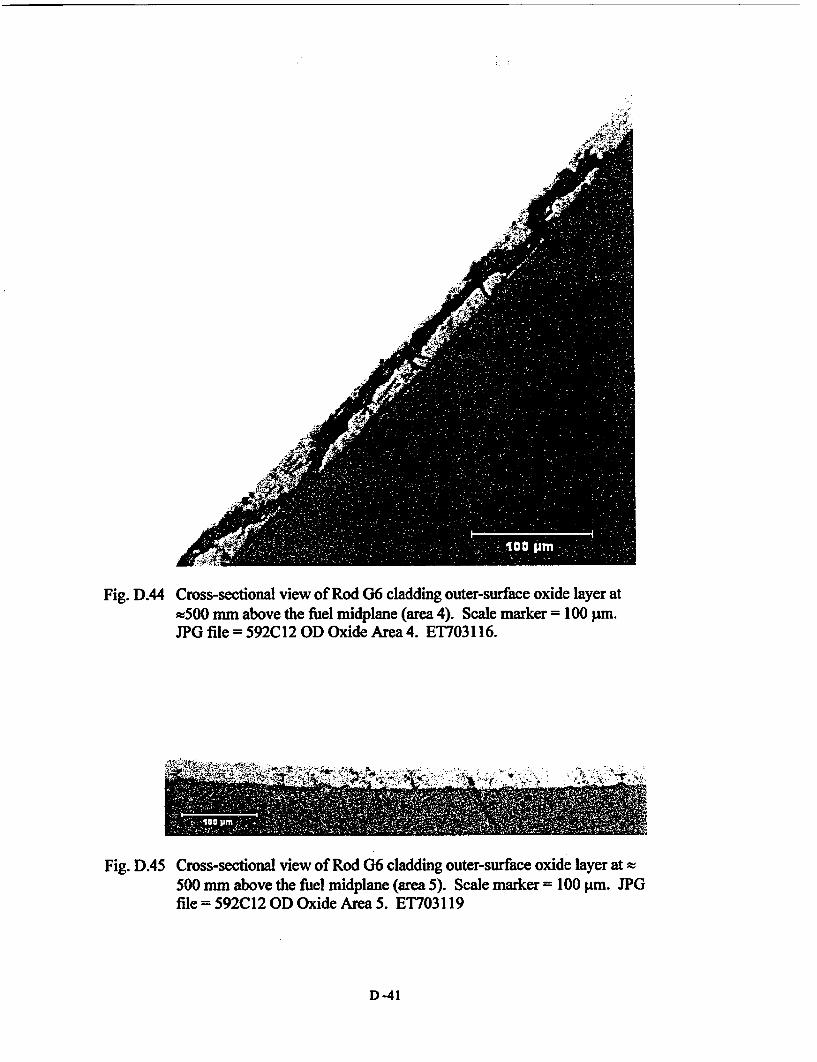
Fig. D.44 Cross-sectional view of Rod G6 cladding outer-surface oxide layer at%500 mm above the fiuel midplane (area 4). Scale marker = 100 PMn.JPG file = 592C12 OD Oxide Area 4. ET703116.
Fig. D.45 Cross-sectional view of Rod G6 cladding outer-surface oxide layer at w500 mm above the fuel midplane (area 5). Scale marker = 100 pm. JPGfile = 592C12 OD Oxide Area 5. ET703119
D -41

I
Fig. D.46 Cross-sectional view of Rod G6 cladding outer-surface oxide layer at#500 mm above the fuel midplane (area 6). Scale marker = 100 PM.JPG file = 592C12 OD Oxide Area 6. ET703122
Fig. D.47 Cross-sectional view of Rod G6 cladding outer-surface oxide layer atx500 mm above the fuel midplane. Scale marker = 100 pm.JPG file = 592C12 OD Oxide Area 7. ET703125
D-42

7it'
Fig. D.48 Cross-sectional view of Rod G6 cladding outer-surface oxide layer at#500 mm above the fuel midplane (area 8). Scale marker = 100 Jim.JPG file = 592C12 OD Oxide Area 8. ET703128.
D 43
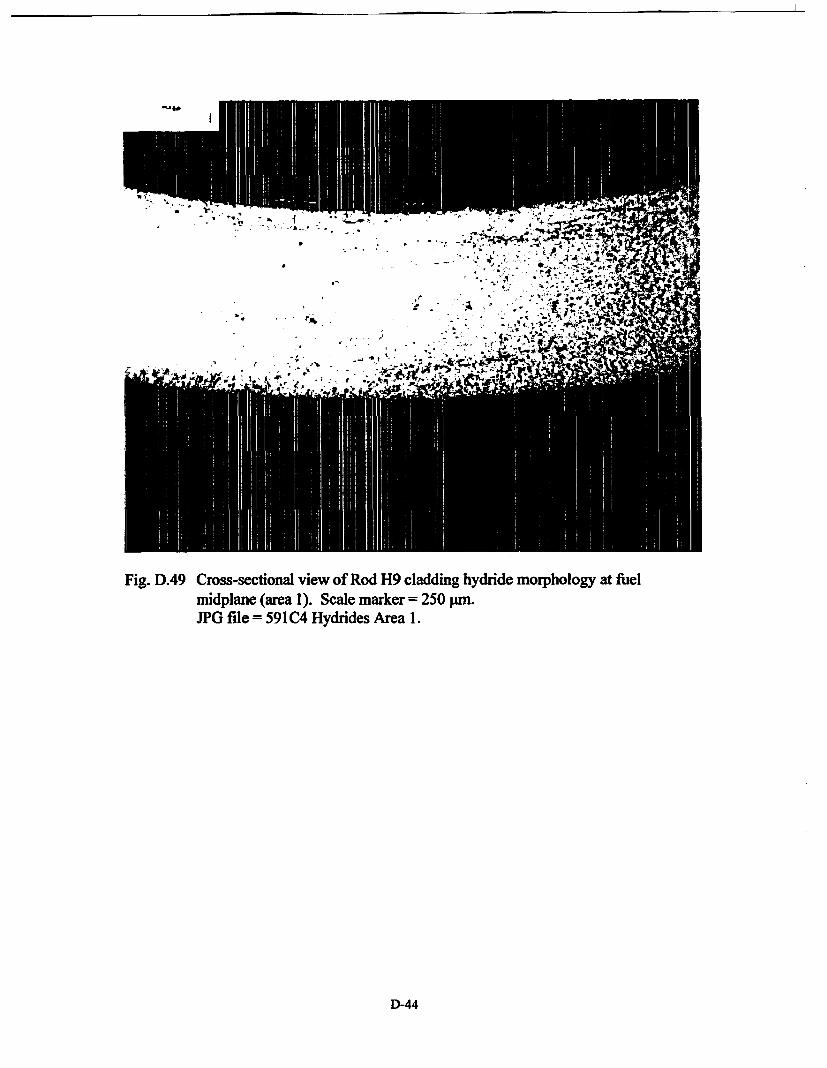
--. i.* .; I
Fig. D.49 Cross-sectional view of Rod H9 cladding hydride morphology at fuelmidplane (area 1). Scale marker = 250 prn.JPG file = 591C4 Hydrides Area 1.
D-44

Fig. D.50 Cross-sectional view of Rod H9 cladding hydride morphology at approximatefuel midplane (area 2). Scale marker = 250 pim.JPG file = 591C4 Hydrides Area 2.
D- 45
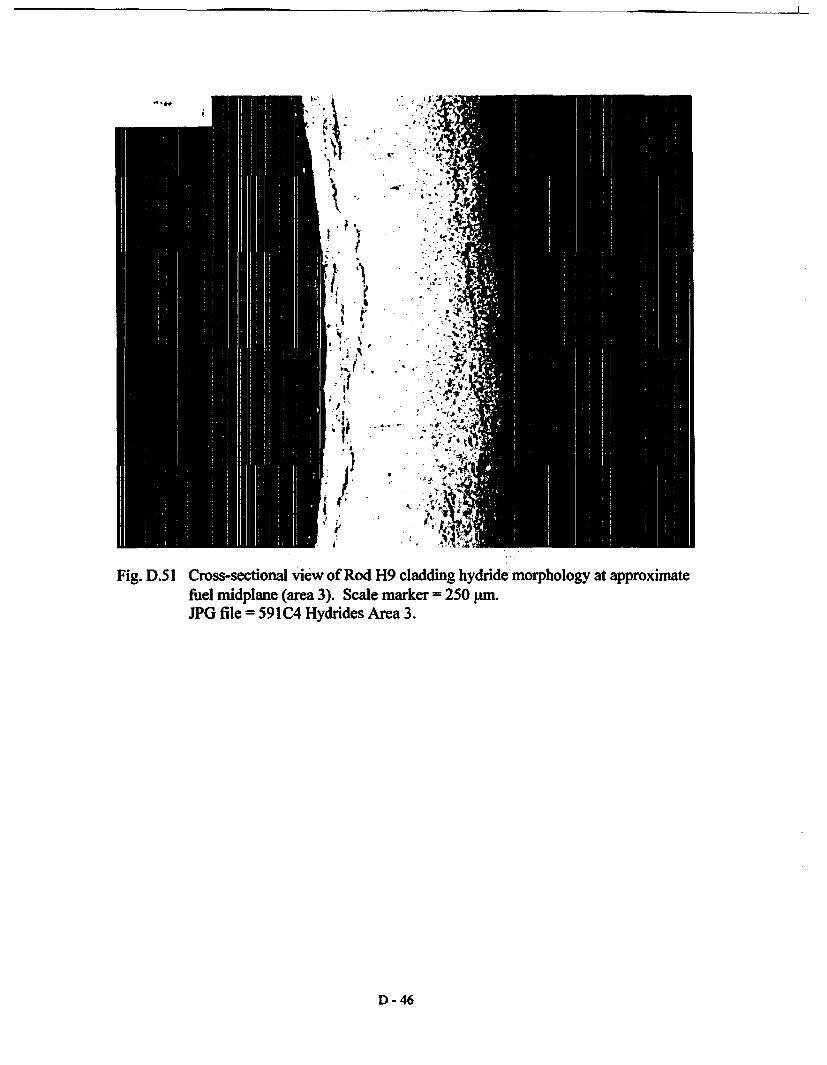
II
Fig. D.5 1 Cross-sectional view of Rod H9 cladding hydride morphology at approximatefuel midplane (area 3). Scale marker = 250 pm.JPG file = 591C4 Hydrides Area 3.
D -46

Fig. D.52 Cross-sectional view of Rod H9 cladding hydride morphology at approximatefuel midplane (area 4). Scale marker = 250 Sun.JPG file = 591C4 Hydrides Area 4.
D- 47

I
.:�, "t., .--lo.
. ! I .
-1 . T
II
A..0- .,-.. ~ ~ 1 U*' 7 Lo
Fig. D.53 Cross-sectional view of Rod H9 cladding hydride morphology at approximatefuel midplane (area 5). Scale marker = 250 gm.JPG file = 591C4 Hydrides Area 5.
D-48

Fig. D.54 Cross-sectional view of Rod H9 cladding hydride morphology at approximatefuel midplane (area 6). Scale marker = 250 pm.JPG file = 591C4 Hydrides Area 6.
D- 49

I
Fig. D.55 Cross-sectional view of Rod H9 cladding hydride morphology at approximatefuel midplane (area 7). Scale marker = 250 pm.JPG file = 591 C4 Hydrides Area 7.
D-50

Fig. D.56 Cross-sectional view of Rod H9 cladding hydride morphology at approximatefuel midplane (area 8).JPG file = 591C4 Hydrides Area 8.
D- 51
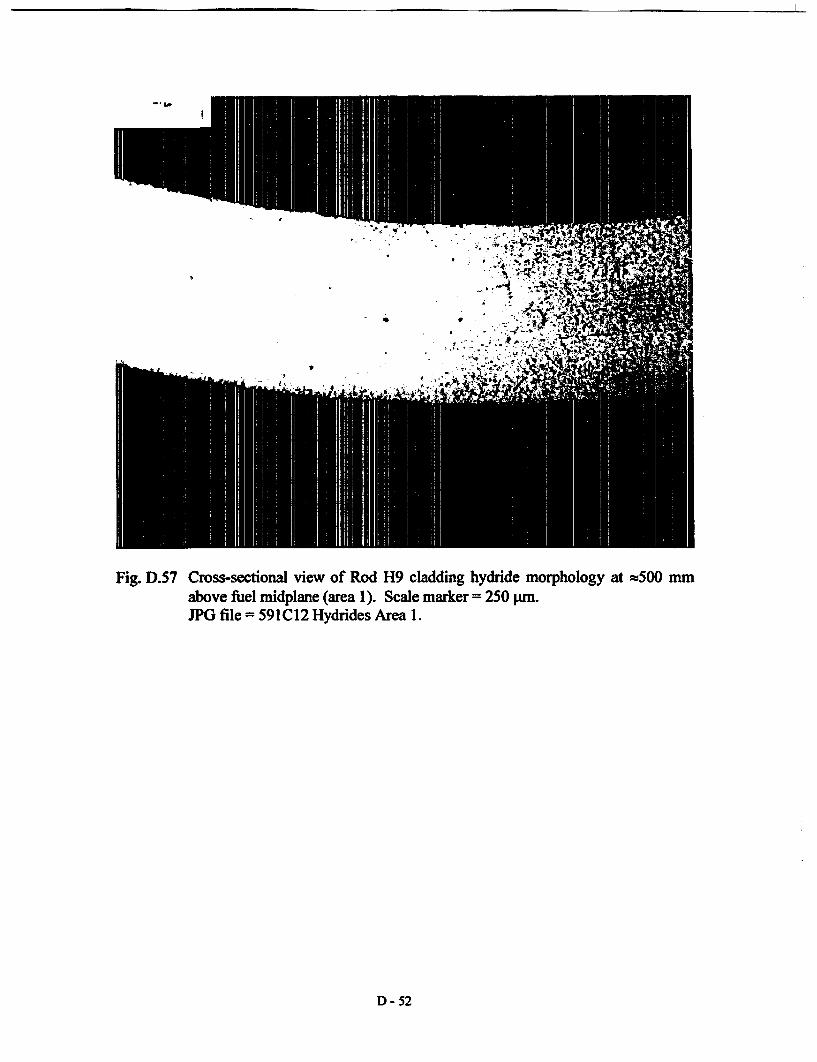
I
Fig. D.57 Cross-sectional view of Rod H9 cladding hydride morphology at z500 mmabove fuel midplane (area 1). Scale marker = 250 pm.JPG file = 591C12 Hydrides Area 1.
D- 52

ET-701863, 864
Fig. D.58 Cross-sectional view of Rod H9 cladding hydride morphology at f5OO mmabove fuel midplane (area 2). Scale marker = 125 jm.JPG file = 591C12 Hydrides Area 2.
D- 53

rfi
Fig. D.59 Cross-sectional view of Rod H9 cladding hydride morphology at =t500 mmabove fuel midplane (area 3). Scale marker = 250 gum.JPG file = 591C12 Hydrides Area 3.
D- 54

ET-701853, 854
Fig. D.60 Cross-sectional view of Rod H9 cladding hydride morphology at r500 mmabove fuel midplane (area 4). Scale marker = 125 pim.JPG file = 591C12 Hydrides Area 4.
D- 55
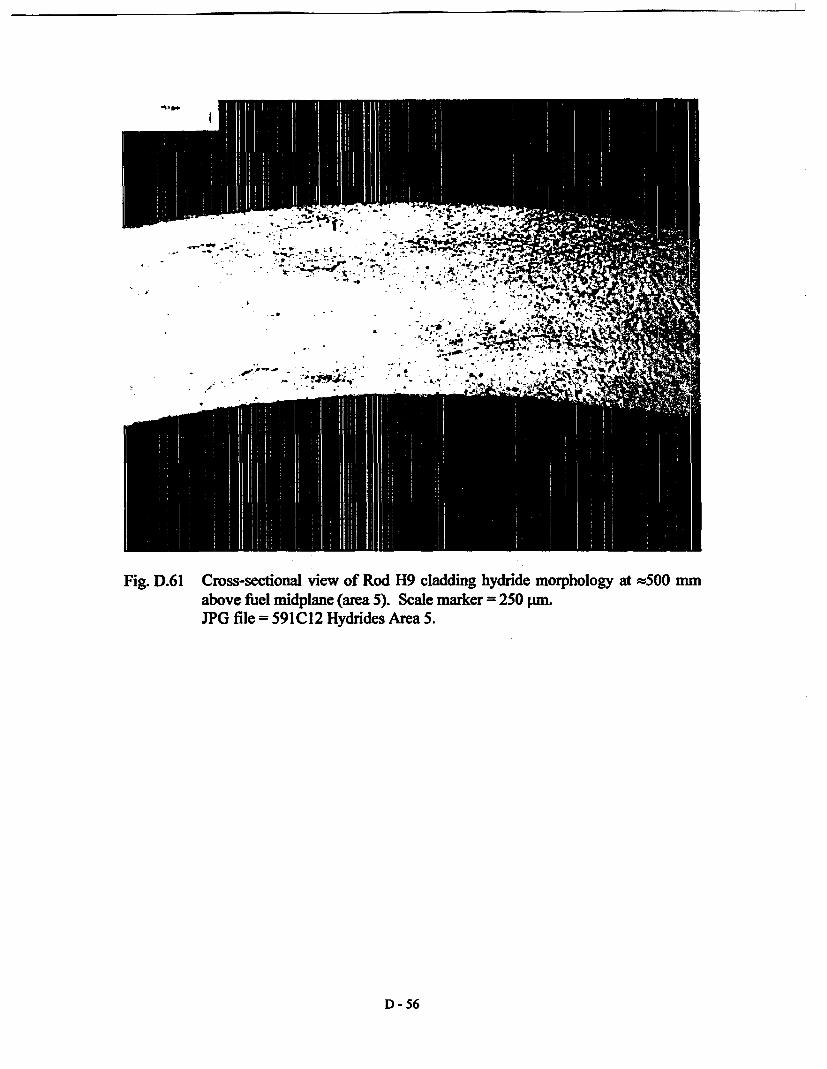
O ur"~~- -t
Fig. D.61 Cross-sectional view of Rod H9 cladding hydride morphology at =500 mmabove fuel midplane (area 5). Scale marker = 250 gmJPG file = 591C12 Hydrides Area 5.
D- 56

Fig. D.62 Cross-sectional view of Rod H9 cladding hydride morphology at =500 mmabove fuel midplane (area 6). Scale marker = 250 pm.JPG file = 591C12 Hydrides Area 6.
D- 57

Fig. D.63 Cross-sectional view of Rod H9 cladding hydride morphology at w500 mmabove fuel midplane (area 7). Scale marker = 250 pm.JPG file = 591C12 Hydrides Area 7.
D-58

Fig. D.64 Cross-sectional view of Rod H9 cladding hydride morphology at f50O mmabove fuel midplane (area 8). Scale marker = 250 pm.JPG file = 591C12 Hydrides Area 8.
D- 59

>4
.� a.
I, L :.0 : 1.,1; " Ike
. T .I I
.1t 4 i - . ,II �
. . . % V I - I
I
. * a
r , 4 . /4, 4'. ~~ I,#* y
rI" ,
f~,~.,o 4: 0
i s $9162 Swb Etcd
II
Fig. D.65 Cross-sectional view of Rod H9 cladding hydride morphology at #1000 mmabove fuel midplane (area 1). Scale marker = 100 mun.JPG file = 591B2 Hydrides Area 1.
D-60

Fig. D.66 Cross-sectional view of Rod H9 cladding hydride morphology at 10OO mmabove fuel midplane (area 2). Scale marker = 250 pm.JPG file = 591B2 Hydrides Area 2.
D- 61
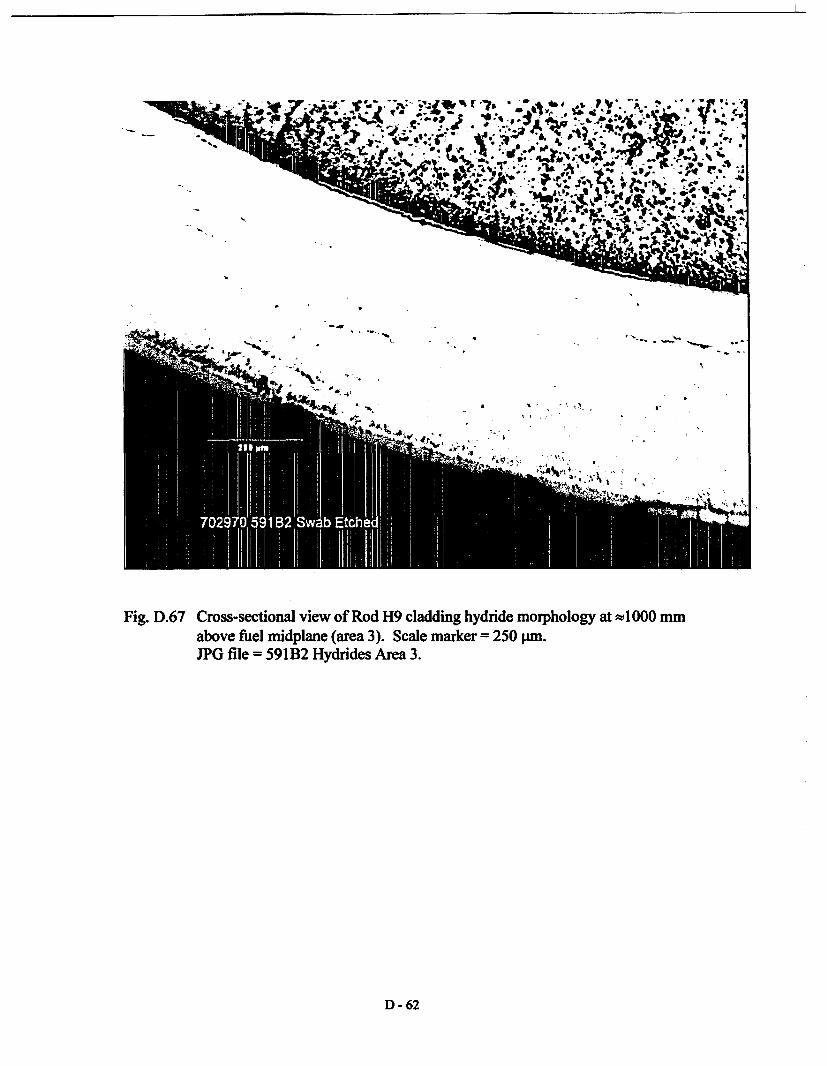
-~~~~~~~~1
I., I 1~I..'
4.,
".4 4, ,:,ig W, I I� �4 f, 't,, . , ,,-, 4% .)�, -
01" .1 - , . .V, .. '.11 �1-1 I -I
I , , N ,wwaig , �i -
Fig. D.67 Cross-sectional view of Rod H9 cladding hydride morphology at wl000 mmabove fuel midplane (area 3). Scale marker = 250 inm.JPG file = 591B2 Hydrides Area 3.
D-62

He t F ~~~~~~~~~~--- I-
fg;- Ad I o .* *
~~~a. ~ al
Fig. D.68 Cross-sectional view of Rod H9 cladding hydride morphology at 10OO mmabove fuel midplane (area 4). Scale marker = 250 pSn.JPG file = 591B2 Hydrides Area 4.
D- 63

Fig. D.69 Cross-sectional view of Rod H9 cladding hydride morphology at wl00O mmabove fuel midplane (area 5). Scale marker = 250 pm.JPG file = 591B2 Hydrides Area 5.
D-64

.4-.
-. .7�*1 - *,. - C
* �#.., .j.
I.--.. CI -e '- , , , .01r . .. , ., .7. �z .1. Ir- ,
y , ,. . " fl.- ) j- . I
-.3I -
t4 .
"-".- I
Fig. D.70 Cross-sectional view of Rod H9 cladding hydride morphology at #l000 mmabove fuel midplane (area 6). Scale marker = 250 pm.JPG file = 591B2 Hydrides Area 6.
D- 65

2�
- a. S. C
S -- -~~~~~~~~~~.
'.A'-. -"F-, -, - , - -" , - - - . . -- .1 I - �v .e_&e_I-- ,
Fig. D.71 Cross-sectional view of Rod G6 cladding hydride morphology at theapproximate fuel midplane (area 1). Scale marker = 250 gm.JPG file = 592C4 Hydrides, Area 1. ET703343.
D - 66
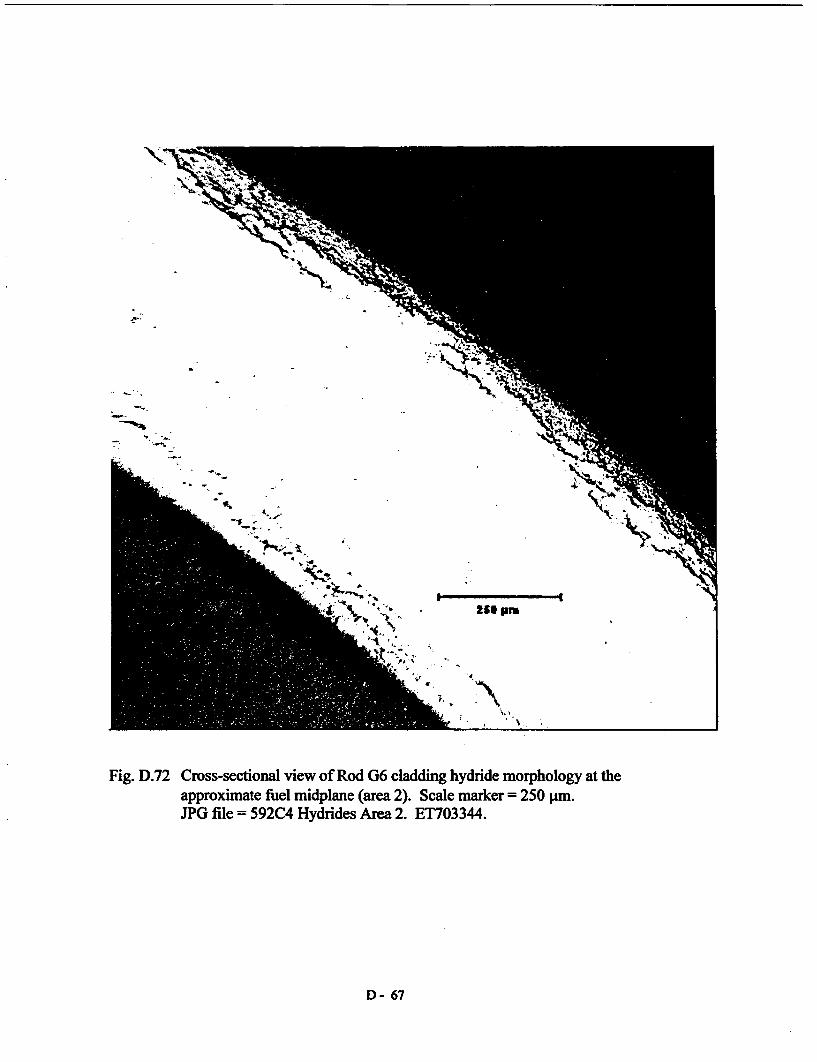
I
r.
-1 --- �..
A.
.4?,);.' -�
i ~~iT
Is* PM~~~~
I E
7~~~ I
Fig. D.72 Cross-sectional view of Rod G6 cladding hydride morphology at theapproximate fuel midplane (area 2). Scale marker = 250 gim.JPG file = 592C4 Hydrides Area 2. ET703344.
D- 67

I
P.4'
J,1~
II PMFig. Crosse tin vct a
ful mipn (ae 3-i Scl;akr, 5 m
JPG file = 592C4 Hydrides Area 3. ET703345.
D-68

Ad -,
Fig. D.74 Cross-sectional view of Rod (36 cladding hydride morphology at approximatefuel midplane (area 4). Scale marker = 250 jim.JPG file = 592C4 Hydrides Area 4. ET'703346.
D- 69

a. .�7 . S. p4
.- .j �a - -
- .. - - � *.,� . -
-
'½I
25 pm
- .9 "
Fig. D.75 Cross-sectional view of Rod G6 cladding hydride morphology atapproximate fuel midplane (area 5). Scale marker = 250 pm.JPG file = 592C4 Hydrides Area 5. ET703347.
D- 70

""I\ tA
I.% I11.4.- 'I..
I
N' -N
.- N - :",-. �-�
1�
l-epq
S
Fig. D.76 Cross-sectional view of Rod G6 cladding hydride morphology atapproximate fuel midplane (area 6). Scale marker = 250 pun.JPG file = 592C4 Hydrides Area 6. ET703348.
D- 71

*.�% I
I
IJJ.
vi
.-�
I -r ,�
.5
S
lb
4t
I �
1<
a�
I' ' *�
25
# ',, .
III
'iS
*, i
-
Fig. D.77 Cross-sectional view of Rod G6 cladding hydride morphology atapproximate fuel midplane (area 7). Scale marker = 250 pm.JPG file = 592C4 Hydrides Area 7. ET703349.
D- 72

, -PI,. i I -- �
-I .. , I
,-: ;, 1, -,. I . I.. -
1w-I--, , Iri
.r
4.*
Fig. D.78 Cross-sectional view of Rod G6 cladding hydride morphology atapproximate fuel midplane (area 8). Scale marker = 250 Pm.JPG file = 592C4 Hydrides Area 8. ET703350.
D- 73

I
,.;.Ia, rN,v -ei7Y',
.4I
'IIA
- : ~A -kI- '' -
P~~~~~~~~P
| 1 . In- He * j |~~~~*
+
Fig. D.79a Hydride orientation/distribution at area 5 within Rod G6 cladding at theapproximate fuel midplane position. High magnification photomicrographnear the cladding outer surface.JPG file = 592C4 etched OD hydrides. ET703374.
D- 74

- YV
1I
S
t
'N*4. IL
.
S
a * ,
a *6
r-L-.. i
a. * %
II
t+.
4
a
S. - C P a'
-It S
4- ¶� 'p' -
t C
41 5.
-t
, . A t *
'St
,ri4r..a -
-#
.i' I . pm ,. . * a
V.. I, 6r *
aT.. '.-
.
.-
;I , .
.I * . 4I I 1.
'p
. . I
I -A .,r
Fig. D.79b. Hydride orientation/distribution within Rod G6 cladding at the approximatefuel midplane position. High magnification photomicrograph near thecladding middle surface.JPG file = 592C4 etched crowfeetl. ET703367.
D- 75

i
I'
III3g
rl
1' k
I
Iso PM'i
t#
Fig. D.79c. Hydride orientation/distribution within Rod G6 cladding at the approximatefuel midplane (area 5). High magnification photomicrograph near thecladding inner surface.JPG file = 592C4 etched ID hydrides. ET703373.
D- 76
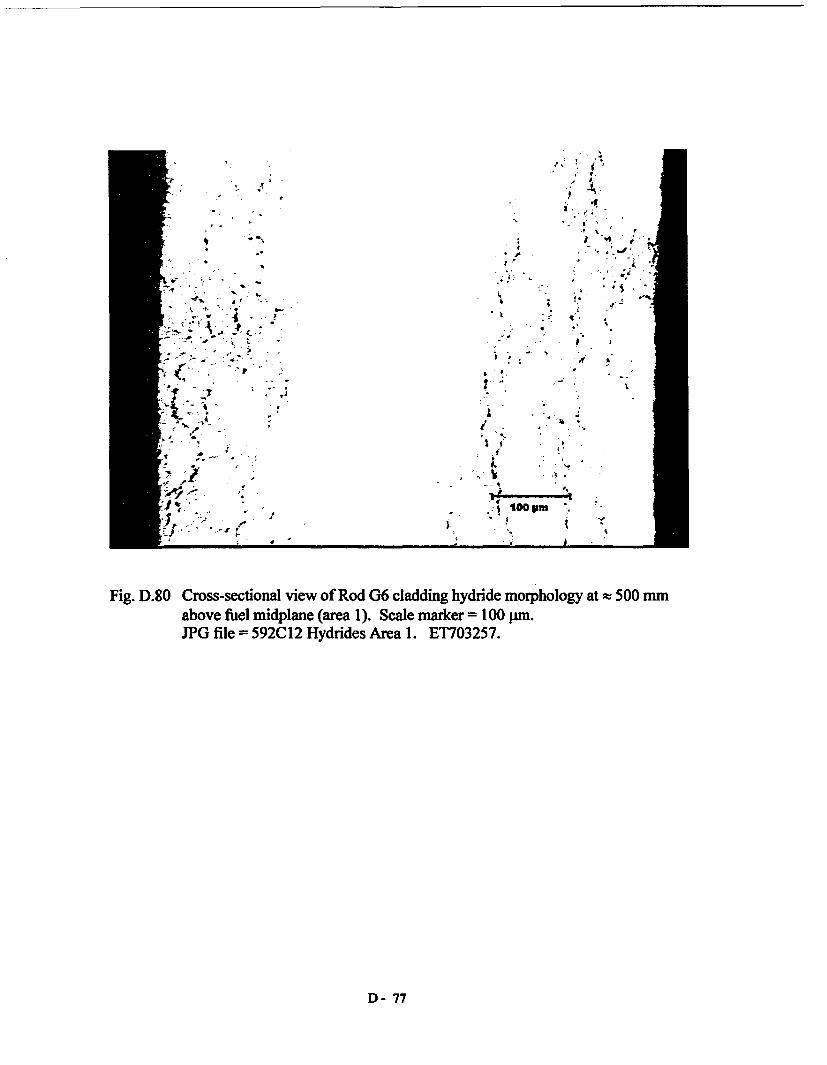
I?
2.
I '�, To
II.11*I
I � -
fri
V w 4
({� : r
A
.t U
4--. U
-
I,
I.
I.
d
I
I .0
'-I
I . Iwagim
I 2
Fig. D.80 Cross-sectional view of Rod G6 cladding hydride morphology at x 500 mmabove fuel midplane (area 1). Scale marker = 100 pm.JPG file = 592C12 Hydrides Area 1. ET703257.
D- 77

Fig. D.81 Cross-sectional view of Rod G6 cladding hydride morphology at s500 mmabove fuel midplane (area 2). Scale marker = 100 gm.JPG file = 592C12 Hydrides Area 2. ET703260.
D- 78

*1
s . e
1r
J
100 PMf A
4
7 ;~~~~~~~~~~~~~~~~ , %I I I:
Fig. D.82 Cross-sectional view of Rod G6 cladding hydride morphology at x500 mmabove fuel midplane (area 3). Scale marker = 100 pnm.JPG file = 592C12 Hydrides Area 3. ET703263.
D- 79

p
-
� �'
- 4
�: ��,.
*1 �- *1�
v*�. % -- .
-.
I1Rpm ,d�7
-� ..., hi
� � ,1% �*1 -. ¶ 'A
4 4.,J
I
:2 �;
I
Fig. D.83 Cross-sectional view of Rod G6 cladding hydride morphology at _500 mmabove fuel midplane (area 4). Scale marker = 100 pm.JPG file = 592C12 Hydrides Area 4. ET703266.
D- 80

;9
A'
-.�.. -.�-
V
I>.h;.� 7'v-
I -
14
t ,I
.1
I , -I . , 4.�. t - 11
..I I
: i , , i I.
-
I # I
1,j ".wi-� � .. I .
" 11 I
;. -, I
100pmn
: I
Fig. D.84 Cross-sectional view of Rod G6 cladding hydride morphology at m500 mmabove fuel midplane (area 5). Scale marker = 100 pmn.JPG file = 592C12 Hydrides Area 5. ET703269.
D- 8X

- �.
IN
Hw,~
.4 .1� 'I.4-
* 4- -
4- 4
� �,- *A4
.- *4**** ".4'
100 FM
IN I .
I ,
. -sI
Fig. D.85 Cross-sectional view of Rod G6 cladding hydride morphology at #500 mmabove fuel midplane (area 6). Scale marker = 100 pm.JPG file = 592C12 Hydrides Area 6. ET703272.
D- 82
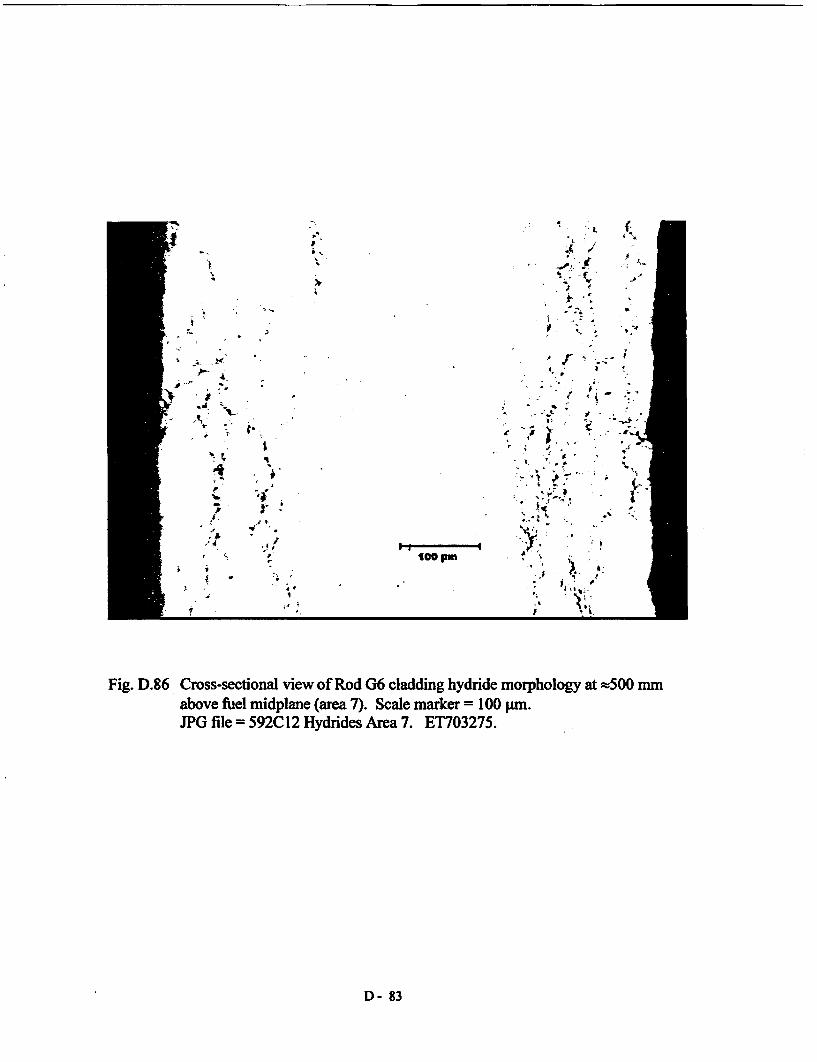
: L�4
I
IIt
A
IL�
A '
g.tIi
k
40
p..-a, -
F I 46
I.
i
I
I V
I
4. 1
. IGOP
i
l
:4
k. Iit
/
I
Fig. D.86 Cross-sectional view of Rod G6 cladding hydride morphology at f500 mmabove fuel midplane (area 7). Scale marker = 100 pm.JPG file = 592C12 Hydrides Area 7. ET703275.
D- 83

p IITI
14
r I ..
I . ...1.
100 PM
CW'
-'F
Fig. D.87 Cross-sectional view of Rod G6 cladding hydride morphology at #500 mmabove fuel midplane (area 8). Scale marker = 100 Sum.JPG file = 592C12 Hydrides Area 8. ET703278.
D- 84
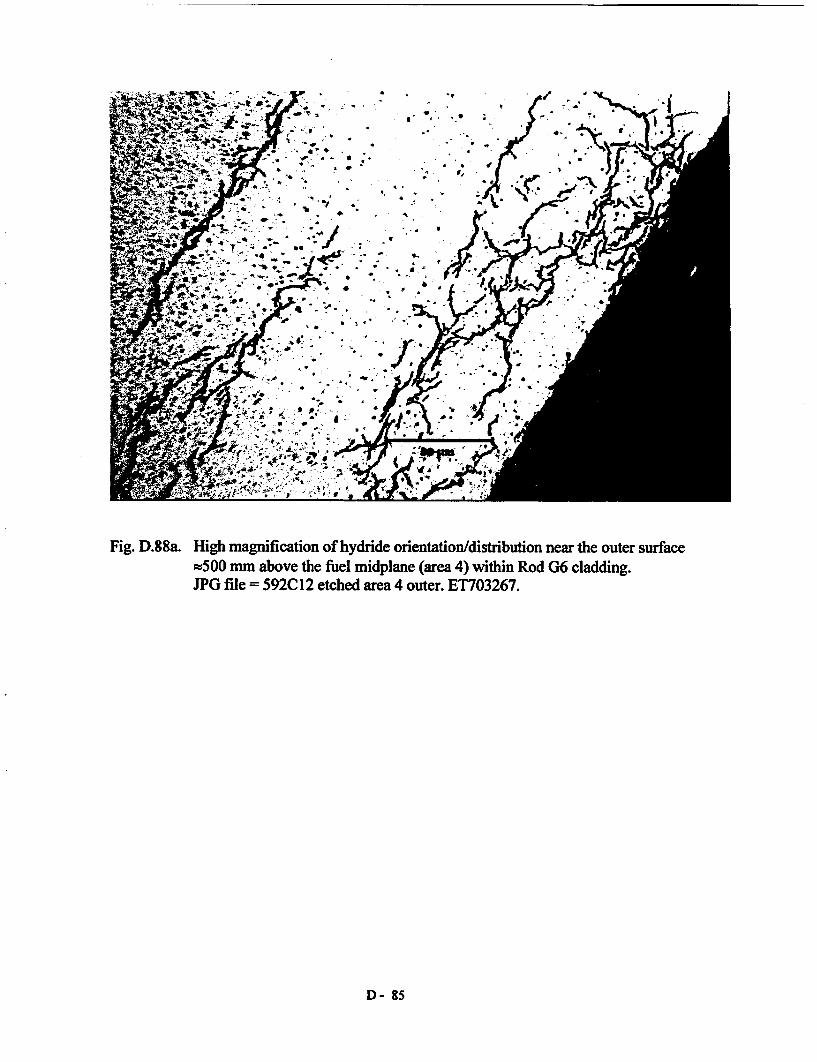
Fig. D.88a. High magnification of hydride orientation/distribution near the outer surfacets5OO mm above the fuel midplane (area 4) within Rod G6 cladding.JPG file = 592C12 etched area 4 outer. ET703267.
D- 85
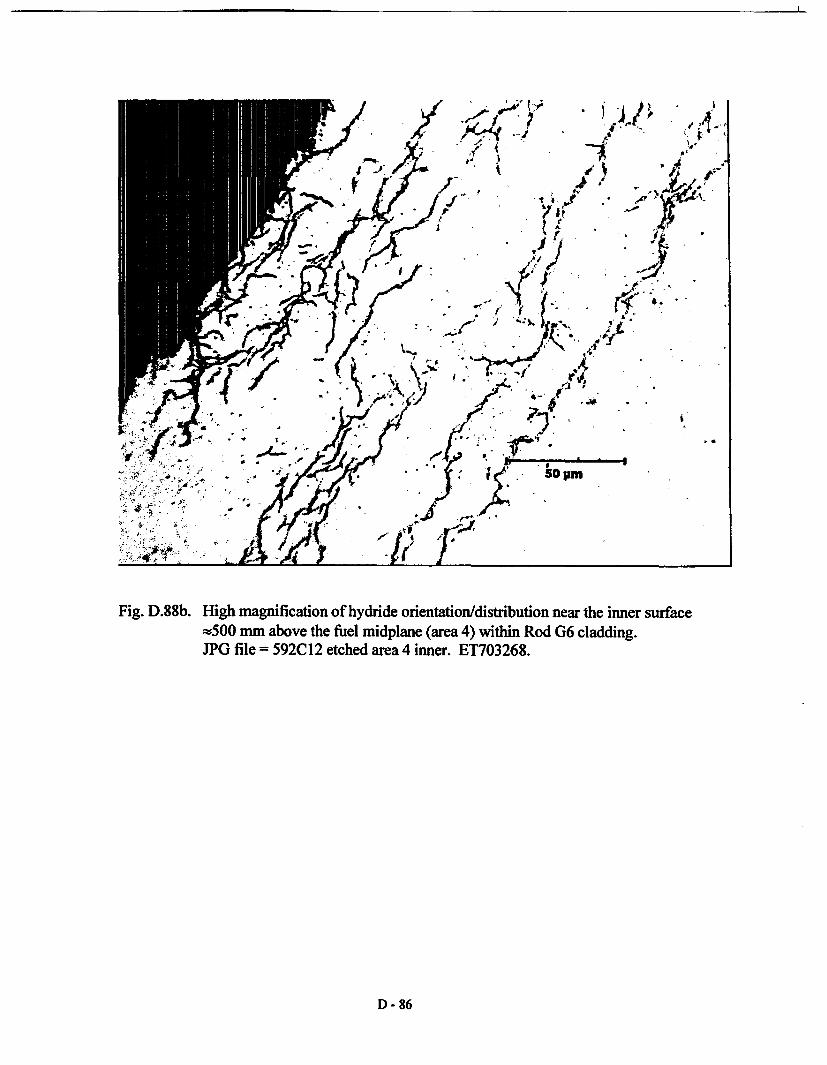
Fig. D.88b. High magnification of hydride orientation/distribution near the inner surface=500 mm above the fuel midplane (area 4) within Rod G6 cladding.JPG file = 592C12 etched area 4 inner. ET703268.
D-86

Et: - W \ks- -*
f lo . [ ~~~~~~~sopn_
Y. .\
_5O mm above ' t f. Note
*~~ ~~~~ , , f.+ . A r
- "-. ._ .a ,^ a*
'. Spi
Fig. D.89a. High magnification of hydride orientation/distribution near the inner surface=5OO mm above the fuele midplane (area 6) within Rod G6 cladding. Notethe fine precipitates around the hydrides.JPG file = 592C12 etched area 6 inner. ET 703274.
D- 87

Fig. D.89b. High magnification of hydride orientation/distribution near the outersurface v5O0 mm above the fuel midplane (area 6) within Rod G6 cladding.Note the fine precipitates around the hydrides.JPG file = 592C12 etched area 6 outer. ET 703273.
D-88

APPENDIX E
BASELINE COMPARATIVE DATA
Tables
E. 1 Turkey Point Rod Diameter (inches) at an Elevation 2-3 m from theBottom of the Rods .......................................................... E-2
E.2 Gas Composition of Surry Rods After 15 years Dry Storage with Rodsfrom Two 3-Cycle Turkey Point Assemblies DOI, and D04 ......................... E-4
E.3 Isotopic Composition of Fission Gas From Four Surry Rods After 15 Yearsof Dry Storage and Rods in Turkey Point Assemblies DOI and D04 ................. E-4
Figures
E.1 Cladding OD Oxide Layers for Three-Cycle Turkey Point PWR Rods ............. E-3
E.2 Cladding Thicknesses (V-inch) for Three-Cycle Turkey Point PWR Rods ......... E-3
E.3 Hydrogen Contents for Three-Cycle Turkey Point (DOl and D04) Fuel Rods.....E-5
E-1

Table E. 1 Turkey Point Rod Diameter (inches) at an Elevation 2-3 m from the Bottom ofthe Rods. (Refs E.1 and E.2)
Rod Maximum, in. Average, In. Minimum, in.D01-F7 .4212 .4204 .4195
-F8 .4218 .4205 .4200-F9 .4210 .4203 .4191-G6 .4220 .4205 .4195-G7 .4233 .4202 .4190-G8 .4238 .4205 .4190-G9 .4226 .4198 .4183
-GIO .4228 .4210 .4198-H6 .4202 .4194 .4188-H7 .4218 .4210 .4195-H9 .4230 .4205 .4199-6 .4222 .4202 .4192-17 .4210 .4200 .4195-8 .4218 .4205 .4198-I9 .4225 .4202 .4190-J7 .4216 .4205 .4192-J8 .4215 .4205 .4195-J9 .4228 .4210 .4192
D04-G9 .4222 .4205 .4188-GIO .4225 .4210 .4192
In Inches|__ _ Maximum Average | Minimum
Global .4238 __.4188Average .4221 .4204 .4193
In mmGlobal 10.765 10.638
Average J 10.721 10.678 10.650
E - 2

Oxide Thickness (ji inches)
700
600 * A
500 / +-4--TP D1- G9 MAX
400 - -43-TP 01- G9 MINA TP W01- OTHER MAXI
300 - X TP W1- OTHER MIN|. ZTP D04 MA)
200 - ae TP D04 MIN
100
0 20 40 60 80 100 120
INCHES FROM BOTIOM
Fig. E.1 Cladding OD Oxide Layers for Three-Cycle Turkey Point PWR Rods.(Refs. E.1 and E.2).
Cladding Thickness
Fig. E.2 Cladding Thicknesses (L-inch) for Three-Cycle Turkey Point PWR Rods.(Refs. E. I and E.2).
E -3
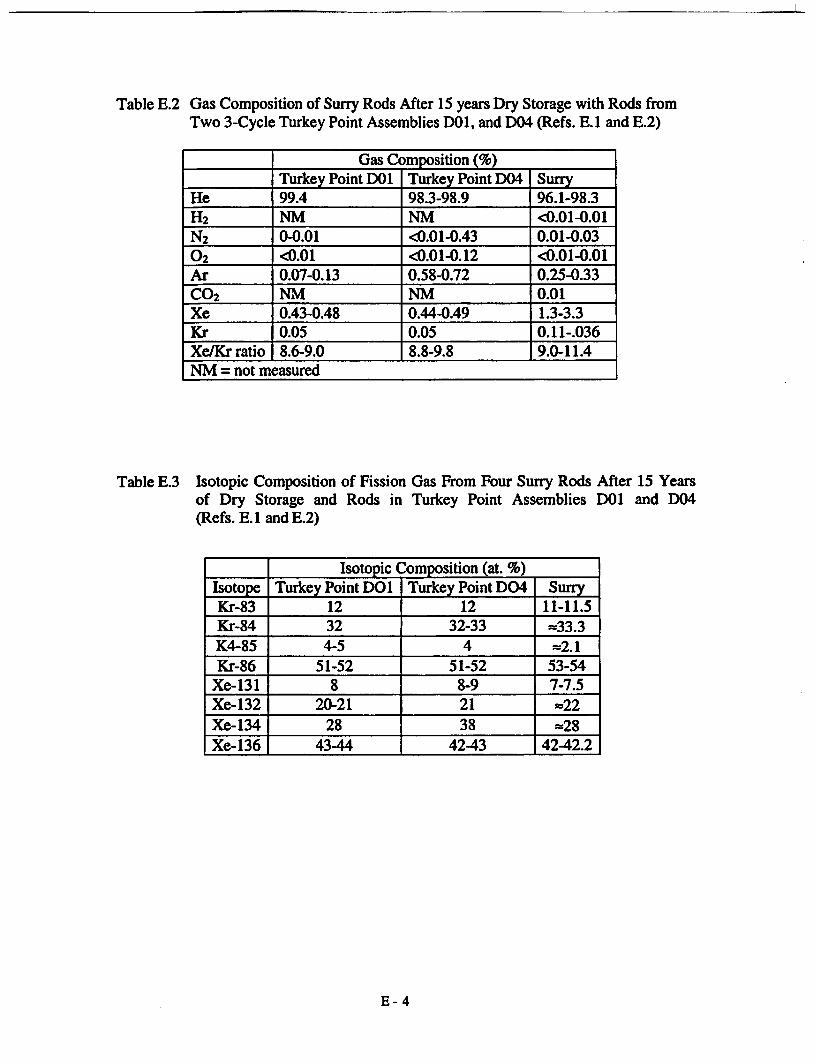
I
Table E.2 Gas Composition of Surry Rods After 15 years Dry Storage with Rods fromTwo 3-Cycle Turkey Point Assemblies DOI, and D04 (Refs. E.1 and E.2)
Gas Composition (%)________ TTurkey Point D01 Turkey Point D04 SurryHe 99.4 98.3-98.9 96.1-98.3H2 NM NM <0.01-0.01N 2 0-0.01 <0.01-0.43 0.01-0.0302 <0.01 <0.01-0.12 <0.01-0.01Ar 0.07-0.13 0.58-0.72 0.25-0.33CO2 NM NM 0.01Xe 0.43-0.48 0.44-0.49 1.3-3.3Kr 0.05 0.05 0.11-.036Xe/Kr ratio 8.6-9.0 8.8-9.8 9.0-11.4NM = not measured
Table E.3 Isotopic Composition of Fission Gas From Four Surry Rods After 15 Yearsof Dry Storage and Rods in Turkey Point Assemblies D01 and D04(Refs. E. 1 and E.2)
Isotopic Composition (at. %)Isotope Turkey Point DOl Turkey Point D04 SuryKr-83 12 12 11-11.5Kr-84 32 32-33 -33.3K4-85 4-5 4 =2.1Kr-86 51-52 51-52 53-54
Xe-131 8 8-9 7-7.5Xe-132 20-21 21 =22Xe-134 28 38 =28Xe-136 43-44 42-43 42-42.2
E - 4
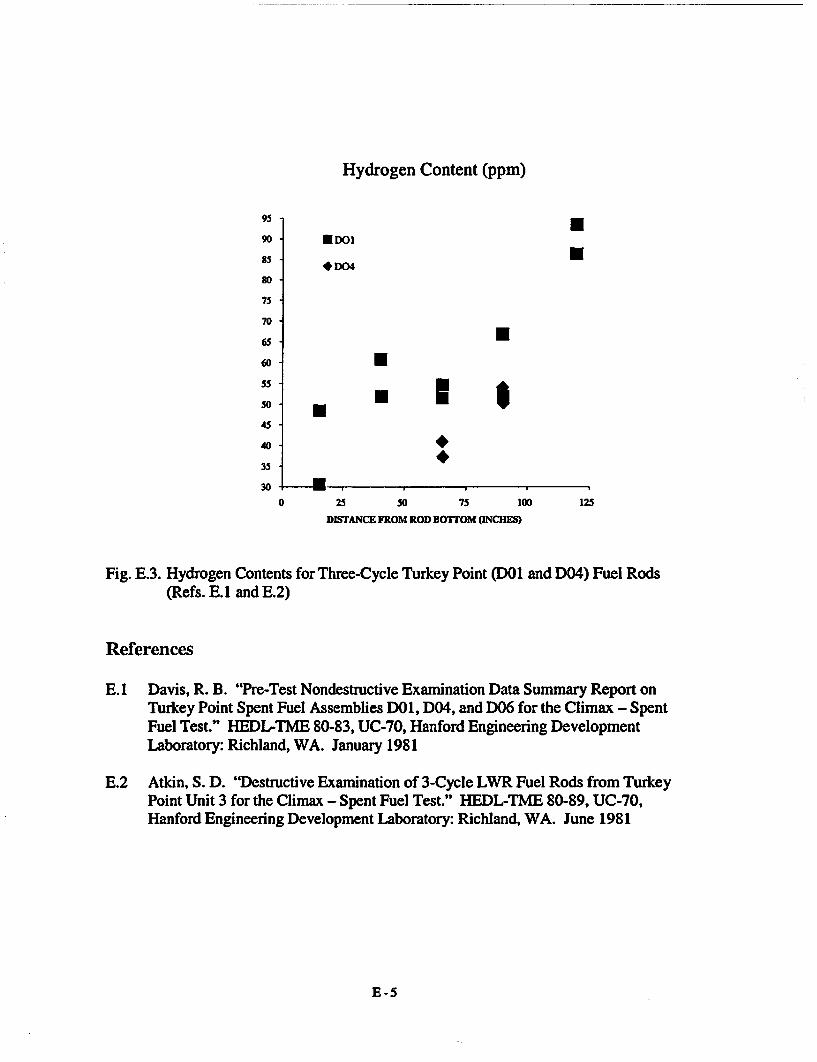
Hydrogen Content (ppm)
9590 EDOI
S.5 - *D04
so-
75
70
65 K60 -
50 *
45
40
35
30 -0 25 50 75 100 125
DISTANCE FROM ROD BOTrOM (INCHES)
Fig. E.3. Hydrogen Contents for Three-Cycle Turkey Point (DO1 and D04) Fuel Rods(Refs. E. 1 and E.2)
References
E.1 Davis, R. B. "Pre-Test Nondestructive Examination Data Summary Report onTurkey Point Spent Fuel Assemblies D01, D04, and D06 for the Climax - SpentFuel Test." HEDL-TME 80-83, UC-70, Hanford Engineering DevelopmentLaboratory: Richland, WA. January 1981
E.2 Atkin, S. D. "Destructive Examination of 3-Cycle LWR Fuel Rods from TurkeyPoint Unit 3 for the Climax - Spent Fuel Test." HEDL-TME 80-89, UC-70,Hanford Engineering Development Laboratory: Richland, WA. June 1981
E-5
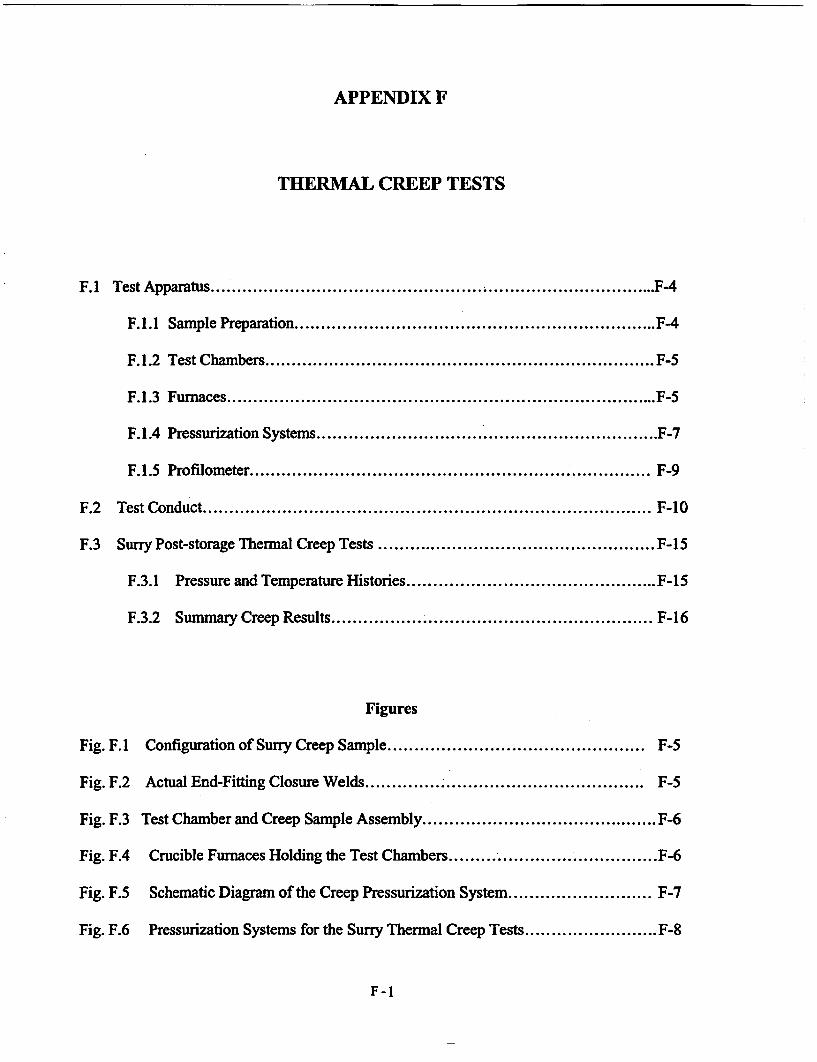
APPENDIX F
THERMAL CREEP TESTS
F.1 Test Apparatus ............................................... F-4
F. 1.1 Sample Preparation ............................................... F-4
F. 1.2 Test Chambers ............................................... F-5
F.1.3 Furnaces ................................................ F-5
F.1.4 Pressurization Systems ............................................... F-7
F.1.5 Profilometer ............................................... F-9
F.2 Test Conduct ................................................ F-10
F.3 Surry Post-storage Thermal Creep Tests ............................................... F-15
F.3.1 Pressure and Temperature Histories ............................................... F-15
F.3.2 Summary Creep Results ............................................... F-16
Figures
Fig. F. 1 Configuration of Surry Creep Sample ............................................... F-5
Fig. F.2 Actual End-Fitting Closure Welds ............................................... F-5
Fig. F.3 Test Chamber and Creep Sample Assembly ............................................ F-6
Fig. F.4 Crucible Furnaces Holding the Test Chambers ....................... I................ F-6
Fig. F.5 Schematic Diagram of the Creep Pressurization System ........................... F-7
Fig. F.6 Pressurization Systems for the Surry Thermal Creep Tests ......................... F-8
F-I

Fig. F.7 Laser Profilometer for Measuring Surry Sample Diameter and Length ......... F-9
Fig. F.8 Cross-Sectional Profile of the C8 Sample at the Axial Midplane prior to theThermal Creep Test .............................................................. F-l
Fig. F.9 Outside Diameter of the C8 Sample as a Function of Axial Location ............ F-12
Fig. F.10 Profiling of the Lower End Fitting of the C8 Sample for Determinationof a Possible Change in Sample Length due to Creep Anisotropy ............... F- 12
Fig. F.l 1 Pressure and Temperature History of the C8 Test in the First Run Segment..... F-13
Fig. F.12 Diameter Profile of the C8 Sample at the Axial Midplane before and afterthe First Run Segment .............................................................. F- 13
Fig. F.13 Outside Diamneter of the C8 Sample before and after the First Run Segment ... F-14
Fig. F.14 Pre- and Post-Run Profiles of the C8 Bottom End Fitting.Overlapping suggests there was no sample length change .......................... F- 14
Fig. F.15 Strain vs. Time Plot for the C8 Sample after the First Run Segment ............ F- 15
Fig. F.16 Pressure and Temperature Histories for the Initial 1873 h Operation of theC9 Test .............................................................. F-17
Fig. F.17 Expanded Scales of Fig. F.16 Slnwing the Operating Range of the PressureController/Regulator for the C9 Test. .................... ............................ F- 17
Fig. F.18 Deformation History of Sample C3 Operated Nominally at 220 MPaand 360°C for 3305 h ...................................................... F- 18
Fig. F.19 Deformation History of Sample C6 Operated Nominally at 190 MPaand 380°C for 2348 h ...................................................... F- 18
Fig. F.20 Deformation History of Sample C8 Operated Nominally at 220 MPaand 3800C for 2182 h ...................................................... F-19
Fig. F.21 Deformation History of Sample C9 Operated Nominally at 190 MPaand 4000C for 1873 h and Subsequently at 250 MPa and 4000C for 693 h ....... F- 19
Fig. F.22 Cross-Section Profiles of the C3 Sample at the Axial Midphne before andafter the Test ...................................................... F-20
Fig. F.23 Cross-Section Profiles of the C6 Sample at the Axial Midplane before andafter the Test ...................................................... F-20
F- 2

Fig. F.24 Cross-Section Profiles of the CS Sample at the Axial Midplane before andafter the Test ........................................................... F-21
Fig. F.25 Cross-Section Profiles of the C9 Sample at the Axial Midplane before andafter the Test ........................................................... F-21
Fig. F.26 Pre and Post-Run Profiles of the Lower End Fitting of Sample C9 ....... ........ F-22
Tables
Table F.1 Surry Post-Storage Thermal Creep Samples ....................................... F-4
Table F.2 Achieved and Target Conditions for Surry Thermal Creep ......... ............... F-16
Table F.3 Second Creep Rate for Surry Post-Storage Cladding ................................. F-22
F- 3

F.1 Test Apparatus
F.1.1 Sample Preparation
Post-storage thermal creep tests wereperformed with sections of defueled Surryrod cladding internally pressurized with aninert gas and with the pressure activelyregulated during the tests. Periodically, thesamples were depressurized and removedfrom the furnace for diametral and lengthmeasurements. The measurements weremade at room temperature.
Test samples were prepared from two Surryrods (H9 and G6) with identical design andcomparable irradiation/storage histories.Each sample was 75 mm (3 in.) long.Sample identities and the estimated oxidelayer thickness (23-30 pm), and hydrogencontent (230-265 wppm) are shown in TableF.1. The estimates were made byinterpolation and extrapolation ofmeasurement data from nearby siblingsamples. All samples were from the flat-power region of the rods just above andbelow Grid Spacer No. 4. By selecting
samples from close proximity to each other,the intent is to minimize sample-to-samplevariation in the tests.
The samples were defueled by dissolutionwith nitric acid and cleansed with alcoholand water in an ultrasonic cleaner. Tominimize the volume of pressurized gas inthe system, the inside of the cladding samplewas filled with slightly undersized Zr-702pellets. The end fittings were attachedremotely with a tungsten-inert-gas (IMG)welder with a rotary head in the hot cell.Figure F.1 shows a mockup sample, and Fig.F.2 shows the closure welds of an actualsample. While the bottom end fitting was asolid plug, the top end fitting was a singlemachined piece with a thick-wall extensiontube. The extension allowed the mechanical("Swagelok") connection to thepressurization system to be made outside theheating zone for improved hermeticity.Both end fittings were made of Zr-702material for compatibility with the Surry'sZircaloy4 cladding.
Table F.1 Surry Post-Storage Thermal Creep SamplesAxial Oxide Thickness H content
Sample from Location(l) (mm) (Ym)P 2) (wppm)(2 )
C3 Rod H9 -38 23 230C6 Rod H9 76 25 240C8 Rod G6 254 23 260C9 Rod H9 330 30 265
(1) Above fuel column midplane measured from center of the sample.(2) Estimated based on sibling sample characterization data.
F-4

EUL~U~ _- --- ~ ___
I1 Cladding (76.2 rnm) Top end fitting
Lower end fitting
Fig. F. I Configuration of Surry Creep Sample. End fittings were welded to cladding.
Fig. F.2 Actual End-Fitting Closure Welds.
Because welding softened the claddingimmediately adjacent to the weld, hoseclamps were applied to the ends of thecladding to preclude possible localizeddeformation during the test. The clampswere lined with collars made of Zr-702material for compatibility with the Zircaloy-4 cladding. The width of the collar is 10mm. Once installed, the collar/clampassembly stayed on the sample until the endof the test.
F.1.2 Test Chambers
To mitigate sample oxidation and possiblespread of contamination in case of a samplerupture, argon-purged test chambers wereused. The exit end of the purge from thechamber was fitted with a high-efficiency-particulate filter for contamination control.Three chambers were built - two small unitscontaining one sample each and a large unit
containing up to three samples. Figure F.3shows the single-sample test chamber.
Each of the small chambers was equippedwith two thermocouples, and the largerchamber with three. The thermocoupleswere Type K with sheathed-and-ungroundedhot junctions positioned near the midplaneof the sample but not touching. Thethermocouples and the temperaturerecording systems were calibrated againststandards traceable to NIST prior to the startof the tests.
F.1.3 Furnaces
Three insulated crucible furnaces (Fig. F.4)were used to provide the test temperaturesrequired. The test chambers fit snuglyinside the furnaces.
F- 5

< * s hzL--i;s
Ad -B '-
. s { - .
rfl>SJSPurge Gas Lines
- Pressure connection
Chamber Flange
Creep Sample
I .
Fig. F.3 Test Chamber (left) and Creep Sample Assembly (right). The purge-gas lines in thetest chamber served also as penetrations for thermocouples as seen in Fig. F.4.
Fig. F.4 Crucible Furnaces Holding the Test Chambers.
F-6
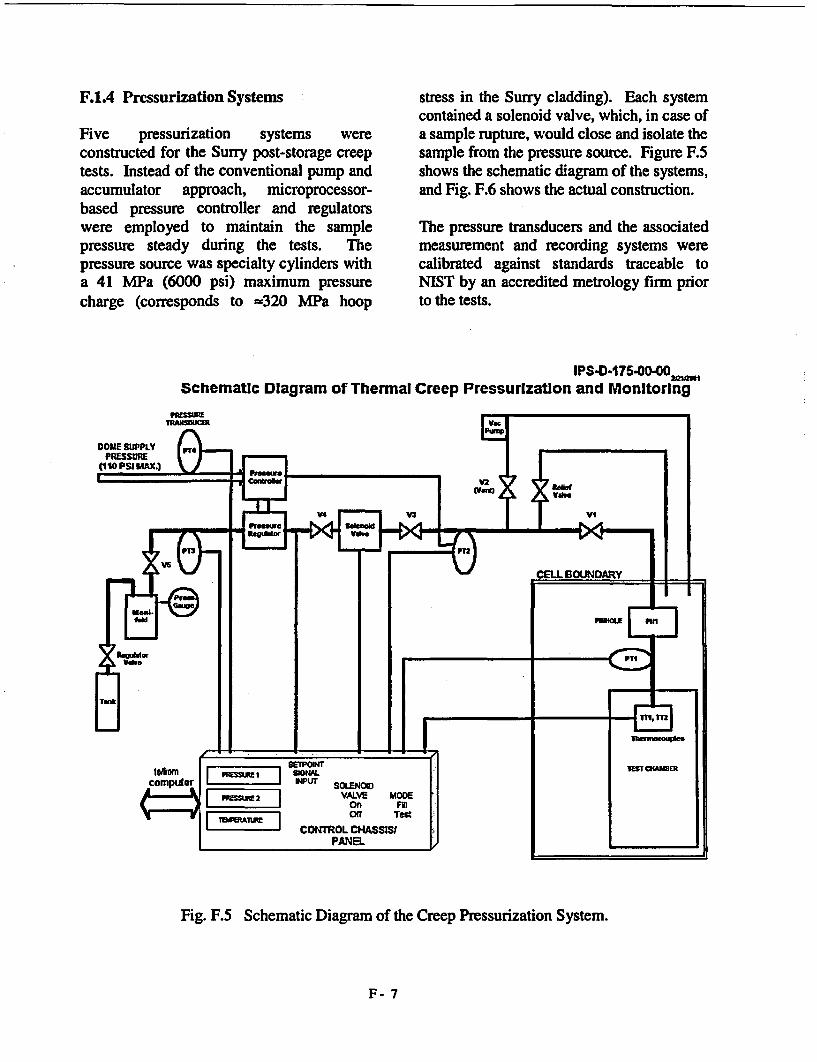
F.1A Pressurization Systems
Five pressurization systems wereconstructed for the Surry post-storage creeptests. Instead of the conventional pump andaccumulator approach, microprocessor-based pressure controller and regulatorswere employed to maintain the samplepressure steady during the tests. Thepressure source was specialty cylinders witha 41 MPa (6000 psi) maximum pressurecharge (corresponds to -320 MPa hoop
stress in the Surry cladding). Each systemcontained a solenoid valve, which, in case ofa sample rupture, would close and isolate thesample from the pressure source. Figure F.5shows the schematic diagram of the systems,and Fig. F.6 shows the actual construction.
The pressure transducers and the associatedmeasurement and recording systems werecalibrated against standards traceable toNIST by an accredited metrology firm priorto the tests.
IPS-D4175-OO-OO MSchematic Diagram of Thermal Creep Pressurization and Monitoring
Fig. F.5 Schematic Diagram of the Creep Pressurization System.
F- 7

3
Fig. F.6 Pressurization Systems for the Surry Thermal Creep Tests. 1) pressurecontrollers/regulators; 2) solenoid valves; 3) pressure source [41 MPa (6000 psi) argoncylinders]; and 4) line penetrations into the hot cell.
F-8

F.15 Profilometer
A laser profilometer (Fig. F.7) was used tomeasure the sample diameter and lengthbefore the test and after each run. (Each testconsisted of multiple runs.) Themeasurements were performed at roomtemperature with the sample dischargedfrom the furnace. The stage mechanism ofthe profilometer provided accurate rotationaland linear positioning capability to allowrepeated measurements of sampledimensions at the same locations after everyrun. The diametral measurement accuracy is=5 x 10' mm (2 x iO5 in.), correspondingto a strain accuracy of =0.005% for theSurry samples.
The sample diameters were measured every90 azimuthal at 7.6-mm (0.3-in.)longitudinal intervals. The 20 azimuthalreadings were averaged to yield the sampleoutside diameter (OD) for that axial location.The ODs of the middle 5 axial locationswere then averaged to yield the sample ODfor strain determinations.
The length of the sample was measured byprofiling the lower end plug from a fixedtop-end reference position. A shifting of theprofile would be an indication of samplelength change.
The accuracy of the profilometer wasroutinely verified against a NIST-traceableplug gauge.
Fig. F.7. Laser Profilometer for Measuring Surry Sample Diameter and Length. The sample ismounted in the chuck (1), which permitted the rotational movement, and the slide (2)permitted the linear movement.
F - 9

F.2 Test Conduct
The conduct of a thermal creep test isillustrated in this section using the C8 test asan example.
Before the test, the diameters of the C8sample were measured with the laserprofilometer. The resultant cross-sectionalprofile of the sample at the axial midplane isshown in a radial plot in Fig. F.8. Fromthese 19-position azimuthal measurements,the average diameter at this axial locationwas determined to be 10.6492 mm (0.41926in.). (Note: The out-of-roundness of thesample is exaggerated by the expandedplotting scale in Fig. F.8.)
The identical process was performed for theother axial locations, and the resultantaverage diameter profile is shown in Fig.F.9. The readings from the middle five axialpositions were then averaged to yield theaverage OD of the sample 10.6497 mm(0.41928 in.).
To determine possible sample lengthchanges due to creep anisotropy, the bottomend fitting of the sample was profiled from afixed reference position at the top, as shownin Fig. F.10. A shift of the profile laterwould be an indication of a possible changein sample length.
After the pretest profilometry wascompleted and judged to be satisfactory, theC8 sample was loaded into the test chamberand connected to the pressurization system.
At room temperature, the C8 sample waspressurized to 6.85 MPa-gauge (=50 MPahoop cladding stress) and isolated from therest of the pressurization system for apressure-decay leak check. After observingno discernible pressure drop in the
prescribed 180 s period, the pressure wasreduced to 0.68 MPa (100 psi), the nominalholding position.
To expel trapped air in the sample from theinitial installation, the pressurization systemwas evacuated and backfilled several timeswith argon gas. Afterwards, the system wasreturned to its holding pressure of 0.68 MPa(100 psig).
The furnace was then turned on to achievethe desired temperature of 380'C for the C8test. Temperature overshoot was typicallysmall, approximately several degreesCelsius. The pressure in the sample wasmaintained at 0.68 MPa (100 psig) duringthe heatup. Once the steady temperaturewas attained, the pressure-decay leak testwas repeated to verify hermeticity attemperature. Again, the C8 sample wasfound to be leak-tight.
The sample was then pressurized to thetarget 27.9 MPa (4070 psig), correspondingto a wall-average hoop stress of 220 MPaafter taking into account actual samplediameter and (metal) wall thickness.
The first run segment of the C8 test had a335-h duration. The measured pressure andtemperature profiles during the run areshown in Fig. F.11. Both pressure andtemperature were steady and on target. Thetime-averaged pressure and temperaturewere 27.9 MPa (4071 psig) and 380.70C,respectively.
At the end of the first run segment, thesample was depressurized from 27.9 MPa(4070 psig) to the holding pressure of 0.68MPa (100 psig). The furnace was then
F -10

turned off to allow the sample to cool toroom temperature. This shutdown sequenceis designed to preclude possible stress-induced reorientation of hydrides in thecladding during cool-down.
Profilometry of the C8 sample was repeatedin a manner identical to pretest profilometry.The plots showing the pre- and post-runcomparisons of cross-sectional profile at theaxial midplane, the average diameter overthe sample length, and the profile of thebottom end plug are given in Figs. F.12,F.13, and F.14, respectively.
The calculated OD hoop strain (based on themiddle five axial readings) was 0.232%.The wall-average hoop strain, taking intoaccount the post-storage cladding dimensionand oxide thickness, is 1.13 times higher, or0.262%. The resultant strain vs. time plotafter the first run for the C8 test is shown inFig. F.15. The above procedure wasrepeated after every run for the C8 test.
In Figure F.14, the diameter of the lower endplug (Zr-702) was found to be the samebefore and after the run. Since the end plugwas stress-free and not deforming, this resultindicated that the purge chamber waseffective, and that there was no discernibleoxidation of the C8 cladding.
I
a
so
Fig. F.8 Cross-Sectional Profile of the C8 Sample at the Axial Midplane prior to the ThermalCreep Test. The reference diameter for creep measurements is 10.6492 mm
F- 1l

10.80
10.75
I, 10.70
.9 10.65a
210.60
10 5
- ~ A 0 a 0 a 0 0
IWd Claddng el-4
1050
Axial Location (7.62 mm spacing)
Fig. F.9 Outer Diameter of the C8 Sample as a Function of Axial Location. The middle fivereadings were averaged to yield the average OD (10.6497 mm =0.41928 in.) of thesample.
1. -
li0I I_ _ _ _ _ _ _ _ _ _ _ _ _ _ _ _ _ _I
10.5
10.4
10.2
10.0
9.8
9.6
3.4
9.2so 81 82 83 84 85 85 87
Axial Position from Top Ledge (mm)88 89 90
Fig. F. 10 Profiling of the Lower End Fitting of the C8 Sample for Determination of aPossible Change in Sample Length due to Creep Anisotropy.
F-12
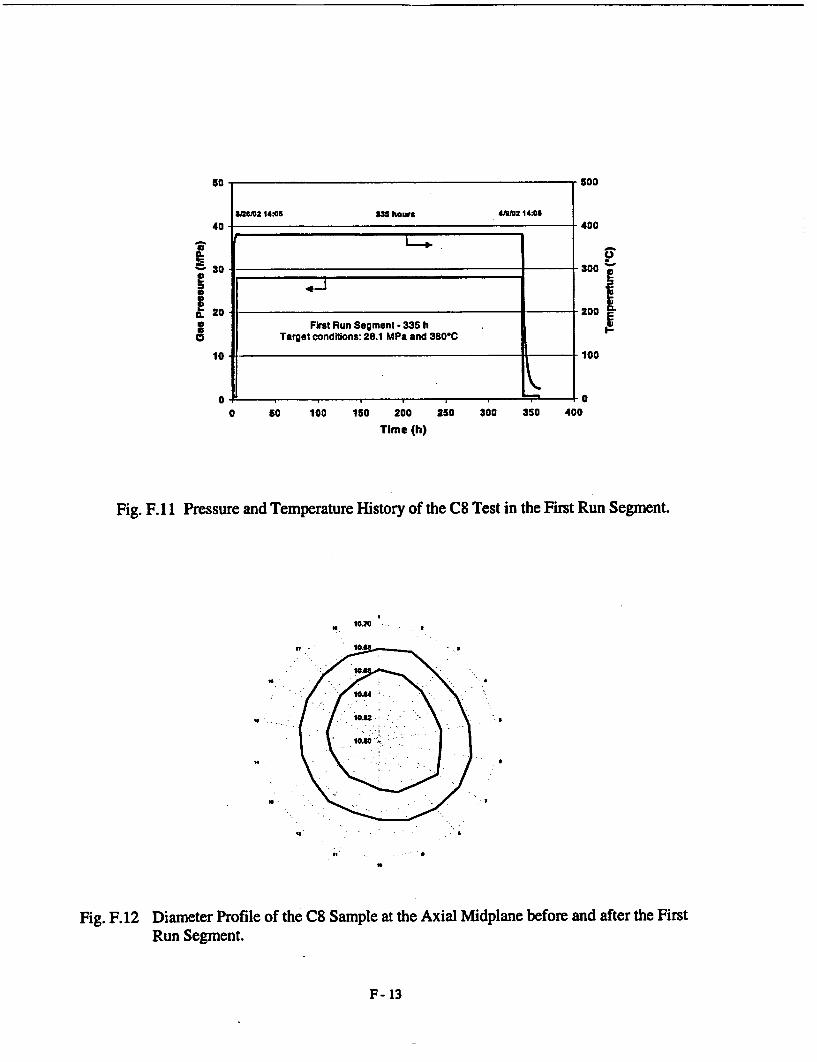
50
40
i30
E 20
10a1
ano2 14 05 335 hours 4M10214:05
o00
400
4-J~~~~~~~~~~~~~~~~~~~~~~~*j I~~~~~~~___ Luu I
First Run Segment -335 hTarget conditions: 28.1 MPa and 380C
1- 100
y300 350 4000 50 100 150 200 250
Time (h)
Fig. F. 11 Pressure and Temperature History of the C8 Test in the First Run Segment.
10.70
:: Sn l
Is
-,
*0
Fig. F.12 Diameter Profile of the C8 Sample at the Axial Midplane before and after the FirstRun Segment.
F- 13
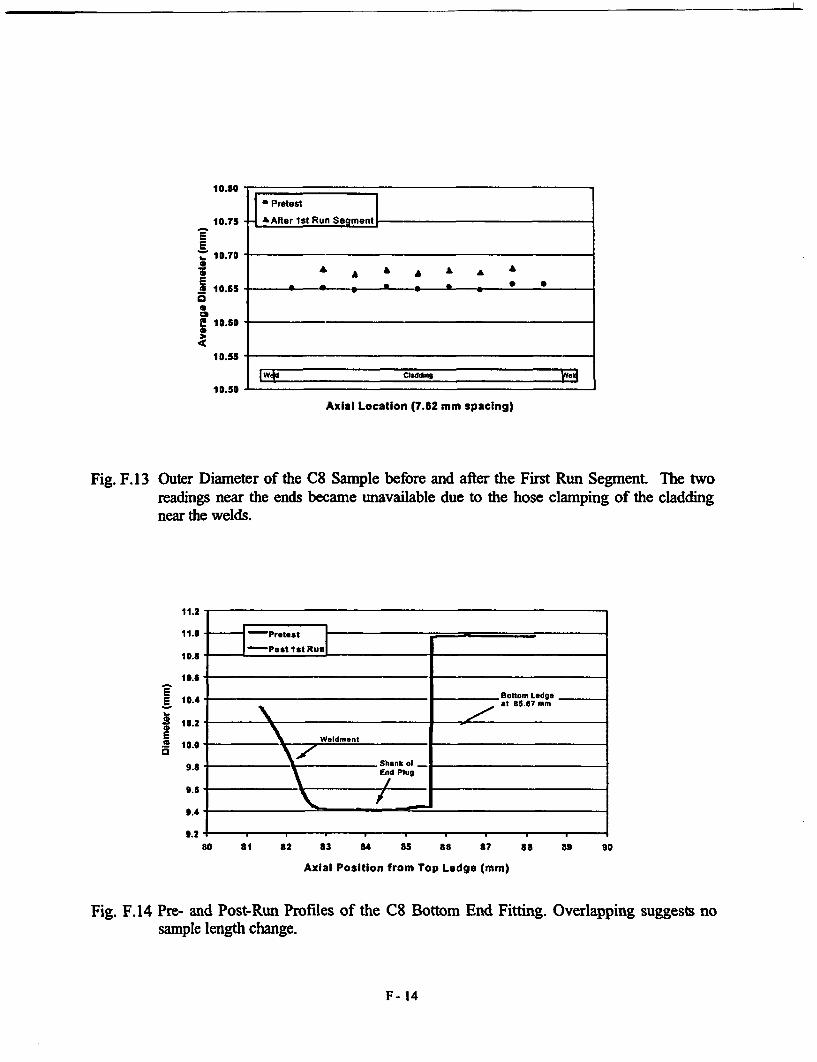
10.50
10.75
j 10.70
* 10.65is
04
9 10.s0
10.55
Protest
. I :After Ist Run . I
A A A A A a A0 0 a 0 a S, 0 -
I
Iw4d Cladding E310.50
Axial Location (7.62 mm spacing)
Fig. F. 13 Outer Diameter of the C8 Sample before and after the First Run Segment. The tworeadings near the ends became unavailable due to the hose clamping of the claddingnear the welds.
.i.0
so s1 82 83 84 as 6s 87
Axial Position from Top Ledge (mm)
38 a9 go
Fig. F.14 Pre- and Post-Run Profiles of the C8 Bottom End Fitting.sample length change.
Overlapping suggests no
F- 14

1.0
0.3
0.8 _ *OD
A AWall-Averagee
0- Strai
E
S
0.7
0.6
0.5
0 -
0.3
0.2
0.1
0.0
A
0 1,000 2,000 3.000 4,000
Time (h)
Fig. F.15 Strain vs. Time Plot for the C8 Sample after the First Run Segment. The calculatedwall-average hoop strain is 1.13 times that of the OD hoop strain.
F.3 Surry Post-Storage ThermalCreep Tests
At the end of the tests, all four samples werefound to have measurable strains andconfirmed to be intact.
F3.1 Pressure and Temperature Histories
Summary pressure and temperature historiesfor the C3, C6, C8 and C9 tests are shown inTable F.2 along with the target conditions.As noted before, the C9 test had two stresssettings - the initial 1873 h was 190 MPa,and the subsequent 693 h was 250 MPa.Also shown in the table are the wall-averagehoop strains at the end of the test durations.
It should be noted that the reported stressesare engineering hoop stresses, not truestresses. No efforts were made to adjust thegas pressure to keep the hoop stress constantto account for wall thinning. In all tests, theinternal pressure was maintained constantover the entire test duration.
All four tests were completed satisfactorily,and the composite pressure and temperaturehistories for one of the tests, C9 for theinitial 1873-h operation, are illustrated inFig. F.16. In this plot, the pressure traceappears to be a band with a thickness of =0.1 MPa (14 psig). At a higher resolution(Fig. F.17), it can be seen that the "band"reflects the working range of the pressurecontroller/regulator. The periodicity of thecycles (when the regulator openedmomentarily to replenish the loss of pressure
F- 15

due to leakage) was =6 h. The =±0.05 MPa(7 psig) pressure range translates into a±0.2% range on sample hoop stress.
F.25 show, respectively, the cladding cross-sectional profiles of the C3, C6, C8 and C9samples (at the axial midplane) before andafter the tests.
F.3.2 Summary Creep Results
Creep deformations as a function of time areshown in Figs. F.18, F.19, F.20, and F.21 forSamples C3, C6, C8, and C9, respectively.In each plot, both the OD strain and thecalculated wall-average strain are shown.The OD strain is multiplied by 1.13 toobtain the wall-average strain.
The radial plots of the sample cross sectionmay be useful to detect localized bulgingwhich may indicate non-uniform wallthinning or impending burst rupture. Thesedata were evaluated after every run. Allresults indicate the deformation to beazimuthally uniform, even for the C9 samplewith a wall-average hoop strain of 5.83% atthe end of test. Figs. F.22, F.23, F.24, and
At the time of test termination, the C3, C6and C8 samples were evidently in thesecondary (steady-state) creep regime. Thisalso appears to be the case for the C9 sampleat the end of the 190 MPa test. Steady-statecreep rates were calculated for the tests, andthe results are summarized in Table F.3.
There were no discernible sample lengthchanges in any of the tests. Figure. F.26shows the result for the C9 sample. The factthat the end fitting had the same diameter asbefore the test showed there was littleoxidation of the sample.
Table F.2 Achieved and Target Conditions for Surry Thermal Creep Test
Sample-
Time-Avg. Time-Avg.Temp. Pressure
(0C) (MPa)Actual Target Actual Target
360.4 360 27.99 28.06
Time-Avg.Hoop Stress
(MPa)Actual Target
TestDuration
(h)
Wall-Avg.Hoop
Strain (%).
C3C6C8
219.4 220
381.0 380 24.23 24.23 190.4 190
381.0 380 28.06 28.06 220.2 220399.6 400 24.23 24.23 189.8 190
3305234821801873693
0.220.351.10
1.045.83(a)
CQ-' 399.5 400 31.88
a. At the end of the 693 incremental hours.31.88 249.4 250
F -16

26
25
0
24
23
a0
22
21 F I I I it I I I I . I '~~~~~~~ 1 3E0
0 S00 1,000 1,500 2,000
Time (h)
Fig. F.16 Pressure and Temperature Histories for the Initial 1873-h Operation of the C9 Test.The test was interrupted nine times for profilometry measurements.
24.5
24.4
F
C,24.2 "NK KKN MUNN N N NNJ 'Li %4 Vj V V '11U LA %J V W U W 'NJ \14 \01
24.0
st-A
600 620 640 660 650 700
Time (h)
Fig. F.17 Expanded Scales of Fig. F.16 Showing the Operating Range of the PressureController/Regulator for the C9 Test. The periodicity was about 6 h.
F- 17

1.0
0.9-
0.8*
0.7
-0.5
s S*g 0.506
0Q4
0.3
0.2
0I1
0O.0
- Nominal Test ConditionsTemperature: 36C
- Engineering Hoop Stress: 220 MP2
00 HoOp Strain0.013% after 49 h0.042% after 217 h0.091% after 721 h0.117% after 1272 h0.122% after 1629 h0.194% after 3305 h
Average
0 1,000 2,000
Time (h)
4,000
Fig. F. 18 Deformation3305 h.
History of Sample C3 Operated Nominally at 220 MPa and 360°C for
1.0
0.9
0.8
0.7
t 0.4
0.
02
0.1
0.00 500 1000 1500 2000 2500 3000
Time (h)
Fig. F.19 Deformation History of Sample C6 Operated Nominally at 1902348 h.
MPa and 380°C for
F -18

2.0
1.6
1A
9t2~-1.C
It1.00.
CLI0.5
0.6
0.4
02
0.0
00 VrainNominal Test Conditions 0232 o :335 h1
Temperature: 380rC 0.7 0% 61 b- Engineering Hoop Stress: 220 MPa 0S14% @102 h
M8B18% 20 h.972% a 210h
Average
00
0 2,000 3,000
Time (h)
Fig. F.20 Deformation History of Sample C8 Operated Nominally at2182 h.
220 MPa and 380°C for
6.0
5.0 -
4.0-f.
a 3.0-
.0-
an
Nominal Test ConditionsTemperature: 400eC
Engineering Hoop Stresses: 1901250 MPa ItAverage //
I II
I/
OD Strain0.079% O 48 h0.136%0 120h0209% 0 240 h0266% 0 360 h0.3S1% O 552 h0.494% 0 912 h0.656% 01248 h0.729% 01489 h0.920% 01573 h1.588% 02041 h2.056% @2162 h2.918% 02330 h6.161% @2566 h
Stress Increasedtrom 190 to 250 MPa
I/D
.u
.1.01 �.�0.0
0 1,000 2000 3,000
Time (h)
Fig. F.21 Deformation History of Sample C9 Operated Nominally at1873 h and Subsequently at 250 MPa and 4000C for 693 h.
190 MPa and 400°C for
F - 19