nureg/cr-5574, 'determination of the chemical form of tritium
TRANSCRIPT
NUREG/CR-5574BNL-NUREG-52238
Determination of the ChemicalForm of Tritium inSelf-Luminous Signs
Manuscript Completed: April 1990Date Published: June .1990
Prepared byB. S. Bowerman, C. J. Czajkowski
Brookhaven National LaboratoryUpton, NY 11973
Prepared forDivision of Industrial and Medical Nuclear SafetyOffice of Nuclear Material Safety and SafeguardsU.S. Nuclear Regulatory CommissionWashington, DC 20555NRC FIN L1097

EXECUTIVE SUMMARY
Building exit signs containing tritium self-luminous light sources weredismantled, and the light sources were tested to determine the chemical form oftritium in this study. The objective was to quantify the amounts of tritiatedwater (TO or TOH) present in the light sources. The light sources consist ofsealed g ass tubes coated internally with a phosphor (zinc sulfide) and filledwith tritium gas (T2).
The chemical form of tritium is an important consideration for assessingradiological health impacts. The radiotoxicity of tritium gas (TJ or TH) is muchlower than that of tritiated water (TO or TOH). The amount of •ritiated waterin self-luminous devices is limited to two percent of the total tritiuminventory.
When the signs were dismantled, exterior and interior surfaces were wipedand the 'swipes' were tested for removable contamination. Four of the six signsexamined had removable contamination on interior surfaces, ranging from less than100 to more than 2,000 disintegrations per minute.
Quantitative measurements of total tritium and tritiated water were madeby scintillation counting. Samples for counting were obtained by breaking thelight source tubes in a gas flow system equipped with cold traps and a catalyticreactor. The system separated tritiated water from T2 and converted T2 to T20for subsequent trapping and counting. Qualitative tests conducted with aresidual gas analyser verified the presence of tritiated water in one lightsource tube. More tubes could not be tested with this method because ofequipment problems.
Light source tubes from four exit signs were tested. Two were new signs,one was six years old, and one was thirteen years old. In one of the new signs,the total tritium inventory included two percent tritiated water. Two of theother signs had higher amounts of tritiated water: 4.5% for the other new sign,and 14.5% for the six-year-old sign. In the oldest sign, an accurate inventoryof the tritium content was not available, but tritiated water accounted for 12.2percent of the total tritium collected for counting.
After individual experiments with the light source tubes, pieces of glassand phosphor powder remained. These residues were immersed in water, and thewater was tested for tritium by scintillation counting. The residues allcontained variable amounts of tritium which was released to the water. Tritiumrelease was slow, and its concentration in the water increased with time foreach sample, up to 78 days.
This scoping study has shown that tritiated water is present in all signstested. Older signs appear to have higher percentages of tritiated water thannew signs.
iii


TABLE OF CONTENTS
PAGE
EXECUTIVE SUMMARY ......... ..... ........................ iiiLIST OF FIGURES .................................. viiLIST OF TABLES ........ ...... ixACKNOWLEDGEMENTS ........ ... xi
1. INTRODUCTION ........ ....... ......................... .
2. DESCRIPTION OF SIGNS AND SURFACE CONTAMINATION ............ .3
3. DETERMINATION OF THE CHEMICAL FORM OF TRITIUM .... ........ 7
3.1 Analytical Methods ........... ... ................ 7
3.1.1 Chemical Separation and TrappingExperiments ......... ... ................... 7
3.1.2 Procedures for Mass SpectrometerExperiments ....... .................... . 10
3.2 Scintillation Counting Procedures ....... ............ 133.3 Results and Discussion ........... ................. 13
3.3.1 Calculation of Tritium Content of Tubes ..... 133.3.2 Summary of Trapping Experiments Data ...... ...... 153.3.3 Summary of Mass Spectrometer
Experiments ................. ..... 253.3.4 Phosphor Particle Size Measurements.... .. . 273.3.5 Laboratory Surface and Personnel
Contamination ........... ................. 27
4. CONCLUSIONS AND RECOMMENDATIONS .... ............... ..... 31
5. REFERENCES ..... .......... .................. .... 33
v

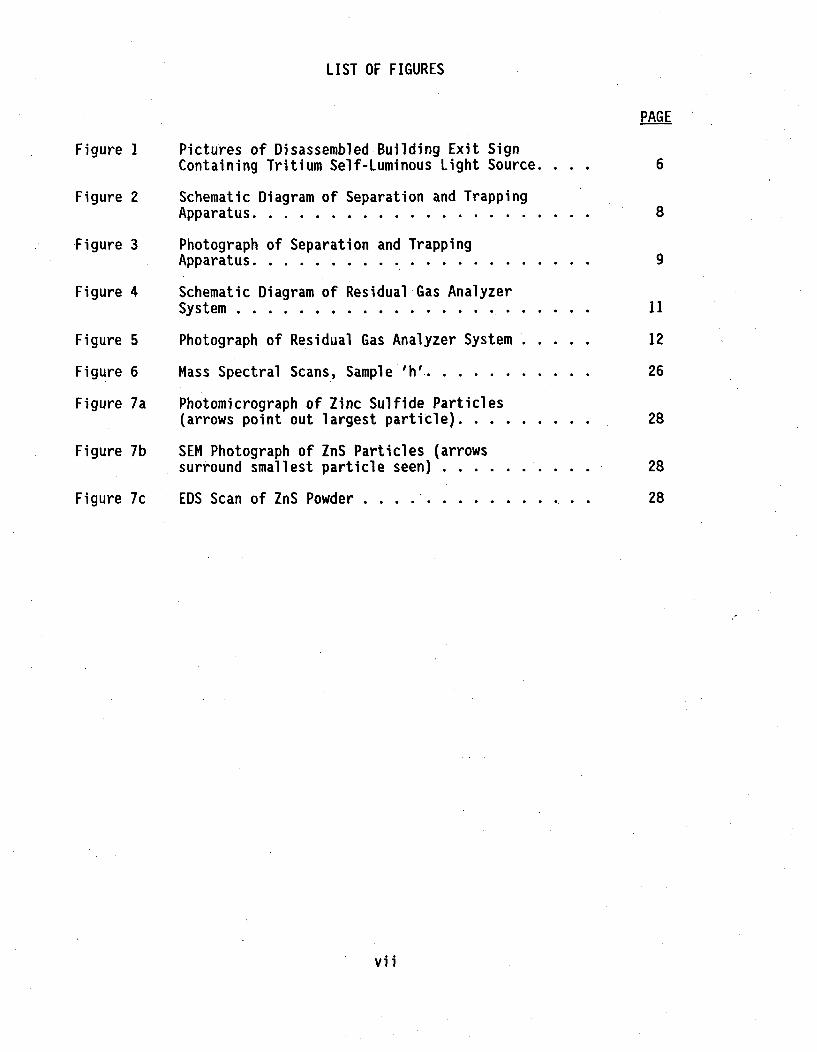
LIST OF FIGURES
PAGE
Figure 1
Figure 2
Figure 3
Figure 4
Figure 5
Figure 6
Figure 7a
Figure 7b
Figure 7c
Pictures of Disassembled Building Exit SignContaining Tritium Self-Luminous Light Source.
Schematic Diagram of Separation and TrappingApparatus ...... ...................
Photograph of Separation and TrappingApparatus ...... ...................
Schematic Diagram of Residual Gas AnalyzerSystem ..... ................. . . .
Photograph of Residual Gas Analyzer System
Mass Spectral Scans, Sample 'h' ...........
Photomicrograph of Zinc Sulfide Particles(arrows point out largest particle) .......
SEM Photograph of ZnS Particles (arrows
surround smallest particle seen) ........ .
EDS Scan of ZnS Powder .................
6
8
9
11
12
26
28
28
28
vii

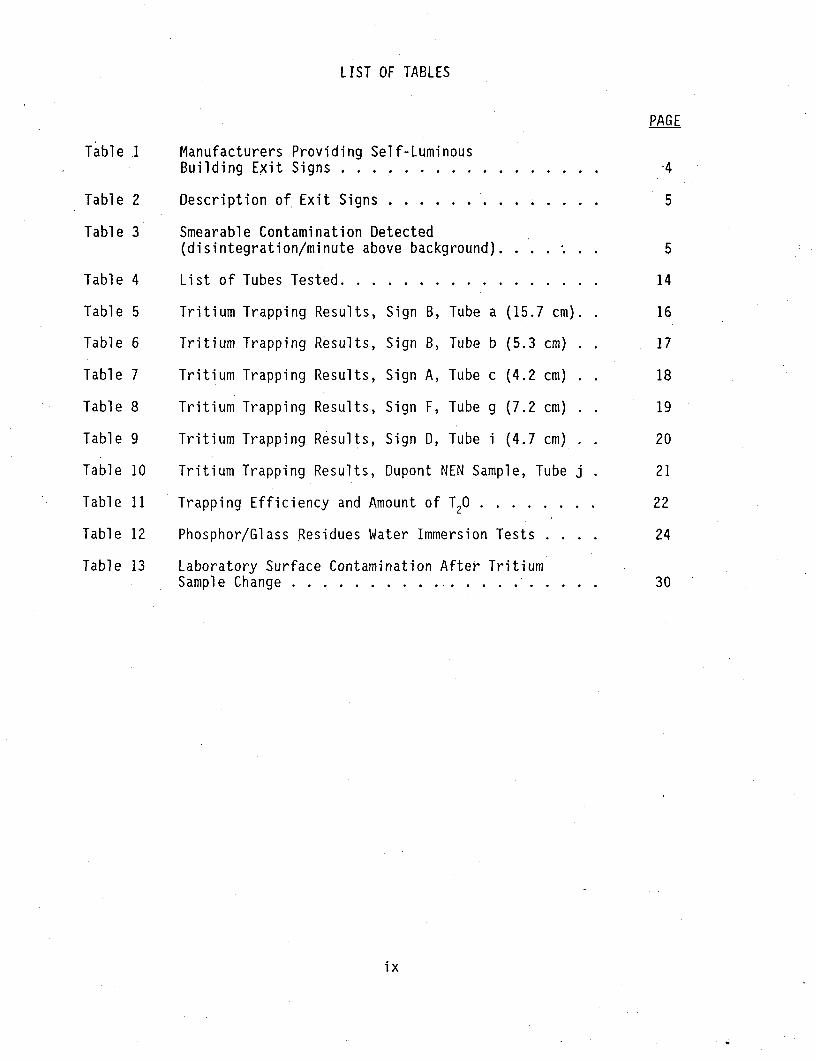
LIST OF TABLES
PAGE
Table 1 Manufacturers Providing Self-LuminousBuilding Exit Signs . . .... ..... ....... ........... . 4
Table 2 Description of Exit Signs ...... ... ......... 5
Table 3 Smearable Contamination Detected(disintegration/minute above background) ........ . 5
Table 4 List of Tubes Tested ..... ................. ..... 14
Table 5 Tritium Trapping Results, Sign B, Tube a (15.7 cm). 16
Table 6 Tritium Trapping Results, Sign B, Tube b (5.3 cm) 17
Table 7 Tritium Trapping Results, Sign A, Tube c (4.2 cm) 18
Table 8 Tritium Trapping Results, Sign F, Tube g (7.2 cm) 19
Table 9 Tritium Trapping Results, Sign D, Tube i (4.7 cm) 20
Table 10 Tritium Trapping Results, Dupont NEN Sample, Tube j 21
Table 11 Trapping Efficiency and Amount of T20 0......... .... 22
Table 12 Phosphor/Glass Residues Water Immersion Tests . ... 24
Table 13 Laboratory Surface Contamination After TritiumSample. Change ..... ................ I...... ... 30
ix


ACKNOWLEDGEMENTS
The authors wish to thank the NRC Project Manager for helpful discussionduring the course of this work. We wish to thank Messrs. D. Errante and J.Vignola and Dr. R. Reciniello of the Health Physics Group, Safety & EnvironmentalProtection Division, for conducting the tests for surface contamination. Inaddition, we wish to express our gratitude to Mr. R. Pietrzak for his expertisein providing the scintillation counting data and Mr. S. Getzow for his aid incalibrating the mass spectrometer. We appreciate the critical review of themanuscript given by Drs. M. G. Cowgill and P. Soo. Finally, we gratefullyacknowledge the skill and efforts of Ms. A. Lopez in preparing this document.
xi


I. INTRODUCTION
Tritium gas sealed in phosphor-coated glass tubes is one of the more commonapplications of radioactive materials in commercial and consumer goods. Betaradiation from the tritium excites the phosphor to produce visible light.Tritium light sources have been used in aircraft exit signs, airport landinglights, electronic devices, building exit signs, and watches.
Several incidents involving damage to building exit signs and breakage ofindividual light sources have occurred recently. The contamination resultingfrom these incidents was more extensive than had been expected by both the signvendors and the Nuclear Regulatory Commission (NRC). The extensive contaminationraised questions about the chemical form of the tritium, since the radiotoxicityof tritium is more than 10,000 times lower for tritium gas (T or HT) than it isfor tritiated water (T20 or TOH).a The different radiotoxicAies are reflectedin the derived air concentration (DAC) limits for radiation workers calculatedby the International Commission on Radiological Protection.(I) Workers exposedto tritium gas or tritiated water vapor for 2,000 hours per year will receivea 5 rem dose when the air concentrations are:
HT 21.6 uCi/mi3
HTO 5.4 x 10' pCi/m 3 .
The chemical form of tritium in the light sources is thus an importantconsideration for assessing their radiological health impacts. A study, con-ducted some years ago,( 2 reported that five light sources, about 2.5 years old,had tritiated water contents ranging from 0.6% to 6.8% of the total tritiumcontent.
In view of the recent contamination incidents and because of uncertaintiesabout tritiated water contents in the light sources, the NRC contracted withBrookhaven National Laboratory (BNL) to determine the chemical forms of tritiumand amounts of each in selected building exit signs. In addition to chemicalanalyses, the project also called for dismantling the exit signs and testinginterior and exterior components and glass tube (light source) surfaces fortritium contamination.
The results of this scoping study are presented in the balance of thisreport. Section 2 describes the signs received and tested and additionally liststhose signs with surface contamination. Section 3 describes the experimentsconducted to identify the chemical species quantitatively. Two methods wereused: quadrupole mass spectrometry and a "wet chemical" method involvingseparation of the different chemical species followed by scintillation counting.The latter method is a modification of the procedure used in the earlier studyby Niemeyer.(2) Finally, the conclusions of this study are presented in Section4, which also suggests. topics for further investigation to determine moreaccurately the radiological health effects resulting from use of tritium lightsources in commercial and consumer goods.
In this report, T is the chemical symbol for tritium. The two possible forms of tritiated water are sometimesreferred to as tritium oxide (T2 0) and tritium hydroxide (TOH). Here the term tritiated water refers to both.The term tritium gas refers to T2 and HT.
1


2. DESCRIPTION OF SIGNS AND SURFACE CONTAMINATION
BNL received six building exit signs made by the first four manufacturerslisted in Table 1. The fifth; Safety Light Corporation, sent aircraft exit signsmade in the 1960's, which were not -examined for this study. The fourth manu-facturer listed, American Atomics Corporation of Tucson, has apparently gone outof business. The sign made by that company was sent by the.Atomic Energy ControlBoard (AECB) of Canada. Because of the sensitive issues raised and due to thefact that this work is scoping in nature, the identification of which testresults correspond to which manufacturer's signs has been maintained asproprietary, except for the sign obtained from the AECB.
Table 2 provides information on the signs. Tubes from four of the signs,A, B, D and F, were tested in this study. The signs themselves had labels onthem listing the manufacturer, model and serial number, date of manufacture,and nominal tritium content in curies. From telephone contacts with themanufacturers, it was learned that the signs usually contained significantly lessthan the quantity listed on the label. An exact figure for the tritium contentof sign F could not be obtained because American Atomics Corporation, the companythat made that sign, could not be reached. Of the four signs tested, two werebrand new (A and D), and two were of older vintage (B and F).
All the signs were similar in design, with external dimensions ofapproximately 20. cm high by 33 cm wide by 2.5 cm deep (8 x 13 x I inch). Figure1 shows one of the signs after being dismantled. The tritium light sources werecontained inside a hard plastic outer shell. Behind the tritium-containing tubeswas a reflector, and in front of the tubes a transparent plastic plate or atranslucent diffuser. The glass tubes were fixed in place with an epoxy-typeglue or potting material. Older signs had 7 mm outer diameter glass tubes: newersigns were equipped with 5 mm OD tubes.
It is worth noting that the signs were not easily disassembled; a hammerand wedge were necessary to break glued joints. None of the glass tubes insidethe signs were broken when the signs were disassembled.
Table 3 lists dry smear test results. Four of the six signs had removablecontamination from internal surfaces. Staff from the Health Physics Group(Safety & Environmental Protection Division, BNL) conducted the smear tests.Counts were obtained on a gas flow counter. The contamination levels(disintegrations per minute or dpm) shown in Table 3 were calculated from countsper minute after accounting for the detector's efficiency (20%) and a backgroundof 30±6 counts per minute. Smears were taken of the exterior and interiorsurfaces of the signs, and of each letter individually.
None of the signs had tritium contamination on external surfaces. Four ofthe signs had some contamination on the glass tubes (inside the signs), the worstbeing sign A, which had more than 2,000 disintegrations per minute (dpm) on theletters 'E' and 'IT.' The latter were on a new sign, made in August, 1989.
3

Table 1
Manufacturers Providing Self-Luminous Building Exit Signs
1. SRB Technologies, Inc.P. 0. Box 25267Winston-Salem, NC 27114
2. NRD2937 Alt Blvd. NorthGrand Island, NY 14072
3. Self-Powered Lighting, Inc.8 Westchester PlazaElmsford, NY 10523
4. American Atomics Corp.Tucson, AZ(Sign supplied by Atomic Energy ControlBoard of Canada)
5. Safety Light Corporation4150-A Old Berwick RoadBloomsburg, PA 17815(Aircraft exit signs provided)
4

Tabl e 2
Description of Exit Signs
Tritium Contýent Total Length ofBNL Date of (Curies)(" Glass Tubes
Designation Manufacture Nominal Actual in Sign (cm)
A 8/89 20 4.7 105.6
B 12/83 25 14.9 102.0
C 4/85 25 19.8 105.7
D 8/89 25 10.5 106.7
E 8/89 20 -- 110.4
F 10/76 21 -- 109.4
(')Values shown are for the date of manufacture. Nominal amounts werelisted on sign labels as the maximum content. Actual amounts wereobtained by telephone contacts with the manufacturer.
Table 3
Smearable Contamination Detected(disintegrations/minute above background)
Sign No. Exterior Interior E X I T
A - - 2,300 - 2,8001
B - - 160 - - -
D - - - 10 -
E - - 90 - -
1 Letters I and T were tested using one wiper.
5
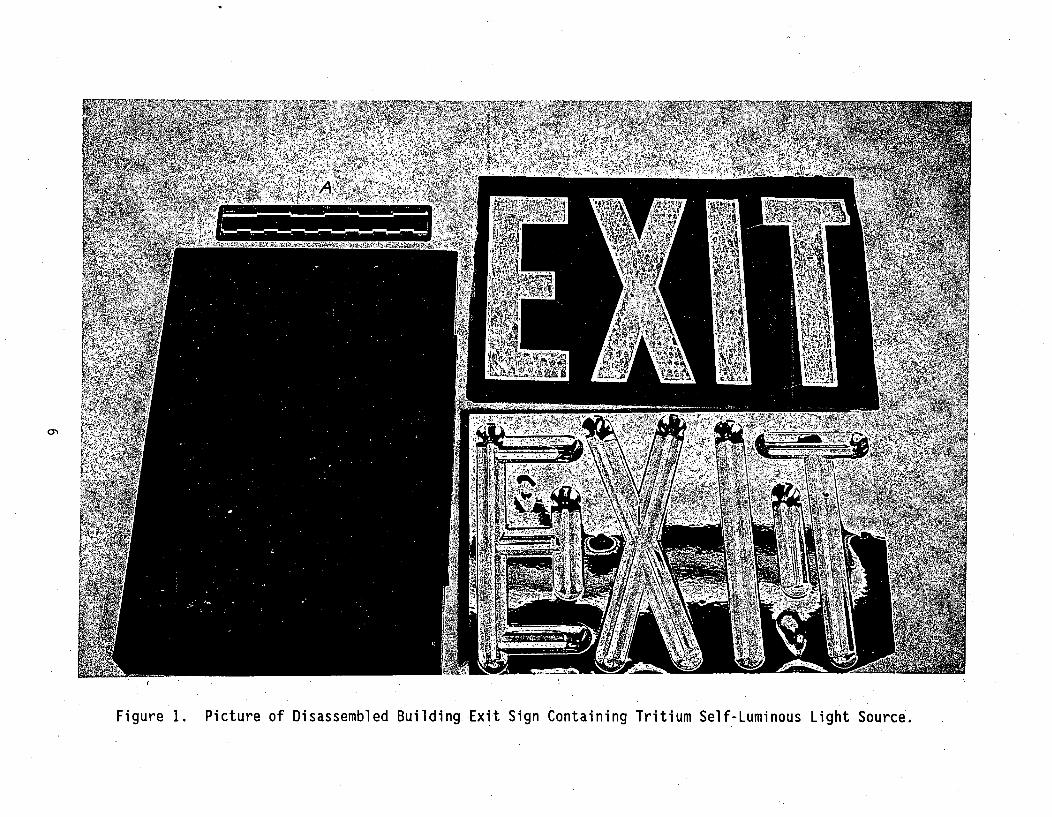
Figure 1. Picture of Disassembled Building Exit Sign Containing Tritium Self-Luminous Light Source.

3. DETERMINATION OF THE CHEMICAL FORM OF TRITIUM
3.1 Analytical Methods
Two methods were used to determine the chemical form of tritium in self-luminous signs: mass spectrometry and chemical separation followed by scintil-lation counting. Mass spectrometry was preferred because it was considered'arapid and reliable method for distinguishing tritium gas from tritiated water.An additional advantage was generation of less tritium-contaminated waste, sincethe gas was vented to the exhaust stack used by the High Flux Beam Reactor(HFBR). However, because of equipment problems with the Residual Gas Analyzer(RGA) and its high-vacuum system, the chemical separation method was used toobtain quantitative-measurements of the chemical form of tritium.
3.1.1 Chemical Separation and Trapping Experiments
The chemical separation arn) trapping experiments were adapted fromprocedures described by Niemeyer. The general principal involves breaking aglass tube containing phosphor and tritium in a metal container, and flushingthe container with helium gas through a series of traps and a catalytic reactor.Figure 2 shows a schematic diagram of the system; a picture of the system, exceptfor the gas supply cylinders, is shown in Figure 3.
The glass tubes were removed from several building exit signs. These areplaced one at a time in a stainless steel tube (3/4" OD) with two ball bearings(3/8" dia.) on each end. Before valves were assembled on the ends of the metaltube, a porous filter material was packed in the tube ends to prevent glasspieces and phosphor from being carried by the gas flow into the rest of theapparatus. The metal "break tube" was evacuated for the first several runs' tominimize reactions with air to form tritiated water. In the last three trappingexperiments, the metal tube was flushed with helium to remove oxygen beforebreaking the glass tube.
After oxygen was removed from the metal break tube, the valves were closedoff and the unit removed from the apparatus and shaken to break the glass tube.with the ball bearings. The metal break tube was then reattached to the trappingapparatus, and the gas flow started. In the first three tests, the metalcontainer was heated with a hot air gun to ensure that all tritiated water wasdriven into the trap apparatus. Heat was not applied in later tests to simulateaccidental exit sign breakage.
While the break tube assembly was being prepared, the furnace for thecatalytic reactor was turned on and warmed up. The reactor, consisting of aquartz-tube packed with cupric oxide (CuO), was kept at 6000 C to oxidize T2 toTO0.
The liquid nitrogen cooled traps (Ti to T4 in Figure 2) removed water andtritiated water (HOH, TOH, and TOT) from the gas phase. After the second trap,oxygen was added to the gas stream which then passed through the catalyticreactor. Tritium gas converted to tritiated water was collected in the thirdand fourth cold traps.. Two gas bubblers containing deionized water were lastin line to achieve more complete tritium removal before venting the gas to a fume.hood connected to the HFBR exhaust stack.
7
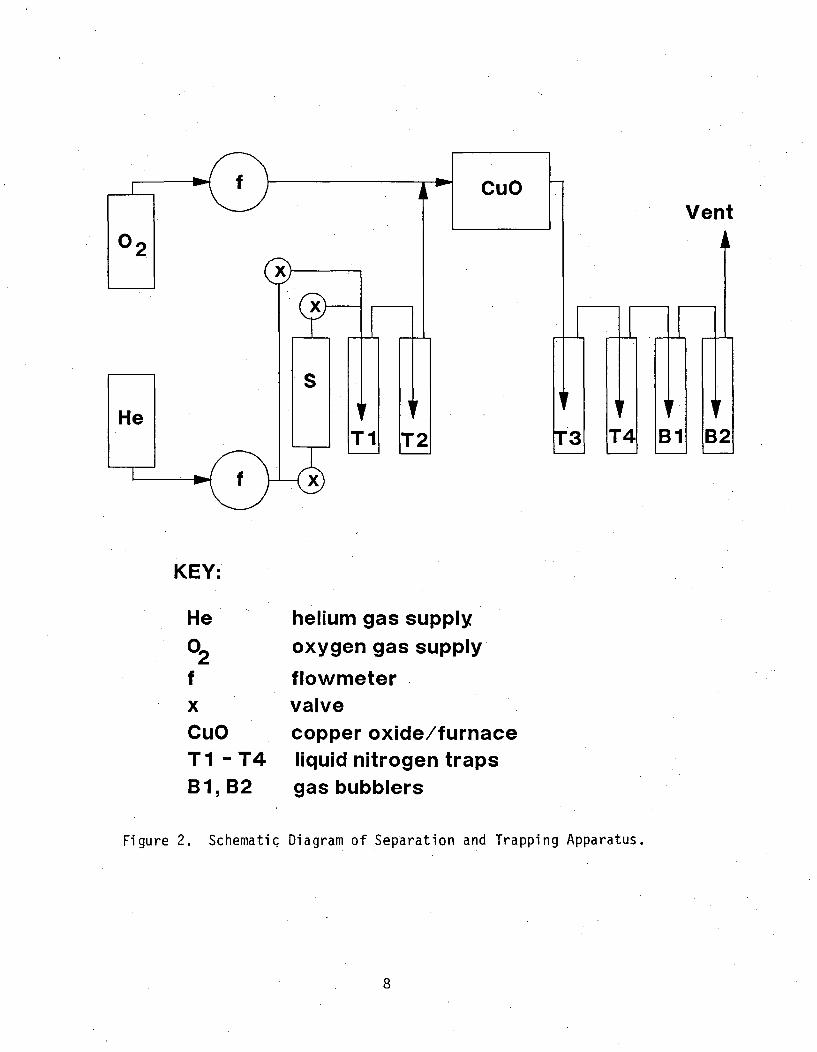
KEY:
He02fxCuOTI -T4B1, B2
helium gas supplyoxygen gas supply
flowmetervalvecopper oxide/furnaceliquid nitrogen traps
gas bubblers
Figure 2. Schematic Diagram of Separation and Trapping Apparatus.
8

Figure 3. Photograph of Separation and Trapping Apparatus.

Gas flow rates were as follows:
Helium flow: 0.1 to 0.2 L/minOxygen flow: 0.1 L/min
For each tube broken (except the first), 18 samples were collected: one fromeach trap and bubbler collected after three trapping runs conducted over threedays. The traps were rinsed with deionized water into 150 mL plastic bottles.The bottles were then analysed by liquid scintillation counting as describedbelow. After rinsing, the traps were connected to the apparatus for subsequentexperiments.
Experimental runs to generate a set of six samples lasted four to fivehours. After three runs, the glass fragments and phosphor were collected andimmersed in deionized water with the filter packing and assorted Kimwipes usedto clean out the metal break tube. (The ball bearings were wiped and removedfrom this sample after the first test, because the water began to turn brown fromthe bearings rusting.) This nineteenth sample was also tested for residualtritium using liquid scintillation counting. Because not all of the tritiumtheoretically present in the tubes could be accounted for (see results, Section3.3) additional scintillation counting measurements of the glass/ phosphorresidues were made at later times to see if tritium bound to the phosphor orglass could be released into the water as time passed.
3.1.2 Procedures for Mass Spectrometer Experiments
The initial plan for this study was to analyse the chemical form of tritiumusing a residual gas analyser (RGA) containing a quadrupole mass spectrometer.An Inficon IQ 200 mass analyser system (Leybold-Heraeus) that was available wasdedicated for use in this task. The handling procedure for glass tubes fromthe exit signs was similar to that described for the trapping apparatus in theprevious section. In these experiments, the tritium was NOT completely convertedto tritiated water, as was done earlier.
A schematic diagram of the apparatus is shown in Figure 4; Figure 5 is apicture of the system. The glass tubes containing tritium and phosphor wereplaced inside a stainless steel tube (3/4" OD) with two stainless steel ballbearings (3/8" diameter). The metal break tube was connected to the gasmanifold, and evacuated. The evacuated tube was disconnected (between valvesA and B) and shaken to break the glass tube, then reconnected to the manifold.After the system was evacuated again (with valve B closed), the analysis of thegas was accomplished by opening valve B and the variable leak valve (C) enoughto let gas from the glass tube into the mass spectrometer's high vacuum system.
Two sets of mass spectrometer readings were taken, with the sample at roomtemperature and at 1000C. The higher temperature tests were conducted to ensurethat all tritiated water in the system was in the gas phase.
After the measurements of gas composition, the variable leak valve wasclosed and the gas manifold system including the break tube was flushed withhigh-purity argon to a hood which vents to the HFBR and Hot Lab stack througha HEPA filter. The glass and phosphor residues were collected in a bottle andimmersed in deionized water, together with Kimwipes that were used to clean outthe metal break tube. The ball bearings were wiped clean and saved for latertests.
10

Pump Ven
KEY:
Ar Argon flush gas
x valves
Figure 4. Schematic Diagram of Residual Gas Analyser System.
11

11
d'
ago Ing
goneOmannone
Figure 5. Photograph of Residual Gas Analyser System.
IMME

Samples of the water covering the residues were tested by scintillationcounting for residual tritium after a few days immersion. The residues andassociated water were tested at later times to see if the tritium bound to thephosphor or glass was released slowly after immersion in water.
As noted earlier (Section 3.1), equipment problems were encountered'withthe RGA and the high-vacuum system. As a result, reproducible quantitative datacould not be obtained. Qualitative confirmation of the presence of tritiatedwater was achieved in one of the three tubes examined (see Section 3.2)
3.2 Scintillation Countinq Procedures
Water samples from the tritium trapping apparatus and water samplescontaining glass tube and phosphor residues were analysed for tritium byscintillation counting. The Waste Management Research and Development Group(Radiological Sciences Division, BNL) performed the scintillation countinganalysis. The procedure involved taking a 20 microliter (ML) aliquot from eachbottle and mixing this with 10 mL of liquid scintillation cocktail. For thosesamples with too high a concentration of tritium, dilutions were necessary toobtain an accurate reading of counts per minute. Results for this study werereported as disintegrations per minute per milliliter (dpm/mL).
For each set of samples to be counted, blanks and standards wereinterspersed with the tritium samples. Blanks consisted of deionized water;calibration standards were prepared from a tritiated water standard purchasedfrom Dupont NEN Research Products (Tritium Reference Source, NES-003, Lot No.NS 239-016, 1982). The scintillation counter system was a Searle Analytic 92Liquid Scintillation System.
3.3 Results and Discussion
Table 4 lists the tubes which were tested for this study, as well as thesign from which they were obtained, the tritium content of each tube, and themethod of testing. Six experiments were conducted using the trapping andscintillation counting method, and four tubes were examined with the RGA. Twoof the tubes examined, one by each experimental method, contained tritium gasonly (no phosphor) at the time of manufacture. These tubes are availablecommercially, and were tested because they contained a known quantity of tritium.
3.3.1 Calculation of Tritium Content of Tubes
For the older tubes tested, the amount of tritium originally present hasdecreased due to radioactive decay. A correction to the total tritium in theolder samples was necessary for tubes taken from sign B (manufactured inDecember, 1983) and sign F (manufactured in October, 1976). Sign B contained14.9 Curies of tritium when it was made, according to the manufacturer. Sincethe company that made sign F could not be reached, total original tritium contentwas assumed to be 21 Curies. This was the nominal amount listed on the sign'slabel, but this is believed to be higher than the amount actually in the sign.
13

Table 4
List of Tubes Tested
Length Tritium Content ExperimentalSample No. Sign (cm) in Tube' (mCi) Method
a B 15.7 1,650.963 Scintillation Counting
b B 5.3 557.331 Scintillation Counting
c A 4.2 186.932 Scintillation Counting
d A 4.3 2 Mass Spectrometer
e 2 Mass Spectrometer
f F 7.2 ._2 Mass Spectrometer
g F 7.2 655.042 Scintillation Counting
h B 5.4 . 2 Mass Spectrometer
i D 4.7 462.380 Scintillation Counting
j 4- 1,000.000 Scintillation Counting
1mCi amounts for signs B and F corrected to the month in which theywere tested.2Tritium content of tubes tested in RGA was not calculated because aquantitative mass balance of tritium was not attempted.
3Sample e was a glass tube of tritium gas obtained fromAmersham in 1978 and kept in storage at BNL.
4Sample j was a glass tube containing nominal 1.0 Ci of tritium gasobtained from a commercial isotope supplier in 1990.
14

snT current activity level (at the time of the experiment) is calculatedusing: (
A A A e-(In 2)At/tl/2
where
A = current Curie amount,
A0 = original Curie amount,
At = time change, in years, and
t1/2 ý tritium's 12.3 year half-life.
Sign B was tested in October, 1989, and sign F in January, 1990. Thecurrent activity levels are 10.726 Ci and 9.953 Ci, respectively. Decaycorrections for tubes from signs A and D were not made since these were bothmanufactured in August, 1989 and tested within six months of the date. Totaltritium would thus have decreased at most by 3 %.
To calculate how much tritium was present in each tube, it was assumed thattritium was distributed uniformly among the pieces of glass tubing in each sign.Dividing tritium inventory by total length of tubing (both quantities are listedin Table 2) and then multiplying by the length of each tube (listed in Table 4)yields the number of millicuries for each tube listed in Table 4.
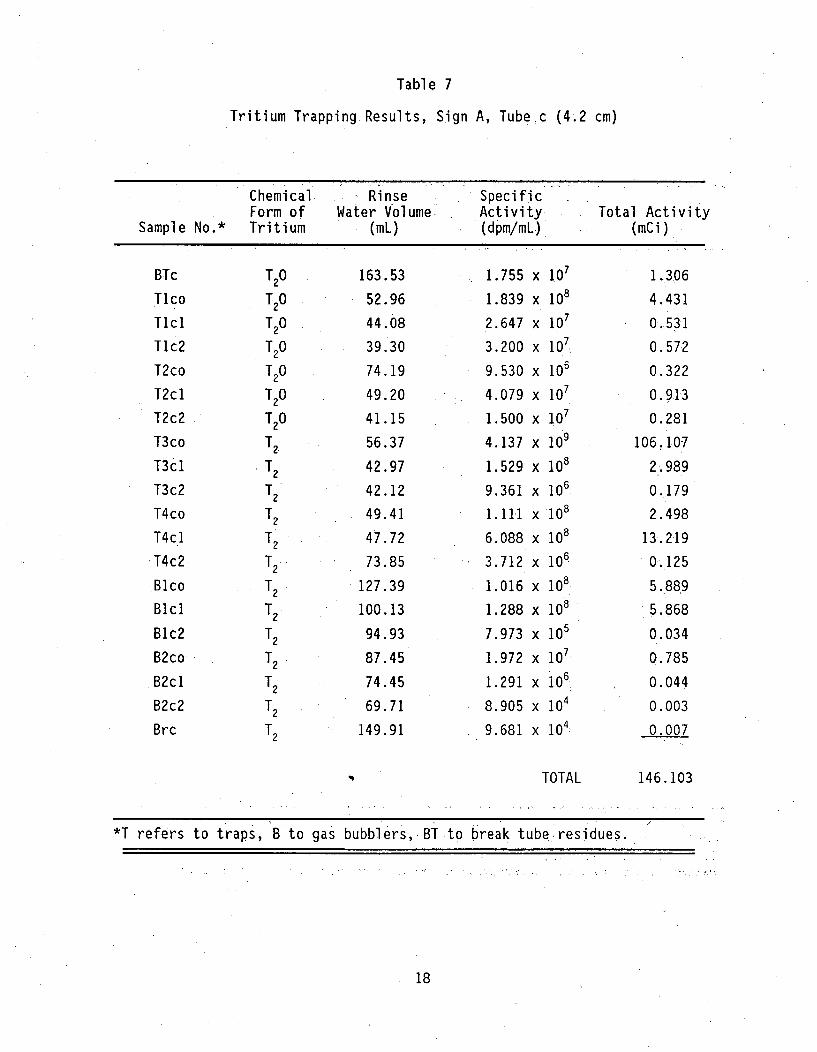
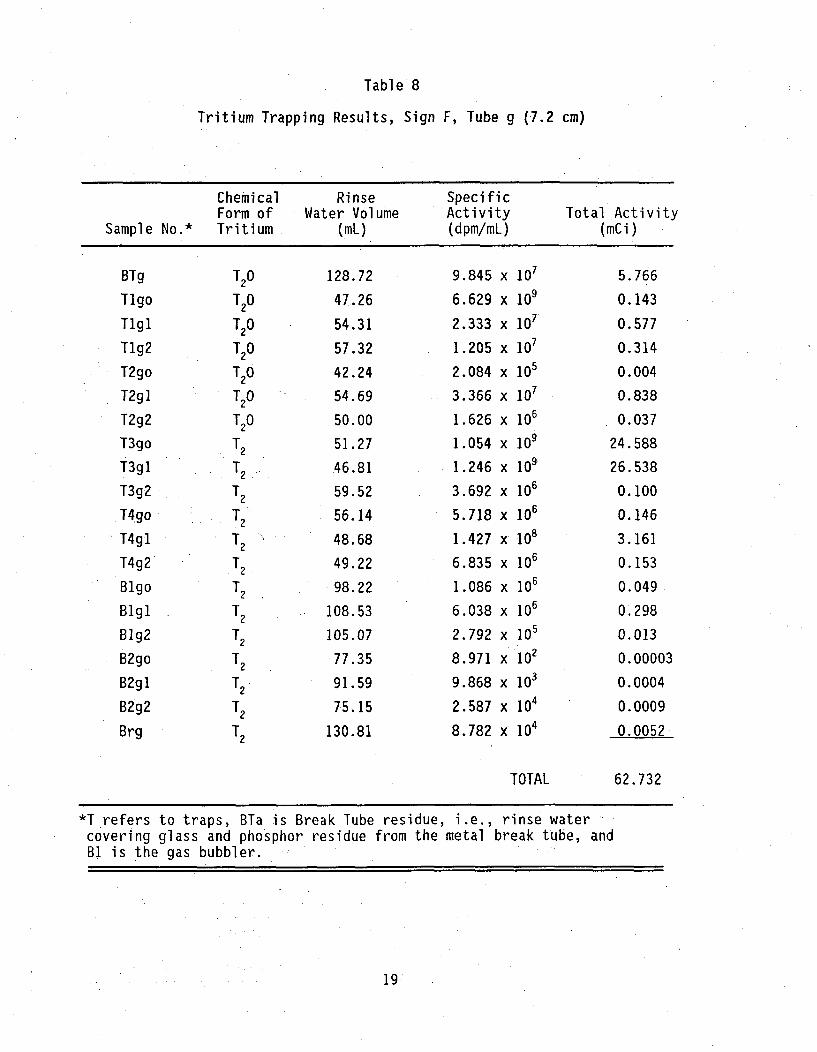
3.3.2 Summary of Trapping Experiment Data
The initial data obtained from the trapping experiments are listed in Tables5 through 10, inclusive. To calculate the number of millicuries in each sample,the water volume was multiplied by (he specific activity and, then by theconversion factor 4.55 x 10-lu mCi/dpm.( 3 For these experiments, tritiated waterfrom the glass tubes was assumed to be trapped in the cold traps situatedupstream of the catalytic reactor (Ti for tube a, TI and T2 for the rest of theexperiments). Tritiated water was also assumed to be present in samplescontaining the glass and phosphor residues (samples labeled BT_).
Table 10 shows the results of trapping experiments conducted using a nominal1.0 Curie tritium gas source obtained from a commercial isotope supplier. Thetritium was contained in a glass tube, but no phosphor was present. Surpris-ingly, more than four curies were collected in this experiment. Contacts withthe supplier revealed that tritium packaged as gas in tubes is measured outusing manometers. According to the supplier, 1.0 curie represents the lowerlimit for accurately metering tritium. Although the total tritium inventory wasmore than expected, the experiment demonstrated the method's validity in thateven relatively small amounts of tritiated water were separated from the gas forsubsequent analysis.
The important consideration for this study was to quantify how much tritiumwas present as TO or TOH. Table 11 lists the amounts of tritiated water foreach tube as miliicuries and as a percentage of the total tritium activity inthe tubes, the percentages of tritiated water are calculated for the theoreticalamount of tritium present in each tube and as a percentage of the amount trapped.
15

Table 5
Tritium Trapping Results, Sign B, Tube a (15.7 cm)
Chemical Rinse SpecificForm of Water Volume Activity Total Activity
Sample No.* Tritium (mL) (dpm/mL) (mCi)
BTa T20 301.20 7.418 x 10⁷ 10.166
T1ao T O 30.78 8.874 x 10' 124.279
Tlal T20 26.14 2.702 x 10⁸ 3.214
T2ao T2 60.93 1.255 x 10¹⁰ 347.926
T2al T2 42.87 1.898 x 10⁷ 0.370
T3ao T2 23.03 9.151 x 10' 95.890
T3al T2 57.87 1.409 x 10' 0.371
Blao T2 90.40 4.845 x 10⁹ 199.285
Blal T2 100.32 1.052 x 10⁶ 0.048
Bla2 T2 100.22 1.012 x 10⁶ 0.046
TOTAL 781.595
*T refers to traps, BTa istBreak Tube residue, i.e., rinse watercovering glass and phosphor residue from the metal break tube, andBi is the gas bubbler.
Tritiated water was found to be present in each tube. The lowest percentagesof tritiated water, i.e., 2 to about 5 %, were found in tubes removed from thetwo newest signs, A and D. From these limited data, it appears that older signswill have a higher percentage of tritium in the form of tritiated water.Although tube 'g' from sign F apparently had 1.2 % tritium of the theoreticalamount, it is believed that this value is low, because the nominal total tritiumwas used for the calculation rather than an exact value from the manufacturer.
16

Table 6
Tritium Trapping Results, Sign B, Tube b (5.3 cm)
Chemical Rinse SpecificForm of Water Volume Activity Total Activity
Sample No.* Tritium (mL) (dpm/mL) (mCi)
BTb
TIbo
T1bI
T1b2
T2bo
T2b1
T2b2
T3 bo
T3b1
T3b2
T4bo
T4b0
T4b2
B1bo
Blbo-1
BIbi
Bib1-1
Bib2
B2b2
T20
T20
T20
T20T20
T20
T2
T2
T2
T2
T2T2T2.T 2T2
T2T2
201.12
29.23
50.20
83.43
30.03
70.74
58.79
41.93
65.00
58.06
45.85
66.45
70.44
130.06
38.91
131.24
115.60
113.32
106.19
1.555
3.8173.453
4.258
1.292
1.144
2.980
9.871
4.496
1.039
2.411
1.442
1.699
3.229
1.693
1.446
3.526
5.265
3.336
108
109
108
108
108101
107
101
101
107
101
108.10,
108
106
107
107
101
103
14.230
50.765
7.887
1.616
1.765
3.682
0.797
188.320
13.297
0.274
50.298
4.360
0.054
19.108
0.030
0.863
1.855
0.027
0.0002
TOTAL 359.228
*T refers to traps, B to gas bubbler, BT to Break Tube residues.
17
Tabl e 7
Tritium Trapping Results, Sign A, Tube c (4.2 cm)
Chemical Rinse SpecificForm of Water Volume Activity Total Activity
Sample No.* Tritium (mL) (dpm/mL) (mCi)
BTc
TIco
TICI
T1c2
T2co
T2c1
T2c2
T3co
T3cI
T3c2
T4co
T40c
14c2
B1co
Bicl
Bic2
B2co
B2ci
B2c2
Brc
120120
120
TO0T20
T20
T20
T2OT2T2
T2.
T2
T2T2
T2
T2
T2
T2
T2
T2
T21 2
163.53
52.96
44.08
39.30
74.19
49.20
41.15
56.37
42.97
42.12
49.41
47.72
73.85
127.39
100.13
94.93
87.45
74.45
69.71
149.91
1.755
1.839
2.647
3.200
9.530
4.079
1.500
4.137
1.529
9.361
1.111
6.088
3.712
1.016
1.288
7.973
1.972
1.291
8.905
9.681
x 107
x 108
X 107
X 107.
x 106
X 107
x 107
x 1091
x 108
x 106:
x 108
x 108
x 10
x 108.
x 108
x 10sX 107•
x 106,
x 104
x 10.
1.306
4.431
0.531
0.572
0.322
0.913
0.281
106,107
2.989
0.179
2.498
13.219
0;.125
5.889
5.868
0.034
0.785
0.044
0.003
0.007
146.103TOTAL
*T refers to traps, B to gas bubblers, BT to break tube residues.
18
Tabl e 8
Tritium Trapping Results, Sign F, Tube g (7.2 cm)
Chemical Rinse SpecificForm of Water Volume Activity Total Activity
Sample No.* Tritium (mL) (dpm/mL) (mCi)
BTg
TIgo
Tigl
Tlg2
T2go
T2g 1
T2g2
T3go
T3gI
T3g2
T4go
T4g 1
T4g2
BIgo
BIgI
Big2
B2go
B2g1
B2g2
Brg
T20
T20
T20T20
TO2
TO2
TO2
TO2
T2
32
T2
12
T12
12
12T 2T 2
128.72
47.26
54.31
57.32
42.24
54.69
50.00
51.27
.46.81
59.52
56.14
48.68
49.22
98.22
108.53
105.07
77.35
91.59
75.15
130.81
9.845
6.629
2.333
1.205
2.084
3.366
1.626
1.054
1.246
3.692
5.718
1.427
6.835
1.086
6.038
2.792
8.971
9.868
2.587
8.782
107
109
107
107
105107
106
109
109
106
106
108
106
106
106
105
102
103
104
104
5.766
0.143
0.577
0.314
0.004
0.838
0.037
24. 588
26. 538
0.100
0.146
3.161
0.153
0.049
0.298
0.013
0.00003
0.0004
0.0009
0.0052
62.732TOTAL
*T refers to traps, BTa is Break Tube residue, i.e., rinse water
covering glass and phosphor residue from the metal break tube, andBI is the gas bubbler.
19

Table 9
Tritium Trapping Results, Sign D, Tube i (4.7 cm)
Chemical Rinse SpecificForm of Water Volume Activity Total Activity
Sample No.* Tritium (mL) (dpm/mL) (mCi)
BTi
Tlio
Tlil
Tli2
T2io
T2il
T2i2TDioT3 i 1T3il
T3i2
T4io
T4il
T4i2
Blio
Blil
BHi2
B2io
B2il
B2i2
T20
T20
T20
T20
T20
T20
T20
T2T2
2
T2
T2
T2
T 2T 2T 2T 2T 2T 2
141.53
44.90
52.03
51.43
60.15
56.33
42.72
45.67
42.94
56.20
56.40
52.47
41.09
108.23
127.29
121.98
96.79
92.76
87.21
8.740
7.824
9.618
1.823
5.248
2.294
6.725
1.661
8.724
4.564
1.565,
1.686
1.783
1.670
1.912
,2.637
1.092
9.288
9.414
x
xxxx
107
i07101
107
101
1071 0 6106
1010107
106
101
106
108
107
108
106505
101
5.628
1.598
0.228
0.427
0.144
0.588
0.131
345.153
1.704
0.117
40.161
4.025
0.033
8.224
1.107
0.015
0.048
0.039
0.004
TOTAL 409.374
*T refers to traps, B to gas bubbler, BT to Break Tube residues.
20

Table 10
Tritium Trapping Results, Commercial T2 Sample, Tube j
Chemical Rinse SpecificForm of Water Volume Activity Total Activity
Sample No.* Tritium (mL) (dpm/mL) (mCi)
BTj T20 171.68 1.356 x 10⁸ 10.592
TIjo T20 41.11 1.423 x 10⁸ 2.662
TIjl T20 34.68 5.678 x 10⁷ 0.896
TIj2 T20 45.42 7.611 x 10⁷ 1.573
T2jo T20 51.32 3.041 x 10⁷ 0.710
T2j1 T20 32.19 1.835 x 10⁸ 2.688
T2j2 T20 40.69 1.692 x 10 0.313
T3jo T2 51.21 1.863 x 10¹¹ 4,340.892
T3j T12 38.99 5.260 x 10⁸ 9.331
T3j2 T2 42.47 1.949 x 10⁷ 0.377
T4jo T2 40.37 2.545 x 10' 46.747
T4jl T1 38.82 7.027 x 10⁸ 12.412
T4j2 T2 43.05 4.624 x 10⁶ 0.091
BIjo T2 103.03 1.783 x 10⁸ 8.358
BIj T,2 103.83 4.354 x 10⁷ 2.057
BIj2 T2 122.39 2.058 x 10⁶ 0.115
B2jo T2 88.36 5.996 x 10⁵ 0.024
B2jl T2 94.90 5.835 x 10⁵ 0.025
B2j2 T2 99.58 .1.059 x 105 0.005
TOTAL 4,439.868
*T refers to traps, B to gas bubbler, BT to Break Tube residues.
21

Table 11
Trapping Efficiency and Amount of T20
TestSample
Total Tritium (mCi)Theoretical Trapped
TrappingEfficiency
(%)Total
(mCi)
Tritiated WaterPercent
Theoretical Trapped
Sign B:
a(15.7 cm tube)
b(5.3 cm tube)
1,650.963 781.595 47.3 137.659
64.5 80.742
8.3
14.5
17.6
22.5557.331 359.228
Sign A:
c(4.2 cm tube) 186.932 146.103 78.2 8.356 4.5 5.7
Sign F:
g(7-.2 cm tube) 655.019 . 62.732 9;6 7.679 1.2- 12.2
Sign D:
i(4.7 cm tube) 462.380 409.374 88.5 8.744 1.9 2.1
Commercial T2 Sample:
j (no phosphor) 1,000.00 4,439.868 __a 19.434 .a 0.4
aMore than 100% trapping efficiency.water was not calculated.
Theoretical amount of tritiated
22
An important parameter for measuring total tritiated water is the determinationof how much tritium is bound to the phosphor or glass tube residues. Significantrevisions to the initial data were necessary when follow-up measurements of tritiumin the solutions covering the glass and phosphor residues were made. Secondmeasurements were made when it was found that all tritium theoretically present in thetubes was not accounted for. It was thought that tritium might be released more slowlyfrom the phosphor and glass. When increased levels of tritium were measured in asecond count of the residues for tubes 'a' and 'b,' it was decided to monitor all theresidues until the end of the study.
Table 12 shows the time-dependent releases of tritium from the residues into thewater covering them. For all the tubes, tritium release continued over the time thatthe materials were measured. The slow release of tritium appears to level off after30 days, in those cases where data are available. In all cases, the deficit inaccounting for the total amount of tritium theoretically present in the tubes is notmade up by tritium present in the residues. Assuming that the tubes contained thetheoretical amount of tritium, then some of the tritium passed through the trappingapparatus as T 2 without being converted to T 0. This was confirmed by placing aborrowed Triton tritium gas monitor and passing the exit gas from the apparatus throughthe monitor while tube 'c' was being tested. A quantitative estimate of the amount oftritium passing through the traps was not possible, however.
The data shown in Tables 5 through 11 for the break tube samples (sample no. BT_)reflect only the initial measurement of tritium associated with the residues, becauseof some uncertainties about the chemical form of the tritium. At first, it was assumedthat all tritium associated with the residues was tritiated water, and that subsequentreleases of tritium from the residues into the water covering them should be added tototal tritiated water. However, it is likely that some of the tritium is the gas (T2)adsorbed onto the glass and phophor surfaces and/or absorbed in the bulk materials.In this case, as the T2 is desorbed from the materials, it probably will exchange withthe water covering the materials. The important point is that the percentages oftritiated water listed in Table 11 will be higher if it is assumed that all the tritiumassociated with the residues is T20 or TOH. The increases in percent tritiated waterrange from less than one percent to about two percent if the highest values from Table12 are incorporated into Tables 5 through 11.
One significant result from the residue immersion tests is tube 'e,' which wasa tritium gas sample which had-been purchased from Amersham in 1978 and stored at BNLuntil it was used in this study in one of the mass spectrometer experiments. Thetritium was contained in a glass breakseal tube that had no other material inside.A label glued to the outside of the tube was left on the tube when it was tested,because attempts to remove the label threatened to break the tube. Tritium wasreleased from the glass residues and label, doubling over the first 21 days, as shownin Table 12. This was initially surprising, and suggests that a significant amountof tritium diffuses into the glass over 11-plus years.
.23

Table 12
Phosphor/Glass Residues Water Immersion Tests'
Tube Days mCi
0
15
57
78
0
32
53
0
21
0
21
0
21
0
14
0
7
10.278
25.792
28.053
30.589
14.230
17.268
17.661
1.306
2.054
9. 169
11. 160
7.580
14.807
18.494
23.624
5.766
7.602
'These represent repeated measurements ofthe BT_ samples listed in Tables 5 through 10.
24
The greatest and most rapid adsorption of T2 after the time of sign manufacturecan be expected on the surface of the phosphor, since this is a powder with a largesurface area. The phophor used is zinc sulfide, a hydrated material (ZnS.H 20). Whenthey are made, zinc sulfide phosphors are mixed with 2% sodium chloride and and 0.005%copper, manganese, or other activators and fired in a non-oxidising atmosphere.") Ifthe water of hydration remains with the phosphor after it is made,. or if the dehydratedphosphor becomes hydrated during handling before being put in the glass tubes, adsorbedT2 will probably undergo exchange with the water of hydration to some degree as timepasses. It should be noted that one supplier was contacted for information about thephosphor. According to the supplier, they provide two particle sizes: 20 and 40microns. The phosphor they supply is not hydrated, and has a small amount of zincoxide. Except for the zinc oxide, the material is 100 % zinc sulfide.
These considerations about the presence of water in the phosphor present thepossibility that the amounts of tritiated water in the glass tubes might be minimizedby changing quality control procedures during manufacture of the light sources. Thegeneration of tritiated water from tritium gas can only occur if oxygen is present toreact with T2 or if water is present to undergo exchange reactions. The strictexclusion of oxygen and the water of hydration from the glass tubes while they arebeing made would thus minimize the amounts of T20 and TOH that would appear over thelong term.
To illustrate the need to reduce, if not completely eliminate, water in the lightsources, one can calculate the minimum amount of water necessary to exchange with ICurie of tritium gas. The reaction to consider is
T2 + H 20 = TH + TOH.
The specific activity of 100% tritium gas is 9.64 x 10³ Ci/g. Using this and themolecular weights of T2 and H20 (6 and 18 g/mol, respectively) one can calculate that0.3 milligrams of water are needed to react with I Curie of T2 following the abovereaction.
3.3.3 Summary of Mass Spectrometer Experiments
As noted earlier, equipment problems were encountered with the residual gasanalyser (RGA) system. Three tritium light source tubes and an old tritium gas sample(Amersham,. 1978) were examined. After each experiment, adjustments were made to theinstrument to increase sensitivity and improve resolution. For the first two lightsources and the tritium gas sample, peaks at masses 6 and 3 confirmed the presence oftritium gas and helium-3 ions. Tube 'h,' the last examined with the RGA, exhibitedpeaks at masses 19, 20 and 22 in addition to those at 6 and 3. Masses 22, 20 and 19correspond to T20, TOH, and TO ions, respectively.
The mass spectrum scans for tube 'h' are shown in Figures 6a, b, and c. Figure 6ais for masses 0 to 10.. The peak at mass 4 represents residual helium-4 in the system.Peaks for tritiated water are evident in Figure 6b which covers masses 15 to 25. Alsopresent are peaks at 18 and 17, due to water, and one at 16, which corresponds todoubly ionized 02' An additional contribution to the peak at mass 20 is doubly ionizedargon. Argon is present because it was used to flush the system. Figure 6c coversthe mass range 33 to 43. This was looked at to examine the remote possibility thatT2 could react or exchange with the zinc sulfide phosphor to form tritiated. hydrogensulfide (T2S or THS). Ions from tritiated hydrogen sulfide would appear at masses 35,36, and 38; none was detected.
25

M Figure 6a. Mass spectrum scan, 0 to 10 amu. Figure 6b. Mass spectrum scan, 15 to 25 amu.
Mass Ion
3
6
19
20
22
35
36
38
Tr, T +, 3He
T2+
THOa, Are+
TS+
THS+'
T2W
Figure 6c. Mass spectrum scan, 33 to 43 amu.
3.3.4 Phosphor Particle Size Measurements
While discussing the preliminary findings of this investigation, the USNRCexpressed an interest in determining the particle size distribution of the zinc sulfidephosphor.
A sample of zinc sulfide powder was obtained from the USNRC. This was sprinkledonto a piece of filter paper which had already been wetted with a mixture of graphiteand isopropanol. The choice of this method for grounding the powder is due to the factthat insulating or non-conductive particles build up a space charge region byaccumulation of absorbed electrons which deflects the incident beam of a scanningelectron microscope (SEM). This deflection produces intense image distortions.
The filter paper (containing the grounded zinc sulfide powder) was loaded intoand then examined by electron microscopy. Figures 7a and 7b are typical scans showingthe size distribution of the powder. The largest particle observed was approximately36 microns and the smallest seen was I micron.
Energy dispersive spectroscopy (EDS) b was performed on the phosphor which verifiedthat zinc and sulfur were the primary constituents of the powder (Figure 7c).
3.3.5 Laboratory Surface and Personnel Contamination
During the experimental studies, the laboratory area and staff conducting the workwere monitored for contamination. The greatest amounts of contamination wereassociated with sample changes after experiments were completed, transferring glassand phosphor residues to containers for immersion in water. At least twice during theproject, the experimentor had about 100 dpm contamination on his head and neck;showering removed the contamination. Bioassays were taken within 24 hours of the twoworst contamination incidents and on a monthly basis otherwise. No tritium wasdetected in the bioassays.
After one sample change in which contamination was found on the experimentor, asurvey of laboratory surfaces was made as shown in Table 13. The worst contaminationwas on the ledge work area within 12 inches around the spot where the metal break tubeassembly was dismantled to transfer the glass and phosphor residues to a plasticbottle. An exact reading was not taken because the Health Physics technician did notwish to contaminate his counting equipment. The measurement was terminated when morethan 1,000 counts were reached in less than 5 seconds.
b EDS is an analytical technique, capable of performing elemental analysis of microvolumes, typically on the orderof a few cubic microns in bulk samples and considerably less in thinner sections. Analysis of X-rays emittedfrom a sample is accomplished by crystal spectrometers which use energy dispersive spectrometers and permitanalysis by discriminating among X-ray energies.
The feature of electron beam microanalysis that best describes this technique is its mass sensitivity. Forexample, it is often possible to detect less than 10"16 grams of an element present in a specific microvolumeof a sample. The minimum. detectable quantity of a given element or its detectability limit varies with manyfactors, and in most cases is less than 10-16 grams/microvolume.
For purposes of this report, EDS was considered to be a satisfactory method of chemical analysis. EDS will onlydiscern elements with atomic numbers greater than 11 (sodium) so certain light elements such as oxygen will notbe detected.
27

Figure 7a. Photomicrograph of zinc sulfideparticles (arrows point outlargest particle).
Figure 7b. SEM photograph of ZnS particles(arrows surround smallest particleseen).
Figure 7c. EDS scan of ZnS powder.

The contamination on the RGA system components may have occurred whendisconnecting the metal break tube assembly, even though all valves to the system wereclosed. The IQ 200 RF source and sensor were just under the break tube assembly.During sample changeout, these components were situated directly behind theexperimentor and about 3 feet from the ledge work area.
Immediately after the survey was taken, all surfaces were wiped several times witha damp towel. There was a gritty feel to the ledge work area, indicating that someof the phophor and smaller glass fragments had been spilled during the sample transfer.Two days later, some of the surfaces were tested again; the results are given in Table13.
29

Table 13
Laboratory Surface Contamination After Tritium Sample Change
Contamination (dpm)Surface Tested First Survey Second Survey*
Ledge Work Area >>10,000 7,500
Floor Under Ledge > 1,000
Wrenches > 1,000
IQ200 RF Source 1,500 100
IQ200 Sensor > 1,000 100
*Surfaces were wiped with a damp paper towels within anhour after the first measurements were made. meansno measurement was made.
30

4. CONCLUSIONS AND RECOMMENDATIONS
A preliminary study to determine the chemical form of tritium in self-luminouslight 'sources has been completed. The light sources tested were obtained fromcommercial building exit signs. The quantitative analysis experiments were designedto separate tritium gas from tritiated water for subsequent analysis by scintillationcounting. Qualitative analyses with a residual gas analyser confirmed the presenceof tritiated water in one self-luminous source.
All self-luminous tubes tested in the quantitative experiments contained tritiatedwater. For the two newest signs tested, about 2 % and 5 % of the total tritium presentwas tritiated water. In the older signs, the percentage of tritiated water wassignificantly higher, ranging above 10 % of the total tritium trapped.
In order to test the sources, it was necessary to break the glass tubes containingthe tritium and phosphor materials. After the experiments, the glass and phosphorresidues were collected and placed in water to collect and account for residual tritium(assumed to be tritiated water). Tritium concentrations in the water increased forevery sample over the time the samples were tested. For the samples immersed for morethan 30 days, the tritium releases were leveling off.
Because this was a scoping study, only four signs were tested. The resultsobtained suggest that more signs should be tested in order to ascertain whether thepresence of tritiated water is an inherent property of the design, or whether bettercontrols in the manufacturing process could minimize or possibly eliminate tritiatedwater. Differences in the amounts of tritiated water from two new signs suggest thatmanufacturing quality control could reduce the amounts of tritiated water in the lightsources. Since all the older Signs had higher levels of tritiated water, it wouldappear that, given enough time, tritiated water will appear in the signs. The resultsfrom the older signs thus indicate that the presence of more than 2 % tritiated wateris an inherent property of the design of the system.
Tests with more signs should be conducted to provide a statistical basis fordetermining how many signs have significant, (more than 2 %) amounts of tritiated water.A follow-up study of this type should include new and old signs from all themanufacturers now supplying the signs. In addition, other consumer goods, such aswatches with self-luminous dial lights should be examined for tritiated water in thelight sources.
To quantify the role of the phosphor in the appearance of tritiated water, studiesof tritium absortion by and reactivity with the phosphor material should be carriedout. Such a study could be conducted with hydrogen or deuterium to assess the chemicalreactivity of the phosphor.
31

5. REFERENCES
1. International Commission on Radiological Protection, "Limits for Intakes ofRadionuclides by Workers," ICRP Publication 30, Part 1, 1979
2. R. G. Niemeyer, "Tritium Loss from Tritium Self-Luminous Aircraft Exit Signs," OakRidge National Laboratory, ORNL-TM-2539, March, 1969
3. Y. Wang, ed., CRC Handbook of Radioactive Nuclides, The Chemical Rubber Co.,Cleveland, OH, 1969.
4. G. S. Brady and H. R. Clauser, Materials Handbook, 12th Edition, McGraw-Hill BookCo., New York, 1986
33

V
NRC FORM 335 U.S. NUCLEAR REGULATORY COMMISSION 1. REPORT NUMBER12-89) (Assigned by NRC. Add Vol., upp Rev..NRCM 1102, end Addendum Numbers, If eny.)3201 3202 BIBLIOGRAPHIC DATA SHEET
(See instructions on the reverse) NUREG/CR-55742. TITLE AND SUBTITLE BNL-NUIREG-52238
Determination of the Chemical Form of Tritium 3. DATE REPORTPUBLISHED
in Self-Luminous Signs MONTH YEAR
May 19904. FIN OR GRANT NUMBER
i FIN L10975. AUTHOR(S) 6. TYPE OF REPORT
B. S. Bowerman , C. J. Czajkowski Technical7. PERIOD COVERED (Incisive Dates)
8. PERFORMING ORGANIZATION - NAME AND ADDRESS lif NRC, provide Division, OfficeorRegion, U.S. Nuclear Regulatory Commission, and mailing address. it contractor, providename and mailing addres.)
Brookhaven National LaboratoryUpton, NY 11973
9. SPONSOR ING ORGANIZATION - NAME AND ADDRESS Ill NRC, type "Same as above";. if contractor. provide NRC Division, Office or Region. U.S Nuclear Regulatory Commission.
and mailing address)
Division of Industrial and Medical Nuclear SafetyOffice of Nuclear Material Safety and SafeguardsU.S. Nuclear Regulatory CommissionWashington, DC 20555
10. SUPPLEMENTARY NOTES
11. ABSTRACT (2oo words or less)
Building exit signs containing tritium self-luminous light sources were dis-mantled, and the light sources were tested to determine the chemical form of tritiumin this study. The objectivewas to quantify the amounts of tritiated water (T 0 orTOH) present in the light sources. The light sources consist of sealed glass thbescoated internally with a phosphor (zinc sulfide) and filled with tritium gas (T2 ).
Light source tubes from four exit signs were tested. Two were new signs, onewas six years old, and one was thirteen years old. In one of the new signs, thetotal tritium inventory included two percent tritiated water. Two signs had higheramounts of tritiated water: 4.5% for the other new sign, and 14.5% for the six-year-old sign. In the oldest sign, an accurate inventory of the tritium content was notavailable, but tritiated water accounted for 12.2% of the total tritium collectedfor counting.
q5 412. KEY WORDS/DESCRIPTORS (List words orphrases that will assist researchers in locating the report.) 13. AVAILABiLITY STATEMENT
Unl i mi tedTritium compounds; Tritium oxides; Isotopes; Inspection; 1JnlimITedZinc Sulfides; Luminescence; Phosphorescence; 14. SECURITY CLASSIFICATION
(This Page)
Unclassified(This Repoft
Unclassified15. NUMBER OF PAGES
16. PRICE
NRC FORM 335 12-891