numerical study of heat transfer and fluid flow in …une étude numérique du comportement...
TRANSCRIPT
Communication Science & technology vol 18. January 2017 COST
43
NUMERICAL STUDY OF HEAT TRANSFER AND FLUIDFLOW IN A CHANNEL WITH STAGGERED
ARC-SHAPED BAFFLES
Younes Menni*, Ahmed Azzi, Chafika ZidaniUnit of Research on Materials and Renewable Energies (URMER),Department of Physics, Faculty of Sciences, Abou Bekr Belkaid University,BP 119-13000-Tlemcen, Algeria*Corresponding author. E-mail: [email protected]çu le: 15/09/2015 Accepté le: 12/07/2016
AbstractA numerical study has been carried out to examine steady turbulent flowand heat transfer characteristics in a two-dimensional isothermal wallrectangular channel with staggered 30° arc-shaped baffles. The air flowrate is in terms of Reynolds numbers based on the inlet hydraulic diameterof the test channel ranging from 4,000 to 16,000. The CFD softwareFLUENT6.3 was used to simulate the flow and heat transfer. The simulationsfocused on the influence of Reynolds number and arc-baffle height on heattransfer and pressure drop measurements. The results reveal essentially,that the airflow is characterized by strong deformations and largerecirculation regions. In general, the rise in the Reynolds number results inthe increase in the Nusselt number and friction factor values. Also, for aconstant value of the Reynolds number, an increase in the arc-baffle heightcauses a substantial increase in the Nusselt number but the friction loss isalso very significant.Keywords: Arc-shaped baffle - CFD - heat transfer - rectangular channel.
RésuméUne étude numérique du comportement dynamique et thermique d’unécoulement d’air turbulent permanant traversant une conduitebidimensionnelle de section rectangulaire munie des chicanes transversalesarquées, est entreprise; en utilisant le logiciel de Calculs numériques enDynamique des Fluides CFD FLUENT 6.3. Le nombre de Reynolds est prisvariable 4,000-16,000. Les résultats obtenus montrent l'effet du transfert dechaleur turbulent pour différents nombres de Reynolds et différenteshauteurs de chicanes arquées. Les résultats montrent essentiellement quel'écoulement d’air est caractérisé par des fortes déformations et de grandesrégions de recirculation, et qu’en général, le nombre de Nusselt et lecoefficient de frottement augmentent avec le nombre de Reynolds. En outre,pour une valeur constante du nombre de Reynolds, une augmentation de lahauteur de la chicane arquée provoque une augmentation substantielle dunombre de Nusselt, mais la perte de charge est aussi très significative.Mots-clés: Chicane arquée - CFD - transfer de chaleur - Conduite rectangulaire.
Communication Science & technology vol 18. January 2017 COST
44
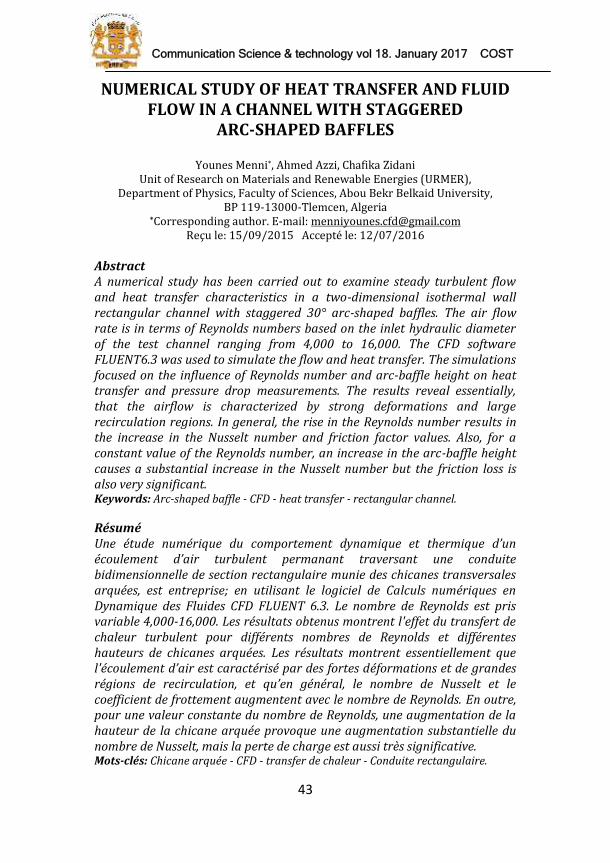
1. INTRODUCTIONThe topic is of paramount importance. Heat exchangers are used inseveral sectors and in very diverse fields. The improvement of theirperformance has been and is still of major concern to theorists andpractitioners. In general, in order to achieve high energyperformances, it is essential to install rows of baffles within theflow channel in the heat exchangers so as to create turbulence andalso to lengthen the trajectory of fluids by promoting a betterconvective heat exchange. Consequently, a remarkableimprovement in the thermal efficiency is obtained. Several studieshave been undertaken, in this context, in order to optimize theirsize [1,2], their position [3], their orientation [4] and their shape[5,6].This work consists of a numerical study of a turbulent air flow, inforced convection, in the presence of two solid-type arc-shapedbaffles of different heights, arranged in an overlapping manner, in ahorizontal two-dimensional pipe of rectangular section.2. PHYSICAL MODELThe system of interest is a horizontal rectangular channel with a30° arc-shaped baffle pair placed in a staggered array on the upperand lower channel walls as shown in figure 1. The geometryparameters are listed as described below (See Table 1). The flow istwo-dimensional, turbulent, incompressible, Newtonian, and insteady state with no internal heat generation, and neglectingviscous dissipation and radiation heat transfer.
C2
Upper wallin
Lout
Pi
h
H Xvelocity
Y
Lower wall
Tw
h/2
Arc-shaped bafflesFig. 1. Geometrical configuration

Communication Science & technology vol 18. January 2017 COST
45
The thermo-physical properties of the fluid (ρ, Cp, μ, and λf) havebeen assumed to remain constant at average bulk temperature. Thethermal conductivity of the channel wall material (λs) does notchange with temperature. The Prandtl number is taken equal to0.71. The standard k-ε turbulence model described by Launder andSpalding [7] is allowed to simulate the characteristics of fluid flowand heat transfer by using commercial CFD code of softwareFLUENT 6.3 [8]. To investigate a geometry effect of the interactionbetween both arc-baffles, the arc-baffle height, h is varied in arange of h=0.06m to 0.1m in the present investigation. Also, atypical baffle plate pair with thickness of w=0.01m is introduced forvalidation [5].Table 1. Different geometry parameters of the systemParameters ValueChannel length, L (m) 0.554Channel height, H (m) 0.146Channel width, W (m) 0.193 mHydraulic diameter (see Eq. 2) , Dh (m) 0.167Arc-baffle height, h (m) 0.080Arc-baffle thickness, w (m) 0.010Half attack angle of arc-baffle, θ (°) 30Center of the first arc, c1 (m) (0.297, 0.033)Center of the second arc, c2 (m) (0.449, -0.033)Arc-baffle distance or spacing, Pi (m) 0.142Distance upstream of the first arc, Linl (m) 0.218Distance downstream of the second arc, Lout (m) 0.174For a two-dimensional horizontal rectangular cross section channelwith staggered 30° arc-shaped baffles (See Fig. 1), a uniform fluidvelocity (Uin) was introduced at the inlet while an atmosphericpressure boundary condition was applied at the exit, because fluidis incompressible, as presented by Demartini et al. [5]. Air is set asworking fluid. The physical properties of the air have beenassumed to remain constant at average bulk temperature. Besides,impermeable boundary and no-slip wall conditions have beenimplemented over the channel walls as well as the arc-bafflesurfaces. The temperatures of channel walls (Tw) and inlet fluid(Tin) are set as constant, which are respectively 375 and 300K, asreported by Nasiruddin and Kamran Siddiqui [4].
Communication Science & technology vol 18. January 2017 COST
46
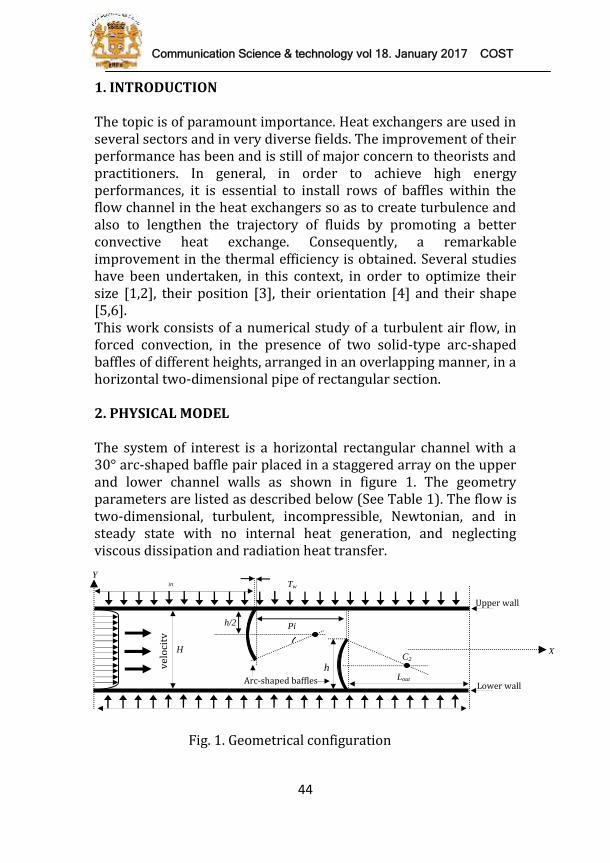
3. NUMERICAL APPROACHBased on the above assumptions, the channel flow model isgoverned by the Reynolds averaged Navier-Stokes (RANS)equations with the k-ε turbulence model and the energy equation.All the equations are discretized by the QUICK scheme (Leonardand Mokhtari [9]) and SIMPLEC pressure-velocity couplingalgorithm (Van Doormaal and Raithby [10]) is implemented. Thedetail on mathematical modeling can be found in similar work byDemartini et al. [5]. The solutions were considered to be convergedwhen the normalized residual values were less than 10-6 for allvariables ϕ≡(u, v, K, ε) but less than 10-9 only for the energyequation ϕ≡(T).The mesh was generated by the pre-processor software Gambit 2.3.Structured meshes, with quadrilateral elements were built andtested with the CFD FLUENT 6.3 [8]. The mesh was refined at allsolid boundaries to resolve the strong velocity and temperaturegradients in that region [5]. For the regions more distant from thewalls, the mesh is uniform [5], as shown in figure 2.
Fig. 2. Grid system in the arc-baffled channel with refinements nearthe solid boundary to resolve velocity and pressure gradientsGrid independence tests are carried out to ensure that the gridindependent solution can be obtained. The results of the gridsindependent test are shown in Table 2.Table 2. Influence of the grid numbers on the computed resultGrid number Nu P50×10 to 120×30 18% 14.7%120×30 to 190×60 11% 9.5%190×60 to 260×90 3.6% 5.8%260×90 to 330×120 1.1% 2.7%
Communication Science & technology vol 18. January 2017 COST
46
3. NUMERICAL APPROACHBased on the above assumptions, the channel flow model isgoverned by the Reynolds averaged Navier-Stokes (RANS)equations with the k-ε turbulence model and the energy equation.All the equations are discretized by the QUICK scheme (Leonardand Mokhtari [9]) and SIMPLEC pressure-velocity couplingalgorithm (Van Doormaal and Raithby [10]) is implemented. Thedetail on mathematical modeling can be found in similar work byDemartini et al. [5]. The solutions were considered to be convergedwhen the normalized residual values were less than 10-6 for allvariables ϕ≡(u, v, K, ε) but less than 10-9 only for the energyequation ϕ≡(T).The mesh was generated by the pre-processor software Gambit 2.3.Structured meshes, with quadrilateral elements were built andtested with the CFD FLUENT 6.3 [8]. The mesh was refined at allsolid boundaries to resolve the strong velocity and temperaturegradients in that region [5]. For the regions more distant from thewalls, the mesh is uniform [5], as shown in figure 2.
Fig. 2. Grid system in the arc-baffled channel with refinements nearthe solid boundary to resolve velocity and pressure gradientsGrid independence tests are carried out to ensure that the gridindependent solution can be obtained. The results of the gridsindependent test are shown in Table 2.Table 2. Influence of the grid numbers on the computed resultGrid number Nu P50×10 to 120×30 18% 14.7%120×30 to 190×60 11% 9.5%190×60 to 260×90 3.6% 5.8%260×90 to 330×120 1.1% 2.7%

Communication Science & technology vol 18. January 2017 COST
47
From the test values of the Nusselt numbers and the pressure dropobtained by the five grid systems (Nx×Ny), the (260×90) gridsystem is found to be dense enough to result in grid-independentsolutions.4. RESULTS AND DISCUSSION4.1. CFD ValidationFigure 3 shows a comparison of axial velocity profiles after thesecond baffle, near the channel outlet at the reference axial station(x=0.525, -H/2 ≤ y ≤ H/2) obtained from the present simulation forRe=8.73×10⁴ with those from the experiments of Demartini et al.[5]. A quite good agreement is observed between the two studies.
Figure 3. Comparison of the experimental and numerical results4.2. Effect of Reynolds number (Re)The flow configuration in tested channel with arc-baffles on theopposite positions can be shown by considering the contours ofvelocity fields and streamlines as presented in figure 4a, b, c and dfor the cases of Re=4,000, 8,000, 12,000 and 16,000, respectively.Hence, the velocity and streamline fields of the arc-baffle moduleare present at θ=30° and Pi=0.146m. For all Reynolds numbersused in this section (4.2), the distance between the upper edge ofthe arc-baffle and the wall was kept constant at h=0.08m. Thiscorresponds to the area reduction of 54.79% at the baffle edge. Inthe figure, the result analyses show very low velocity valuesadjacent to the arc-baffles. In the regions downstream of both arc-baffles, recirculation cells with very low velocity values areobserved. In the regions between the tip of the arc-baffles and the
Cha
nnel
hei
ght
(m)
Our CFD
Numerical [5]
Experimental [5]
x=0.525m,Re=8.73×10⁴
-0,08-10 0 10 20 30 40
-0,06
-0,04
-0,02
0,00
0,02
0,04
0,06
0,08
Axial velocity (m/s)
Communication Science & technology vol 18. January 2017 COST
48
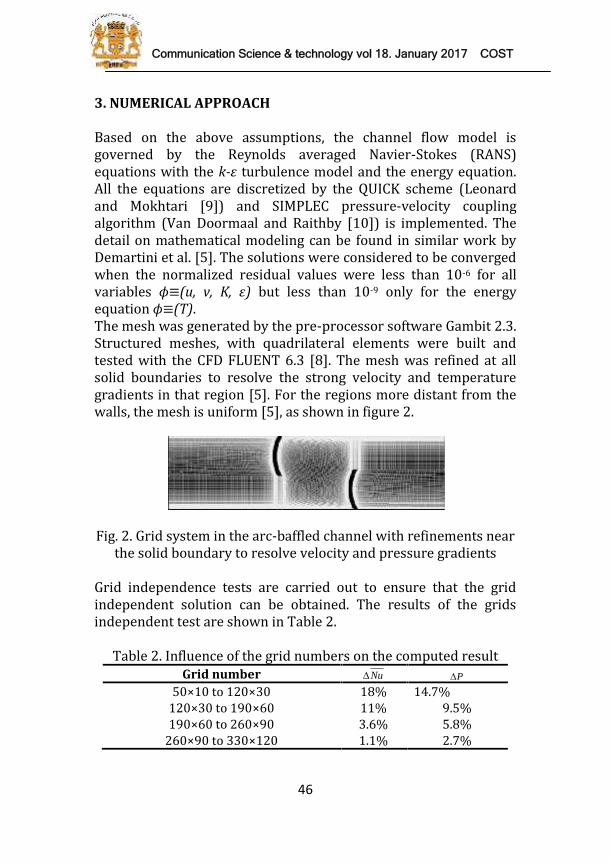
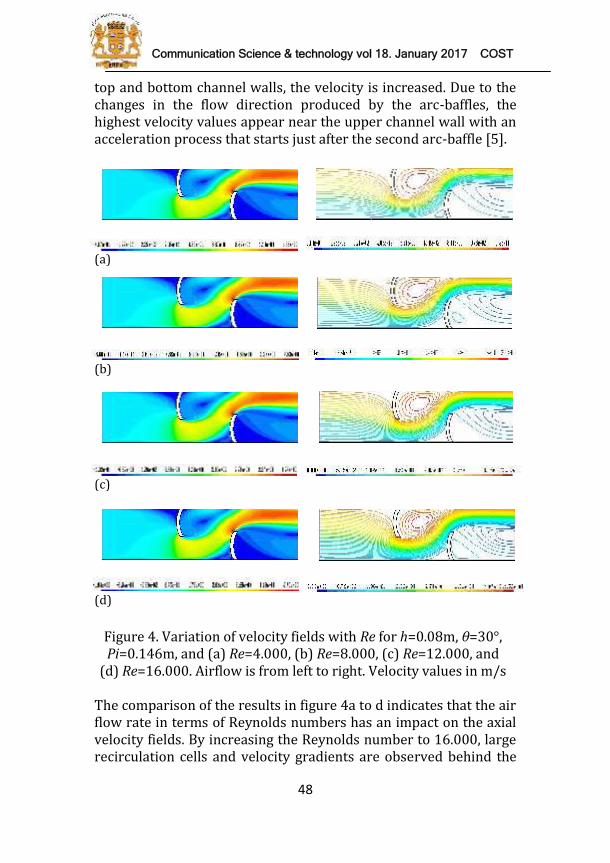
top and bottom channel walls, the velocity is increased. Due to thechanges in the flow direction produced by the arc-baffles, thehighest velocity values appear near the upper channel wall with anacceleration process that starts just after the second arc-baffle [5].
(a)
(b)
(c)
(d)Figure 4. Variation of velocity fields with Re for h=0.08m, θ=30°,Pi=0.146m, and (a) Re=4.000, (b) Re=8.000, (c) Re=12.000, and(d) Re=16.000. Airflow is from left to right. Velocity values in m/sThe comparison of the results in figure 4a to d indicates that the airflow rate in terms of Reynolds numbers has an impact on the axialvelocity fields. By increasing the Reynolds number to 16.000, largerecirculation cells and velocity gradients are observed behind the
Communication Science & technology vol 18. January 2017 COST
48
top and bottom channel walls, the velocity is increased. Due to thechanges in the flow direction produced by the arc-baffles, thehighest velocity values appear near the upper channel wall with anacceleration process that starts just after the second arc-baffle [5].
(a)
(b)
(c)
(d)Figure 4. Variation of velocity fields with Re for h=0.08m, θ=30°,Pi=0.146m, and (a) Re=4.000, (b) Re=8.000, (c) Re=12.000, and(d) Re=16.000. Airflow is from left to right. Velocity values in m/sThe comparison of the results in figure 4a to d indicates that the airflow rate in terms of Reynolds numbers has an impact on the axialvelocity fields. By increasing the Reynolds number to 16.000, largerecirculation cells and velocity gradients are observed behind the
Communication Science & technology vol 18. January 2017 COST
49
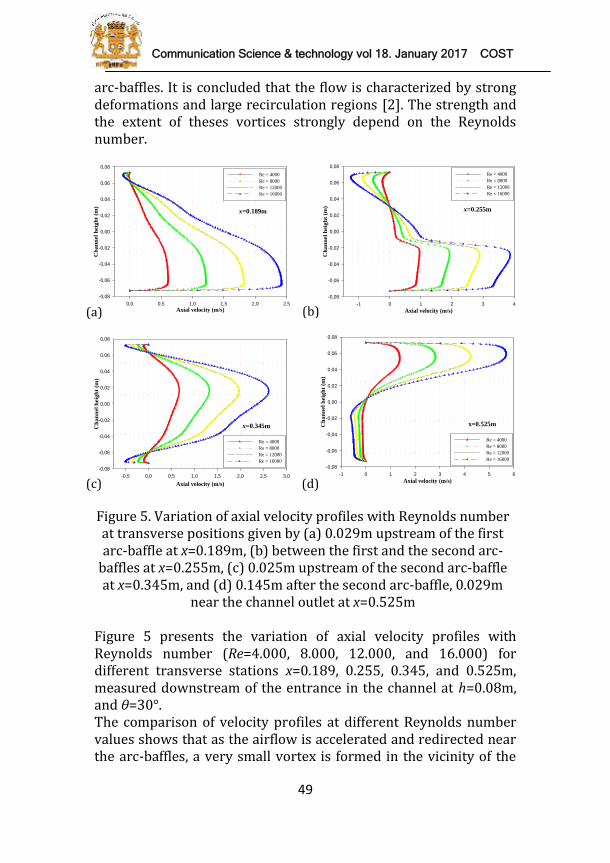
arc-baffles. It is concluded that the flow is characterized by strongdeformations and large recirculation regions [2]. The strength andthe extent of theses vortices strongly depend on the Reynoldsnumber.
Figure 5. Variation of axial velocity profiles with Reynolds numberat transverse positions given by (a) 0.029m upstream of the firstarc-baffle at x=0.189m, (b) between the first and the second arc-baffles at x=0.255m, (c) 0.025m upstream of the second arc-baffleat x=0.345m, and (d) 0.145m after the second arc-baffle, 0.029mnear the channel outlet at x=0.525mFigure 5 presents the variation of axial velocity profiles withReynolds number (Re=4.000, 8.000, 12.000, and 16.000) fordifferent transverse stations x=0.189, 0.255, 0.345, and 0.525m,measured downstream of the entrance in the channel at h=0.08m,and θ=30°.The comparison of velocity profiles at different Reynolds numbervalues shows that as the airflow is accelerated and redirected nearthe arc-baffles, a very small vortex is formed in the vicinity of the
Axial velocity (m/s)0,0 0,5 1,0 1,5 2,0 2,5
Ch
ann
el h
eigh
t (m
)
-0,08
-0,06
-0,04
-0,02
0,00
0,02
0,04
0,06
0,08Re = 4000Re = 8000Re = 12000Re = 16000
x=0.189m
Axial velocity (m/s)-1 0 1 2 3 4
Ch
ann
el h
eigh
t (m
)
-0,08
-0,06
-0,04
-0,02
0,00
0,02
0,04
0,06
0,08Re = 4000Re = 8000Re = 12000Re = 16000
x=0.255m
Axial velocity (m/s)-0,5 0,0 0,5 1,0 1,5 2,0 2,5 3,0
Ch
ann
el h
eigh
t (m
)
-0,08
-0,06
-0,04
-0,02
0,00
0,02
0,04
0,06
0,08
Re = 4000Re = 8000Re = 12000Re = 16000
x=0.345m
Axial velocity (m/s)-1 0 1 2 3 4 5 6
Ch
ann
el h
eigh
t (m
)
-0,08
-0,06
-0,04
-0,02
0,00
0,02
0,04
0,06
0,08
Re = 4000Re = 8000Re = 12000Re = 16000
x=0.525m
(a) (b)
(c) (d)

Communication Science & technology vol 18. January 2017 COST
50
upper left corner, as shown in figure 5a (at location x=0.189m,0.029m before the first arc-baffle). Downstream, as a result ofsudden expansion in the cross-section, the flow separates, a largerclockwise vortex is formed behind the upper arc-baffle and flowreattachment is then established, as presented in figure 5b (atlocation x=0.255m, 0.027m after the first arc-baffle). A similarphenomenon is observed near the arc-baffle mounted on the lowerwall with counterclockwise vortices at the upstream anddownstream arc-baffle, as illustrated in figure 5c and d,respectively. These observations are indicated and confirmed byMohammadi Pirouz [3].A comparison of numerical results of velocity profiles after thesecond arc-baffle, near the channel outlet is also presented in figure5d. At a position x=0.525m, 0.029m before channel outlet, the valueof the velocity reaches 1.4m/s, 4.00 times higher than the entrancevelocity (in the case of Re=4.000). These values are only possibledue to the very strong flow recirculation on the back side of thesecond arc-baffle, which leads air from outside of the channel intothe computational domain, as indicated by Demartini et al. [5]. Inaddition, it is visible that for a constant value of the arc-baffleheight (h=0.08m), increasing the flow Reynolds number increasedthe fluid velocity. Finally, it is interesting to note that the axialvelocity value tends to increase with the rise of Reynolds numbervalues for all locations
Figure 6. Nux distribution alongthe top wall at different Renumbers Figure 7. Nu variation on theupper and lower walls with RenumberThe axial variation of Nux for the upper channel wall with variousReynolds number values at h=0.08m and θ=30° is presented in
Axial position (m)0,0 0,1 0,2 0,3 0,4 0,5 0,6
Loc
al N
usse
lt n
umbe
r [-
]
0
1000
2000
3000
4000
Re = 4000Re = 8000Re = 12000Re = 16000
Top channel wall
Reynolds number [-]4000 6000 8000 10000 12000 14000 16000
Ave
rage
Nus
selt
num
ber
[-]
0
200
400
600
800
1000Lower wallUpper wall

Communication Science & technology vol 18. January 2017 COST
51
figure 6. These profiles present in all cases a minimum and amaximum of the heat transfer rate. It is worth noting that upstreamof the upper wall arc-baffle, the Nux value shows a slow decreasewhen approaching the arc-baffle. Downstream, the Nux increasegradually until reaching the lower wall arc-baffle area where themaximum Nux value occurs and then shows an abrupt reductionthrough the exit, in accordance with the results by Sripattanapipatand Promvonge [6].Concerning the effect of the Reynolds number on the heat transfercharacteristics, it is clear from this figure that values of localNusselt number become higher with increasing values in flowReynolds number, because when the Re increases, the turbulenceincreases and the recirculation region become stronger andconsequently the heat dissipation increases.If we think in terms of exchange medium as shown in figure 7, it isinteresting to note that the average convective Nusselt numbervalue tends to increase with the rise of Reynolds number values forthe two top(y=+H/2) and bottom (y=-H/2) channel walls. There is alinear increment between Nu and Re in flow. It may be generated bythe augmentation of the flow acceleration causing by increasing thevelocity of the flow.
Figure 8. Skin frictioncoefficient along the upper wallat different Re numbers Figure 9. Friction factorvariation on the upper andlower walls with Re numberFigure 8 shows the skin friction coefficient, Cf along the upperchannel wall for different Reynolds number values (Re=4.000,8.000, 12.000 and 16.000) in the case of the configuration used. Inthe figure, it is evident that the presence of arc-baffles involves the
Axial position (m)0,0 0,1 0,2 0,3 0,4 0,5 0,6
Skin
fri
ctio
n co
effi
cien
t [-
]
0,0
0,1
0,2
0,3
0,4
0,5Re = 4000Re = 8000Re = 12000Re = 16000
Top channel wall
Reynolds number [-]4000 6000 8000 10000 12000 14000 16000
Fri
ctio
n fa
ctor
[-]
0,00
0,02
0,04
0,06
0,08
0,10Lower wallUpper wall

Communication Science & technology vol 18. January 2017 COST
52
increased value of surface friction on the channel walls, asconfirmed by Eiamsa-ard and Promvonge [1]. The peak skinfriction coefficient, Cf can be observed as the airflow approachesthe second arc-baffle, increasing the velocity of the flowapproaching the passage above the baffle (see Figs. 5c and 7) whilethe lowest of the skin friction coefficient is found upstream of thefirst arc-baffle for all Reynolds number values because the absenceof the arc-baffles (see Figs. 5a and 7). However, the skin frictioncoefficients are increased again at the locations corresponding tothe zones of counter rotating flow as seen in figures 5b and d, and8. This remark is also confirmed by Eiamsa-ard and Promvonge [1].It indicates that the highest skin friction coefficient, Cf can beobserved at the area of high turbulent intensity especially at thechannel exit between the tip of the lower wall arc-baffle and the topchannel wall with an acceleration process that starts just after thesecond arc-baffle [5] (see Figs. 5d and 7). Also, it is interesting tonote that the skin friction coefficient tends to increase with the riseof Reynolds number for all locations. In the figure, the increase ofskin friction coefficients is found to be larger than that of the heattransfer coefficients caused by the temperature field [6]. This mayimply that the flow field develops more rapidly than thetemperature field [6]. The trends of Cf are similar for all Re values.Figure 9 shows the predicted results of friction factor, f for thebottom and top duct walls in the range of Reynolds numberinvestigated (Re=4.000, 8.000, 12.000 and 16.000) for fixed valuesof other parameters (h=0.08m, θ=30° and Pi=0.146m). It is seenthat the friction factor increases with the increase of Reynoldsnumber (Re) and thus, the Re=16.000 provides maximum frictionfactor.4.2. Effect of arc-baffle height (h)The impact of the arc-baffle height on the heat transfer and flowcharacteristics was investigated for five different arc heights (h),which were 0.06, 0.07, 0.08, 0.09, and 0.1m. This corresponds to theflow area reduction of 41.09, 47.94, 54.79, 61.64, and 68.49%, at thearc-baffle. The distance between the arc-baffles or spacing (Pi) waskept constant at 0.142m.The numerical results on the structure of the near wall flow in aconstant temperature-surfaced rectangular cross section channel
Communication Science & technology vol 18. January 2017 COST
53
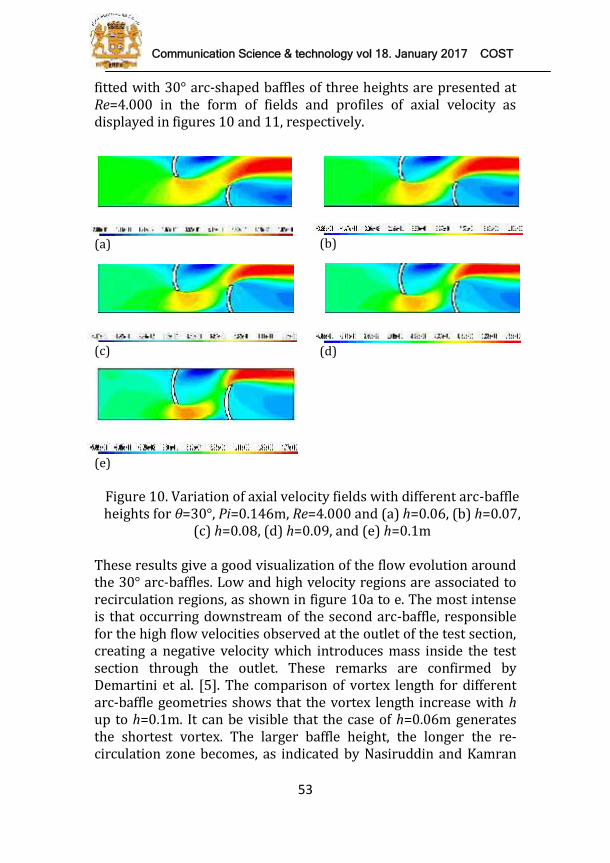
fitted with 30° arc-shaped baffles of three heights are presented atRe=4.000 in the form of fields and profiles of axial velocity asdisplayed in figures 10 and 11, respectively.
(a) (b)
(c) (d)
(e)Figure 10. Variation of axial velocity fields with different arc-baffleheights for θ=30°, Pi=0.146m, Re=4.000 and (a) h=0.06, (b) h=0.07,(c) h=0.08, (d) h=0.09, and (e) h=0.1mThese results give a good visualization of the flow evolution aroundthe 30° arc-baffles. Low and high velocity regions are associated torecirculation regions, as shown in figure 10a to e. The most intenseis that occurring downstream of the second arc-baffle, responsiblefor the high flow velocities observed at the outlet of the test section,creating a negative velocity which introduces mass inside the testsection through the outlet. These remarks are confirmed byDemartini et al. [5]. The comparison of vortex length for differentarc-baffle geometries shows that the vortex length increase with hup to h=0.1m. It can be visible that the case of h=0.06m generatesthe shortest vortex. The larger baffle height, the longer the re-circulation zone becomes, as indicated by Nasiruddin and Kamran
Communication Science & technology vol 18. January 2017 COST
53
fitted with 30° arc-shaped baffles of three heights are presented atRe=4.000 in the form of fields and profiles of axial velocity asdisplayed in figures 10 and 11, respectively.
(a) (b)
(c) (d)
(e)Figure 10. Variation of axial velocity fields with different arc-baffleheights for θ=30°, Pi=0.146m, Re=4.000 and (a) h=0.06, (b) h=0.07,(c) h=0.08, (d) h=0.09, and (e) h=0.1mThese results give a good visualization of the flow evolution aroundthe 30° arc-baffles. Low and high velocity regions are associated torecirculation regions, as shown in figure 10a to e. The most intenseis that occurring downstream of the second arc-baffle, responsiblefor the high flow velocities observed at the outlet of the test section,creating a negative velocity which introduces mass inside the testsection through the outlet. These remarks are confirmed byDemartini et al. [5]. The comparison of vortex length for differentarc-baffle geometries shows that the vortex length increase with hup to h=0.1m. It can be visible that the case of h=0.06m generatesthe shortest vortex. The larger baffle height, the longer the re-circulation zone becomes, as indicated by Nasiruddin and Kamran
Communication Science & technology vol 18. January 2017 COST
54
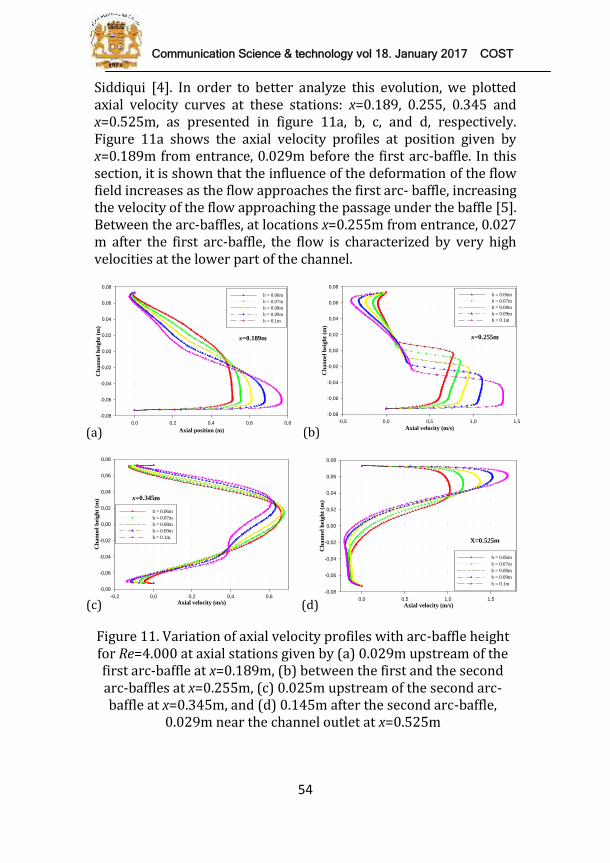
Siddiqui [4]. In order to better analyze this evolution, we plottedaxial velocity curves at these stations: x=0.189, 0.255, 0.345 andx=0.525m, as presented in figure 11a, b, c, and d, respectively.Figure 11a shows the axial velocity profiles at position given byx=0.189m from entrance, 0.029m before the first arc-baffle. In thissection, it is shown that the influence of the deformation of the flowfield increases as the flow approaches the first arc- baffle, increasingthe velocity of the flow approaching the passage under the baffle [5].Between the arc-baffles, at locations x=0.255m from entrance, 0.027m after the first arc-baffle, the flow is characterized by very highvelocities at the lower part of the channel.
Figure 11. Variation of axial velocity profiles with arc-baffle heightfor Re=4.000 at axial stations given by (a) 0.029m upstream of thefirst arc-baffle at x=0.189m, (b) between the first and the secondarc-baffles at x=0.255m, (c) 0.025m upstream of the second arc-baffle at x=0.345m, and (d) 0.145m after the second arc-baffle,0.029m near the channel outlet at x=0.525m
Axial velocity (m/s)-0,5 0,0 0,5 1,0 1,5
Cha
nnel
hei
ght
(m)
-0,08
-0,06
-0,04
-0,02
0,00
0,02
0,04
0,06
0,08h = 0.06mh = 0.07mh = 0.08mh = 0.09mh = 0.1m
x=0.255m
(b)
Axial velocity (m/s)-0,2 0,0 0,2 0,4 0,6
Ch
ann
el h
eigh
t (m
)
-0,08
-0,06
-0,04
-0,02
0,00
0,02
0,04
0,06
0,08
h = 0.06mh = 0.07mh = 0.08mh = 0.09mh = 0.1m
x=0.345m
(c) Axial velocity (m/s)0,0 0,5 1,0 1,5
Ch
ann
el h
eigh
t (m
)
-0,08
-0,06
-0,04
-0,02
0,00
0,02
0,04
0,06
0,08
h = 0.06mh = 0.07mh = 0.08mh = 0.09mh = 0.1m
X=0.525m
(d)
Axial position (m)0,0 0,2 0,4 0,6 0,8
Ch
ann
el h
eigh
t (m
)
-0,08
-0,06
-0,04
-0,02
0,00
0,02
0,04
0,06
0,08h = 0.06mh = 0.07mh = 0.08mh = 0.09mh = 0.1m
x=0.189m
(a)
Communication Science & technology vol 18. January 2017 COST
55
The increases in axial velocity values for using h=0.06, 0.07, 0.08,0.09, and 0.1m, respectively, reach 2.14, 2.42, 2.71, 3.14, and 3.85times higher than the entrance velocity, which is Uin=0.35m/s, asshown in figure 11b. The numerical results of axial velocitydistributions at a position x=0.345m, 0.025 m before the secondarc-baffle, are shown in figure 11c. The plots show that as the flowapproaches the lower wall arc-baffle, its velocity is reduced in thelower part of the channel while in the upper part is increased [5].The plots also indicate that the largest variations in the axialvelocity are found near the tip of the second arc-baffle in the upperpart of the channel, due to the strong velocity gradients in thatregion, as illustrated in figure 11d and confirmed by Demartini etal. [5]. In addition, the comparison of results along the channel forthe same Reynolds number (Re=4.000) plotted in figure 11 for thesame range of arc-baffle height (h) indicate that the latter has asignificant impact on the magnitude of the fluid velocity. The plotshows as expected, that the velocity increased with the baffleheight. In comparison with the similar height range, it is clear thatthe h=0.1m provides a maximum axial velocity value while theh=0.06m gives a minimum for almost locations.
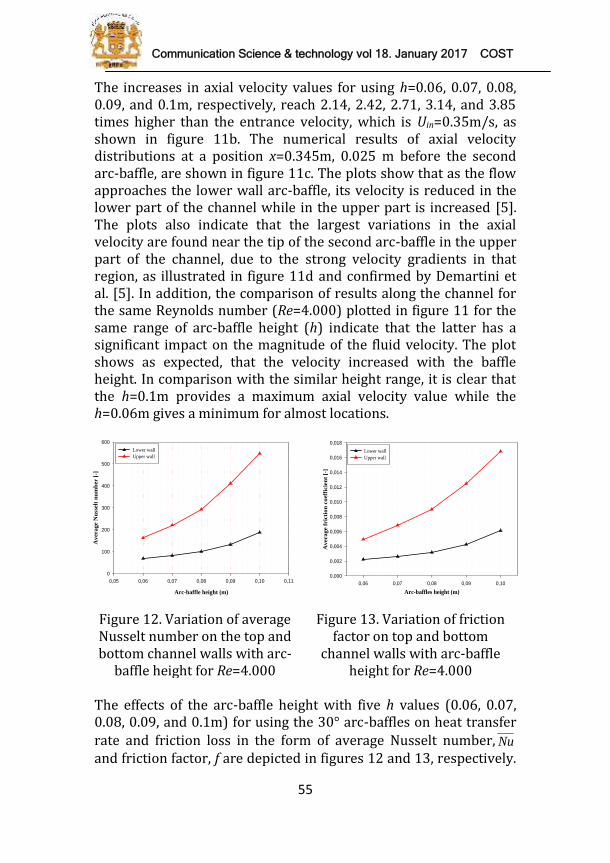
Figure 12. Variation of averageNusselt number on the top andbottom channel walls with arc-baffle height for Re=4.000Figure 13. Variation of frictionfactor on top and bottomchannel walls with arc-baffleheight for Re=4.000The effects of the arc-baffle height with five h values (0.06, 0.07,0.08, 0.09, and 0.1m) for using the 30° arc-baffles on heat transferrate and friction loss in the form of average Nusselt number, Nuand friction factor, f are depicted in figures 12 and 13, respectively.
Arc-baffle height (m)
0,05 0,06 0,07 0,08 0,09 0,10 0,11
Ave
rage
Nu
ssel
t n
um
ber
[-]
0
100
200
300
400
500
600Lower wallUpper wall
Arc-baffles height (m)0,06 0,07 0,08 0,09 0,10
Ave
rage
fri
ctio
n c
oeff
icie
nt
[-]
0,000
0,002
0,004
0,006
0,008
0,010
0,012
0,014
0,016
0,018Lower wallUpper wall

Communication Science & technology vol 18. January 2017 COST
56
The Nusselt numbers and the pressure loss obtained underturbulent flow conditions for all cases are presented for a Reynoldsnumber equal to Re=4.000. This value was selected due to thereason that the pressure loss was the lowest, as shown in figures 8and 9. In figure 12, it is found that for a constant value of theReynolds number, increasing the arc-baffle height (h) increased theaverage Nusselt number. The maximum Nusselt number isobtained for h=0.1m while the lowest one is for h=0.06m.The effect of the arc-baffles on the isothermal pressure drop acrossthe tested channel is depicted in figure 13 which displays thevariation of the pressure drop in terms of f in the range of hinvestigated for fixed values of other parameters (θ=30°,Pi=0.142m, and Re=4.000). As expected, the friction factorincreases with the increase of arc-baffle (h) and thus, the h=0.1mprovides maximum friction factor.5. CONCLUSIONA numerical analysis has been conducted to examine the turbulentfluid flow and heat transfer characteristics for rectangular channelprovided with solid arc-shaped baffles which are arranged on thebottom and top channel isothermal walls in a periodicallystaggered way.The governing equations that describe the flow and energy wereintegrated by the Finite Volume Method, in two dimensions,employing the Commercial CFD software FLUENT6.3 with the K-εmodel to describe the turbulence.The numerical runs were carried out for different values ofReynolds numbers and baffle heights at constant wall temperaturecondition along the top and bottom walls.The flow structure is affected by the presence of these baffles. Thisflow structure has profound influences on the heat transfercharacteristics. As Re increases, both heat transfer rate, in terms ofNusselt number, and friction loss, in terms of friction factor,increase.Results also demonstrated that for a constant value of the Reynoldsnumber, an increase in the arc-baffle height causes a substantialincrease in the Nusselt number but the pressure loss is also verysignificant.
Communication Science & technology vol 18. January 2017 COST
57
REFERENCES[1] S. Eiamsa-ard, P. Promvonge, Numerical study on heat transfer ofturbulent channel flow over periodic grooves, Int. Commun. Heat MassTransfer 35 (2008) 844-852.[2] K.M Kelkar, S.V. Patankar, Numerical prediction of flow and heattransfer in a parallel plate channel with staggered fins, J. Heat Transfer109 (1987) 25-30.[3] M. Mohammadi Pirouz, M. Farhadi, K. Sedighi, H. Nemati, E. Fattahi,Lattice Boltzmann simulation of conjugate heat transfer in arectangular channel with wall-mounted obstacles, Scientia Iranica B18 (2) (2011) 213-221.[4] Nasiruddin, M.H. Kamran Siddiqui, Heat transfer augmentation in aheat exchanger tube using a baffle, Int. J. Heat and Fluid Flow 28(2006) 318-328.[5] L.C. Demartini, H.A. Vielmo, S.V. Möller, Numeric and experimentalanalysis of the turbulent flow through a channel with baffle plates J.the Braz. Soc. of Mech. Sci. & Eng. 26(2) (2004) 153-159.[6] S. Sripattanapipat, P. Promvonge, Numerical analysis of laminarheat transfer in a channel with diamond-shaped baffles, Int. Commun.Heat Mass Transfer 36 (2009) 32-38[7] B.E. Launder, D.B. Spalding, The numerical computation ofturbulent flows, Computer Methods Appl. Mech. Eng. 3 (1974) 269-289.[8] Fluent Inc., User´s guide 6.3, 2006.[9] B.P. Leonard, S. Mokhtari, Ultra-sharp nonoscillatory convectionschemes for high-speed steady multidimensional flow, NASA TM 1-2568, NASA Lewis Research Center, 1990.[10] J.P. Van Doormaal, G.D Raithby, Enhancements of the SIMPLEmethod for predicting incompressible fluid flows, Numerical HeatTransfer 7 (1985) 147-163.