numerical simulation of the propagation of ship-induced ... · key words: vessel wakes, nonlinear...
TRANSCRIPT
Proceedings of the Estonian Academy of Sciences, 2015, 64, 1, 22–35
22
Proceedings of the Estonian Academy of Sciences, 2015, 64, 1, 22–35
doi: 10.3176/proc.2015.1.04 Available online at www.eap.ee/proceedings
Numerical simulation of the propagation of ship-induced Riemann waves of depression into the Venice Lagoon
Artem Rodina, Tarmo Soomerea,b*, Kevin E. Parnella,c, and Luca Zaggiad
a Institute of Cybernetics at Tallinn University of Technology, Akadeemia tee 21, 12618 Tallinn, Estonia b Estonian Academy of Sciences, Kohtu 6, 10130 Tallinn, Estonia c College of Marine and Environmental Sciences and Centre for Tropical Environmental and Sustainability Sciences, James Cook
University, Queensland 4811, Australia d Institute of Marine Sciences, National Research Council, Castello 2737/F, 30122 Venice, Italy Received 24 January 2015, revised 16 February 2015, accepted 17 February 2015, available online 4 March 2015 Abstract. Large in situ measured ship-induced depression waves (Bernoulli wakes) in the Malamocco–Marghera industrial channel of the Venice Lagoon are interpreted as long-living strongly nonlinear Riemann (simple) waves of depression. The properties of these depressions are numerically replicated using nonlinear shallow water theory and the CLAWPACK software. The further behaviour of measured depressions is analysed by means of replicating the vessel-induced disturbances with the propagation of initially smooth free waves. It is demonstrated that vessel-driven depressions of substantial height (> 0.3 m) often propagate for more than 1 km from the navigation channel into areas of the lagoon of approximately 2 m water depth. As a depression wave propagates into the lagoon, its front slope becomes gradually less steep, but the rear slope preserves an extremely steep bore-like appearance and the amplitude becomes almost independent of the initial properties of the disturbance. Analysis suggests that even modest ships in terms of their size, sailing speed, and blocking coefficient may generate deep depressions that travel as compact and steep entities resembling asymmetric solitary waves over substantial distances into shallow water adjacent to navigation channels. Their impact may substantially increase the environmental impact of ship wakes in this and similar water bodies. Key words: vessel wakes, nonlinear waves, shallow-water waves, Riemann wave, bore formation, Venice Lagoon. 1. INTRODUCTION * The classical theory of linear (Kelvin) ship waves (e.g., Wehausen, 1973; Newman, 1977; Lighthill, 1978; Kuz-netsov et al., 2002) adequately describes the geometry of wave crests and several features of the distribution of wave heights for ships that sail steadily over a sea area of constant depth under low (depth- and length-based) Froude numbers. An increase in either of the Froude numbers leads to a wide range of nontrivial and often nonlinear phenomena. Sailing at moderate and near-critical depth Froude numbers (0.6 ≤ Fd < 1) leads to the widening of the Kelvin wedge (the area filled with
* Corresponding author, [email protected]
waves that are stationary with respect to the ship) (Sorensen, 1973). This process is associated with the generation of long and long-crested leading waves. The resulting almost non-dispersive transient wave groups usually consist of a few crests that may result in substantial environmental impacts not only in the immediate vicinity of the sailing line (Parnell and Kofoed-Hansen, 2001) but also at a distance of many kilometres (Soomere, 2005; Parnell et al., 2007). These waves are often preceded by precursor solitons (Ertekin et al., 1984) that may be generated at depth Froude numbers as low as about 0.2 (Ertekin et al., 1986). Such structures often result in high water velocities (Neuman et al., 2001), elevate shoreline water levels (Soomere et al., 2011), and are capable of building long-living
A. Rodin et al.: Ship-induced Riemann waves in the Venice Lagoon 23
rogue waves in shallow water (Peterson et al., 2003). An increase in the length-based Froude number at super-critical speeds may lead to Mach-type wave systems (Rabaud and Moisy, 2013; Darmon et al., 2014) in which the highest waves are located inside the Kelvin wedge (Noblesse et al., 2014).
Several components of vessel wakes may threaten ecosystems (Ali et al., 1999) and the users of the near-shore (Hamer, 1999) and the coast (Krylov, 2003) in regions where the levels of natural wave energy are normally small. Under specific conditions and in areas that are sheltered from ocean waves but exposed to significant ship traffic, vessel wakes may become a major factor in the dynamics of the coastal zone (Parnell and Kofoed-Hansen, 2001; Soomere, 2007). This feature has led to numerous attempts towards regulation of ship traffic in terms of the limitation of the wave height (Stumbo et al., 1999; Parnell and Kofoed-Han-sen, 2001; Varyani, 2006). Most of these regulations set limits on just a single property of the wave field or on a characteristic single wave component of the entire system of disturbances generated by a vessel, usually the highest waves (Macfarlane et al., 2014). This policy is generally inadequate as a craft that operates in relatively shallow water usually excites an extremely complex wave pattern that may substantially vary both in physical and spectral space (Torsvik and Soomere, 2008; Sheremet et al., 2013; Torsvik et al., 2015). For example, a supercritical bore causes an abrupt elevation of water level that may result in a surge wave at the coast (Gourlay, 2001; Gourlay and Cook, 2004).
Moreover, this policy is often limited to the prop-erties of either oscillatory motions of the water or to the waves of elevation. It is commonly accepted that for ship-generated disturbances the most significant environ-mental impacts come from almost non-dispersive wave groups of significant amplitude (Soomere, 2005). These groups, similar to tsunamis (Didenkulova et al., 2011b), may propagate over considerable distances, and may cause environmental damage and a hazard for people and property because their height and steepness (and consequently water velocities) are often amplified by shoaling. This understanding, however, implicitly reflects the properties of solutions of common equations for weakly nonlinear water waves (such as Korteweg–de Vries (KdV) or Kadomtsev–Pethviashvili equations). These equations may only have waves of elevation as their valid solitary-wave solutions.
A common effect of sailing at moderate and high depth Froude numbers (equivalently, in relatively shallow water) is the formation of a depression region (often called Bernoulli wake) in the ship’s vicinity (Akylas, 1984; Grimshaw and Smyth, 1986; Lee et al., 1989). Its presence reflects a common feature of another class of weakly nonlinear disturbances – solutions of the KdV equation called undular bore, a phenomenon
known theoretically for more than 60 years (Benjamin and Lighthill, 1954; Peregrine, 1966). This effect is common in numerical experiments of one-dimensional ship motion where it becomes evident as a gradually lengthening region of depression of nearly uniform depth (Baines, 1997; Torsvik et al., 2009a, 2009b). It is a well-known feature in navigational channels where it causes the draw-down effect usually called squat (Constantine, 1961; Graff, 1962; Naghdi and Rubin, 1984). As it is a major source of danger in shallow water navigation (Millward, 1996; Gourlay, 2003), squat has been well documented (e.g. Gourlay and Tuck, 2001; Gourlay, 2006) and its forecast is made routinely (El-Kader et al., 2003).
Similar depression regions are always formed when a ship is sailing at moderate depth Froude numbers. They are often detected as dangerous water level draw-downs at the banks of navigable rivers (Balzerek and Kozlowski, 2007) or in harbours adjacent to shallow waterways (Forsman, 2001). While the depression area is usually thought to be concentrated in the vicinity of the hull, in some situations the depression may start travelling as a free wave. The situation is particularly complicated if the wave amplitude is large enough for nonlinearity to affect the wave propagation. As the wave propagates over shallow areas and finally impacts the shoreline, the effect of nonlinearity will lead to different behaviours of waves depending on the wave polarity. These differences have been extensively studied in tsunami research (e.g., Carrier et al., 2003; Fernando et al., 2008). However, most of the relevant studies have only addressed the classical solitary wave solutions to (weakly) nonlinear shallow-water equa-tions, which are waves of elevation. The classical KdV model indicates that a sequence of elevation waves is rapidly formed from an initial depression (Arcas and Segur, 2012), with the leading elevation wave at the rear end of the depression being up to twice the height of the depression (Grimshaw et al., 2014).
The generation of a depression wave is particularly problematic if the navigation channel is surrounded by wide shallow-water areas. The classic case is the Venice Lagoon (Rapaglia et al., 2011). The depression waves may spread far away from the sailing line and substantial waves of depression have been reported at a distance of many hundreds of metres from the channel (Rapaglia et al., 2011). The rear of the depression often induces a bore-like feature at a certain distance from the genera-tion area (Ravens and Thomas, 2008). The resulting events have a characteristic deep leading trough, followed by a set of crests (Gelinas et al., 2013). This scenario is common in the analysis based on non-dispersive shallow-water propagation in wave systems led by a wave of depression. Such systems are particularly prone to the formation of steep slopes and high velocities (Didenkulova et al., 2014). This is a
Proceedings of the Estonian Academy of Sciences, 2015, 64, 1, 22–35
24
probable reason why ship-induced depression waves often play an unexpectedly large role in sediment resuspension (Rapaglia et al., 2011; Gelinas et al., 2013; Göransson et al., 2014).
Although weakly nonlinear theories provide an accurate qualitative picture of the various effects in areas to which depression waves propagate (Grimshaw et al., 2014), quantitative analysis of the fate of the largest examples of depression waves requires the application of fully nonlinear approaches. A recent study (Parnell et al., 2015) demonstrated that ships of fairly moderate size (blocking coefficient 0.07–0.14) and sailing at low to moderate depth Froude numbers (0.37–0.5) produce depressions with a depth up to 2.5 m at the border of the navigation channel. These waves decrease in height away from the channel but they obviously cannot be treated as linear or weakly nonlinear in the surrounding lagoon with the average depth of only 0.8 m. A feasible way to address these structures is the framework of fully nonlinear Riemann (or simple) waves (Whitham, 1974).
In this study we focus on the possibilities of numerical reconstruction of the propagation of such waves of depression in the Venice Lagoon. As dis-cussed above, weakly nonlinear approaches are only conditionally valid for the depressions that may almost dry the seabed in shallow areas adjacent to the channel (Parnell et al., 2015). In the framework of fully nonlinear shallow-water theory, Riemann waves of depression may exist as free waves and propagate to substantial distances (Whitham, 1974; Didenkulova et al., 2006). The distinguishing feature of such waves, as is the case for ship-induced depression waves, is the development of a V-like shape with an extremely steep, often bore-like rear slope. It is likely that large-amplitude Riemann waves of depression become strongly asymmetric when they propagate into and through shallow water sur-rounding the navigation channel (Pelinovsky and Rodin, 2012).
The central question addressed in this paper is how far these waves may propagate from the region of generation. The previous research (Parnell et al., 2015) demonstrated that the technique of Riemann waves makes it possible to replicate the qualitative features of evolution of the wave shape over about 100 m along both almost horizontal and sloping shallow side banks of the channel. To shed light on the further evolution of these vessel wakes, it is necessary to reach a quantitative match of the simulated and measured wake properties. We first provide a systematic way to initialize the relevant numerical simulations so that the basic quantitative properties of ship wakes are satisfactorily reproduced for the entire sequence of wave measurement locations. Comparison of several dozens of reconstructions of the wave properties over side banks of the navigation channel provides an
indication of the reliability and uncertainty of these reconstructions. Finally, the evolution of several examples of numerical replications of the observed depressions is tracked over many hundred metres into the lagoon. The core result is an estimate of the distance at which such depressions still have a substantial amplitude and are capable of providing high near-bottom velocities.
2. DATA AND METHODS
2.1. Field observations of ship-induced waves of depression in the Venice Lagoon The analysis of the propagation of depression waves in shallow water is based on measurements performed in spring 2014 in the Venice Lagoon, Italy. With a surface area of about 550 km2 it is the biggest lagoon in the Mediterranean region (Brambati et al., 2003; Madricardo and Donnici, 2014). As this lagoon is an extremely shallow water body (average depth 0.8 m), its water circulation is mainly controlled by tidal excursion, which ranges between 0.3 and 1.1 m. Water exchange with the open sea occurs through three inlets, whose depths range from about 10 m to more than 17 m for the Malamocco inlet.
The lagoon was intensely modified through centuries with two main goals: preventing sediment deposition in the areas around the city of Venice (for defence purposes) and stabilization of the inlets and barrier islands. The first goal was achieved by a series of modifications, which ended with the diversions of larger rivers (Brenta and Piave) into the sea, completed in the 16th century. This intervention has played a role in aggravating more recent problems of subsidence, natural and human-caused, and sea-level rise. The second goal was also achieved with a series of adjust-ments that ultimately led to the protection of barrier islands with seawalls in the 18th century and the con-struction of jetties at the three inlets between the late 19th and the early 20th century (Brambati et al., 2003).
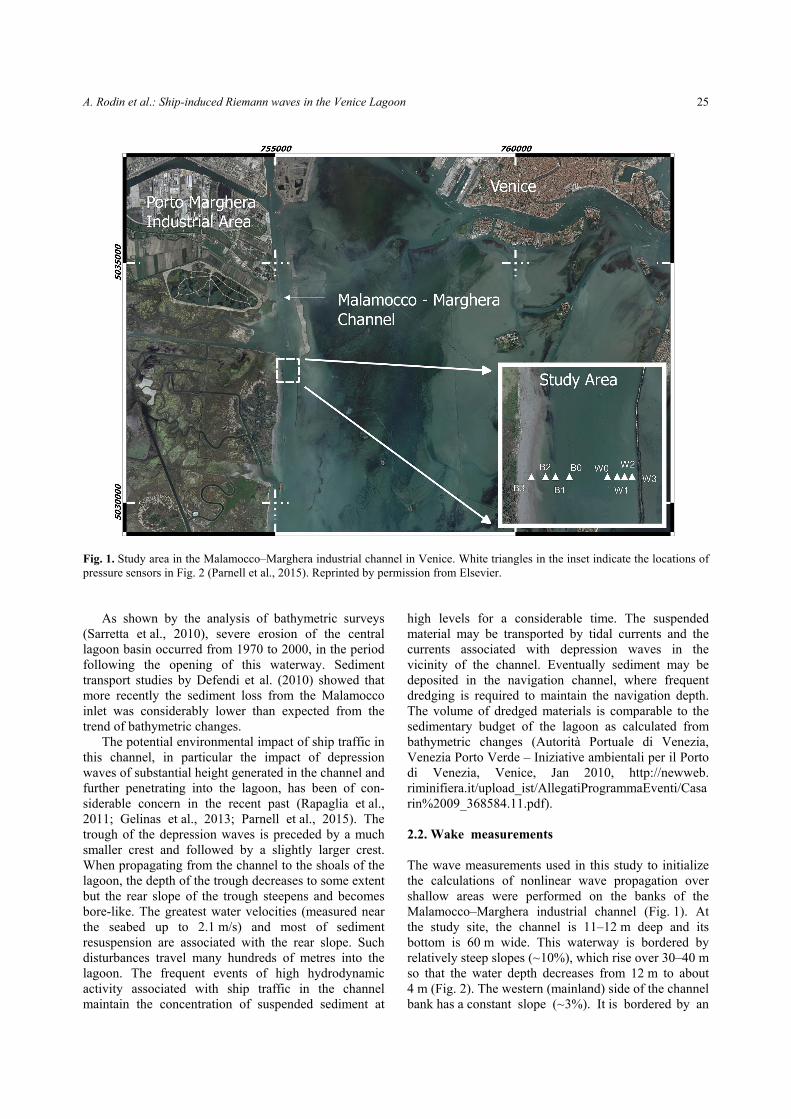
The development of the Porto Marghera Industrial Area between 1920 and 1970 directly to the west of Venice on the mainland coast (Fig. 1) was accompanied by dredging a new navigation channel (the Malamocco–Marghera channel, locally known as Canale dei Petroli) connecting the industrial zone to the Malamocco inlet. With a total length of 20 km, a width of about 200 m in the east–west section and 100 m in the north–south section, and a depth of 12 m, this channel is able to accommodate medium-sized container ships, bulk carriers, and tankers. The channel leads to the south of Porto Marghera along the mainland coast for 14 km and then turns sharply towards the Malamocco inlet (Rapaglia et al., 2011).
A. Rodin et al.: Ship-induced Riemann waves in the Venice Lagoon 25
Fig. 1. Study area in the Malamocco–Marghera industrial channel in Venice. White triangles in the inset indicate the locations of pressure sensors in Fig. 2 (Parnell et al., 2015). Reprinted by permission from Elsevier.
As shown by the analysis of bathymetric surveys
(Sarretta et al., 2010), severe erosion of the central lagoon basin occurred from 1970 to 2000, in the period following the opening of this waterway. Sediment transport studies by Defendi et al. (2010) showed that more recently the sediment loss from the Malamocco inlet was considerably lower than expected from the trend of bathymetric changes.
The potential environmental impact of ship traffic in this channel, in particular the impact of depression waves of substantial height generated in the channel and further penetrating into the lagoon, has been of con-siderable concern in the recent past (Rapaglia et al., 2011; Gelinas et al., 2013; Parnell et al., 2015). The trough of the depression waves is preceded by a much smaller crest and followed by a slightly larger crest. When propagating from the channel to the shoals of the lagoon, the depth of the trough decreases to some extent but the rear slope of the trough steepens and becomes bore-like. The greatest water velocities (measured near the seabed up to 2.1 m/s) and most of sediment resuspension are associated with the rear slope. Such disturbances travel many hundreds of metres into the lagoon. The frequent events of high hydrodynamic activity associated with ship traffic in the channel maintain the concentration of suspended sediment at
high levels for a considerable time. The suspended material may be transported by tidal currents and the currents associated with depression waves in the vicinity of the channel. Eventually sediment may be deposited in the navigation channel, where frequent dredging is required to maintain the navigation depth. The volume of dredged materials is comparable to the sedimentary budget of the lagoon as calculated from bathymetric changes (Autorità Portuale di Venezia, Venezia Porto Verde – Iniziative ambientali per il Porto di Venezia, Venice, Jan 2010, http://newweb. riminifiera.it/upload_ist/AllegatiProgrammaEventi/Casarin%2009_368584.11.pdf). 2.2. Wake measurements The wave measurements used in this study to initialize the calculations of nonlinear wave propagation over shallow areas were performed on the banks of the Malamocco–Marghera industrial channel (Fig. 1). At the study site, the channel is 11–12 m deep and its bottom is 60 m wide. This waterway is bordered by relatively steep slopes (~ 10%), which rise over 30–40 m so that the water depth decreases from 12 m to about 4 m (Fig. 2). The western (mainland) side of the channel bank has a constant slope (~ 3%). It is bordered by an
Proceedings of the Estonian Academy of Sciences, 2015, 64, 1, 22–35
26
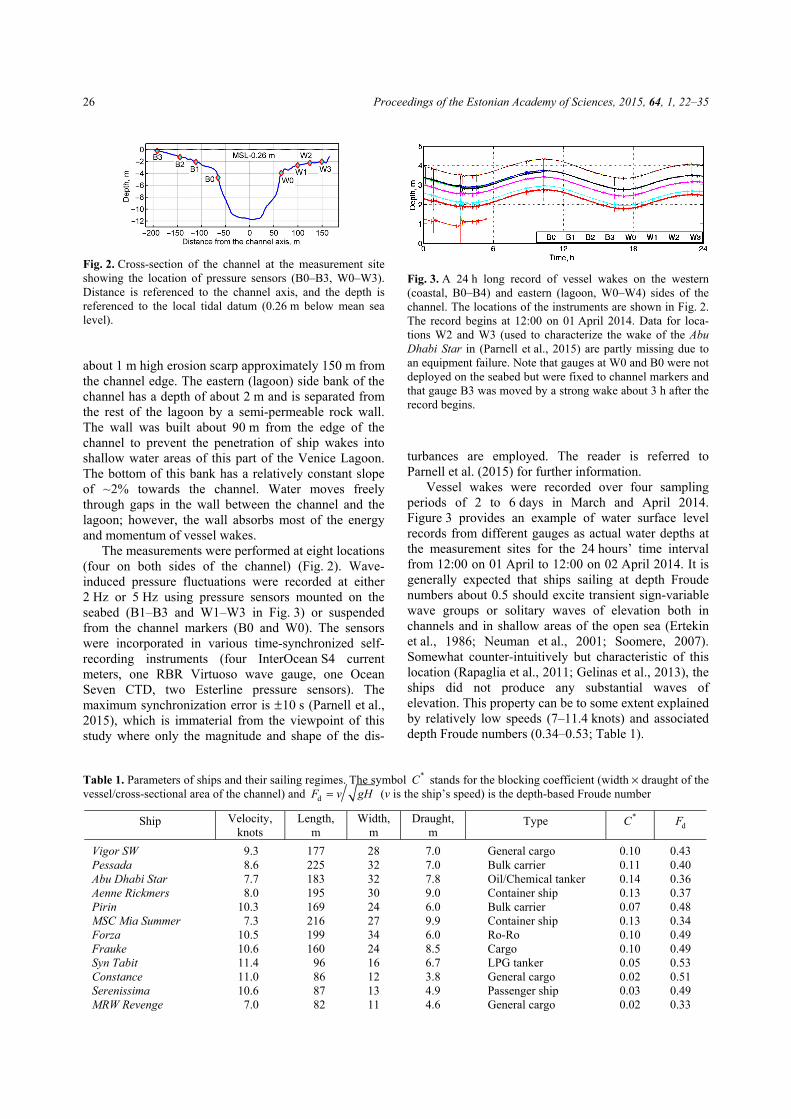
Fig. 2. Cross-section of the channel at the measurement site showing the location of pressure sensors (B0–B3, W0–W3). Distance is referenced to the channel axis, and the depth is referenced to the local tidal datum (0.26 m below mean sea level). about 1 m high erosion scarp approximately 150 m from the channel edge. The eastern (lagoon) side bank of the channel has a depth of about 2 m and is separated from the rest of the lagoon by a semi-permeable rock wall. The wall was built about 90 m from the edge of the channel to prevent the penetration of ship wakes into shallow water areas of this part of the Venice Lagoon. The bottom of this bank has a relatively constant slope of ~ 2% towards the channel. Water moves freely through gaps in the wall between the channel and the lagoon; however, the wall absorbs most of the energy and momentum of vessel wakes.
The measurements were performed at eight locations (four on both sides of the channel) (Fig. 2). Wave-induced pressure fluctuations were recorded at either 2 Hz or 5 Hz using pressure sensors mounted on the seabed (B1–B3 and W1–W3 in Fig. 3) or suspended from the channel markers (B0 and W0). The sensors were incorporated in various time-synchronized self-recording instruments (four InterOcean S4 current meters, one RBR Virtuoso wave gauge, one Ocean Seven CTD, two Esterline pressure sensors). The maximum synchronization error is ± 10 s (Parnell et al., 2015), which is immaterial from the viewpoint of this study where only the magnitude and shape of the dis-
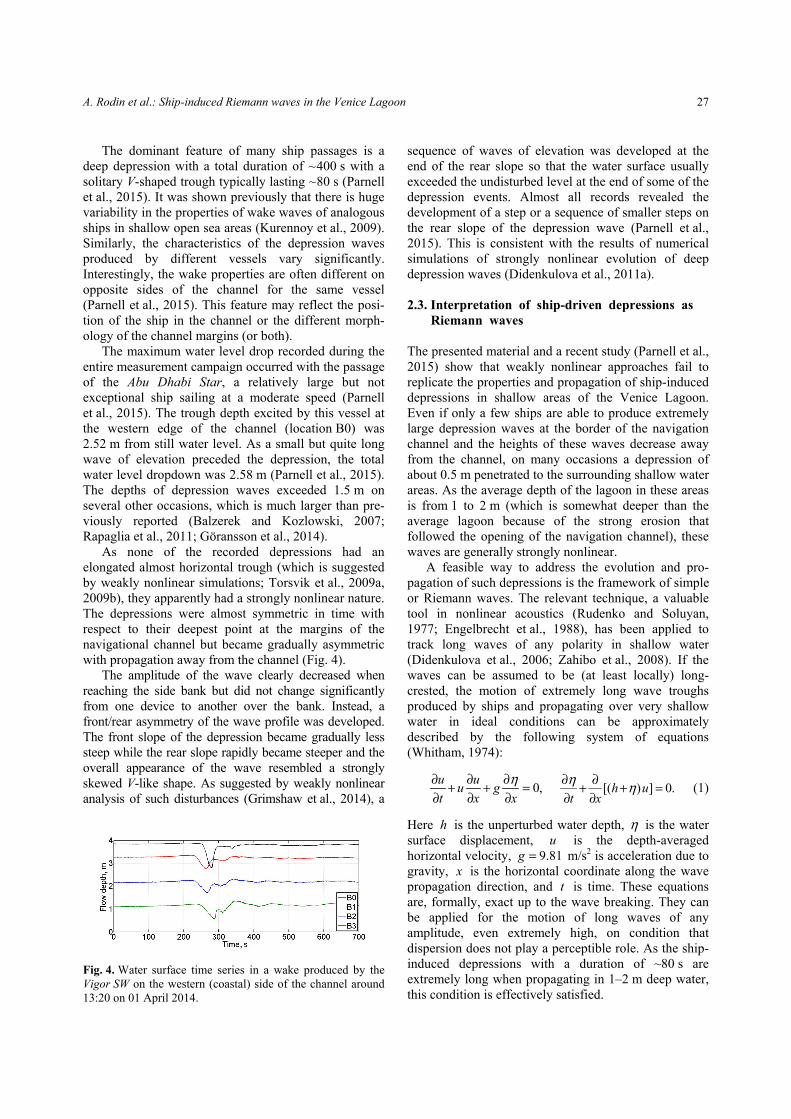
Fig. 3. A 24 h long record of vessel wakes on the western (coastal, B0–B4) and eastern (lagoon, W0–W4) sides of the channel. The locations of the instruments are shown in Fig. 2. The record begins at 12:00 on 01 April 2014. Data for loca-tions W2 and W3 (used to characterize the wake of the Abu Dhabi Star in (Parnell et al., 2015) are partly missing due to an equipment failure. Note that gauges at W0 and B0 were not deployed on the seabed but were fixed to channel markers and that gauge B3 was moved by a strong wake about 3 h after the record begins.
turbances are employed. The reader is referred to Parnell et al. (2015) for further information.
Vessel wakes were recorded over four sampling periods of 2 to 6 days in March and April 2014. Figure 3 provides an example of water surface level records from different gauges as actual water depths at the measurement sites for the 24 hours’ time interval from 12:00 on 01 April to 12:00 on 02 April 2014. It is generally expected that ships sailing at depth Froude numbers about 0.5 should excite transient sign-variable wave groups or solitary waves of elevation both in channels and in shallow areas of the open sea (Ertekin et al., 1986; Neuman et al., 2001; Soomere, 2007). Somewhat counter-intuitively but characteristic of this location (Rapaglia et al., 2011; Gelinas et al., 2013), the ships did not produce any substantial waves of elevation. This property can be to some extent explained by relatively low speeds (7–11.4 knots) and associated depth Froude numbers (0.34–0.53; Table 1).
Table 1. Parameters of ships and their sailing regimes. The symbol *C stands for the blocking coefficient (width × draught of the vessel/cross-sectional area of the channel) and dF v gH= (v is the ship’s speed) is the depth-based Froude number
Ship Velocity, knots
Length, m
Width,m
Draught,m
Type *C dF
Vigor SW 9.3 177 28 7.0 General cargo 0.10 0.43 Pessada 8.6 225 32 7.0 Bulk carrier 0.11 0.40 Abu Dhabi Star 7.7 183 32 7.8 Oil/Chemical tanker 0.14 0.36 Aenne Rickmers 8.0 195 30 9.0 Container ship 0.13 0.37 Pirin 10.3 169 24 6.0 Bulk carrier 0.07 0.48 MSC Mia Summer 7.3 216 27 9.9 Container ship 0.13 0.34 Forza 10.5 199 34 6.0 Ro-Ro 0.10 0.49 Frauke 10.6 160 24 8.5 Cargo 0.10 0.49 Syn Tabit 11.4 96 16 6.7 LPG tanker 0.05 0.53 Constance 11.0 86 12 3.8 General cargo 0.02 0.51 Serenissima 10.6 87 13 4.9 Passenger ship 0.03 0.49 MRW Revenge 7.0 82 11 4.6 General cargo 0.02 0.33
A. Rodin et al.: Ship-induced Riemann waves in the Venice Lagoon 27
The dominant feature of many ship passages is a deep depression with a total duration of ~ 400 s with a solitary V-shaped trough typically lasting ~ 80 s (Parnell et al., 2015). It was shown previously that there is huge variability in the properties of wake waves of analogous ships in shallow open sea areas (Kurennoy et al., 2009). Similarly, the characteristics of the depression waves produced by different vessels vary significantly. Interestingly, the wake properties are often different on opposite sides of the channel for the same vessel (Parnell et al., 2015). This feature may reflect the posi-tion of the ship in the channel or the different morph-ology of the channel margins (or both).
The maximum water level drop recorded during the entire measurement campaign occurred with the passage of the Abu Dhabi Star, a relatively large but not exceptional ship sailing at a moderate speed (Parnell et al., 2015). The trough depth excited by this vessel at the western edge of the channel (location B0) was 2.52 m from still water level. As a small but quite long wave of elevation preceded the depression, the total water level dropdown was 2.58 m (Parnell et al., 2015). The depths of depression waves exceeded 1.5 m on several other occasions, which is much larger than pre-viously reported (Balzerek and Kozlowski, 2007; Rapaglia et al., 2011; Göransson et al., 2014).
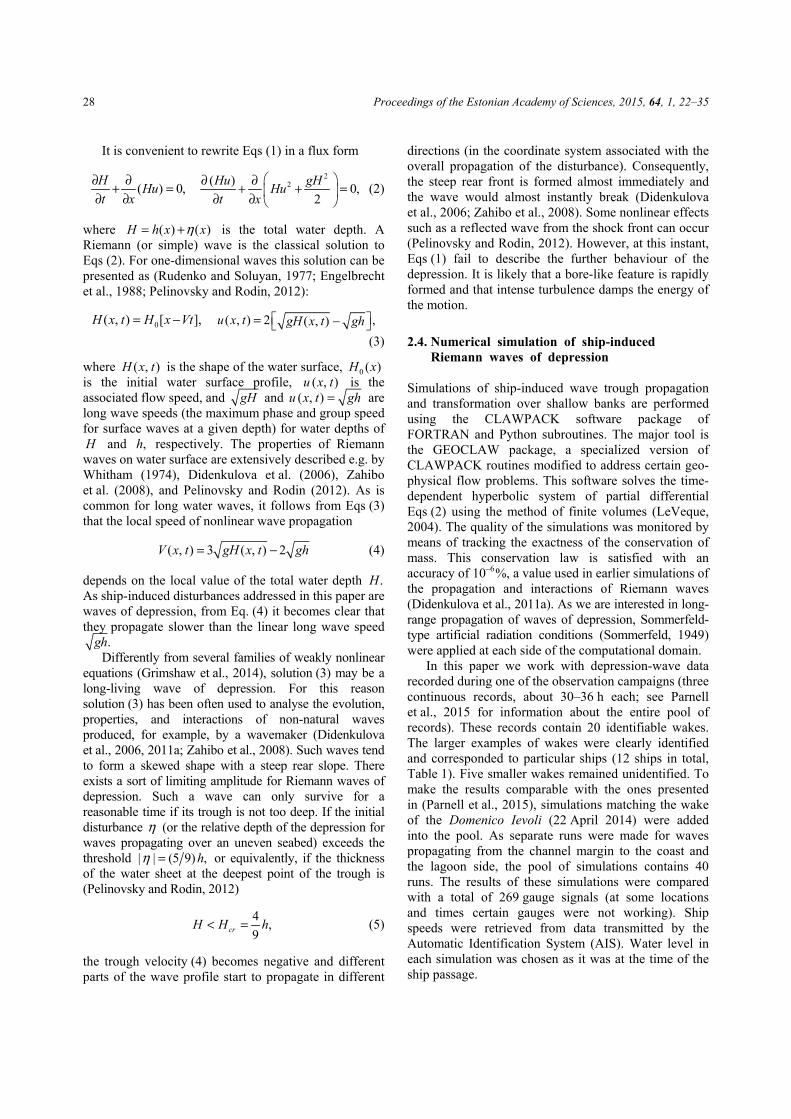
As none of the recorded depressions had an elongated almost horizontal trough (which is suggested by weakly nonlinear simulations; Torsvik et al., 2009a, 2009b), they apparently had a strongly nonlinear nature. The depressions were almost symmetric in time with respect to their deepest point at the margins of the navigational channel but became gradually asymmetric with propagation away from the channel (Fig. 4).
The amplitude of the wave clearly decreased when reaching the side bank but did not change significantly from one device to another over the bank. Instead, a front/rear asymmetry of the wave profile was developed. The front slope of the depression became gradually less steep while the rear slope rapidly became steeper and the overall appearance of the wave resembled a strongly skewed V-like shape. As suggested by weakly nonlinear analysis of such disturbances (Grimshaw et al., 2014), a
Fig. 4. Water surface time series in a wake produced by the Vigor SW on the western (coastal) side of the channel around 13:20 on 01 April 2014.
sequence of waves of elevation was developed at the end of the rear slope so that the water surface usually exceeded the undisturbed level at the end of some of the depression events. Almost all records revealed the development of a step or a sequence of smaller steps on the rear slope of the depression wave (Parnell et al., 2015). This is consistent with the results of numerical simulations of strongly nonlinear evolution of deep depression waves (Didenkulova et al., 2011a). 2.3. Interpretation of ship-driven depressions as Riemann waves The presented material and a recent study (Parnell et al., 2015) show that weakly nonlinear approaches fail to replicate the properties and propagation of ship-induced depressions in shallow areas of the Venice Lagoon. Even if only a few ships are able to produce extremely large depression waves at the border of the navigation channel and the heights of these waves decrease away from the channel, on many occasions a depression of about 0.5 m penetrated to the surrounding shallow water areas. As the average depth of the lagoon in these areas is from 1 to 2 m (which is somewhat deeper than the average lagoon because of the strong erosion that followed the opening of the navigation channel), these waves are generally strongly nonlinear.
A feasible way to address the evolution and pro-pagation of such depressions is the framework of simple or Riemann waves. The relevant technique, a valuable tool in nonlinear acoustics (Rudenko and Soluyan, 1977; Engelbrecht et al., 1988), has been applied to track long waves of any polarity in shallow water (Didenkulova et al., 2006; Zahibo et al., 2008). If the waves can be assumed to be (at least locally) long-crested, the motion of extremely long wave troughs produced by ships and propagating over very shallow water in ideal conditions can be approximately described by the following system of equations (Whitham, 1974):
0,u uu gt x x
η∂ ∂ ∂+ + =∂ ∂ ∂
[( ) ] 0.h ut xη η∂ ∂+ + =
∂ ∂ (1)
Here h is the unperturbed water depth, η is the water surface displacement, u is the depth-averaged horizontal velocity, 9.81g = m/s2 is acceleration due to gravity, x is the horizontal coordinate along the wave propagation direction, and t is time. These equations are, formally, exact up to the wave breaking. They can be applied for the motion of long waves of any amplitude, even extremely high, on condition that dispersion does not play a perceptible role. As the ship-induced depressions with a duration of ~80 s are extremely long when propagating in 1–2 m deep water, this condition is effectively satisfied.
Proceedings of the Estonian Academy of Sciences, 2015, 64, 1, 22–35
28
It is convenient to rewrite Eqs (1) in a flux form
( ) 0,H Hut x
∂ ∂+ =∂ ∂
2
2( ) 0,2
Hu gHHut x
∂ ∂+ + = ∂ ∂ (2)
where ( ) ( )H h x xη= + is the total water depth. A Riemann (or simple) wave is the classical solution to Eqs (2). For one-dimensional waves this solution can be presented as (Rudenko and Soluyan, 1977; Engelbrecht et al., 1988; Pelinovsky and Rodin, 2012):
0( , ) [ ],H x t H x Vt= − ( , ) 2 ,( , )u x t gH x t gh = − (3)
where ( , )H x t is the shape of the water surface, 0 ( )H x is the initial water surface profile, ( , )u x t is the associated flow speed, and gH and ( , )u x t gh= are long wave speeds (the maximum phase and group speed for surface waves at a given depth) for water depths of H and ,h respectively. The properties of Riemann waves on water surface are extensively described e.g. by Whitham (1974), Didenkulova et al. (2006), Zahibo et al. (2008), and Pelinovsky and Rodin (2012). As is common for long water waves, it follows from Eqs (3) that the local speed of nonlinear wave propagation
( , ) 3 ( , ) 2V x t gH x t gh= − (4)
depends on the local value of the total water depth .H As ship-induced disturbances addressed in this paper are waves of depression, from Eq. (4) it becomes clear that they propagate slower than the linear long wave speed
.gh Differently from several families of weakly nonlinear
equations (Grimshaw et al., 2014), solution (3) may be a long-living wave of depression. For this reason solution (3) has been often used to analyse the evolution, properties, and interactions of non-natural waves produced, for example, by a wavemaker (Didenkulova et al., 2006, 2011a; Zahibo et al., 2008). Such waves tend to form a skewed shape with a steep rear slope. There exists a sort of limiting amplitude for Riemann waves of depression. Such a wave can only survive for a reasonable time if its trough is not too deep. If the initial disturbance η (or the relative depth of the depression for waves propagating over an uneven seabed) exceeds the threshold | | (5 9) ,hη = or equivalently, if the thickness of the water sheet at the deepest point of the trough is (Pelinovsky and Rodin, 2012)
4 ,9crH H h< = (5)
the trough velocity (4) becomes negative and different parts of the wave profile start to propagate in different
directions (in the coordinate system associated with the overall propagation of the disturbance). Consequently, the steep rear front is formed almost immediately and the wave would almost instantly break (Didenkulova et al., 2006; Zahibo et al., 2008). Some nonlinear effects such as a reflected wave from the shock front can occur (Pelinovsky and Rodin, 2012). However, at this instant, Eqs (1) fail to describe the further behaviour of the depression. It is likely that a bore-like feature is rapidly formed and that intense turbulence damps the energy of the motion.
2.4. Numerical simulation of ship-induced Riemann waves of depression Simulations of ship-induced wave trough propagation and transformation over shallow banks are performed using the CLAWPACK software package of FORTRAN and Python subroutines. The major tool is the GEOCLAW package, a specialized version of CLAWPACK routines modified to address certain geo-physical flow problems. This software solves the time-dependent hyperbolic system of partial differential Eqs (2) using the method of finite volumes (LeVeque, 2004). The quality of the simulations was monitored by means of tracking the exactness of the conservation of mass. This conservation law is satisfied with an accuracy of 10–6
%, a value used in earlier simulations of the propagation and interactions of Riemann waves (Didenkulova et al., 2011a). As we are interested in long-range propagation of waves of depression, Sommerfeld-type artificial radiation conditions (Sommerfeld, 1949) were applied at each side of the computational domain.
In this paper we work with depression-wave data recorded during one of the observation campaigns (three continuous records, about 30–36 h each; see Parnell et al., 2015 for information about the entire pool of records). These records contain 20 identifiable wakes. The larger examples of wakes were clearly identified and corresponded to particular ships (12 ships in total, Table 1). Five smaller wakes remained unidentified. To make the results comparable with the ones presented in (Parnell et al., 2015), simulations matching the wake of the Domenico Ievoli (22 April 2014) were added into the pool. As separate runs were made for waves propagating from the channel margin to the coast and the lagoon side, the pool of simulations contains 40 runs. The results of these simulations were compared with a total of 269 gauge signals (at some locations and times certain gauges were not working). Ship speeds were retrieved from data transmitted by the Automatic Identification System (AIS). Water level in each simulation was chosen as it was at the time of the ship passage.
A. Rodin et al.: Ship-induced Riemann waves in the Venice Lagoon 29
2.5. Calibration of the initial conditions The initial shapes of the depressions for simulations were constructed based on measured wake properties at the channel margins (B0 and W0). It is not obvious whether the measured depressions were forced dis-turbances or were already propagating as free waves. As we are specifically interested in the far field of the propa-gation of vessel wakes in the lagoon, to a first approxima-tion we assumed that the depression was already travelling as a free wave at the margin of the channel. For ships moving in a strongly nonlinear regime the leading wave is a deep depression of a generally symmetric shape that resembles a Gaussian distribution with negative polarity (Torsvik and Soomere, 2008; Torsvik et al., 2009b). This assertion is consistent with a specific skewed V-like shape of the depression at the margins. This shape is a natural consequence of the evolution of initially smooth and symmetric deep depressions (Peli-novsky and Rodin, 2012). Based on these arguments, we assumed that the depression wave was initially (at the location of generation) symmetric with respect to time (or the ship motion).
It is also reasonable to presume that after some time (or at a certain distance from the sailing line) the details (shape, asymmetry, etc.) of vessel wakes are no longer directly connected with the properties of the hull and are defined by generic rules that govern the propagation of depressions of a certain amplitude. To test this assertion, we ran simulations with smooth soliton-like pulses and depressions of the shape of an inverted Gaussian bell. The exact shape of the initial pulse only insignificantly affected the results of simulations along the side banks. Therefore, to initialize ship-driven water disturbances we used a Gaussian bell shape of negative polarity
2
0 0 2( ) exp .xH x Al
= −
(6)
Here 0A is the initial amplitude of the trough and l is the characteristic half-size of the initial impulse.
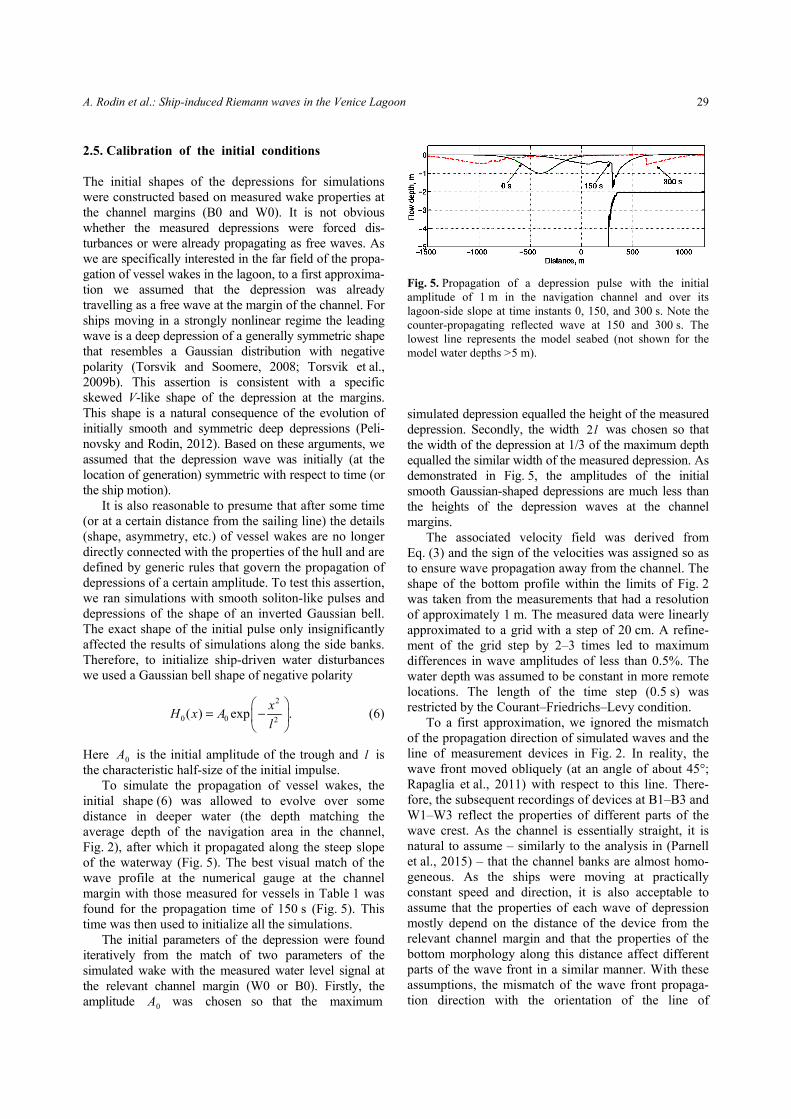
To simulate the propagation of vessel wakes, the initial shape (6) was allowed to evolve over some distance in deeper water (the depth matching the average depth of the navigation area in the channel, Fig. 2), after which it propagated along the steep slope of the waterway (Fig. 5). The best visual match of the wave profile at the numerical gauge at the channel margin with those measured for vessels in Table 1 was found for the propagation time of 150 s (Fig. 5). This time was then used to initialize all the simulations.
The initial parameters of the depression were found iteratively from the match of two parameters of the simulated wake with the measured water level signal at the relevant channel margin (W0 or B0). Firstly, the amplitude 0A was chosen so that the maximum
Fig. 5. Propagation of a depression pulse with the initial amplitude of 1 m in the navigation channel and over its lagoon-side slope at time instants 0, 150, and 300 s. Note the counter-propagating reflected wave at 150 and 300 s. The lowest line represents the model seabed (not shown for the model water depths > 5 m). simulated depression equalled the height of the measured depression. Secondly, the width 2 l was chosen so that the width of the depression at 1/3 of the maximum depth equalled the similar width of the measured depression. As demonstrated in Fig. 5, the amplitudes of the initial smooth Gaussian-shaped depressions are much less than the heights of the depression waves at the channel margins.
The associated velocity field was derived from Eq. (3) and the sign of the velocities was assigned so as to ensure wave propagation away from the channel. The shape of the bottom profile within the limits of Fig. 2 was taken from the measurements that had a resolution of approximately 1 m. The measured data were linearly approximated to a grid with a step of 20 cm. A refine-ment of the grid step by 2–3 times led to maximum differences in wave amplitudes of less than 0.5%. The water depth was assumed to be constant in more remote locations. The length of the time step (0.5 s) was restricted by the Courant–Friedrichs–Levy condition.
To a first approximation, we ignored the mismatch of the propagation direction of simulated waves and the line of measurement devices in Fig. 2. In reality, the wave front moved obliquely (at an angle of about 45°; Rapaglia et al., 2011) with respect to this line. There-fore, the subsequent recordings of devices at B1–B3 and W1–W3 reflect the properties of different parts of the wave crest. As the channel is essentially straight, it is natural to assume – similarly to the analysis in (Parnell et al., 2015) – that the channel banks are almost homo-geneous. As the ships were moving at practically constant speed and direction, it is also acceptable to assume that the properties of each wave of depression mostly depend on the distance of the device from the relevant channel margin and that the properties of the bottom morphology along this distance affect different parts of the wave front in a similar manner. With these assumptions, the mismatch of the wave front propaga-tion direction with the orientation of the line of

Proceedings of the Estonian Academy of Sciences, 2015, 64, 1, 22–35
30
measurement devices will only lead to a certain shift in the timing of the measured and the simulated signal. 3. RESULTS
3.1. Simulated and measured wakes Figures 6 and 7 present typical examples of the com-parison of numerically replicated depressions with the measured data for each gauge over the beach-side and the lagoon-side bank of the channel, respectively. Although the initial wave shape is smooth and symmetric (and thus very different from the measured signal), the shape of the simulated wave (including the initial small and long wave of elevation) largely matches the measured wave profiles. This suggests that the numerical model reasonably describes the major
Fig. 6. Propagation of a numerically simulated Riemann wave matching the depression created by the Vigor SW over the beach-side bank of the channel at measurement sites B0–B3 on 01 April 2014 at 13:20. Red: measured profiles; blue: simulated profiles.
Fig. 7. Propagation of a numerically simulated Riemann wave matching the depression created by the Pessada over the lagoon-side bank of the channel at measurement sites W1–W3 (data from W0 are absent due to equipment failure) on 28 March 2014 at 8:30. Red: measured profiles; blue: simulated profiles.
features of wave propagation and transformation (such as the smoothing of the front slope of the wave and the steepening of the rear slope (see Figs 6 and 7)) in the framework of nonlinear shallow water theory. Although in the navigation channel weakly nonlinear approaches are apparently also adequate, the nonlinear framework should be applied at the side banks and in the lagoon. The height of the depression, although on some occasions replicated adequately at all measurement locations (Fig. 7), is often underestimated at inter-mediate locations W1, W2, B1, and B2. Interestingly, the match is particularly good at locations W3 and B3.
The condition | | (5 9) hη > (Didenkulova et al., 2006; Zahibo et al., 2008) is usually satisfied starting from a certain location for largest waves on the coastal side of a channel. This means that in the strongly nonlinear environment a shock-like rear slope of the wave trough appears almost instantaneously and that the wave propagates into the shallow area as a bore (Parnell et al., 2015). Some fluctuations ahead of the shock are evidently caused by irregularities of the bottom profile. In general, even these wave troughs can be well described by the numerical solution, which in extreme cases can have different nonlinear effects (Pelinovsky and Rodin, 2012).
Comparison of the maximum measured depression depths at different locations with the numerically replicated values (Fig. 8) demonstrates that the numerical approach tends to overestimate the wave height. The parameters of the linear regression line (in which the locations used for the calibration are excluded)
max (measured) max (simulated)0.27 0.32H H= + (7)
show that simulations overestimate the wave amplitude on average by more than 40%. It is natural that the match is almost perfect for the locations at the channel
Fig. 8. Simulated and measured trough amplitudes for all 12 vessel passages with the regression lines for all measurement sites except calibration locations W0 and B0 (blue dashed line) and the most distant sites B3 and W3 only (black dotted line).
A. Rodin et al.: Ship-induced Riemann waves in the Venice Lagoon 31
margins, where the initial parameters of virtual dis-turbances (6) were calibrated. The match is relatively poor for locations B1, B2, W1, and W2, where the maximum water level dropdown is often overestimated by a factor of two or even more. However, as Fig. 8 demonstrates, the match of measured and simulated depths of the depression is almost perfect at the remotest measurement locations B3 and W3. This feature suggests that the numerical model, even though it fails to reproduce some features of the near-field propagation of depression waves, eventually adequately replicates the future propagation of these waves into the lagoon. In general, it demonstrates a good agreement between calculated and real data considering the crude-ness of the approximation in the mathematical model.
The spreading of calculated and measured data can be evaluated using the classical root mean square difference
simulated measured 2
1
1 ( 1) .N
n nn
R RN
δ=
= −∑ (8)
Here, simulatedR and measuredR are numerically calculated and measured maximum depths of the depression at different measurement locations, respectively, and N is the total number of comparable pairs of their values. The value of δ reaches 0.36 m when all measurements at W1–W3 and B1–B3 are involved. The spreading is considerably less, 0.26 m, for the lagoon-side most remote site W3. 3.2. Long-term propagation of simulated wakes into the lagoon To estimate the practical significance of the permeable rock wall at the Malamocco–Marghera industrial channel and the risk of dangerous high-amplitude depressions followed by bore-like phenomena occurring in the Venice Lagoon (e.g., in case of the absence of such a wall along other sections of the channel), we simulated the further behaviour of the disturbances over a plane seabed. In other words, we ignored the wall and looked at the fate of such waves (with initial profiles chosen as described above) in water of constant depth.
As the simulations were in good agreement with the measured data, particularly at the most distant sites B3 and W3 from the channel, it is likely that the simula-tions adequately replicate the far-field situation in the lagoon. It is reasonable to use a constant depth in the lagoon instead of real bathymetry because the impact of the actual bottom on the wave propagation cannot be replicated by the model. Two processes have the largest effect on the wave motion. On the one hand, the depth in the lagoon is (at least over low tide) generally much less than 2 m and thus nonlinear effects tend to steepen the rear front of the depression much more strongly than
in the simulations. On the other hand, the wave loses its energy and compactness while interacting with and reflecting from the inhomogeneities of the bottom profile. Thus, the depth of the lagoon is assumed constant and equal to the water depth immediately at the channel side of the wall (2 m). As we are specifically interested in the far-field behaviour of the vessel wakes, in numerical experiments we ignored the presence of the coast for wakes propagating along the western bank and investigated also the possible fate of these depressions in water of constant depth.
It is debatable how large the ‘safe’ height of the depression far from the navigation channel is. A usual requirement is that the vessel-induced wave height
maxH (in metres) should not exceed the limiting value (Parnell and Kofoed-Hansen, 2001)
max4.50.5HT
≤ (9)
at a still water depth of 3 m. Here T is the period of the waves in seconds. The usual period of high and dangerous vessel waves of elevation is 9–12 s (Parnell and Kofoed-Hansen, 2001; Soomere, 2007). For waves with a period 12.5 s the limiting value is max 0.3 m.H = Although the effective period of depression waves is much longer, expression (9) becomes irrelevant for even longer waves. Also, waves below 0.3 m are usually harmless for coasts and their ecosystem. Moreover, disturbances below this height are already weakly non-linear and evidently rapidly lose their bore-like prop-erties. Based on these arguments, it can be assumed that a ‘safe’ trough amplitude for people and small boats in the lagoon, and possibly for the environment, is 0.3 m.
A typical example of a relatively large depression that propagates into the lagoon has the amplitude of the initial Gaussian-shaped depression A0 = 1 m and the characteristic half-size l = 200 m. An initial depression (6) with these values matches well the shape and amplitude of the wake of the Vigor SW at the channel margin (Fig. 6) and is representative of the wakes that occur most frequently in the Malamocco–Marghera channel. Snapshots of the profile of this wave at selected time moments (Fig. 5) demonstrate that the depression develops a characteristic skewed V-like shape after some time. A time–space diagram (Fig. 9) shows that despite energy loss and reflection in the process of interaction with the slope of the channel, in the absence of the wall the wave height remains well over 0.3 m after a long incursion into the lagoon. The height of this depression falls to 0.3 m only after the pulse has travelled about 1500 m (equivalent to about 400 s) from the location of the wall. Even if we assume that the simulation overestimates the height of the depression (cf. Eq. (7)), the depression wave will cover at least 700–900 m before it becomes less than 0.3 m

Proceedings of the Estonian Academy of Sciences, 2015, 64, 1, 22–35
32
Fig. 9. Space–time (x–t) diagram of the simulated wave profile produced by the depression wave with the initial amplitude A0 = 1 m propagating to the eastern (lagoon) side of the channel.
high. This conjecture is consistent with the observation by Rapaglia et al. (2011) that a 0.8 m high wave remained > 0.3 m high at a distance of about 300 m from the channel margin.
Numerically replicated properties of a selection of wakes in the lagoon under the above-described initial and simulation conditions evolve in a very similar manner (Fig. 10). The initial propagation corresponds to the wave motion in idealized conditions (constant water depth equal to the depth of the bottom of the navigation channel) during which hardly any changes occur in the properties of the depressions. The wave amplitude increases rapidly when it reaches the beginning of the side slope of the channel. The maximum amplitude (comparable to the recorded values) is reached near the channel margin. Further propagation is accompanied by a gradual decrease in the amplitude whereas the amplitudes of different initial impulses rapidly level off and become almost equal after ~ 50 s (~ 200 m) propaga-tion into the lagoon. Further changes in the waves are almost independent of the initial properties.
Fig. 10. Temporal evolution of numerically simulated trough amplitudes. The initial properties of the Gaussian-shaped depressions are as follows: Vigor SW (01 April 2014 at 13:20) – initial amplitude A0 = 1 m and characteristic half-size l = 200 m; Domenico Ievoli (22 April 2014 at 06:50) – A0 = 0.92 m, l = 100 m; Pessada (28 March 2014 at 8:30) – A0 = 0.65 m, l = 182.5 m; Abu Dhabi Star (01 April 2014 at 15:38) – A0 = 0.8 m, l = 195 m.
Fig. 11. Numerically simulated trough profiles in the Venice Lagoon after 300 s propagation time. The different locations of the wave trough are caused by different propagation speeds (4).
To understand how even larger-amplitude depressions may behave in the lagoon, we also consider a hypo-thetical case with characteristic half-size l = 182.5 m and extremely high initial amplitude of 2.5 m (matching the largest of the measured depression waves at the channel margin). This hypothetical disturbance creates an unrealistically deep depression (almost 6 m) at the channel slope. Its height is rapidly reduced to the level of real wakes at the channel margin and soon becomes almost equal to the height of the numerical replication of the largest measured wakes.
Importantly, the heights of all simulated wakes, including the very deep hypothetical one, level off after some propagation time (Fig. 10). This feature suggests that several real wakes may produce depressions of the maximum theoretically possible amplitude in the Venice Lagoon. Moreover, it is likely that the further propaga-tion of such entities is almost independent of their initial amplitude. Consequently, even depressions of relatively modest amplitude may keep their height at a dangerous level over long distances.
The shapes of various measured and simulated depressions are largely different at the channel margin (Figs 6 and 7; see also Parnell et al., 2015). Similarly to the wave heights, the shapes of depressions also become similar after longer propagation distances (Fig. 11). Their characteristic features are a gently sloping front and a very steep rear, even at a distance of > 1 km from the navigation channel. Although building up and keep-ing this shape may reflect specific features of the evolu-tion of idealized Riemann waves and dispersion effects eventually triggering the formation of waves of eleva-tion after some time, it is likely that the bore-like appearance of the rear of the depression waves may be preserved over substantial distances. 4. DISCUSSION AND CONCLUDING REMARKS The environmental impacts of vessel-generated waves have received considerable attention in the international scientific and engineering literature. The increase in

A. Rodin et al.: Ship-induced Riemann waves in the Venice Lagoon 33
water level associated with the leading edges of the waves is commonly regarded to be of largest environ-mental significance. With the exception of studies on sediment resuspension and turbidity (e.g., Rapaglia et al., 2011; Göransson et al., 2014) there have been few studies on the impacts of depression waves produced by various ships (Forsman, 2001). Previous research (Par-nell et al., 2015) has demonstrated that unexpectedly high (up to 2.5 m) and extremely long depression waves are generated by moderately-sized ships sailing at very moderate depth Froude numbers (< 0.5) and low block-ing coefficients (< 0.14) in channels surrounded by extensive shallow banks. These disturbances drive possibly significant but likely not exceptional water velocities (cf. Rapaglia et al., 2011) in the channel itself.
Our research addressed the possibility for these depression waves to propagate virtually freely away from the navigation channel and to penetrate onto wide and shallow shoals (estuary, river bank, shallow lagoon, etc.). These extremely long (typical periods of > 40 s and associated lengths > 250 m) waves experience transformations characteristic of strongly nonlinear Rie-mann waves on the water surface when they reach the channel margin (Parnell et al., 2015). Their front keeps a modest slope but their rear develops an extremely steep, near-breaking slope, or even a bore-like feature at a distance of much less than 100 m from the channel margin. The resulting water velocities and the overall possible environmental impact (Rapaglia et al., 2011; Gelinas et al., 2013) are likely much larger than those derived from common expressions for linear or weakly nonlinear waves (Parnell et al., 2015).
The simulations first of all demonstrate that a dis-turbance of considerable amplitude continues to move as a strongly nonlinear wave to a substantial distance. The amplitudes of very deep depressions rapidly (within 20–30 s) level off to a value that is apparently limited by the water depth. The multi-step structure of the rear slope (that exists at the margin of the navigation channel, equivalently, at the seaward slope of the shallow area, possibly owing to the presence of reflected wave compo-nents) disappears after a period of time. Importantly, the nonlinearity continuously acts towards building up a very steep rear slope of the depression and (in cases when dispersion can be neglected) the disturbance obtains a shape characteristic of Riemann waves of depression: a relatively gentle slope followed by a steep rear.
The amplitude of such depressions for the dis-turbances that are representative of the frequently occur-ring wakes in the Malamocco–Marghera channel in the Venice Lagoon remains at dangerous levels (> 0.3 m) for distances of more than 1 km in our simulations. The actual depth of the lagoon is usually clearly smaller than the water depth at the channel side of the wall. The cause of this difference is that erosion on the channel
side has removed some sediment from the bottom as the wall was originally built on a flat bottom more or less simultaneously with the dredging of the channel. There-fore, it is reasonable to assume a shallower depth for the lagoon side of the wall than used in the model (2 m). This means that nonlinear effects are eventually greater than in the performed simulations and the steep bore-like feature may persist for an even longer time.
As the heights of all such depressions may become almost independent of their initial properties, even modest ships in terms of their size, sailing speed, and blocking coefficient may generate wakes that travel as compact entities over extensive areas of the lagoon adjacent to the navigation channels. Their impact may potentially lead to extensive resuspension and transport of bottom sediments and substantially increased levels of environmental consequences of ship wakes in this and similar water bodies. An adequate evaluation of these phenomena requires application of fully nonlinear approaches to describe the propagation of the depressions.
ACKNOWLEDGEMENTS The research into Riemann waves was funded by the Estonian Science Foundation (grant No. 9125), targeted financing by the Estonian Ministry of Education and Research (grants SF0140007s11 and IUT33-3), and through support of the European Regional Development Fund to the Centre of Excellence in Non-linear Studies CENS. The field studies were undertaken while Kevin Parnell was hosted by CNR-ISMAR, Venice, Italy, and were funded by the project Ritmare (SP3-WP3-A1). The contributions of Giuliano Lorenzetti and Gian Marco Scarpa to fieldwork and data management are gratefully acknowledged.
REFERENCES Akylas, T. 1984. On the excitation of long nonlinear water
waves by a moving pressure distribution. J. Fluid Mech., 141, 455–466.
Ali, M. M., Murphy, K. J., and Langendorff, J. 1999. Inter-relations of river ship traffic with aquatic plants in the River Nile, Upper Egypt. Hydrobiologia, 415, 93–100.
Arcas, D. and Segur, H. 2012. Seismically generated tsunamis. Phil. Trans. R. Soc., 370, 1505–1542.
Baines, P. G. 1997. Topographic Effects in Stratified Flows. Cambridge Monographs on Mechanics. Cambridge University Press, Cambridge, UK.
Balzerek, H. and Kozlowski, J. 2007. Ship-induced riverbank and harbour damage. Evidence for claims processing. Hydro International, 11(8), 18–21.
Benjamin, T. B. and Lighthill, M. J. 1954. On cnoidal waves and bores. Proc. R. Soc. London A, 224, 448–460.
Proceedings of the Estonian Academy of Sciences, 2015, 64, 1, 22–35
34
Brambati, A., Carbognin, L., Quaia, T., Teatini, P., and Tosi, L. 2003. The Lagoon of Venice: geological setting, evolu-tion and land subsidence. Episodes, 26(3), 264–265.
Carrier, G. F., Wu, T. T., and Yeh, H. 2003. Tsunami run-up and drawdown on a plane beach. J. Fluid Mech., 475, 79–99.
Constantine, T. 1961. On the movement of ships in restricted waterways. J. Fluid Mech., 9, 247–256.
Darmon, A., Benzaquen, M., and Raphael, E. 2014. Kelvin wake pattern at large Froude numbers. J. Fluid Mech., 738, Art. No. R3.
Defendi, V., Kovačević, V., Zaggia, L., and Arena, F. 2010. Estimating sediment transport from acoustic measure-ments in the Venice Lagoon inlets. Cont. Shelf Res., 30, 883–893.
Didenkulova, I. I., Zahibo, N., Kurkin, A. A., and Peli-novsky, E. N. 2006. Steepness and spectrum of a nonlinearly deformed wave on shallow waters. Izv. Atmos. Ocean. Phys., 42, 773–776.
Didenkulova, I., Pelinovsky, E., and Rodin, A. 2011a. Non-linear interaction of large-amplitude unidirectional waves in shallow water. Estonian J. Eng., 17, 289–300.
Didenkulova, I., Pelinovsky, E., and Soomere, T. 2011b. Can the waves generated by fast ferries be a physical model of tsunami? Pure Appl. Geophys., 168, 2071–2082.
Didenkulova, I. I., Pelinovsky, E. N., and Didenkulov, O. I. 2014. Run-up of long solitary waves of different polarities on a plane beach. Izv. Atmos. Ocean. Phys., 50, 532–538.
El-Kader, F. A., El-Soud, M. S. A., El-Serafy, K., and Hassan, E. A. 2003. An integrated navigation system for Suez Canal (SCINS). J. Navigation, 56, 241–255.
Engelbrecht, J. K., Fridman, V. E., and Pelinovski, E. N. 1988. Nonlinear Evolution Equations. Pitman Research Notes in Mathematics Series, No. 180. Longman, London, 1988.
Ertekin, R. C., Webster, W. C., and Wehausen, J. V. 1984. Ship-generated solitons. In Proceedings of 15th Symposium on Naval Hydrodynamics, Hamburg, Federal Republic of Germany, September 2–7. National Academy Press, Washington, D.C., pp. 347–364.
Ertekin, R. C., Webster, W. C., and Wehausen, J. V. 1986. Waves caused by a moving disturbance in a shallow channel of finite width. J. Fluid Mech., 169, 275–292.
Fernando, H. J. S., Braun, A., Galappatti, R., Ruwanpura, J., and Wirisinghe, S. C. 2008. Tsunamis: manifestation and aftermath. In Large Scale Disasters. Cambridge University Press, Cambridge, pp. 258–292.
Forsman, B. 2001. From bow to beach. SSPA Highlights, No. 3/2001, 4–5.
Gelinas, M., Bokuniewicz, H., Rapaglia, J., and Lwiza, K. M. M. 2013. Sediment resuspension by ship wakes in the Venice Lagoon. J. Coast. Res., 29, 8–17.
Göransson, G., Larson, M., and Althage, J. 2014. Ship-generated waves and induced turbidity in the Göta Älv River in Sweden. J. Waterw. Port Coast. Ocean Eng., 140(3), 04014004.
Gourlay, T. P. 2001. The supercritical bore produced by a high-speed ship in a channel. J. Fluid Mech., 434, 399–409.
Gourlay, T. P. 2003. Ship squat in water of varying depth. Int. J. Marit. Eng., 145, 1–8.
Gourlay, T. P. 2006. A simple method for predicting the maximum squat of a high-speed displacement ship. Mar. Technol. Soc. J., 43, 146–151.
Gourlay, T. P. and Cook, S. M. 2004. Flow past a ship radiating a bore in a channel. Proc. Inst. Mech. Eng. M. J. Eng. Marit. Environ., 218, 31–40.
Gourlay, T. P. and Tuck, E. O. 2001. The maximum sinkage of a ship. J. Ship Res., 45, 50–58.
Graff, W. 1962. Untersuchungen über die Ausbildung des Wellenwiderstandes im Bereich der Stauwellen-geschwindigkeit in flachem, seitlich beschränktem Fahrwasser. Schiffstechnik, 9, 110–122.
Grimshaw, R. H. J. and Smyth, N. 1986. Resonant flow of a stratified flow over topography. J. Fluid Mech., 169, 429–464.
Grimshaw, R. H. J., Hunt, J. C. R., and Chow, K. W. 2014. Changing forms and sudden smooth transitions of tsunami waves. J. Ocean Eng. Mar. Energy, doi: 10.1007/s40722-014-0011-1
Hamer, M. 1999. Solitary killers. New Sci., 163(2201), 18–19. Krylov, A. N. 2003. On the wave resistance and large ship
waves. In My Memoirs. Politekhnika, Sankt-Peterburg, pp. 364–368 (in Russian).
Kurennoy, D., Soomere, T., and Parnell, K. E. 2009. Vari-ability in the properties of wakes generated by high-speed ferries. J. Coast. Res., SI 56, 519–523.
Kuznetsov, N., Maz′ya, V., and Vainberg, B. 2002. Linear Water Waves: A Mathematical Approach. Cambridge University Press.
Lee, S. J., Yates, G. T., and Wu, T. Y. 1989. Experiments and analyses of upstream-advancing solitary waves generated by moving disturbances. J. Fluid Mech., 199, 569–593.
LeVeque, R. J. 2004. Finite-Volume Methods for Hyperbolic Problems. Cambridge University Press.
Lighthill, J. 1978. Waves in Fluids. Cambridge University Press.
Macfarlane, G. J., Duffy, J. T., and Bose, N. 2014. Rapid assessment of boat-generated waves within sheltered waterways. Aust. J. Civil Eng., 12(1), 31–40.
Madricardo, F. and Donnici, S. 2014. Mapping past and recent landscape modifications in the Lagoon of Venice through geophysical surveys and historical maps. Anthropocene, 6, 86–96.
Millward, A. 1996. A review of the prediction of squat in shallow water. J. Navigation, 49, 77–88.
Naghdi, P. M. and Rubin, M. B. 1984. On the squat of a ship. J. Ship Res., 28, 107–117.
Neuman, D., Tapio, E., Haggard, D., Laws, K., and Bland, R. 2001. Observation of long waves generated by ferries. Can. J. Remote Sens., 27, 361–370.
Newman, J. N. 1977. Marine Hydrodynamics. The MIT Press. Noblesse, F., He, J., Zhu, Y., Hong, L., Zhang, C., Zhu, R.,
and Yang, C. 2014. Why can ship wakes appear narrower than Kelvin’s angle? Eur. J. Mech. B/Fluids, 46, 164–171.
Parnell, K. E. and Kofoed-Hansen, H. 2001. Wakes from large high-speed ferries in confined coastal waters: management approaches with examples from New Zealand and Denmark. Coast. Manage., 29, 217–237.

A. Rodin et al.: Ship-induced Riemann waves in the Venice Lagoon 35
Parnell, K. E., McDonald, S. C., and Burke, A. E. 2007. Shoreline effects of vessel wakes, Marlborough Sounds, New Zealand. J. Coast. Res., SI 50, 502–506.
Parnell, K. E., Soomere, T., Zaggia, L., Rodin, A., Loren-zetti, G., Rapaglia, J., and Scarpa, G. M. 2015. Ship-induced solitary Riemann waves of depression in Venice Lagoon. Phys. Lett. A, 379(6), 555–559.
Pelinovsky, E. N. and Rodin, A. A. 2012. Transformation of a strongly nonlinear wave in a shallow-water basin. Izv. Atmos. Ocean. Phys., 48, 343–349.
Peregrine, D. H. 1966. Calculations of the development of an undular bore. J. Fluid Mech., 25, 321–330.
Peterson, P., Soomere, T., Engelbrecht, J., and van Groe-sen, E. 2003. Soliton interaction as a possible model for extreme waves in shallow water. Nonlinear Proc. Geoph., 10, 503–510.
Rabaud, M. and Moisy, F. 2013. Ship wakes: Kelvin or Mach angle? Phys. Rev. Lett., 110, Art. No. 214503.
Rapaglia, J., Zaggia, L., Ricklefs, K., Gelinas, M., and Boku-niewicz, H. 2011. Characteristics of ships’ depression waves and associated sediment resuspension in Venice Lagoon, Italy. J. Mar. Syst., 85, 45–56.
Ravens, T. M. and Thomas, R. C. 2008. Ship wave-induced sedimentation of a tidal creek in Galveston Bay. J. Waterw. Port Coast. Ocean Eng., 134, 21–29.
Rudenko, O. and Soluyan, S. 1977. Theoretical Background of Nonlinear Acoustics. Plenum, New York, 1977.
Sarretta, A., Pillon, S., Molinaroli, E., Guerzoni, S., and Fontolan, G. 2010. Sediment budget in the Lagoon of Venice, Italy. Cont. Shelf Res., 30, 934–949.
Sheremet, A., Gravois, U., and Tian, M. 2013. Boat-wake statistics at Jensen Beach, Florida. J. Waterw. Port Coast. Ocean Eng., 139, 286–294.
Sommerfeld, A. 1949. Partial Differential Equations in Physics. Elsevier.
Soomere, T. 2005. Fast ferry traffic as a qualitatively new forcing factor of environmental processes in non-tidal
sea areas: a case study in Tallinn Bay, Baltic Sea. Environ. Fluid Mech., 5, 293–323.
Soomere, T. 2007. Nonlinear components of ship wake waves. Appl. Mech. Rev., 60, 120–138.
Soomere, T., Parnell, K. E., and Didenkulova, I. 2011. Water transport in wake waves from high-speed vessels. J. Mar. Syst., 88, 74–81.
Sorensen, R. M. 1973. Ship-generated waves. Adv. Hydrosci., 9, 49–83.
Stumbo, S., Fox, K., Dvorak, F., and Elliot, L. 1999. The prediction, measurement, and analysis of wake wash from marine vessels. Mar. Technol., 36, 248–260.
Torsvik, T. and Soomere, T. 2008. Simulation of patterns of wakes from high-speed ferries in Tallinn Bay. Estonian J. Eng., 14, 232–254.
Torsvik, T., Didenkulova, I., Soomere, T., and Parnell, K. E. 2009a. Variability in spatial patterns of long nonlinear waves from fast ferries in Tallinn Bay. Nonlinear Proc. Geoph., 16, 351–363.
Torsvik, T., Pedersen, G., and Dysthe, K. 2009b. Waves generated by a pressure disturbance moving in a channel with a variable cross-sectional topography. J. Waterw. Port Coast. Ocean Eng., 135, 120–123.
Torsvik, T., Soomere, T., Didenkulova, I., and Sheremet, A. 2015. Identification of ship wake structures by a time-frequency method. J. Fluid Mech., 765, 229–251.
Varyani, K. 2006. Full scale study of the wash of high speed craft. Ocean Eng., 33, 705–722.
Wehausen, J. V. 1973. The wave resistance of ships. Adv. Appl. Mech., 13, 93–245.
Whitham, G. B. 1974. Linear and Nonlinear Waves. Wiley, New York.
Zahibo, N., Didenkulova, I., Kurkin, A., and Pelinovsky, E. 2008. Steepness and spectrum of nonlinear deformed shallow water wave. Ocean Eng., 35, 47–52.
Laevade tekitatud sügavate Riemanni üksiklainete levimine Veneetsia laguunis
Artem Rodin, Tarmo Soomere, Kevin E. Parnell ja Luca Zaggia Veneetsia laguuni läbivas Malamocco-Marghera kanalis liikuvate laevade tekitatud ja kanali lähistel mõõdetud sügavaid ning pikka aega terviklike struktuuridena püsivaid üksiklaineid interpreteeritakse tugevalt mittelineaarsete madala vee võrrandite erilahendite, nn Riemanni (ehk lihtsate) lainetena. Nende liikuvate lohkude peamised omadu-sed kanali lähistel paiknevates mõõtepunktides on rekonstrueeritud tarkvaraga CLAWPACK. Lainelohkude edasist kulgemist ja transformeerumist laguuni kaugemates osades analüüsitakse mõõdetud lohkude omadustega sobivate idealiseeritud alghäirituste numbrilise prognoosi teel. On näidatud, et ligikaudu 2 m sügavuses vees võivad laevade poolt kanalis tekitatud arvestatava sügavusega (> 0,3 m) häiritused levida vähemalt 1 km kaugusele. Laguuni madalas vees levimisel muutub lainelohkude esinõlv järjest laugemaks, kuid taganõlv kujuneb kiiresti väga järsuks boori-taoliseks veevalliks. Algselt erineva sügavusega lainelohkude amplituud ühtlustub aegamisi ja kanalist eemal sõltub boori kõrgus peamiselt läbitud vahemaast. Analüüsi tulemustest järeldub, et isegi suhteliselt tagasihoidliku kiirusega sõitvate ja mitte eriti suurte laevade tekitatud lainelohud võivad levida negatiivseid üksiklaineid meenutavate järsu taganõlvaga kompaktsete häiritustena praktiliselt üle kogu laguuni. Selline võimalus suurendab märgatavalt laeva-lainete keskkonnamõju ruumilist ulatust kohtades, kus laevaliiklus toimub madalaveelistesse veekogudesse süvenda-tud kitsastes kanalites.