numerical simulation of quasi-static compression …ijcte.org/papers/876-f008.pdf · ·...
TRANSCRIPT

Abstract—Geometrical changes can improve stiffness
substantially. The project S3 – Safety Slim Shoe presents the
potential to reduce the weight in safety toe cap components
combining a new geometric redesign deeply associated to local
stiffeners to realize the full potential of AHSS – Advanced High
Strength Steels. The investigation aimed to examine the
potential energy absorption capacity for a substantial thickness
reduction of slim toe cap models. In this paper the normative
quasi-static compression test in the context of the experimental
validation of the two last and approved prototype models were
focused. A non-linear FEA - Finite Element Analysis of the
elasto-plastic deformation mode was performed, and several
numerical parameters such as: hardening effects of
extrapolated True-Stress-Strain material curves and simulation
convergence conditions were carried out. Experimental results
of the toe cap deformation behavior confront a weight saving
range of over 40%, compared with the original steel toe cap.
Index Terms—AHSS, FEA, local stiffening, toe cap.
I. INTRODUCTION
The safety footwear, in the context of the global evolution
of footwear, has adopted creative and different orientations.
Particularly, as an active element in the prevention of
accidents fitted in PPE - Personal Protective Equipment, it is
appropriate that its optimization solutions amplify the market
targets, mainly combining ergonomic aspects, biological and
mechanical features since its conception. The toe cap is the
main component for its weight contribution, approx. 35% of
total weight for each safety footwear model, and due
normative context demands with high deformation resistance
and impact loading [1]. Currently the toe cap protection takes
a subdivided position on design selection and materials, with
a clear definition of two distinctive conception trends:
metallic and non-metallic models. If on one hand the metallic
models, especially high carbon steels with Heat Treatment
processes, emphasize the security concept by the implicit
mechanical strength performance, on the other hand, the
weight of these solutions is a disadvantage compared to the
metal-free solutions, and relegates the first one for outdated
and heavier footwear concept. The non-metallic solutions
with higher trend effects in the global market call on low
density materials such as: reinforced Polyester composites
with glass fiber, HDPE - High Strength Polyethylene, and
several advanced developments in the optimization of energy
Manuscript received September 25, 2013; revised January 2, 2014. The authors are with the Centre for Mechanical and Materials
Technologies – CT2M, Department of Mechanical Engineering, University
of Minho, 4800 – 058, Guimarães, Portugal (e-mail: {sergio.costa, jpmas, peixinho}@dem.uminho.pt).
absorption properties [2]-[9]. These preceding solutions are
currently lighter than referenced steel toe caps, achieving
approx. 40% of weight decrease [10]-[13]. Despite of these
composite and hybrid material solutions, its main
disadvantage is still committed to the mechanical strength
performance, when compared to the steel toe caps, requiring
a larger volume concept (to counterpoise higher rates of
deformation) and in several ways that affects the conception
of the main integrant parts. Both distinguished models and
the ultimate S3 prototype are shown in Fig. 1.
Fig. 1. Toe cap models with equivalent size: original steel toe cap, composite
toe cap and S3 Final model prototype.
The research Project S3 – Safety Slim Shoe aims to
complement the properties of the two referenced solutions,
promoting the industrial development of a brand new
ultimate toe cap solution. A substantial reduction of weight
due the thickness optimization, and lower volume rates
compared with the polymeric solutions are goals for the
framework.
In this paper, the contribution of the parameters under
study for the energy absorption optimization was focused on
the elasto-plastic behavior to quasi-static compression tests.
In this context, the current progress of the project S3 brought
here the two latest and approved toe cap prototype models,
the S3 Stage II model and the Final model (with specific
corrections for the complementary dynamic normative test),
with thickness combinations of 1.2 and 1.1mm. This study
presents a FEA to compare among the performance achieved
with these models and the original reference with 1.9mm
thickness, concerning static stiffness values duly calculated
in plastic domain. The opportunity to evaluate some critical
parameters related to the numerical simulation of a particular
case study with complex geometric design was also covered.
Experimental results were briefly attempt.
II. QUASI-STATIC COMPRESSION TEST
The European Standard requires the high performance
level of the toe cap components before being placed into the
footwear product in the normative context of EN 12568:2010
[1]. Fig. 2a) represents the normative test used in this study
with the schematic configurations and the relative position of
the test specimen. The deformation mode of a steel alloy,
Numerical Simulation of Quasi-Static Compression
Behavior of the Toe Cap Component for Safety Footwear
Sérgio L. Costa, João P. Mendonça, and Nuno Peixinho
International Journal of Computer Theory and Engineering, Vol. 6, No. 4, August 2014
285DOI: 10.7763/IJCTE.2014.V6.876
resulting from the normative quasi-static compression test,
reveals a standard curve shown in Fig. 2b).
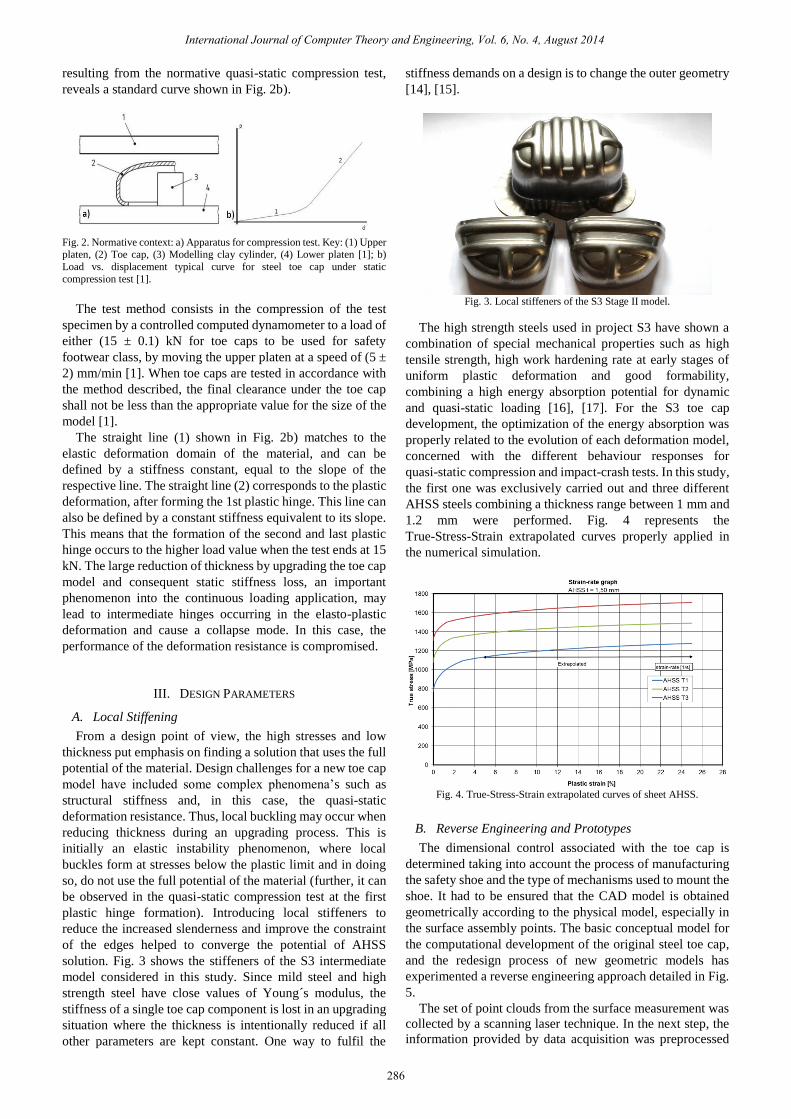
Fig. 2. Normative context: a) Apparatus for compression test. Key: (1) Upper platen, (2) Toe cap, (3) Modelling clay cylinder, (4) Lower platen [1]; b)
Load vs. displacement typical curve for steel toe cap under static
compression test [1].
The test method consists in the compression of the test
specimen by a controlled computed dynamometer to a load of
either (15 ± 0.1) kN for toe caps to be used for safety
footwear class, by moving the upper platen at a speed of (5 ±
2) mm/min [1]. When toe caps are tested in accordance with
the method described, the final clearance under the toe cap
shall not be less than the appropriate value for the size of the
model [1].
The straight line (1) shown in Fig. 2b) matches to the
elastic deformation domain of the material, and can be
defined by a stiffness constant, equal to the slope of the
respective line. The straight line (2) corresponds to the plastic
deformation, after forming the 1st plastic hinge. This line can
also be defined by a constant stiffness equivalent to its slope.
This means that the formation of the second and last plastic
hinge occurs to the higher load value when the test ends at 15
kN. The large reduction of thickness by upgrading the toe cap
model and consequent static stiffness loss, an important
phenomenon into the continuous loading application, may
lead to intermediate hinges occurring in the elasto-plastic
deformation and cause a collapse mode. In this case, the
performance of the deformation resistance is compromised.
III. DESIGN PARAMETERS
A. Local Stiffening
From a design point of view, the high stresses and low
thickness put emphasis on finding a solution that uses the full
potential of the material. Design challenges for a new toe cap
model have included some complex phenomena’s such as
structural stiffness and, in this case, the quasi-static
deformation resistance. Thus, local buckling may occur when
reducing thickness during an upgrading process. This is
initially an elastic instability phenomenon, where local
buckles form at stresses below the plastic limit and in doing
so, do not use the full potential of the material (further, it can
be observed in the quasi-static compression test at the first
plastic hinge formation). Introducing local stiffeners to
reduce the increased slenderness and improve the constraint
of the edges helped to converge the potential of AHSS
solution. Fig. 3 shows the stiffeners of the S3 intermediate
model considered in this study. Since mild steel and high
strength steel have close values of Young s modulus, the
stiffness of a single toe cap component is lost in an upgrading
situation where the thickness is intentionally reduced if all
other parameters are kept constant. One way to fulfil the
stiffness demands on a design is to change the outer geometry
[14], [15].
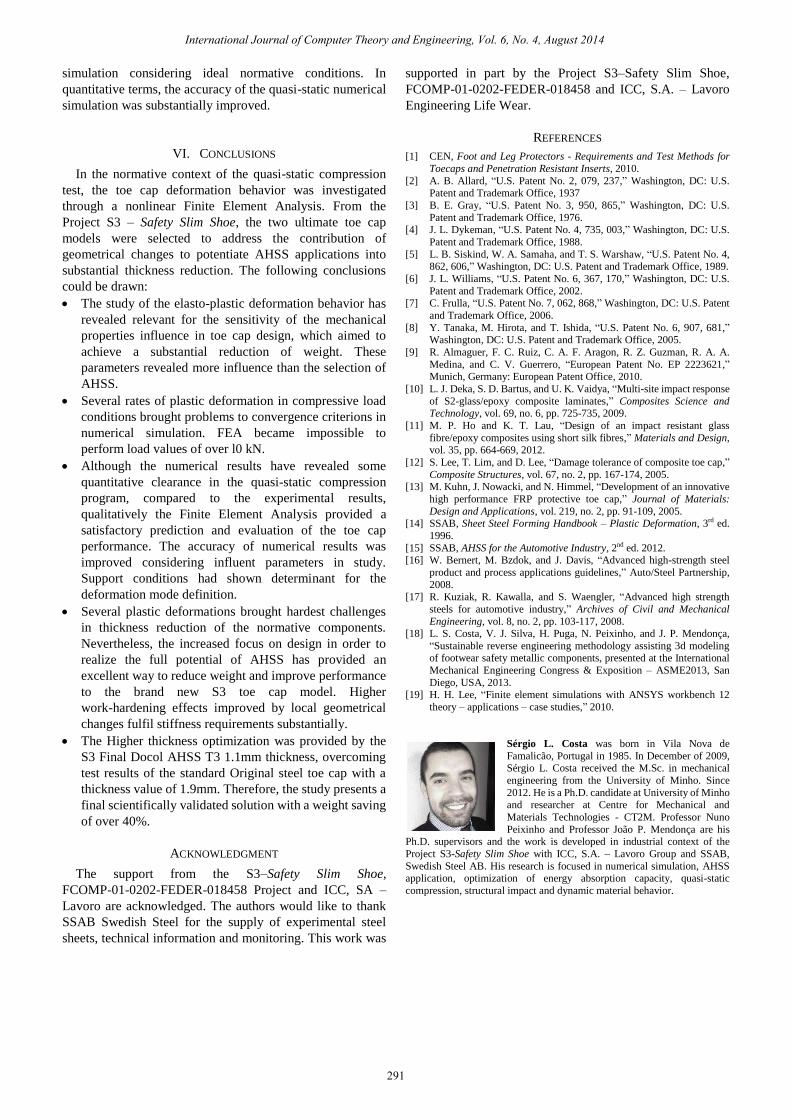
Fig. 3. Local stiffeners of the S3 Stage II model.
The high strength steels used in project S3 have shown a
combination of special mechanical properties such as high
tensile strength, high work hardening rate at early stages of
uniform plastic deformation and good formability,
combining a high energy absorption potential for dynamic
and quasi-static loading [16], [17]. For the S3 toe cap
development, the optimization of the energy absorption was
properly related to the evolution of each deformation model,
concerned with the different behaviour responses for
quasi-static compression and impact-crash tests. In this study,
the first one was exclusively carried out and three different
AHSS steels combining a thickness range between 1 mm and
1.2 mm were performed. Fig. 4 represents the
True-Stress-Strain extrapolated curves properly applied in
the numerical simulation.
Fig. 4. True-Stress-Strain extrapolated curves of sheet AHSS.
B. Reverse Engineering and Prototypes
The dimensional control associated with the toe cap is
determined taking into account the process of manufacturing
the safety shoe and the type of mechanisms used to mount the
shoe. It had to be ensured that the CAD model is obtained
geometrically according to the physical model, especially in
the surface assembly points. The basic conceptual model for
the computational development of the original steel toe cap,
and the redesign process of new geometric models has
experimented a reverse engineering approach detailed in Fig.
5.
The set of point clouds from the surface measurement was
collected by a scanning laser technique. In the next step, the
information provided by data acquisition was preprocessed
International Journal of Computer Theory and Engineering, Vol. 6, No. 4, August 2014
286

with an auxiliary advanced algorithm in Matlab® to improve
native geometrical entities for the basis surface construction.
Then, the optimization has passed through the re-design
process with the development of several geometrical changes.
Local stiffeners and other features were implemented into
powerful surface modeling tools in CATIA® [18]. Fig. 6
shows the original steel toe cap and the S3 Final model
prototype taken in this study.
Fig. 5. Reverse engineering methodology for Project S3 [18].
Fig. 6. Toe cap models: a) original steel toe cap and b) S3 Final prototype.
IV. NUMERICAL SIMULATION
The FEA - Finite Element Analysis of toe cap models on
non-linear study made for static load conditions was
performed with an implicit FE code, ANSYS (Workbench).
Static compression tests were simulated for each respective
combination of study parameters: thickness, material and
geometric model. Fig. 7 shows the finite element
environment with the upper platen of the load cell test in
accordance with the normative method previously described.
The boundary conditions were defined with axial loading
application on the upper platen, and the fixed support in the
tab region was reproduced. An average load value of 4kN to
cover the elastic domain behavior of the toe cap models
response was applied. The force application body was
considered rigid and without analysis settings in order to
transfer the entire energy recording to the toe cap component.
Remote displacements of the upper platen and other
dependent surfaces were added with the purpose of
constraining the load body, in rotation and other directional
components, to promote a guided displacement evolution.
The level of plastic deformation had increased following the
first plastic hinge formation and brought some simulation
challenges. Higher deformation rates leads to force
convergence errors in the increment model of the
deformation analysis and consequently the interruption of the
numerical progress [19].
Fig. 7. FEM of the quasi-static analysis for the S3 Final model. ANSYS ®.
A prior attention target in the numerical simulation was the
body’s connection with the contact part, between the virtual
toe cap model and the pressure plate above. The area of
contact, ideally converged to a contact point border between
the bodies according to the normative test method, brought
here some simulation improvement needs. In this context,
small contact extensions were attempt and the friction
coefficient was also an influent parameter. For a range value
between 0.32 and 0.74 the evaluation was 0.54 [19]. The
mesh element generation and the type of contact were applied
differentially and have been under convergence studies.
Nonlinear solution is sensitive to mesh by the number of
elements and the respective method (shape of elements).
Mesh quality has shown not only a matter of accuracy and
runtime for the solution but also a matter of success or failure.
In general, hexahedra are more efficient than tetrahedra
elements [19]. In this case, simulation models had considered
hexahedra as many as possible, by the geometric complexity,
performing the Hex-Dominant method. Fig. 8 shows the
comparison of the mesh parameters. As expected, the
Higher-Order Hexahedra elements (element midside nodes
kept) performed better results for a fine mesh resulting on
higher values of directional deformation. Thus, this method
and an element size control stabilized between 2 and 2.3 mm
were selected to the main bodies (56.149 nodes).
Nevertheless, the inevitable progress of the complex plastic
deformation under harder and continuous loading conditions
with micro cracks initiation and fracture phenomenon
promoted at the end of the material behavior has been
succeed up to 10 kN. Although the interruption of the implicit
numerical simulation ocurred, it was important to perform the
evaluative static deformation response to confront different
combinations of geometric models and AHSS materials
International Journal of Computer Theory and Engineering, Vol. 6, No. 4, August 2014
287

converging on the best design changes. The plastic hinges
associated to the static stiffness and deformation models were
rated.
Fig. 8. Mesh convergence analysis for the S3 Stage II model performance.
Fig. 9. Stress distributions – elastic deformation of AHSS T2 1.2mm thick models from FEA for 2500 N: a) original steel toe cap, c) S3 Stage II and e)
S3 Final. Stress distributions – plastic deformation for 10kN: b) original steel
toe cap, d) S3 Stage II and f) S3 Final. ANSYS® Environment.
The numerical simulation program was applied to the new
geometric models with the three abovementioned AHSS and
conjugating in thicknesses between 1.0 mm and 1.2 mm.
Isotropic elasticity and multi-linear isotropic hardening
parameters were defined. Potential solution models were
compared with the original steel toe cap model. Fig. 9 shows
representative results of the quasi-static FEA analysis for the
new S3 models with the combination of 1.2 mm thickness
and AHSS T2 material, and the original steel toe cap model
of 1.9 mm thickness for the C65 Heat Treated alloy.
Compressive loading conditions of 10 kN were performed for
the S3 Stage II, S3 Final and the original steel toe cap model.
Stress concentrations occurred in the contact region with the
upper platen point inducing higher force moments on the top
toe cap surface, which affected much the overall deflection
and damage of toe cap. For these load values it can be
observed a slightly different mode of deformation for the
proposed models. The S3 Stage II and the Final geometries
provided more transversal deformation characteristics
instead of the original steel toe cap that promoted a larger
deflection. The results of the static deformation behavior are
plotted in Fig. 10a to compare performances of the S3 Stage
II with the original model, and the comparison between S3
models in Fig 10b).
Table I brings together the first plastic hinge, where the
plastic deformation begun after springback effects that is
much associated to the elastic deformation field, and the last
plastic hinge that the FEA analysis had performed with the
reaction force and the resulting displacement values for each
model. The equivalent stiffness constants of the plastic
deformation behavior were calculated for these points.
Consequently, the performance of the energy absorption was
analyzed.
The numerical simulation was not completed up to 15 kN
as demanded by the normative and experimental context for
any toe cap model, because models required to higher strain
rates have revealed earlier problems associated with the
interruption of the FEA as explained above.
Fig. 10. Numerical results of quasi-static compression tests: a) comparison of S3 Stage II models and the original steel toe cap, b) comparison between
the two S3 models and the original steel toe cap.
From the global numerical results it was found that the S3
Stage II model performed the higher capacity for energy
absorption in the plastic deformation range, reflecting to the
higher value of stiffness constant (Table I). The effect of the
structural shoulder on the toe cap side walls, due to the
increased extension of the lateral ribs, contributes to
deformation mode benefits. Increasing strain rate effects,
International Journal of Computer Theory and Engineering, Vol. 6, No. 4, August 2014
288

with thickness reduction to 1mm and the first AHSS grade,
has increased problems related to the phenomena of stiffness
loss and the breaking of static curves was occurred.
Numerical results for the plastic behavior confirmed that the
parameters under study have relevant and different
contribution. Geometric and thickness factors were most
critical in the performance of energy absorption than the
selection of AHSS (shown in Fig. 10b), which means that
design changes improve stiffness substantially as
aforementioned, and that has been fundamental to potentiate
the AHSS contribution on weight savings. The combined S3
Stage II AHSS T2 1.2mm model achieved the better
performance due to the formation of the last plastic hinge
with the smaller displacement value and, consequently, the
higher line slope and stiffness value.
In comparison with the S3 Final model, with the same
AHSS and thickness values, it was found a slightly increase
of the plastic stiffness constant. It is pertinent at this point to
note that the S3 Final model is a close and corrective
evolution to the previous S3 Stage II model in the context of
another complement test, with a different demanding
behavioral mode. Thus, the specific geometric features of the
S3 Final surface, more spherical, had not converged in the
present test as a top priority concern. Nonetheless, the S3
Final model had announced the higher value for the elastic
stiffness, as shown in Table I, and has revealed a lower
sensitivity to the AHSS selection and thickness decrease.
TABLE I: NUMERICAL RESULTS OF QUASI-STATIC TESTS
Toe cap model
1ª Plastic hinge Last plastic hinge Stiffness c.
(N/mm)
Force
reaction
(N)
displ.
(mm)
Force
reaction
(N)
displ.
(mm) Elastic Plastic
S3 Stage II_AHSS T1_1mm 1594.2 1.61 5486.1 3.30 990 2303
S3 Stage II_AHSS T2_1mm 1913.5 1.76 8981.6 4.14 1087 2970
S3 Stage II_AHSS T3_1mm 2073.3 1.82 9981.6 4.17 1139 3365
S3 Stage II_AHSS T1_1.2mm 2234.2 1.57 9980.6 4.51 1423 2635
S3 Stage II_AHSS T2_1.2mm 2713.6 1.73 9984.7 3.50 1569 4108
S3 Final_AHSS T2_1.1mm 3999.9 2.31 9999.8 3.96 1732 3636
S3 Final_AHSS T3_1.1mm 3999.8 2.19 9999.9 3.82 1826 3681
S3 Final_AHSS T2_1.2mm 4788.9 2.36 9982.1 3.70 2029 3876
Original 1.9mm 2551.5 2.47 9982.6 4.73 1033 3288
In this comparison between the conceptual S3 models, for
the same AHSS and thickness, the S3 Stage II shows a
stiffness increase of 3876 to 4108 (N/mm), in order of 1.06xs
in plastic behavior. On the other hand, confronting these
close values with the original toe cap model (1,25x lower
even with 1.9mm thickness) proves the optimization of the
energy absorption and the design improvement of the
ultimate S3 models. Thus, numerical results accounted up
10kN show that S3 Stage II and Final model for any material,
thickness range and both level of material deformation have
performed better results than the original 1.9mm model.
The deformation curve of the original model presented a
differential curvature characterized by a hardest
identification of the formation of the first plastic hinge.
Herewith the transition between the elasto-plastic domains
revealed more linear.
V. EXPERIMENTAL TESTS
A. Prototype Results
The Quasi-static compression test in the normative
experimental context was performed for the previous toe cap
prototypes.
The experimental results are plotted in Fig. 11, and
experimental stiffness constant values are presented in Table
II. The S3 Stage II model has confirmed the predictions of the
numerical simulation results, as the geometric model with
higher energy absorption in the plastic behaviour. S3 Stage II
AHSS T2 with 1.2mm thickness prototype performed better
experimental results leading to the last plastic hinge with the
smaller displacement value. Experimental tests also validated
the assumption of the different effect of study parameters.
Geometry and thickness reduction factors had more
sensitivity in the static compression test than the selection of
the AHSS material type. Several plastic deformation effects
after the loading condition of 10kN to the first AHSS and
thickness reduction, has perceived for the new geometric
prototypes with failure modes and the quasi-static test curve
of the original model has shown different curvature
resistance characteristics.
Fig. 11. Experimental results of quasi-static compression tests.
TABLE II: EXPERIMENTAL RESULTS OF QUASI-STATIC TESTS
Toe cap model
1ª Plastic hinge Plastic hinge (equal
for numerical hinge)
Stiffness const.
(N/mm)
Force
reaction
(N)
displ.
(mm)
Force
reaction
(N)
displ.
(mm) Elastic Plastic
S3 Stage II_AHSS T1_1mm 1201.9 2.60 5501.9 4.64 462 2108
S3 Stage II_AHSS T2_1mm 1101.3 2.11 9011.8 5.36 522 2434
S3 Stage II_AHSS T3_1mm 1225.8 2.10 10002.9 5.92 584 2298
S3 Stage II_AHSS T1_1.2mm 1810.0 2.39 10007.8 5.21 757 2907
S3 Stage II_AHSS T2_1.2mm 2351.1 2.46 9993.4 4.74 956 3352
S3 Final_AHSS T2_1.1mm 2901.8 2.86 10003.0 5.84 1015 2383
S3 Final_AHSS T3_1.1mm 3011.9 2.80 10007.8 5.44 1076 2650
S3 Final_AHSS T2_1.2mm 3011.9 2.66 10007.8 5.08 1132 2891
Original 1.9mm 1900.9 3.30 10007.8 6.57 576 2479
Hence, the influence of the redrawn geometry into energy
absorption capacity has been proven, with stronger
deformation resistance in early stages but also the challenge
of balancing the stiffness loss with the substantial thickness
reduction.
The S3 Stage II and S3 Final AHSS T2 1.2 mm prototypes
confirmed similar performance values as can be seen in Fig.
11. The analysis of the respective curves from the quasi-static
test to the thickness value of 1.2 mm shows a high resistance
to static deformation and the S3 models have outperformed
the original steel toe cap 1.9 mm model. The stiffness values
of the Table III materialize the test results. The S3 Final
International Journal of Computer Theory and Engineering, Vol. 6, No. 4, August 2014
289

model reaches the higher stiffness constant of the elastic
deformation and an increase of roughly 50% compared to the
original model. In this context, the energy absorption
capacity revealed to the sringback effect retards the
formation of the first plastic hinge and turns out to impair the
calculation of the model performance in the plastic domain,
compared with the S3 Stage II model. The maximum
optimization considering better results than the original steel
toe cap model with 1.9mm of thickness value was performed
by the S3 Final AHSS T3 1.1 mm prototype.
B. Accuracy Analysis
In qualitative terms, the comparison of numerical and
experimental results is significantly improved. Plastic hinges
and the calculated values for stiffness constants of
experimental test results are shown above in Table II and
were equivalent for the same limit load values achieved in
numerical simulation. Picking up the previous numerical
example, the experimental results announce for S3 stage II
and S3 Final geometric model assessment for the same AHSS
material and thickness of 1.2 mm, the stiffness constant
values of 3352 and 2891 (N/mm), respectively and equivalent
to a ratio of approx. 1.15xs order (1.06xs for numerical
results).It was found for the same S3 Stage II AHSS T2
model with a thickness evaluation between 1 and 1.2mm, the
experimental stiffness constant values of 2434 and 3352
N/mm, respectively and equivalent to an increase of approx.
1.37xs order (2970 and 4108 (N/mm), equivalent to 1.38xs
for numerical results). Hence, the accuracy of the numerical
thickness evaluation of the S3 Stage II AHSS T2 model was
approx. 98% and the accuracy of the numerical study of the
geometric model evolution with the two last S3 models had
reached approx. 92%.
Quantitatively, the difference between experimental and
numerical results is exemplified in Fig. 12 for two toe cap
models: the original steel toe cap model and the S3 Stage II
AHSS T2 1.2mm model. Related causes such as: stiffness
loss, thinning effects associated with forming processes for
advanced steels, differential thickness values of toe cap
components, and issues associated with the numerical
simulation, such as the definition of boundary conditions,
convergence criterion parameters of the FE code, among
others, are justified. The influence on the accuracy of
numerical simulation of the prototype thickness decrease,
considering a range of thinning effects of around 5 to 10%,
was exemplified and performed for the same S3 Stage II
1.2mm model, considering a fact-finding 1.1mm thickness
model (Fig. 12). The results have converged on the accuracy
of previous experimental values.
In this context, another hypothetical factor has been
studied. The clamping position set and the support system of
the test models have been reconsidered for the numerical
simulation of the impact test. The specific deformation mode
considering the deflection phenomenon of the toe cap side
walls from the test evolution, had led here in some cases, and
not so provided in normative conditions (although it did not
predict the thickness optimization carried out), to attachment
loss between the lower plate and the toe cap tab region. Slip
effects were commonly verified in this boundary condition. A
hybrid fixed support was further developed for the numerical
simulation model by an evolutionary condition between fixed
support, to initial time steps, and a final contact provided by a
dynamic friction coefficient starting from frictionless to 0.32
[19]. Fig. 13 compares the sliding behavior of the side walls
from the S3 final AHSS T2 1.2 mm model, substantially
changing the deformation mode, when considering the new
support and the normative boundary conditions previously
considered.
Fig. 12. Comparative analysis of the numerical and experimental tests (Exp.) for S3 Stage II AHSS T2 1.2 mm and the original steel toe cap 1.9 mm. A
numerical simulated of thickness loss for the first is attempted.
Fig. 13. FEA of the deformation behaviour using the S3 Final AHSS T2 1.2
mm model with different support approach.
Fig. 14. Comparative analysis of numerical results for both support
conditions with experimental test curve using S3 Stage II AHSS T2 1.2 mm.
The numerical results shown in Fig. 14 denounce a greater
convergence with experimental results.
The representative numerical curve for new support
conditions (represented by _sup. in Fig. 14) is way closer to
the experimental test curve (exp.) than the numerical
International Journal of Computer Theory and Engineering, Vol. 6, No. 4, August 2014
290
simulation considering ideal normative conditions. In
quantitative terms, the accuracy of the quasi-static numerical
simulation was substantially improved.
VI. CONCLUSIONS
In the normative context of the quasi-static compression
test, the toe cap deformation behavior was investigated
through a nonlinear Finite Element Analysis. From the
Project S3 – Safety Slim Shoe, the two ultimate toe cap
models were selected to address the contribution of
geometrical changes to potentiate AHSS applications into
substantial thickness reduction. The following conclusions
could be drawn:
The study of the elasto-plastic deformation behavior has
revealed relevant for the sensitivity of the mechanical
properties influence in toe cap design, which aimed to
achieve a substantial reduction of weight. These
parameters revealed more influence than the selection of
AHSS.
Several rates of plastic deformation in compressive load
conditions brought problems to convergence criterions in
numerical simulation. FEA became impossible to
perform load values of over l0 kN.
Although the numerical results have revealed some
quantitative clearance in the quasi-static compression
program, compared to the experimental results,
qualitatively the Finite Element Analysis provided a
satisfactory prediction and evaluation of the toe cap
performance. The accuracy of numerical results was
improved considering influent parameters in study.
Support conditions had shown determinant for the
deformation mode definition.
Several plastic deformations brought hardest challenges
in thickness reduction of the normative components.
Nevertheless, the increased focus on design in order to
realize the full potential of AHSS has provided an
excellent way to reduce weight and improve performance
to the brand new S3 toe cap model. Higher
work-hardening effects improved by local geometrical
changes fulfil stiffness requirements substantially.
The Higher thickness optimization was provided by the
S3 Final Docol AHSS T3 1.1mm thickness, overcoming
test results of the standard Original steel toe cap with a
thickness value of 1.9mm. Therefore, the study presents a
final scientifically validated solution with a weight saving
of over 40%.
ACKNOWLEDGMENT
The support from the S3–Safety Slim Shoe,
FCOMP-01-0202-FEDER-018458 Project and ICC, SA –
Lavoro are acknowledged. The authors would like to thank
SSAB Swedish Steel for the supply of experimental steel
sheets, technical information and monitoring. This work was
supported in part by the Project S3–Safety Slim Shoe,
FCOMP-01-0202-FEDER-018458 and ICC, S.A. – Lavoro
Engineering Life Wear.
REFERENCES
[1] CEN, Foot and Leg Protectors - Requirements and Test Methods for
Toecaps and Penetration Resistant Inserts, 2010.
[2] A. B. Allard, “U.S. Patent No. 2, 079, 237,” Washington, DC: U.S. Patent and Trademark Office, 1937
[3] B. E. Gray, “U.S. Patent No. 3, 950, 865,” Washington, DC: U.S.
Patent and Trademark Office, 1976. [4] J. L. Dykeman, “U.S. Patent No. 4, 735, 003,” Washington, DC: U.S.
Patent and Trademark Office, 1988.
[5] L. B. Siskind, W. A. Samaha, and T. S. Warshaw, “U.S. Patent No. 4, 862, 606,” Washington, DC: U.S. Patent and Trademark Office, 1989.
[6] J. L. Williams, “U.S. Patent No. 6, 367, 170,” Washington, DC: U.S.
Patent and Trademark Office, 2002. [7] C. Frulla, “U.S. Patent No. 7, 062, 868,” Washington, DC: U.S. Patent
and Trademark Office, 2006.
[8] Y. Tanaka, M. Hirota, and T. Ishida, “U.S. Patent No. 6, 907, 681,” Washington, DC: U.S. Patent and Trademark Office, 2005.
[9] R. Almaguer, F. C. Ruiz, C. A. F. Aragon, R. Z. Guzman, R. A. A.
Medina, and C. V. Guerrero, “European Patent No. EP 2223621,” Munich, Germany: European Patent Office, 2010.
[10] L. J. Deka, S. D. Bartus, and U. K. Vaidya, “Multi-site impact response
of S2-glass/epoxy composite laminates,” Composites Science and Technology, vol. 69, no. 6, pp. 725-735, 2009.
[11] M. P. Ho and K. T. Lau, “Design of an impact resistant glass
fibre/epoxy composites using short silk fibres,” Materials and Design, vol. 35, pp. 664-669, 2012.
[12] S. Lee, T. Lim, and D. Lee, “Damage tolerance of composite toe cap,”
Composite Structures, vol. 67, no. 2, pp. 167-174, 2005. [13] M. Kuhn, J. Nowacki, and N. Himmel, “Development of an innovative
high performance FRP protective toe cap,” Journal of Materials:
Design and Applications, vol. 219, no. 2, pp. 91-109, 2005. [14] SSAB, Sheet Steel Forming Handbook – Plastic Deformation, 3rd ed.
1996.
[15] SSAB, AHSS for the Automotive Industry, 2nd ed. 2012. [16] W. Bernert, M. Bzdok, and J. Davis, “Advanced high-strength steel
product and process applications guidelines,” Auto/Steel Partnership,
2008. [17] R. Kuziak, R. Kawalla, and S. Waengler, “Advanced high strength
steels for automotive industry,” Archives of Civil and Mechanical
Engineering, vol. 8, no. 2, pp. 103-117, 2008. [18] L. S. Costa, V. J. Silva, H. Puga, N. Peixinho, and J. P. Mendonça,
“Sustainable reverse engineering methodology assisting 3d modeling of footwear safety metallic components, presented at the International
Mechanical Engineering Congress & Exposition – ASME2013, San
Diego, USA, 2013. [19] H. H. Lee, “Finite element simulations with ANSYS workbench 12
theory – applications – case studies,” 2010.
Sérgio L. Costa was born in Vila Nova de
Famalicão, Portugal in 1985. In December of 2009, Sérgio L. Costa received the M.Sc. in mechanical
engineering from the University of Minho. Since
2012. He is a Ph.D. candidate at University of Minho and researcher at Centre for Mechanical and
Materials Technologies - CT2M. Professor Nuno
Peixinho and Professor João P. Mendonça are his Ph.D. supervisors and the work is developed in industrial context of the
Project S3-Safety Slim Shoe with ICC, S.A. – Lavoro Group and SSAB,
Swedish Steel AB. His research is focused in numerical simulation, AHSS application, optimization of energy absorption capacity, quasi-static
compression, structural impact and dynamic material behavior.
International Journal of Computer Theory and Engineering, Vol. 6, No. 4, August 2014
291