numerical simulation of bi-stable ventilated flows around
TRANSCRIPT
Numerical simulation of bi-stable ventilated flows around surface-piercinghydrofoils
Moran Charlou, Jeroen Wackers*LHEEA, Ecole Centrale de Nantes/CNRS UMR 6298, Nantes/France
1 Introduction
Ventilation is a physical phenomenon in which air is entrained in a low pressure region below the freesurface on a hydrofoil or a propeller. It is known to cause substantial drops of performance – lift for ahydrofoil or thrust for a propeller. Ventilation can be used to good advantage, like for drag reduction, butis most often unwanted.
On a surface-piercing lifting hydrofoil at high enough Froude numbers, two flow regimes exist:wetted when water completely covers both sides of the foil, and ventilated when a pocket of air covers amajor part of the suction side. A wetted flow usually provides the best lift, whereas ventilation raises thepressure on the suction side and thus lowers the lift. The flow is in general wetted for low angles of attackand ventilated at high angles. However there is a range of angles in between, where both flow regimesexist and are stable. In this bi-stable region, a perturbation can brutally change the flow regime fromwetted to ventilated and conversely. Harwood et al. (2014, 2016), in accordance with previous research,identified two conditions on the wetted flow which are required for the existence of a ventilated flow:
– A zone of low pressure, i.e. pressure lower than the atmospheric pressure, so a pressure gradientcan entrain air towards the suction side,
– A separated flow on the suction side, i.e. a recirculation bubble.
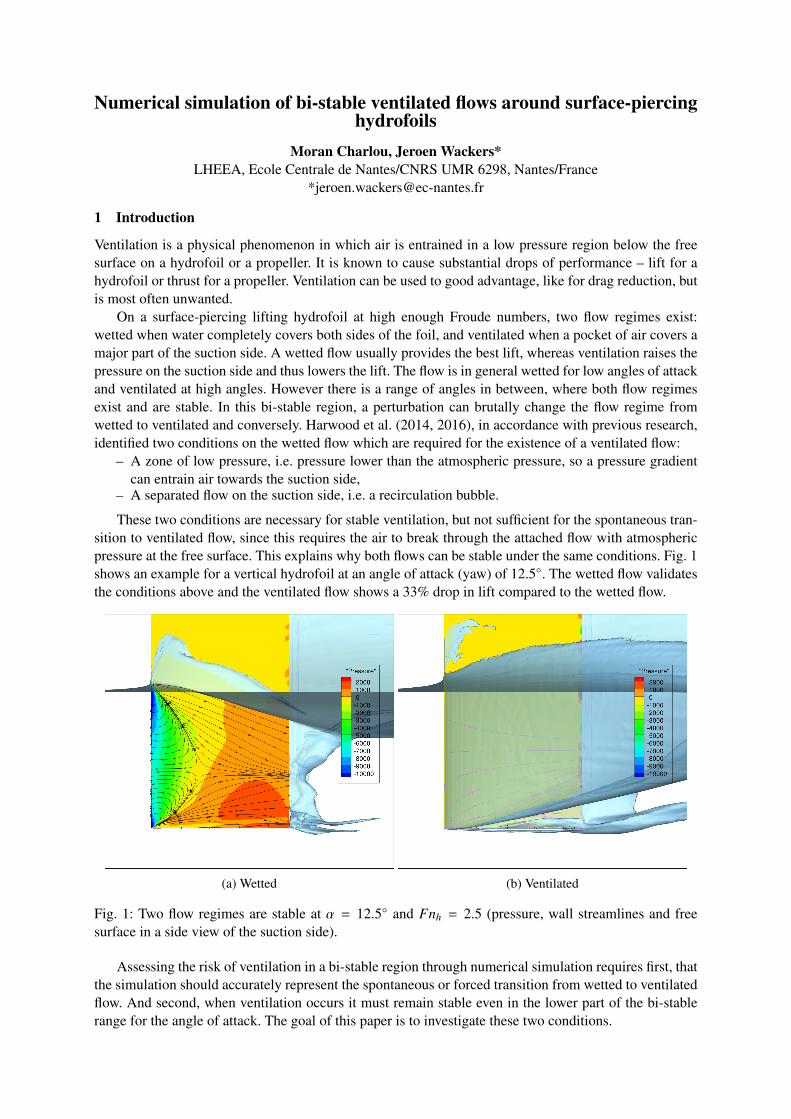
These two conditions are necessary for stable ventilation, but not sufficient for the spontaneous tran-sition to ventilated flow, since this requires the air to break through the attached flow with atmosphericpressure at the free surface. This explains why both flows can be stable under the same conditions. Fig. 1shows an example for a vertical hydrofoil at an angle of attack (yaw) of 12.5◦. The wetted flow validatesthe conditions above and the ventilated flow shows a 33% drop in lift compared to the wetted flow.
(a) Wetted (b) Ventilated
Fig. 1: Two flow regimes are stable at α = 12.5◦ and Fnh = 2.5 (pressure, wall streamlines and freesurface in a side view of the suction side).
Assessing the risk of ventilation in a bi-stable region through numerical simulation requires first, thatthe simulation should accurately represent the spontaneous or forced transition from wetted to ventilatedflow. And second, when ventilation occurs it must remain stable even in the lower part of the bi-stablerange for the angle of attack. The goal of this paper is to investigate these two conditions.

2 Test case
The test case is a vertical surface-piercing hydrofoil as studied in Harwood et al. (2014, 2016), and thepresent study varies the angle of attack α for a fixed immersion-based Froude number Fnh = 2.5. In theexperiments, for α between 2.5◦ and 15◦, wetted flow was established naturally but ventilated flow couldbe obtained through a perturbation by a blast of air at the leading edge. However the required intensityof such a perturbation is uncertain. The present study instead focuses on natural transition by increasingα in steps of 2.5◦ through the bi-stable region until spontaneous ventilation occurs, and then decreasingit until the flow re-attaches to the foil, thus moving along a hysteretic cycle (Fig. 2a). The experimentswere conducted in a towing tank at fixed α for each run, while the carriage was accelerated from zero tothe target Fnh for that run. If a hysteretic cycle occured, it was therefore along Fnh and not α.
αα
2α
1 bi-stable region
Ventilated
Attached
(a) Hysteretic cycle
0 5 10 15 20 25 30 (°)
-0.2
0
0.2
0.4
0.6
0.8
1
Lift
coef
ficie
nt
CFDFit on CFDExp.
AttachedVentilated
(b) Lift coefficient: CFD vs Exp. from Harwood et al. (2016)
Fig. 2: Schematic representation of the hysteretic cycle and variation of the lift coefficient
The foil is symmetrical, has a chord c = 0.279m with an ogival fore-body, a rectangular aft-body anda blunt trailing edge. The immersion depth is h = c. The computational domain is 6.7m wide with thefoil centered, 4.05m high with 3.05m water depth and 9m long with the foil at 3m from the front.
The RANS solver used in this study is ISIS-CFD, a two-fluid solver developed by Ecole Centrale deNantes/CNRS and part of NUMECA International’s simulation suite FINE™/Marine. The water surfaceis represented with a water–air mixture surface capturing model using compressive discretisations, seeQueutey and Visonneau (2007). Turbulence is solved with the k−ω S S T (Menter) model. Adaptive gridrefinement is used with a combined free-surface and pressure/velocity Hessian criterion, described inWackers et al. (2017). The Hessian threshold is set at 0.05m (≈ 0.18c), the target cell size normal to thefree surface is c/100 and the minimum cell size is c/500. The initial mesh is only refined around thefoil. The flow is solved using a 1st-order accurate time-marching algorithm with a time step of c/100U∞,during which the refinement procedure is called every 20 steps. The size of the refined meshes goes fromaround 4M cells for a ventilated case to 9M cells for a wetted case.
Two methods were applied to start the computations: (a) increasing the speed of the foil from zeroto reach the desired Fnh, with α fixed, and (b) changing α at fixed speed (and Fnh) from a previouscomputation. Method (a) was used to start computations from scratch, while method (b) was used tomove along the hysteretic cycle in α.
Fig. 2b shows the lateral forces (lift) obtained in the hysteretic cycle, compared with the experimentaldata. These confirm that both the wetted and the ventilated states are predicted correctly. The transitionsbetween the two flows are not indicated: these are discussed in the next sections.
3 Transition to a ventilated state
For the flow to transition from a wetted to a ventilated state, a path needs to open up between the surfaceand the recirculation bubble, through which air can flow. In the present case, the main air path runs downthe leading edge to the low pressure peak in the bubble (Fig. 3). However, in the wetted state (Fig. 1a)this path is blocked by the attached flow at ambient pressure along the free surface. To obtain ventilation,this surface seal must be breached.

(a) t ≈ 0.10s, Fnh ≈ 1.2 (b) t ≈ 0.17s, Fnh ≈ 1.9 (c) t ≈ 0.24s, Fnh ≈ 2.4 (d) t ≈ 0.37s, Fnh = 2.5
Fig. 3: Spontaneous ventilation inception at α = 21.5◦. The acceleration phase is 0.304s long.
In the experiments, spontaneous ventilation inception (above α = 15◦) is attributed to bubbles of airand turbulent vortex cores breaking the free surface at the leading edge. Such flows cannot be simulatedwith the present free-surface discretisation and RANS turbulence model, so the inception mechanism forthe simulations is the full separation of the flow at the top of the leading edge (Fig. 3).
The simulations show that apart from the flow model, ventilation inception depends strongly onthe path to the steady state. When increasing α at fixed Fnh = 2.5 (method (b)), spontaneous ventila-tion occurs at 27.5◦, when unsteady fluctuations of the wake start reaching the foil (Fig. 4). However,spontaneous ventilation occurs at angles as low as 12.5◦, as opposed to 15◦ in the experiments, when ac-celerating slowly from zero speed like in Fig. 3 (method (a)). The reason for the difference between thetwo methods is that at Fnh below 2.5, the wave behind the leading edge is shorter but steeper. This meansthat ventilation inception occurs more easily than at higher speeds. Thus, the inception takes place duringthe slow acceleration, after which the flow remains in the ventilated state until Fnh = 2.5 is reached.
(a) t ≈ 0.24s (b) t ≈ 0.37s (c) t ≈ 0.44s (d) t ≈ 1.45s
Fig. 4: Spontaneous ventilation inception when α increases from 25◦ to 27.5◦ at constant Fnh = 2.5. Therotation phase is 0.202s long.
Thus, since ventilation transition depends more on unsteady – either transient or turbulent – phe-nomena than on the final steady flow conditions, we conclude that there is little practical interest in theinvestigation of spontaneous ventilation inception. Nature is rife with perturbations of all types, so theactual ventilation would never appear under the same circumstances as in simulation. It is more relevantto numerically evaluate the risk of ventilation occuring than to simulate actual transitions.
To assess the risk of ventilation in a given configuration, we recommend to simulate a big disturbanceof the wetted flow, e.g. a sideways acceleration, sufficient to trigger at least a transient ventilated state.The stability of this ventilated flow after the disturbance has stopped determines if the configurationbelongs to a bi-stable region. The stability of the wetted flow – i.e. how difficult it is to trigger ventilation– gives an insight into the likeliness of ventilation occuring in practice.
4 Stability of the ventilated state
Contrary to the inception, it is essential to simulate correctly the stability of the ventilated state, i.e. if itspontaneously returns to a wetted state or not. Otherwise, a bi-stable state may be incorrectly consideredas free of ventilation risk. This requires the study of ventilation elimination.
In the experiments, elimination occurs when lowering Fnh at fixed α. In that case, the ventilationpocket gradually closes from below, with a re-entrant jet on the foil surface rising steeper and steeperuntil it flows back to the leading edge and closes the ventilated pocket. However when lowering α at fixedFnh during simulations, ventilation elimination occurs at around 8◦, as opposed to the 2.5◦ suggested byHarwood et al. (2016). With Fnh staying at 2.5, the re-entrant jet remains on the lower side of the foil.

Instead of the ventilation pocket closing from below, the crest of water at the top of the pocket slowly hitsthe suction side and collapses, closing the air pocket and cutting off the air inflow. Without the inflow, theflow of air into the wake can no longer be sustained. Some air remains for some time in the recirculationzone, but ends up being chased out, leading to a wetted state (Fig. 5).
(a) t ≈ 1.51s (b) t ≈ 1.61s (c) t ≈ 1.71s (d) t ≈ 2.18s
Fig. 5: Ventilation elimination at α = 7.5◦. α = 10◦ at t = 0, the rotation to 7.5◦ is done over 0.101s. Athin layer of air on the suction side is eliminated slowly because the speed is zero on the foil’s surface.
To fully understand how the water crest collapses and closes the air pocket, the pressure and velocityin the air pocket are considered (Fig. 6). The top of the water crest over the pocket breaks and creates abridge to the suction side of the foil. This zone of low water volume fraction prevents air from enteringthe pocket, further decreasing the naturally lower pressure in the air pocket, which in turn generates highvelocities towards the inside of the pocket, pulling the water crest towards the foil. This vicious cycleends up closing the air pocket from the top. Such a blocking effect might not occur if the breaking ofthe water crest was represented with drops of water instead of a diffuse low water fraction, making thisspecific issue inherent in the surface-capturing formulation used.
(a) Base parameters (b) Smaller time step,∆t ≈ 1.69e-4s
(c) Refined freesurface criterion
(d) Surface tensionσ = 0.07N/m−1
(e) Surface tensionσ = 0.7N/m−1
Fig. 6: Slice of the ventilated pocket at x = 0 (mid-chord) for α = 10◦ and different numerical parameters.The pressure gradient introduced by the diffusion of low water fraction is responsible for the collapse ofthe air pocket.
Several attempt have been carried out to solve this problem. Because the compressiveness of the vol-ume fraction scheme used in ISIS-CFD (Queutey and Visonneau (2007)) is sensitive to the local Courantnumber, the time step has been reduced. However as Fig. 6b shows, even though the local Courant num-ber is divided by 4, that does not change the diffusion of the water fraction at the crest. Increasing themesh refinement at the free surface in order to get a finer representation of the water-air interface reducesthe induced pressure gradient – at the cost of computational speed – but does not remove the low volumefraction bridge (Fig. 6c). Finally, a surface tension model, based on Brackbill et al. (1992) but with thesurface tension included in the pressure gradient, removed the bridge when using a surface tension 10times higher than in reality (Fig. 6e). However, this changes some other features of the flow and intro-
duces additional numerical problems (e.g. unstable forces created by non-physical pressures on the foil).Using the actual air-water surface tension σ = 0.07N.m−1 (Fig. 6d) yields similar results to refining thefree surface (Fig. 6c) in terms of the pressure gradient, while reducing the amount of water arriving onthe foil surface significantly.
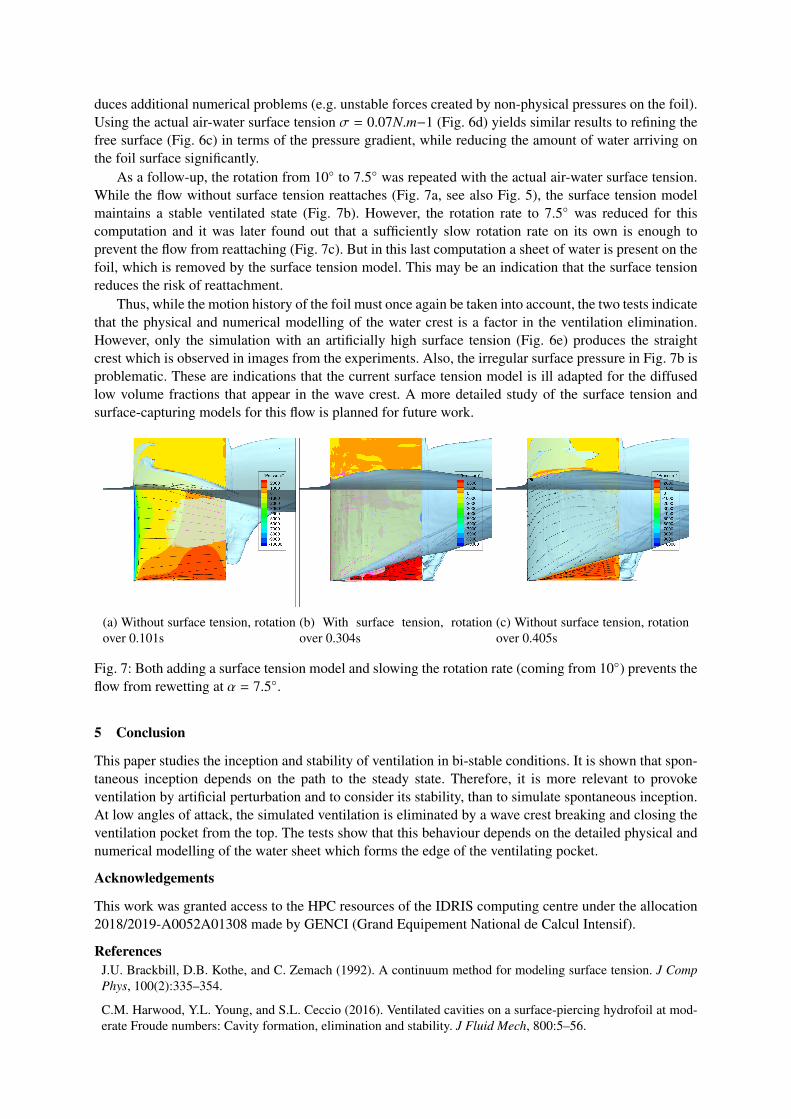
As a follow-up, the rotation from 10◦ to 7.5◦ was repeated with the actual air-water surface tension.While the flow without surface tension reattaches (Fig. 7a, see also Fig. 5), the surface tension modelmaintains a stable ventilated state (Fig. 7b). However, the rotation rate to 7.5◦ was reduced for thiscomputation and it was later found out that a sufficiently slow rotation rate on its own is enough toprevent the flow from reattaching (Fig. 7c). But in this last computation a sheet of water is present on thefoil, which is removed by the surface tension model. This may be an indication that the surface tensionreduces the risk of reattachment.
Thus, while the motion history of the foil must once again be taken into account, the two tests indicatethat the physical and numerical modelling of the water crest is a factor in the ventilation elimination.However, only the simulation with an artificially high surface tension (Fig. 6e) produces the straightcrest which is observed in images from the experiments. Also, the irregular surface pressure in Fig. 7b isproblematic. These are indications that the current surface tension model is ill adapted for the diffusedlow volume fractions that appear in the wave crest. A more detailed study of the surface tension andsurface-capturing models for this flow is planned for future work.
(a) Without surface tension, rotationover 0.101s
(b) With surface tension, rotationover 0.304s
(c) Without surface tension, rotationover 0.405s
Fig. 7: Both adding a surface tension model and slowing the rotation rate (coming from 10◦) prevents theflow from rewetting at α = 7.5◦.
5 Conclusion
This paper studies the inception and stability of ventilation in bi-stable conditions. It is shown that spon-taneous inception depends on the path to the steady state. Therefore, it is more relevant to provokeventilation by artificial perturbation and to consider its stability, than to simulate spontaneous inception.At low angles of attack, the simulated ventilation is eliminated by a wave crest breaking and closing theventilation pocket from the top. The tests show that this behaviour depends on the detailed physical andnumerical modelling of the water sheet which forms the edge of the ventilating pocket.
Acknowledgements
This work was granted access to the HPC resources of the IDRIS computing centre under the allocation2018/2019-A0052A01308 made by GENCI (Grand Equipement National de Calcul Intensif).
ReferencesJ.U. Brackbill, D.B. Kothe, and C. Zemach (1992). A continuum method for modeling surface tension. J CompPhys, 100(2):335–354.
C.M. Harwood, Y.L. Young, and S.L. Ceccio (2016). Ventilated cavities on a surface-piercing hydrofoil at mod-erate Froude numbers: Cavity formation, elimination and stability. J Fluid Mech, 800:5–56.

C.M. Harwood, K.A. Brucker, F.M. Montero, Y.L. Young, and S.L. Ceccio (2014). Experimental and numericalinvestigation of ventilation inception and washout mechanisms of a surface-piercing hydrofoil. Proceedings ofthe 30th Symposium on Naval Hydrodynamics, Hobart, Australia.
P. Queutey and M. Visonneau (2007). An interface capturing method for free-surface hydrodynamic flows. CompFluids, 36(9):1481–1510.
J. Wackers, G. Deng, E. Guilmineau, A. Leroyer, P. Queutey, M. Visonneau, A. Palmieri, and A. Liverani(2017). Can adaptive grid refinement produce grid-independent solutions for incompressible flows? J Comp Phys,334:364–380