numerical predictions of particle degradation in …nchristakis/christakis04_4.pdf · numerical...
TRANSCRIPT

www.elsevier.com/locate/powtec
Powder Technology 143–144 (2004) 321–330
Numerical predictions of particle degradation in industrial-scale
pneumatic conveyors
P. Chapellea, H. Abou-Chakrab, N. Christakisa, I. Bridlec, M.K. Patela,*, J. Baxterb,U. Tuzunb, M. Crossa
aCentre for Numerical Modelling and Process Analysis, School of Computing and Mathematical Sciences, University of Greenwich, Old Royal Naval College,
Park Row, Greenwich, London SE10 9LS, UKbChemical and Process Engineering, School of Engineering, University of Surrey, Guildford, Surrey GU2 7XH, UK
cThe Wolfson Centre for Bulk Solids Handling Technology, University of Greenwich, Wellington Street, Woolwich, London SE18 6PF, UK
Abstract
This paper presents an Eulerian-based numerical model of particle degradation in dilute-phase pneumatic conveying systems including
bends of different angles. The model shows reasonable agreement with detailed measurements from a pilot-sized pneumatic conveying
system and a much larger scale pneumatic conveyor. The potential of the model to predict degradation in a large-scale conveying system from
an industrial plant is demonstrated. The importance of the effect of the bend angle on the damage imparted to the particles is discussed.
D 2004 Elsevier B.V. All rights reserved.
Keywords: Numerical prediction; Pneumatic conveyor; Particle degradation
1. Introduction dimensions (e.g., Ref. [2]) or using a small-scale air blast rig
Pneumatic conveying of granular materials is applied in
many industrial situations because of its flexibility, simplic-
ity and environmental compatibility. However, attrition or
degradation of the particulate material being conveyed is
commonly observed, particularly in the dilute-phase flow
mode. This may affect the product quality and cause severe
difficulties in subsequent material handling operations.
Degradation during dilute-phase pneumatic conveying
results mainly from high-velocity impacts of the particles
with the pipe walls [1].
Studies of degradation in pneumatic conveying systems
in the literature have been largely based on an empirical
approach. For an existing system, comparing the particle
size distribution of a material at the inlet and the outlet of
the conveyor is the only way to assess degradation. Unfor-
tunately, for most of the industrial systems it is impossible to
access the inlet and the outlet. The methods used to predict
degradation in pneumatic conveyors involve either building
a pilot sized conveyor scaled to the actual plant component
0032-5910/$ - see front matter D 2004 Elsevier B.V. All rights reserved.
doi:10.1016/j.powtec.2004.04.024
* Corresponding author. Tel.: +44-20-8831-8702; fax: +44-20-8331-
8695.
E-mail address: [email protected] (M.K. Patel).
(e.g., Ref. [3]). However, it is often difficult to extend with
confidence the results obtained to the real processes.
On the other hand, most computational models for
pneumatic conveying systems concentrate only on the
detailed description of the flow of the solids and gas phases
and disregard the damage imparted to the particle (e.g., Ref.
[4]). In the context of dilute-phase systems, most of the
calculations have been performed using the Euler/Lagrange
approach. A number of models include the effects of
particle–wall collisions on the particle trajectory [5,6].
More recently, a group of models for predicting particle
degradation in dilute-phase pneumatic conveying has been
published. All models incorporate particle fragmentation
characteristics obtained from results from particle single
impact studies. These models however differ in the method
of describing the flow of the gas–solids mixture through the
pipeline. Salman et al. [7] and Han et al. [8] used a Lagrangian
approach to simulate particle trajectory through a pipe. Their
models were validated for the case of small pneumatic
conveying systems consisting of up to two pipe bends. It
should be noted that the application of the Lagrangian
approach for the particulate phase is not deemed to be
computationally effective in large-scale pneumatic conveyors
due to the large amount of memory and CPU time require-
P. Chapelle et al. / Powder Technology 143–144 (2004) 321–330322
ments. An Eulerian framework based on macroscopic bal-
ance equations was chosen by Chapelle et al. [9] to describe
the flow of the gas–solids mixture. This model, coupled with
the calculation of particle degradation propensity, was used to
predict particle degradation in a large-scale pneumatic con-
veying system with several pipe bends of 90j angle.
In the present study, the model developed by Chapelle et
al. is extended in order to account for degradation in pneu-
matic conveyors consisting of pipe bend of different angles.
The model is then used to investigate degradation of granular
materials in industrial large-scale pneumatic conveying sys-
tems. The importance of the effect of the particle angle of
impact on particle damage is analysed from the simulations.
The capability of the model to give good quantitative pre-
dictions of particle degradation is discussed.
2. Numerical models
This section outlines the key features of the numerical
model for predicting particle degradation during dilute-
phase pneumatic conveying. A more detailed presentation
of the model can be found in Ref. [9].
2.1. Flow model
2.1.1. Straight pipe
Two types of gas–solids flow pattern can be identified in
a straight pipe element: a strand-type flow region immedi-
ately downstream of a bend created due to the centrifugal
force encountered by the particles while travelling around
the bend, followed by a fully suspended flow region after
dispersion of the strand.
The approach used for modelling the strand-type flow is
based on the work of Bradley et al. [10]. This model is a
one-dimensional model, which describes the flow of two
layers (namely, the dense strand and the suspended flow
above it) with separate velocity and exchanging momentum
between them due to shear forces at their interface. It is
based on a force balance on elements of the strand and of
the suspended flow region above it. The force balance
equations for a strand element of length dl and the
corresponding suspended flow region are given respectively
by:
sstrSstr ¼ qbd1pD2
4ð1� /Þastr ð1Þ
sstrSstr þ ssusp Ssusp ¼ DPsusp
pD2
4/ ð2Þ
where Sstr and Ssusp are the contact areas respectively
between the strand and the suspended flow and between
the suspended flow and the pipe wall, DPsusp is the pressure
drop, in the suspended flow region, qb is the material bulk
density in the strand, astr is the acceleration of the strand
element, D is the pipe diameter, and (1-/) represents the
fraction of the pipe cross-sectional area covered by the
strand. sstr and ssusp represent the friction forces respectively
between the strand and the suspended flow and between the
suspended flow and the pipe wall. In writing Eq. (2), the
friction force between the strand and the pipe wall was
assumed to be negligible. For pipe elements inclined with
respect to the horizontal, the gravity force acting on the
strand is taken into account in Eq. (2).
The friction force between the strand and the suspended
flow sstr is modelled in analogy to single phase flow by
using an equivalent Moody friction factor:
sstr ¼qair fstr
2ðvair � vstrÞ2 ð3Þ
where qair is the air density and vair and vstr are the air and
strand velocities, respectively. The value of the friction
factor fstr obtained from the Moody diagram is increased
in order to account for the additional momentum transfer
resulting from the interchange of particles between the
strand and the suspended flow. The friction force between
the suspended flow and the pipe wall ssusp is calculated in a
similar way as sstr.In the fully suspended flow region, the air and particles
velocities are assumed to be identical. A conventional first
approximation method to calculate the total pressure drop
along an elemental length consists of splitting the pressure
gradient into two parts [11,12]:
DP ¼ DPair þ DPsolids ð4Þ
where DPair is the pressure drop expected with air only in
the pipe and calculated from Darcy’s equation and DPsolids
represents the additional pressure drop caused by the par-
ticles present in the gas [12]:
DPsolids ¼ Kd1qsuspv2air ð5Þ
with qsusp the suspension density and K an empirical
coefficient.
2.1.2. Bend
Experimental observations show that the pressure drop
caused by a bend does not occur in the bend itself, but in the
straight section downstream of the bend [13]. Particles on
their way through a bend are decelerated as a result of
bouncing and sliding contacts with the pipe wall under the
effect of the centrifugal force. The change in particle
velocity in a bend is found by applying Newton’s law,
where the particle–wall interactions are characterized by a
coefficient of friction l and a coefficient of restitution e:
v ¼ ev0expð�lhÞ ð6Þ
where v0 is the particle velocity at the bend inlet and h is the
angular position of the particles inside the bend. Assuming a
constant mass flow rate of solids within the pipeline, the

P. Chapelle et al. / Powder Technology 143–144 (2004) 321–330 323
fraction of the pipe cross-sectional area occupied by the
strand (1-/) at the outlet section of the bend can be worked
out from the particle velocity value.
2.1.3. Numerical solution procedure
The solution procedure in a straight section is based on
the subdivision of the pipe into elemental lengths. Calcu-
lation proceeds forwards along the pipeline, taking into
account each element in turn. The boundary condition on
pressure is set either at the outlet of the pipeline (for a
positive pressure system) or at the inlet of the pipeline (for
a vacuum system). Therefore, for a positive pressure
system, the calculation procedure works with a guessed
value of the pressure at the pipe inlet and is iterated to
obtain the known pressure value at the pipe outlet. The
solution of each element is achieved iteratively by using a
central difference scheme.
2.2. Degradation model
In dilute-phase pneumatic conveying systems, bends are
the most serious points of particle damage [1,7], and so
degradation is considered to occur only by impact at the
bends. Particle degradation in a bend is represented by a
single impact, since it has been observed that the first impact
of the particles in the bend causes the major damage [7].
Moreover, it is assumed that a given value of the bend angle
corresponds to a given value of the angle of impact of the
particle. This assumption is supported by experimental
results. In an earlier work [9], it has been shown that
degradation occurring at a 90j angle bend can be accurately
represented by a single impact of 90j angle. As will be
demonstrated in the present paper, predictions of particle
damage in 45j angle bend based on a similar approximation
show also reasonable agreement with experimental obser-
vations. Fatigue phenomena, by which a particle breaks
when collisions occur a number of times, are ignored as a
first approximation. Hence, each impact of a particle is
considered independent of the next.
Fig. 1. Schematic of the rotating d
The overall change in the particle size distribution
between the inlet and the outlet of a bend is described by
the following matrix equation:
½B� � fig ¼ fog ð7Þ
where the vectors {i} and {o} are the particle size distribu-
tions, respectively at the inlet and outlet of the bend and [B]
is a matrix (referred in the following as breakage matrix),
whose elements bij define the mass fraction of particles of
size class j which ends up in size class i as a result of
degradation. A column of the matrix describes the fate of a
given size class in the input size distribution.
The breakage matrices are obtained from the results of
single particle impact tests at a specified impact angle and
velocity carried out in a laboratory scale degradation tester
[14]. An interpolation procedure has been developed to
enable the calculation of breakage matrices for a range of
impact velocities and particle sizes from a limited number of
impact tests across this range [15].
3. Experimental aspects
A rotating disc accelerator-type degradation tester
designed to assess the propensity of particle degradation
by impact was used in this study [14]. This tester can control
both the velocity of the particles and the angle of impact. The
degradation tester consists of a 100-mm diameter rotating
disc (the rotation velocity of which can be varied continu-
ously and fixed at any given value) composed of eight radial
channels of 10 mm internal diameter (see Fig. 1 detail A).
During operation, a 5-g particle input sample is fed into the
central hole of the rotating disc. The particles are accelerated
through the eight radial channels by the centrifugal and
Coriolis forces and ejected from the end of the acceleration
tubes. At the point of exit, they enter a free trajectory phase
until they impact onto the targets, which are equally spaced
around a ring fitted around the acceleration disc (see Fig. 1
isc of the degradation tester.

P. Chapelle et al. / Powder Technology 143–144 (2004) 321–330324
detail B). A degradation test yields the change in the particle
size distribution of an input sample of particles being
subjected to a single impact at a certain velocity. The input
sample can be a polydispersed material or monosized par-
ticles as appropriate. The former will provide information on
Fig. 2. Particle size distribution resulting from degradation tests of various size clas
impact angles.
the collective breakage behaviour; the latter will give spe-
cific information on the breakage characteristics of a single
size class. The scale of the tester enables the entire degraded
batch to be collected and subjected to particle size analysis.
The material can then be analysed in order to assess the
ses of granulated sugar samples for an impact velocity of 14 m/s at different

P. Chapelle et al. / Powder Technology 143–144 (2004) 321–330 325
amount of degradation caused under the designed test con-
ditions. Benefits of this facility are that the particle velocity is
closely controlled, the tester is portable and only a small
quantity of material is required for each test. The data
obtained from single particle impact studies are then utilized
to build appropriate breakage matrices, which correlates the
input particle size distribution to the resulting size distribu-
tion after impact and breakage [15].
The granular material used for the present study is
granulated sugar with a solids density of 1660 kg/m3 and
a bulk density of 700 kg/m3. The internal friction angle
between particles is 37j. As an illustrative example, the
breakage matrices built from data of degradation tests at
different impact angles for a constant particle velocity of 14
m/s are presented in Fig. 2. The experimental errors result-
ing from the degradation tests were below 2% for all
samples. The impact angle has considerable influence on
the propensity of the particle to degrade. As one may expect,
decreasing the impact angle causes a reduction in the
amount of degradation undergone by the particles. Indeed,
the smaller impact angle results in a higher proportion of
unbroken particle in each input size class (i.e., first nonzero
element in each column of the breakage matrix). This trend
can be attributed to the reduction of the normal component
of the particle velocity at lower impact angle. The effect of
Fig. 3. Comparison between the particle size distributions (PSD) measured in th
conveying velocities: (a) 9 m/s, (b) 16 m/s and (c) 22 m/s.
the impact angle in the angle range (from 30j to 45j) is lesssignificant than that in the angle range (from 45j to 90j). Itis seen that for the two largest input size classes, the
proportion of unbroken particles decreases slightly, yet
within the experimental uncertainty, as the impact angle is
reduced from 45j to 30j. The effect of the impact angle on
degradation observed in Fig. 2 shows the same trend as that
reported by Salman et al. [3], who presented a comprehen-
sive study of this effect for aluminium oxide particles.
4. Comparison between the predictions of the numerical
model and experimental data
4.1. Pilot-sized pneumatic conveyor
A series of pneumatic conveying tests of granulated
sugar was carried out in a pilot-sized pneumatic conveyor
test rig. The conveyor was composed of a single bend of
45j angle connecting two horizontal straight pipes of 8 and
7.5 m in length, respectively. The internal diameter of the
pipeline was 38.1 mm. Particle degradation under three
different conveying velocities (9, 16 and 22 m/s) was
investigated. The experimental uncertainty was calculated
to be 5%. The numerical model was used to calculate
e pilot-sized pneumatic conveyor and predicted by the model for different
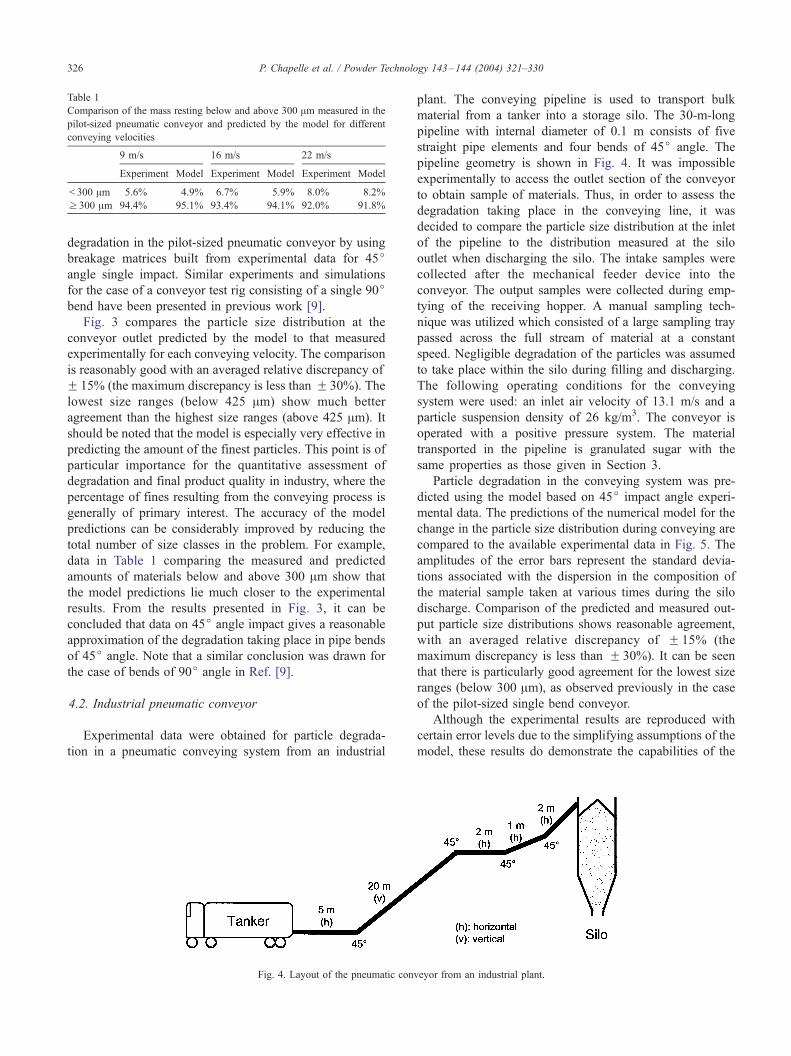
Table 1
Comparison of the mass resting below and above 300 Am measured in the
pilot-sized pneumatic conveyor and predicted by the model for different
conveying velocities
9 m/s 16 m/s 22 m/s
Experiment Model Experiment Model Experiment Model
< 300 Am 5.6% 4.9% 6.7% 5.9% 8.0% 8.2%
z 300 Am 94.4% 95.1% 93.4% 94.1% 92.0% 91.8%
P. Chapelle et al. / Powder Technology 143–144 (2004) 321–330326
degradation in the pilot-sized pneumatic conveyor by using
breakage matrices built from experimental data for 45jangle single impact. Similar experiments and simulations
for the case of a conveyor test rig consisting of a single 90jbend have been presented in previous work [9].
Fig. 3 compares the particle size distribution at the
conveyor outlet predicted by the model to that measured
experimentally for each conveying velocity. The comparison
is reasonably good with an averaged relative discrepancy of
F 15% (the maximum discrepancy is less than F 30%). The
lowest size ranges (below 425 Am) show much better
agreement than the highest size ranges (above 425 Am). It
should be noted that the model is especially very effective in
predicting the amount of the finest particles. This point is of
particular importance for the quantitative assessment of
degradation and final product quality in industry, where the
percentage of fines resulting from the conveying process is
generally of primary interest. The accuracy of the model
predictions can be considerably improved by reducing the
total number of size classes in the problem. For example,
data in Table 1 comparing the measured and predicted
amounts of materials below and above 300 Am show that
the model predictions lie much closer to the experimental
results. From the results presented in Fig. 3, it can be
concluded that data on 45j angle impact gives a reasonable
approximation of the degradation taking place in pipe bends
of 45j angle. Note that a similar conclusion was drawn for
the case of bends of 90j angle in Ref. [9].
4.2. Industrial pneumatic conveyor
Experimental data were obtained for particle degrada-
tion in a pneumatic conveying system from an industrial
Fig. 4. Layout of the pneumatic conv
plant. The conveying pipeline is used to transport bulk
material from a tanker into a storage silo. The 30-m-long
pipeline with internal diameter of 0.1 m consists of five
straight pipe elements and four bends of 45j angle. The
pipeline geometry is shown in Fig. 4. It was impossible
experimentally to access the outlet section of the conveyor
to obtain sample of materials. Thus, in order to assess the
degradation taking place in the conveying line, it was
decided to compare the particle size distribution at the inlet
of the pipeline to the distribution measured at the silo
outlet when discharging the silo. The intake samples were
collected after the mechanical feeder device into the
conveyor. The output samples were collected during emp-
tying of the receiving hopper. A manual sampling tech-
nique was utilized which consisted of a large sampling tray
passed across the full stream of material at a constant
speed. Negligible degradation of the particles was assumed
to take place within the silo during filling and discharging.
The following operating conditions for the conveying
system were used: an inlet air velocity of 13.1 m/s and a
particle suspension density of 26 kg/m3. The conveyor is
operated with a positive pressure system. The material
transported in the pipeline is granulated sugar with the
same properties as those given in Section 3.
Particle degradation in the conveying system was pre-
dicted using the model based on 45j impact angle experi-
mental data. The predictions of the numerical model for the
change in the particle size distribution during conveying are
compared to the available experimental data in Fig. 5. The
amplitudes of the error bars represent the standard devia-
tions associated with the dispersion in the composition of
the material sample taken at various times during the silo
discharge. Comparison of the predicted and measured out-
put particle size distributions shows reasonable agreement,
with an averaged relative discrepancy of F 15% (the
maximum discrepancy is less than F 30%). It can be seen
that there is particularly good agreement for the lowest size
ranges (below 300 Am), as observed previously in the case
of the pilot-sized single bend conveyor.
Although the experimental results are reproduced with
certain error levels due to the simplifying assumptions of the
model, these results do demonstrate the capabilities of the
eyor from an industrial plant.

Fig. 5. Comparison between the particle size distributions (PSD) measured
in the large-scale pneumatic conveyor and predicted by the model.
P. Chapelle et al. / Powder Technology 143–144 (2004) 321–330 327
numerical model to simulate particle degradation in an
industrial conveyor. The model is capable of giving good
quantitative predictions of the fractions of the smallest
particles in the system. The fractions of the largest particles
are also well predicted. The present model is a significant
advance over the current methods available for determining
particle degradation in an industrial pneumatic conveyor.
Moreover, it is computationally inexpensive.
5. Simulation of a large-scale pneumatic conveying
system
Having achieved a measure of validation of the numerical
model, it has been applied to investigate particle degradation
in an industrial large-scale pneumatic conveying system
Fig. 6. Pipeline geometry for the industrial la
including bends of different angles. The conveying system
is a typical industrial configuration. It is a 65.3-m-long
pipeline including 17 straight pipe elements and 16 bends
of different angles (30j, 45j and 90j). The layout and the
geometrical parameters of the pipeline are shown in Fig. 6.
Unfortunately, but like for most of the industrial conveyors,
the amount of degradation in the conveying system could not
be measured experimentally because of the practical difficul-
ties, which arise for sampling the material either at the
conveyor outlet or further downstream at the outlet of the silo.
The simulation was performed for the following operat-
ing conditions: an inlet air velocity of 15 m/s and a particle
suspension density of 10 kg/m3. The properties of the
granulated sugar used in this study are identical to those
given in Section 3. In order to model degradation in 30jbends, an approximation similar to that validated for bends
of 45j and 90j angles was used, which consists in repre-
senting the degradation taking place in a 30j bend by a
single particle impact at 30j.The calculated profiles of the air and particle velocities
along the pipeline are shown in Fig. 7. Due to the expansion
of the air in the pipeline, the air velocity increases along the
pipe to a value of approximately 23 m/s at the pipeline
outlet. As a result of the momentum transfer between the air
and the particulate phase, particles are accelerated in straight
pipe elements. Through pipe bends, particles are consider-
ably slowed down due to particles impacting with or sliding
along the bend walls. On exiting a bend, particles, which are
mainly conveyed in the form of a strand, are progressively
reaccelerated towards the air velocity. After dispersion of
the strand further downstream, the particle flow becomes
fully dispersed with equal particle and air velocities. In the
present simulation, a fully dispersed flow region occurs only
in the straight pipe element between bends l and m.
rge-scale pneumatic conveying system.

Fig. 7. Calculated profiles of the air and particle velocities along the pipeline. The indexes (a, b. . .p) refer to the location of the bends along the pipeline.
P. Chapelle et al. / Powder Technology 143–144 (2004) 321–330328
The variation of the harmonic mean size of the particle
distribution in each bend obtained by the numerical simu-
lation is plotted in Fig. 8. The harmonic mean size Xh is
expressed as:
1
Xh
¼X wi
dið8Þ
where wi is the fraction of material retained between sieves
of mean size di. The bulk material experiences considerable
degradation during conveying, as the mean particle size at
the conveyor outlet is equal to less than 50% of its initial
value at the inlet of the pipeline. Fig. 8 shows a nonuniform
overall rate of degradation, with a greater gradient for bends
of 90j angle (i.e., bends e, f, k, l, o and p). However, it can
Fig. 8. Variations of the harmonic mean size of the particle distribution after ea
be seen a mainly constant degradation rate for groups of
bends with the same angle. This is due to the similar values
of the particle velocity in each bend as illustrated in Fig. 7.
Such an identical degradation rate for bends with the same
angle is not likely to occur in a real conveying system, due
to the possible influence of the number of impacts under-
gone by a particle on its degradation propensity. This last
effect cannot be accounted for by the present model, which
treats as a first approximation each bend in the same way no
matter of its location along the conveying line.
The change in the full particle size distribution through
each bend is presented in Fig. 9. In the histograms of Fig. 9,
columns relative to bends with the same angle are displayed
using the same colour. As the number of passes through a
ch pipe bend. The points have been labelled with the bend angle value.

Fig. 9. Variations of the particle size distribution after each pipe bend. The following code of colours has been used to represent the histogram columns: white
for bends of 45j angle, black for bends of 90j angle and grey for bends of 30j angle. The labels above each column correspond to the bend angle.
P. Chapelle et al. / Powder Technology 143–144 (2004) 321–330 329
bend increases, the fractions of the larger particles (above
425 Am) gradually decrease, whereas the fractions of the
smaller particles (below 425 Am) gradually increase. At the
end of the conveying line, more than 22% of the material
ends up as fines (particle size below 212 Am) and the
fraction of the largest particle has decreased to more than
90% of its initial value. As noted in Fig. 8, the bends of 90jangle are responsible of the steepest rate of degradation.
Bends e, k and o (which correspond in particular to a change
in pipeline level from horizontal to vertical) are the points of
most severe particle damage. The simulation results pre-
sented here indicate as anticipated that the bend angle plays

P. Chapelle et al. / Powder Technology 143–144 (2004) 321–330330
a strong role in the degradation of conveyed particles and
that the damage imparted to the particles can be substan-
tially reduced by using bends of lower angles. It is also
interesting to note that there is little difference in the rate of
degradation caused by bends of 30j and 45j angles.
6. Conclusions
The model of particle degradation, during dilute-phase
pneumatic conveying, developed by Chapelle et al. has been
extended in order to describe the degradation taking place in
pipe bends of different angles, validated and applied to an
industrial context. Generalizing the approach presented in an
earlier work for the single case of 90j bends, impact degra-
dation of the particles in pipe bends has been represented by a
single impact at a given angle characteristic of the angle of the
bend. The effect of the particle angle of impact on degrada-
tion was demonstrated and discussed. For validating the
model, the numerical predictions were compared with de-
tailed measurements from a pilot sized pneumatic conveying
system and a pneumatic conveyor from an industrial plant.
Although the model is based on several simplifying assump-
tions, the agreement was found to be reasonably good, with
an averaged error of about 15%. The model is particularly
effective at capturing the fines production. The simulation of
an industrial large scale pneumatic conveying system includ-
ing various bends of different angles has shown, as might be
logically expected, that lower bend angle tends to reduce the
rate of damage to the particles.
Future work is aimed at improving the degradation
model by including the effects of multiple impacts of the
particles in a bend and the influence of the number of
impacts on the particle degradation propensity. The devel-
oped numerical model should form a powerful engineering
tool to support the design and optimisation of existing and
new dilute-phase pneumatic conveyors, where material
quality is a major requirement.
References
[1] H. Kalman, Attrition control by pneumatic conveying, Powder Tech-
nology 104 (1999) 214–220.
[2] I. Bridle, M.S.A. Bradley, S.R. Woodhead, R.J. Farnish, Effect of
bend geometry on particle attrition in pneumatic conveyors, Powder
to Bulk Proceeding of the International Conference on Powder and
Bulk Solids Handling, London, 2000.
[3] A.D. Salman, D.A. Gorham, A. Verba, A study of solid particle
failure under normal and oblique impact, Wear 186–187 (1995)
92–98.
[4] A. Yilmaz, E.K. Levy, Formation and dispersion of ropes in pneu-
matic conveying, Powder Technology 114 (2001) 168–185.
[5] M. Sommerfeld, Modelling of particle–wall collisions in confined
gas–particle flows, International Journal of Multiphase Flow 18 (6)
(1992) 905–926.
[6] N. Huber, M. Sommerfeld, Modelling and numerical calculation of
dilute-phase pneumatic conveying in pipe systems, Powder Techno-
logy 99 (1998) 90–101.
[7] A.D. Salman, M.J. Hounslow, A. Verba, Particle fragmentation in
dilute phase pneumatic conveying, Powder Technology 126 (2002)
109–115.
[8] T. Han, A. Levy, H. Kalman, DEM simulation for attrition of salt
during dilute-phase pneumatic conveying, Powder Technology 129
(2003) 92–100.
[9] P. Chapelle, N. Christakis, H. Abou-Chakra, I. Bridle, M.S.A. Brad-
ley, M.K. Patel, M. Cross, Computational model for prediction of
particle degradation during dilute phase pneumatic conveying: mod-
elling of dilute phase pneumatic conveying, Advanced Powder Tech-
nology 15 (1) (2004) 31–49.
[10] M.S.A. Bradley, R.J. Farnish, L.M. Hyder, A.R. Reed, A novel ana-
lytical model for the acceleration of particles following bends in
pneumatic conveying systems, in: A. Levy, H. Kalman (Eds.), Hand-
book of Conveying and Handling of Particulate Solids, Elsevier,
2001, pp. 411–423. ISBN: 0-444-50235-1.
[11] O. Molerus, Overview: pneumatic transport of solids, Powder Tech-
nology 88 (1996) 309–321.
[12] L.M. Hyder, The effect of particle size and density on pressure gra-
dients in horizontal pipelines in lean phase pneumatic conveying, PhD
thesis, University of Greenwich, London, UK, 1999.
[13] M.S.A. Bradley, D. Mills, Approaches to dealing with the problem of
energy loss due to bends, Proc. 13th Powder and Bulk Conference,
Rosemont, Illinois, USA, 1988, pp. 705–715.
[14] H. Abou-Chakra, U. Tuzun, I. Bridle, M.C. Leaper, M.S.A. Bradley,
A.R. Reed, An investigation of particle degradation by impact within
a centrifugal accelerator type degradation tester, Proceedings of the
Institution of Mechanical Engineers. Part E, Journal of Process Me-
chanical Engineering 217 (4) 2003, pp. 257–266.
[15] P. Chapelle, H. Abou-Chakra, N. Christakis, M. Patel, A. Abu-Nahar,
U. Tuzun, M. Cross, Computational model for prediction of particle
degradation during dilute phase pneumatic conveying: the use of a
laboratory scale degradation tester for the determination of degrada-
tion propensity, Advanced Powder Technology 15 (1) (2004) 13–29.