numerical modelling and field monitoring of...
TRANSCRIPT

NUMERICAL MODELLING AND FIELD
MONITORING OF STABILITY OF CUT SLOPES
A THESIS SUBMITTED IN PARTIAL FULFILMENT OF THE
REQUIREMENTS FOR THE DEGREE OF
Bachelor of Technology
In
Mining Engineering
By
DEEPAK KUMAR
111MN0391
DEPARTMENT OF MINING ENGINEERING
NATIONAL INSTITUTE OF TECHNOLOGY
ROURKELA-769008
2015

NUMERICAL MODELLING AND FIELD
MONITORING OF STABILITY OF CUT SLOPES
A THESIS SUBMITTED IN PARTIAL FULFILMENTS OF THE
REQUIREMENTS FOR THE DEGREE OF
Bachelor in Technology
In
Mining Engineering
By
DEEPAK KUMAR
111MN0391
Under The Guidance of
DR. SINGAM JAYANTHU
DEPARTMENT OF MINING ENGINEERING
NATIONAL INSTITUTE OF TECHNOLOGY
ROURKELA-769008
2015

National Institute of Technology
Rourkela
CERTIFICATE
This is certify that the thesis entitled “NUMERICAL MODELLING AND FIELD
MONITORING OF STABILITY OF CUT SLOPES” submitted by Sri Deepak Kumar,
Roll No.111MN0391 in partial fulfilment of the requirements for the award of Bachelor of
Technology degree in Mining Engineering at the National Institute Of Technology, Rourkela
is authentic work carried out by him under my supervision and guidance.
To the best of my knowledge, the matter embodied in the thesis has not been submitted
to any other University/Institute for the award of any Degree or Diploma.
Date: 08-MAY-2015
Dr. Singam Jayanthu
Department of Mining Engineering
National Institute 0f Technology Rourkela-769008

ACKNOWLEDGEMNET
My heart pulsates with the thrill for tendering gratitude to those persons who helped me in
completion of the project. I am very thankful to all those person who have given me the
opportunity to do the project “NUMERICAL MODELLING AND FIELD
MONITORING OF STABILITY OF CUT SLOPES”. Unfortunately, the list of
expressions of thank no matter how extensive is always incomplete and inadequate.
I would like to articulate my deep gratitude to my project guide DR. SINGAM JAYANTHU
who have always been our motivation for carrying out the project.
Last but not the least to all of my friends who were patiently extended all sorts of help for
accomplishing this undertaking.
Date: 08-MAY-2015 DEEPAK KUMAR
Department of Mining engineering,
National Institute of Technology
Rourkela – 769008

CONTENT
SL
NO.DESCRIPTION PAGE NO.
ABSTRACT i
List of the figures ii
List of the tables iii
List of the graphs iv
CHAPTER 1 1
1 INTRODUCTION 2
1.1 Objectives Of The Project 3
1.2 Methodology Of The Project 4
CHAPTER 2 5
2 LITERATURE REVIEW 5
2.1 Slope Stability 6
2.2 Factors Effecting The Stability Of A Slope 6
2.3 Types Of Slope Failure 10
2.3.1 Plane failure 10
2.3.2 Wedge failure 11
2.3.3 Toppling failure 12
2.3.4 Rockfalls 13
2.3.5 Rotational failure 14
2.4 Cut Slopes 15

2.4.1 Rock cuts based on height 16
2.4.2 Different cut slope design option 19
2.5 Types Of Slope Movement 21
2.5.1 Initial response 22
2.5.2 Regressive and progressive movement 22
2.5.3 Long term creep 23
2.6 Slopes Stability Monitoring Methods 24
2.6.1 Crack monitors 24
2.6.2 Surveying 26
2.6.3 Photographic Image Analysis 27
2.6.4 Total station 28
2.6.5 Global Positioning System (GPS) 28
2.6.6 Acoustic Emission Technique 29
2.6.7 Laser image scanning system 30
2.6.8 Time–domain reflectometry 31
2.7 Numerical Modelling 33
2.7.1 OASYS 33
2.7.1.1 Stages in calculating factor of safety 33
2.7.1.2 Procedure of calculating factor of safety 33
2.8 Slope Stability Analysis By Other Investigators 34
2.9 Total Station 41
2.9.1 Slope monitoring using total station 41

2.9.2 Steps in slope monitoring using total station 42
CHAPTER 3 46
3.0 CASE STUDY 47
3.1 Description of Study Area 47
3.2 Objective of Study 48
3.2.1 Instrumentation for monitoring stability of slopes 48
3.2.2 Slope stability study 50
3.3 Monitoring Sites at Nalco Mine 51
3.3.1 Slope stability of part-II mining area 51
3.3.2 Slope stability of drive house area and area south of
drive house
52
3.3.3 Slope stability of gully erosion area: (East of drive
house)
52
3.3.4 Slope stability of deep cut area 54
CHAPTER 4 56
4.0 OBSERVATION AND ANALYSIS 56
4.1 Displacement Analysis 56
4.2 Numerical Modelling of Study Sites 62
CHAPTER 5 65
5.0 CONCLUSION 66
REFERENCES 67

i
ABSTRACT
The monitoring information is used for variety of crucial functions including safety
control, evaluation of current mining plans and future slope design. It provides an active
input into mine planning. The early identification of movement zones allows steps to be
taken to minimize the impact of mining on stability by the implementation of corrective
measures. The main objective of slope monitoring study is to detect any instability well in
advance so that any damage to men and machineries can be avoided. If the failure is
unavoidable then it can be brought down in a predictable manner. If any instability is
detected in the early stage then it can be stabilized by applying the suitable remedial measure.
The slope materials are inherently weak in the mine.
Slope stability monitoring was done in NALCO mine. There were many cut slope areas most
of them for the passage of the cable belt conveyor. In order to check the stability of those cut
slopes it was proposed the approach of numerical modelling and graphical analysis. The
numerical modelling was done in OASYS software and the stability of the sites area checked
and factor of safety (FOS) is found in the stable region. On the basis of Numerical Modelling
for the geo-mining condition of cut slope surrounding NALCO mine, the factor of safety for
the Cut slope I, (near deep cut area), Cut slope II, (near drive house area of height 32m), Cut
slope III, (near drive house area of height 24m), and Cut slope IV, (near part II mine area) are
respectively 1.335, 1.332, 1.324 and 1.224 with corresponding cut slope height of 20m, 32m,
24m and 35m. Field observation through total station indicated maximum horizontal
displacement of 4.3cm, 3.5cm, 4.5cm and -5cm at cut I, II, III and IV respectively indicating
stability of slope. Except at few places with local slope failure due to rainfall, all other cut
slope are observed to be stable, therefore it is recommended to improve garland drainage and
stabilization through geotextile.

ii
LIST OF FIGURESFIGURE
NO.DESCRIPTION PAGE NO.
1.1 Flow chart of the project methodology 4
2.1 Side view of plane failure 10
2.2 Side view of wedge failure 12
2.3 View of toppling failure 13
2.4 View of the Rockfalls 14
2.5 View of the circular failure 15
2.6 View of different types of cut failure (a) balance cut and
fill, (b) full bench cut, (c) through cut
19
2.7 Construct cut slopes at a 3/4:1 or flatter slope in most soils
for long-term stability. In well-cemented soils and rock, a
1/4:1 cut slope will usually be stable.
21
2.8 A well-stabilized cut slope, with about a 1:1 slope that is
well covered with vegetation.
21
2.9 Avoid loose, overstep fill slopes (steeper than 1 1/5:1),
particularly along streams and at drainage crossings
21
2.10 (a) Lateritic soil capping at the top of the Mahabaleshwarplateau, (b) discontinuity orientation in the area.
21
2.11 Types of slope movement: (a) typical repressive and
progressive displacement curves; (b) structural geological
conditions corresponding to types of slope movement
23
2.12 Method of monitoring tension wire in the cracks in slope 25
2.13 Survey system to remotely measure slope movement 26
2.14 Terrestrial photogrammetry 27

iii
2.15 3D-scanner 30
2.16 Working mechanism of TDR system 32
2.17 Computer aided data acquisition form TDR system 32
2.18 NTS-350L/350R electronic total station 42
3.1 Location of south west side of part II mine area 51
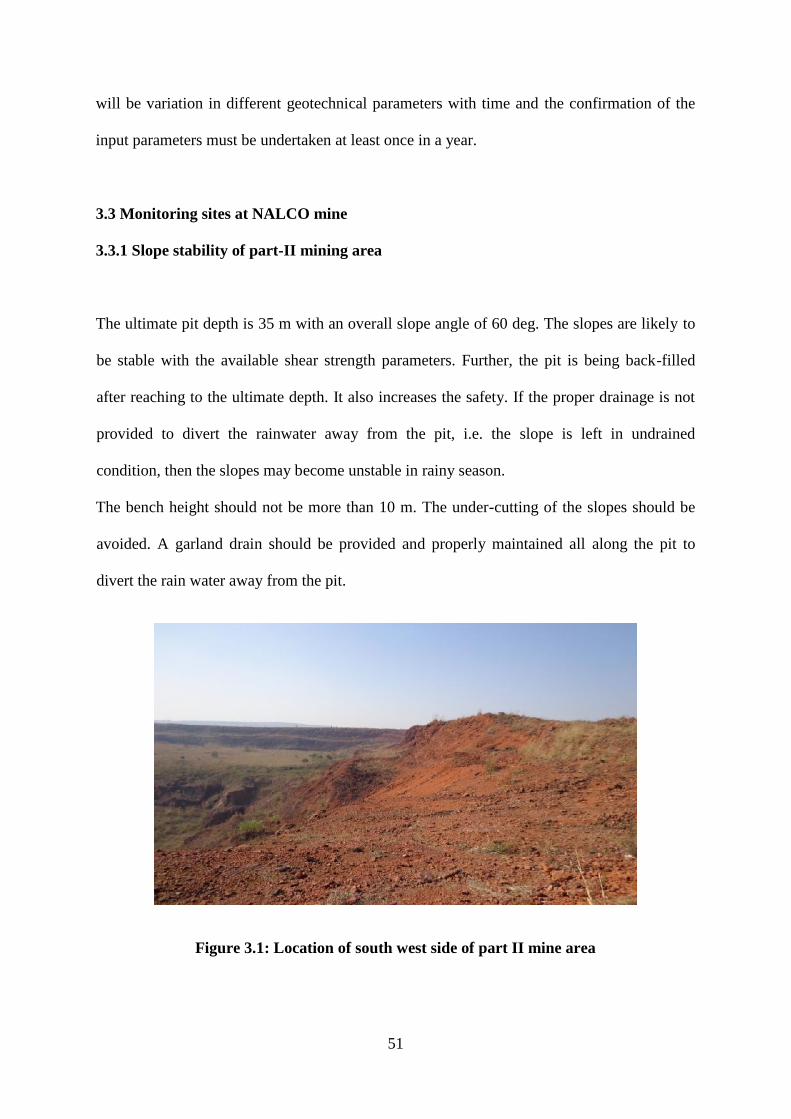
3.2 Location of drive house area 53
3.3 Location of the deep cut area 55
4.1 FOS for part II mine area 62
4.2 FOS for drive house area height 32m 63
4.3 FOS for drive house area having height 24m 63
4.4 FOS for deep cut area 64
LIST OF TABLESTABLE
NO.DESCRIPTION PAGE NO.
2.1 Common stable slope ratios for varying soil/rock conditions 18
2.2 Work done by other investigators 34
4.1 FOS of different sites 64
iv
LIST OF GRAPHSGRAPH
NO.DESCRIPTION
PAGE
NO.
4.1
Changes in Horizontal Distance at Eastern side of part II
Mining Area, (Instrument set at CM-3 New) (N18°51.022’,
E83° 00.757’)
57
4.2
Changes in Horizontal Distance at South West side of part II
Mining Area, (Instrument set at CM-4 New) (N18°51.201’,
E83° 00.593’)
57
4.3
Changes in Horizontal Distance at western side of Drive House
Area, (Instrument set at CM-2A New) (N18°50.761’, E83°
01.317’)
58
4.4
Changes in Horizontal Distance at Western hill of cable belt
corridor adjacent to southern side of Drive House , ( Instrument
set at CM-5) (N18°50.691’, E83° 01.226’)
58
4.5
Changes in Horizontal Distance at Eastern hill of cable belt
corridor adjacent to southern side of Drive House , ( Instrument
set at CM-2 New) (N18°50.665’, E83° 01.248’)
59
4.6Changes in Horizontal Distance at Eastern side of deep cut area
(Instrument set at CM-7) (N18°47.591’, E82° 58.292’)60
4.7Changes in Horizontal Distance at Eastern side of deep cut area
(Instrument set at CM-8) (N18°47.542’, E82° 58.203’)60
4.8
Changes in Horizontal Distance at Western side of deep cut
area (Instrument set at CM-9) (N18°47’35.25”, E82°
58’15.37”)
61

1
CHAPTER 1
INTRODUCTION
2
1.0 INTRODUCTION
Slope movement in open pit mines is not a big issue. Several mines continue to operate safely
with moving slopes with the help of monitoring to enable timely warning against
deteriorating stability conditions. It is necessary to implement an effective monitoring
program to oversee and predict the occurrence of such events. Monitoring success, be it slope
monitoring or structural monitoring is performed to detect movement that could lead to
collapse and to allow for sufficient warning to successfully evacuate the area or structure. In
mine surveying, slope stability monitoring is one of the routine events during mining
operations. Slope stability is based on the interaction between two types of forces, namely
driving forces and resisting forces. Geological structures, rock mass properties, and
hydrologic conditions are important elements for design of safe and efficient slope structures.
Groundwater, surface water, and precipitation runoff can be controlled to abate their
deleterious effects on stability. Benches and berms are normally used to stop rocks before to
fall prior and pose a significant hazard. However, even a carefully designed and constructed
slope may fail because of unidentified geological structures, unexpected weather conditions,
or seismic activities. For these reasons, regular examination and systematic monitoring of
slopes are important for early detection of failure and associated hazard.
Slope failure never occurs spontaneously. Before failure, slope provides indication in the
form of measurable movement and/or the development of tension cracks. In contrast to this,
landslide is a result of long-term movement of slopes creeping for hundreds of years resulting
in accumulative movement of tens of meters. Such movement may be superimposed for a
short period of more rapid movement resulting from major events like earthquakes. Under
such conditions, monitoring of slope stability and landslides involve selection of certain
parameters and observing their behaviour with respect to time.
3
The two most important parameters are displacement and groundwater levels. Slope
displacement can be characterized, in terms of depth of failure plane(s), direction, magnitude,
and rate, using conventional slope monitoring, whereas, piezometers can be used for
determination of water levels. Surveying of fixed surface movements deploying
extensometers, inclinometers, and tiltmeters capture changes in direction and rate of slope
movement depth and areal extent of the failure mass.
The use of total station surveying instruments for monitoring structures movement with good
results were reported by many authors, such as Radovanovic and Teskey (2001); Hill and
Sippel (2002); Kuhlmann and Glaser (2002); Zahariadis and Tsakiri (2006). Continuous
monitoring, as an important operation in an open pit mine to ensure safety and predicting the
stability of the mine wall, was also described by Palazzo et al, (2006). The use of total station
to monitor mine slope stability is still widely used.
1.1 Objectives of the Project
Study of stability of different cut slopes of an opencast mine by total station monitoring
techniques and then by numerical modelling by OASYS software.
4
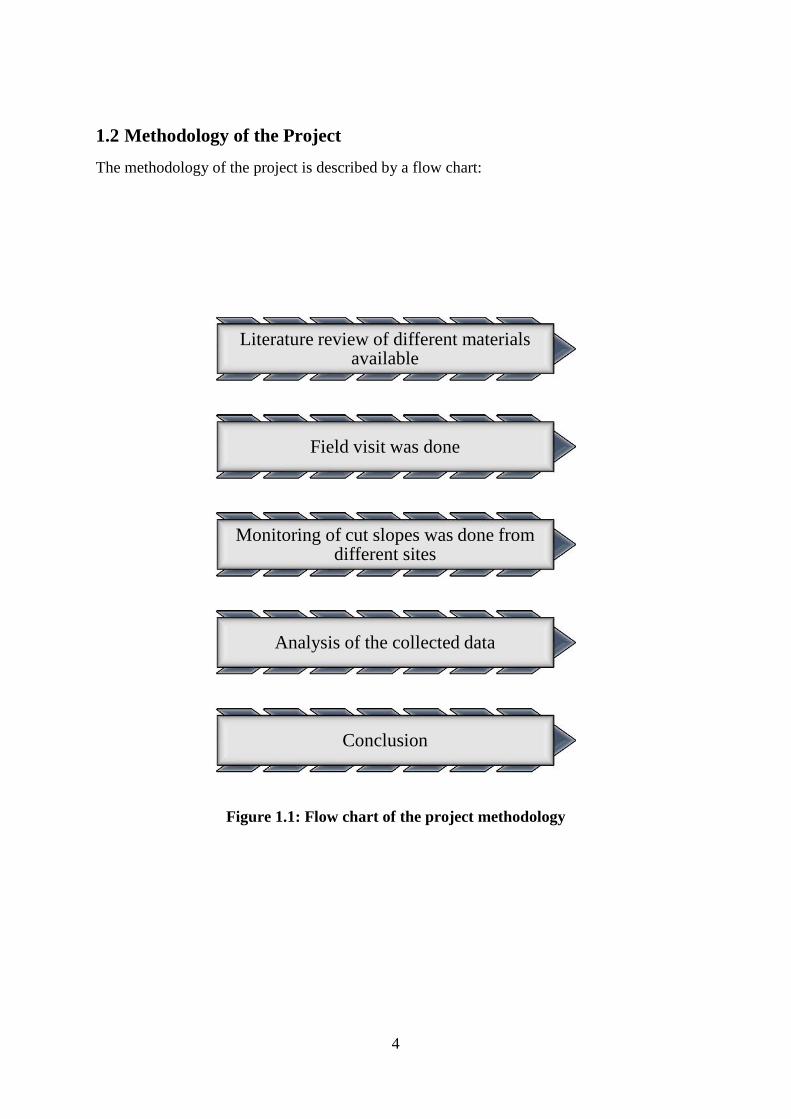
1.2 Methodology of the Project
The methodology of the project is described by a flow chart:
Figure 1.1: Flow chart of the project methodology
Literature review of different materialsavailable
Field visit was done
Monitoring of cut slopes was done fromdifferent sites
Analysis of the collected data
Conclusion

5
CHAPTER 2
LITERATURE REVIEW
6
2.0 LITERATURE REVIEW
2.1 Slope Stability
Stability of the slopes is the potential of soil covered slopes to withstand and undergo
movement. Stability of the slopes can be measured by the balance of shear stress and shear
strength. A previously stable slope may be initially affected by preparatory factors, making
the slope conditionally unstable. Triggering factors of a slope failure can be climatic events
can then make a slope actively unstable, leading to mass movements. Increase in shear stress,
loading, lateral pressure, and transient forces causes mass movement. Weathering, changes in
pore water pressure, and organic material causes decrease in shear strength.
The field of slope stability encompasses static and dynamic stability of slopes of earth and
rock-fill dams, slopes of other types of embankments, excavated slopes, and natural slopes in
soil and soft rock. Geologists, engineering geologists, or geotechnical engineers contributes
their parts in slope stability investigation, analysis (including modelling), and design
mitigation.
2.2 Factors Affecting the Stability of a Slope
a) Slope Geometry: The slope geometry is an important factor which disturbs the stability of
the slopes. The basic geometrical slope design parameters are height of the bench, overall
slope angle and the total area of failure surface. Stability of slope decreases with increases in
height and slope angle. The curvature of the slope has profound effect on the instability and
therefore convex section slopes should be avoided in the slope design. Greater the slope
angle and higher the height less is the stability.
b) Geological Structure: A rock slope may become unstable and fail along pre-existing
structural discontinuities, by failure through intact material or by failure along a surface
7
formed partly along discontinuity and partly through intact material. Instability may occur if
the strata dips into the excavations. Localized steepening of strata is critical for the stability
of the slopes. Stability is hampered if a clay band comes in between the two rock bands.
Bedding planes and Joints are also zones of weaknesses.
Stability of the slope is therefore dependent on the shear strength available along such
surface, on their orientations with respect to the slope and water pressure action on the
surface. These shear strength that is available along joint surface depends on the functional
properties of the surface and the effective stress which are transmitted normal to the surface.
Joints can create a situation where the failure planes involve a combination of joint sets that
provide a cross over surface
c) Lithology: The rock materials constituting a pit slope determines the rock mass strength
modified by discontinuities, folding, faulting, old workings and weathering. Low rock mass
strength is characterized by quasi-circular ravelling and rock fall instability like the formation
of slope in massive sandstone restricts stability. Pit slopes containing soil alluvium or
weathered rocks have low shearing strength and it is further reduced if water seeps through
them. These types of slopes should be flatter.
d) Ground Water: Excess water content in a slope reduces the cohesion and frictional
parameters and also the normal effective stress. It causes increased up thrust and has adverse
effect on the stability of the slopes. The chemical and physical effect of pure water pressure
in joints filling material can thus alter the cohesion and friction of the discontinuity surface. It
provides uplift on the joint surfaces and reduces the frictional resistance. This in turn reduces
the shearing resistance along the probable failure plane by reducing the effective normal
stress on it. The effect of the water pressure in the rock pores causes a decrease in the
compressive strength predominantly where the confining stress has been reduced.
8
e) Mining Method: Essentially there are four methods of advance in surface mining. They
are:
Strike cut- advancing down the dip
Strike cut- advancing up the dip
Dip cut- along the strike
Open pit working
The use of dip cuts with advance on the strike reduces the time and length that a face is
exposed during excavation. Dip cuts which advance in an oblique manner to strike are used
to reduce the strata dip in to the excavation. The Open pit method is used in sharply dipping
seams because the greater slope height is more prone to buckling modes of failure. Dip cut is
the most stable method of working but it suffers from restricted production potential. In
circular failures spoil dumps are more common. Mining equipment which piles on the
benches of the open pit mine gives rise to the increase in surcharge, which in turn increases
the downward pulling force on the slope and thus instability occurs.
f) Time: The time for which a slope has to stand after excavation should be considered as
well. The slopes that are generally found in surface mines have to stand for a short time but
they encounter the same rigorous treatment as in civil projects. In the long term, the
progressive strain softening rate is a significant factor in the slope stability.
g) Dynamic Forces: Vibrations due to blasting momentarily increases the shear stress as a
result dynamic acceleration of material and thus increases the stability problem in the slope
face. Blasting is a crucial factor in deciding the maximum attainable bench face angles. The
effects poor blasting can be significant for bench stability. In addition to blast damage and
back break both of which reduce the bench face angle, blasting vibrations could potentially
cause failure of the rock mass. For small slopes, smooth blasting techniques have been

9
proposed and the experiences are quite good. For large slopes, blasting is less of a problem
because back break and blast damage have minor effects on the overall slope angle.
Moreover, the high frequencies of the blast acceleration waves exclude them from displacing
large rock masses uniformly. Seismic events, i.e., low frequency vibrations, could be more
precarious for large scale slopes and several failures of natural slopes have been witnessed in
mountainous areas. External loading also plays an important role as in case of surcharge due
to dumps on the crest of the benches.
h) Cohesion: The resistance force per unit area is termed as cohesion, and is measured in
Pascal (Pa). In natural soils, cohesion arises from electrostatic bonds between clay and silt
particles. Thus, soils empty of clay or silt are not cohesive but for capillary forces arising
when little water forms bridges between sand grains, causing negative pore pressure (or
“suction”). Values of soil cohesion usually are of the order of some KPa. Rocks typically
display much greater cohesion, thousands of times higher than soils. At finite normal
stresses, soils and rocks normally display both cohesive and frictional behaviour. The shear
strength of a soil is thus the sum of the cohesive and frictional contributions. Higher is the
cohesion value, more stable will be the slope.
i) Angle of Internal Friction: It is the measure of the angle between the normal force and
resultant force when failure just occurs in reaction to a shearing stress. It is an indicator of the
ability of a rock or soil to survive shear stress. Angle of internal friction is depends upon
particle roundness and particle size. Lower roundness or larger median particle size results in
larger friction angle. The sands with less quartz contained greater amounts of potassium-
feldspar, plagioclase, calcite, and/or dolomite and these minerals generally have higher
sliding frictional resistance compared to that of quartz. Angle of internal friction, can be
determined in the laboratory by the Direct Shear Test or the Triaxial Shear Test.
10
j) Old workings: Old workings disturb the stability of a slope in numerous ways. They can
act as networks for groundwater flow, many of them might be unstable and collapse when
subjected to weights.
2.3 Types of Slope Failure
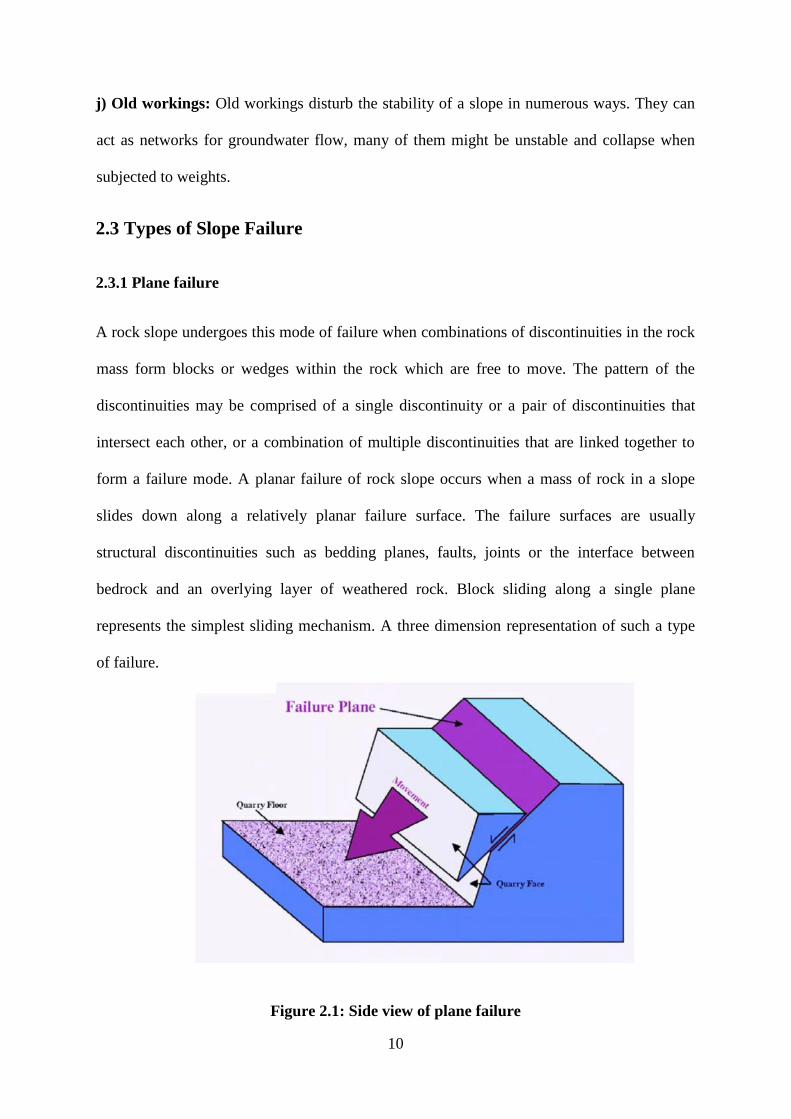
2.3.1 Plane failure
A rock slope undergoes this mode of failure when combinations of discontinuities in the rock
mass form blocks or wedges within the rock which are free to move. The pattern of the
discontinuities may be comprised of a single discontinuity or a pair of discontinuities that
intersect each other, or a combination of multiple discontinuities that are linked together to
form a failure mode. A planar failure of rock slope occurs when a mass of rock in a slope
slides down along a relatively planar failure surface. The failure surfaces are usually
structural discontinuities such as bedding planes, faults, joints or the interface between
bedrock and an overlying layer of weathered rock. Block sliding along a single plane
represents the simplest sliding mechanism. A three dimension representation of such a type
of failure.
Figure 2.1: Side view of plane failure
11
In case of a plane failure, at least one joint set strike approximately parallel to the slope strike
and dips toward the excavation slope and the joint angle is less than the slope angle.
The favourable conditions of plane failure are as follows:
• The dip direction of the planar discontinuity must be within (±20o) of the dip direction of
the slope face.
• The dip of the planar discontinuity must be less than the dip of the slope face (Daylight)
• The dip of the planar discontinuity must be greater than the angle of friction of the surface
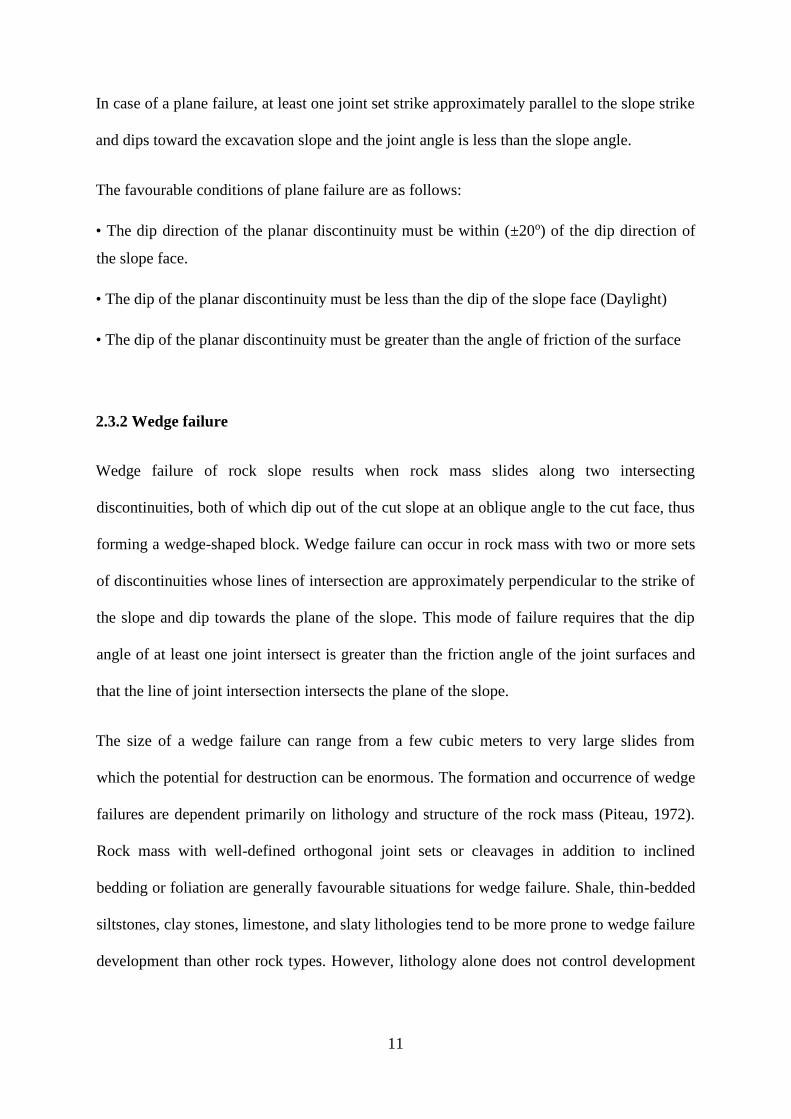
2.3.2 Wedge failure
Wedge failure of rock slope results when rock mass slides along two intersecting
discontinuities, both of which dip out of the cut slope at an oblique angle to the cut face, thus
forming a wedge-shaped block. Wedge failure can occur in rock mass with two or more sets
of discontinuities whose lines of intersection are approximately perpendicular to the strike of
the slope and dip towards the plane of the slope. This mode of failure requires that the dip
angle of at least one joint intersect is greater than the friction angle of the joint surfaces and
that the line of joint intersection intersects the plane of the slope.
The size of a wedge failure can range from a few cubic meters to very large slides from
which the potential for destruction can be enormous. The formation and occurrence of wedge
failures are dependent primarily on lithology and structure of the rock mass (Piteau, 1972).
Rock mass with well-defined orthogonal joint sets or cleavages in addition to inclined
bedding or foliation are generally favourable situations for wedge failure. Shale, thin-bedded
siltstones, clay stones, limestone, and slaty lithologies tend to be more prone to wedge failure
development than other rock types. However, lithology alone does not control development
12
of wedge failures. A photograph of wedge failure obtained in field. The necessary structural
conditions for this failure are summarized as follows:
• The trend of the line of intersection must approximate the dip direction of the slope face.
• The plunge of the line of intersection must be less than the dip of the slope face. The line of
intersection under this condition is said to daylight on the slope.
• The plunge of the line of intersection must be greater than the angle of friction of the
surface.
Figure 2.2: Side view of wedge failure
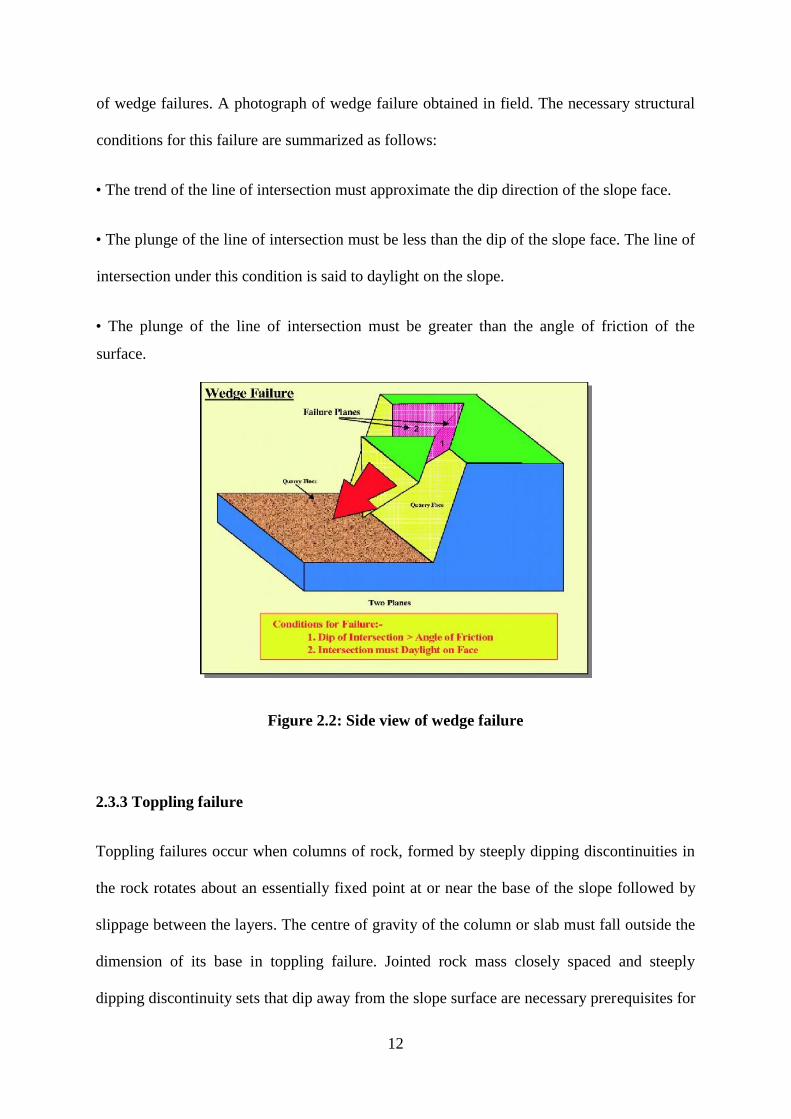
2.3.3 Toppling failure
Toppling failures occur when columns of rock, formed by steeply dipping discontinuities in
the rock rotates about an essentially fixed point at or near the base of the slope followed by
slippage between the layers. The centre of gravity of the column or slab must fall outside the
dimension of its base in toppling failure. Jointed rock mass closely spaced and steeply
dipping discontinuity sets that dip away from the slope surface are necessary prerequisites for
13
toppling failure. The removal of overburden and the confining rock, as is the case in mining
excavations, can result in a partial relief of the constraining stresses within the rock structure,
resulting in a toppling failure. This type of slope failure may be further categorized depend
on the mode such as flexural toppling, block toppling, and block flexural toppling.
Figure 2.3: View of toppling failure
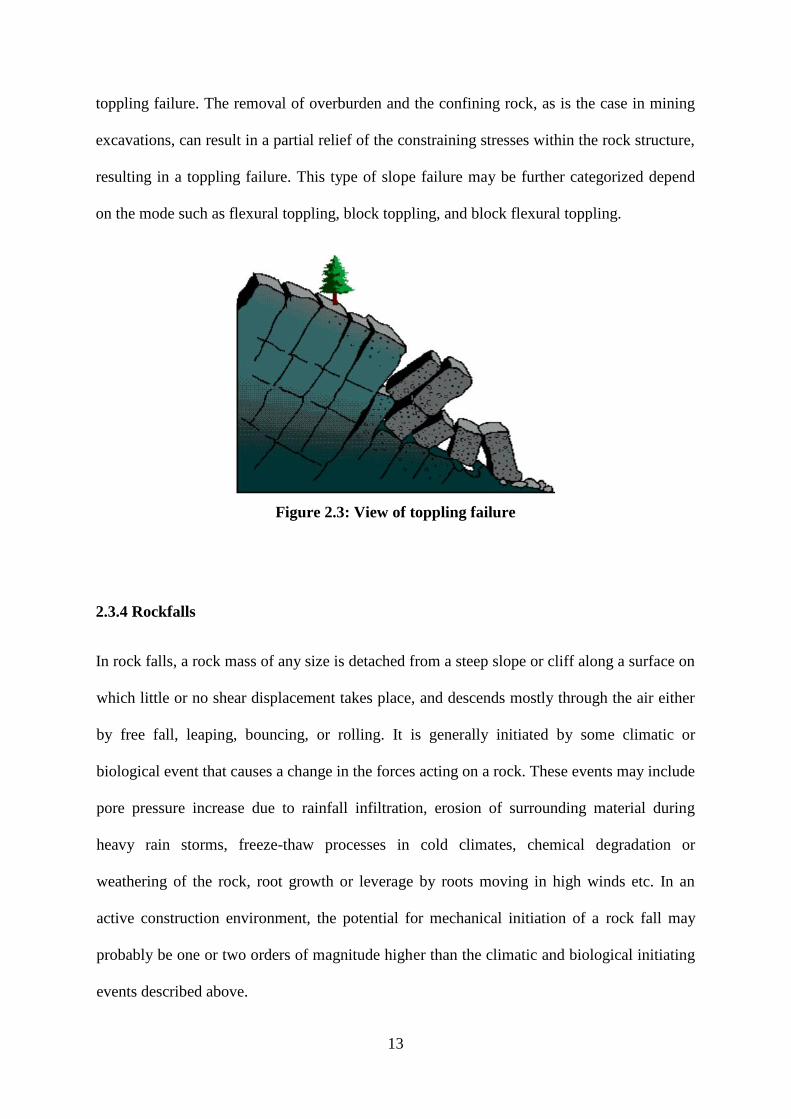
2.3.4 Rockfalls
In rock falls, a rock mass of any size is detached from a steep slope or cliff along a surface on
which little or no shear displacement takes place, and descends mostly through the air either
by free fall, leaping, bouncing, or rolling. It is generally initiated by some climatic or
biological event that causes a change in the forces acting on a rock. These events may include
pore pressure increase due to rainfall infiltration, erosion of surrounding material during
heavy rain storms, freeze-thaw processes in cold climates, chemical degradation or
weathering of the rock, root growth or leverage by roots moving in high winds etc. In an
active construction environment, the potential for mechanical initiation of a rock fall may
probably be one or two orders of magnitude higher than the climatic and biological initiating
events described above.
14
Movements are very rapid to extremely rapid. Rock fall may involve a single rock or a mass
of rocks, and the falling rocks can dislodge other rocks as they collide with the cliff.
Rockfalls are a major hazard in rock cuts for highways and railways in mountainous terrain.
Once movement of a rock perched on the top of a slope has been initiated, the most important
factor controlling its fall trajectory is the geometry of the slope. In particular, dip slope face,
such as those created by the sheet joints in granites are important, because they impart a
horizontal component to the path taken by a rock after it bounces on the slope or rolls off the
slope.
Figure 2.4: View of the Rockfalls
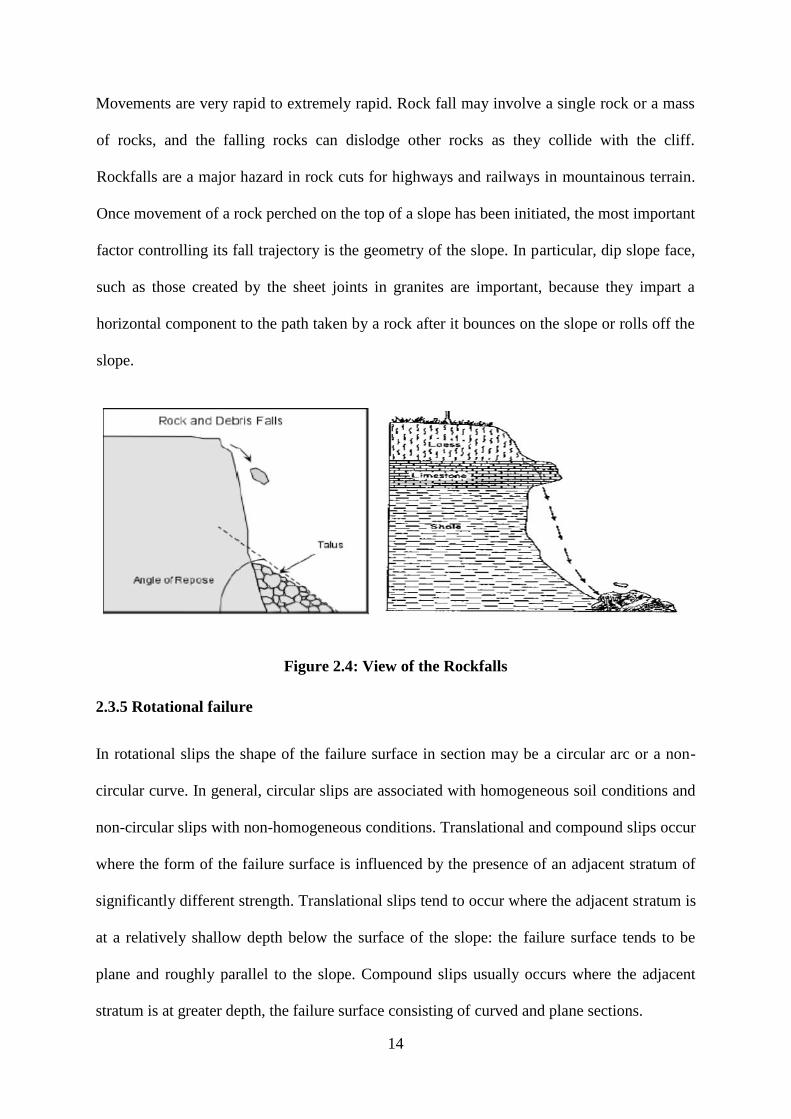
2.3.5 Rotational failure
In rotational slips the shape of the failure surface in section may be a circular arc or a non-
circular curve. In general, circular slips are associated with homogeneous soil conditions and
non-circular slips with non-homogeneous conditions. Translational and compound slips occur
where the form of the failure surface is influenced by the presence of an adjacent stratum of
significantly different strength. Translational slips tend to occur where the adjacent stratum is
at a relatively shallow depth below the surface of the slope: the failure surface tends to be
plane and roughly parallel to the slope. Compound slips usually occurs where the adjacent
stratum is at greater depth, the failure surface consisting of curved and plane sections.
15
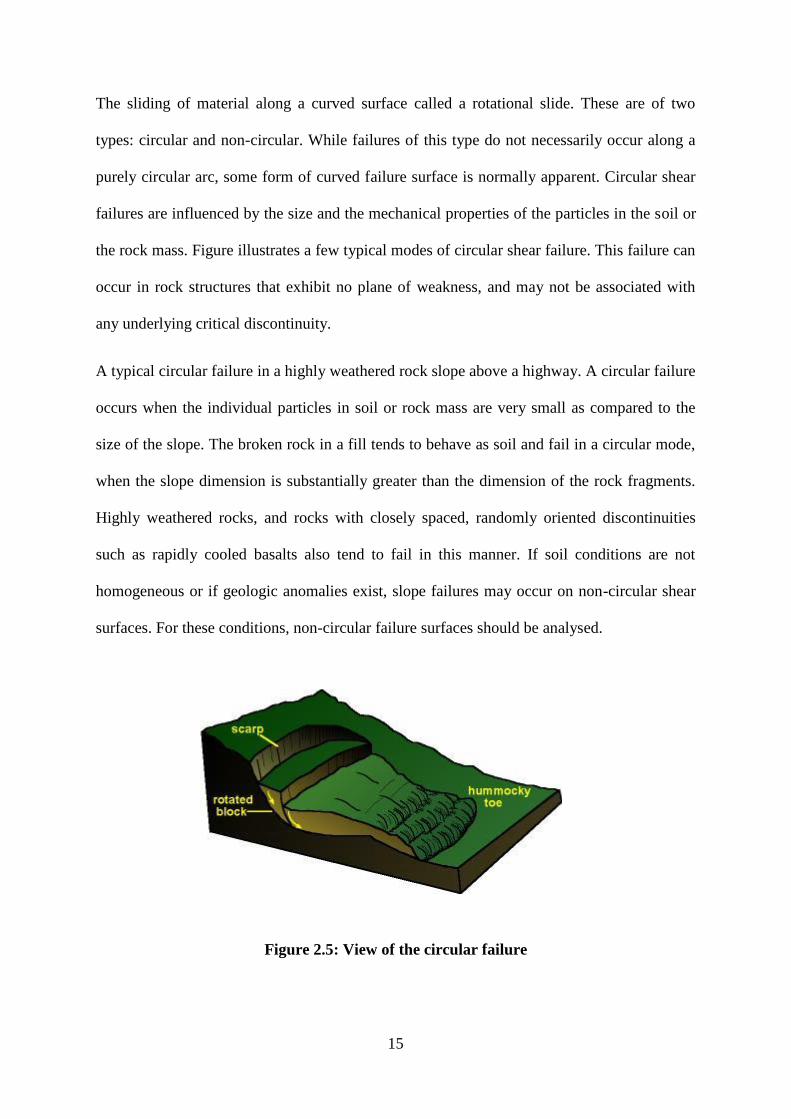
The sliding of material along a curved surface called a rotational slide. These are of two
types: circular and non-circular. While failures of this type do not necessarily occur along a
purely circular arc, some form of curved failure surface is normally apparent. Circular shear
failures are influenced by the size and the mechanical properties of the particles in the soil or
the rock mass. Figure illustrates a few typical modes of circular shear failure. This failure can
occur in rock structures that exhibit no plane of weakness, and may not be associated with
any underlying critical discontinuity.
A typical circular failure in a highly weathered rock slope above a highway. A circular failure
occurs when the individual particles in soil or rock mass are very small as compared to the
size of the slope. The broken rock in a fill tends to behave as soil and fail in a circular mode,
when the slope dimension is substantially greater than the dimension of the rock fragments.
Highly weathered rocks, and rocks with closely spaced, randomly oriented discontinuities
such as rapidly cooled basalts also tend to fail in this manner. If soil conditions are not
homogeneous or if geologic anomalies exist, slope failures may occur on non-circular shear
surfaces. For these conditions, non-circular failure surfaces should be analysed.
Figure 2.5: View of the circular failure
16
2.4 Cut Slopes
The Geotechnical Section provides rock slope endorsements for new and existing sites where
construction requires removal of bedrock in the back slope. Rock slope endorsements are
provided for new and existing rock cuts to accommodate new road alignments, widening of
roadways, or for stabilizing existing rock slopes or providing improved rock catchment.
Cut slope angles are typically derived from an evaluation of rock mass characteristics, which
can be attained from a combination of measurement made of exposed bedrock faces and an
assessment of rock cores taken by the Foundations Unit.
2.4.1 Rock cuts based on height
a) Low rock cuts (<6 ft. in height) can be treated as rock slopes or soil slopes by the
designer. Softer rock slopes may be laid back to match existing soil slopes and covered with
topsoil and vegetation. Presplitting of these low cut faces is not necessary from a Rockfalls
standpoint, but will result in a clean, durable rock face that does not deviate significantly
from the planned excavation line. Aesthetic considerations such as excavating back to natural
discontinuities in the rock face rather than presplitting are allowed, but special provision
language will need to be included that excludes presplitting.
b) Intermediate rock cuts (6 ft. to 30 ft. in height), Typical Rock Section, or may employ an
alternate design approved by the Geotechnical Engineering Section. Soft rock slopes can be
treated as soil slopes with standard ditch sections, in which case they should be covered with
topsoil and vegetation. Often, sandstone is exposed in high bluffs where it would be
impractical to cut it to a soil slope. In hard rock types, controlled blasting techniques are
required for final shaping of the cut face. The standard ditch width should be 12 feet, with a
depth of 4 feet. The resultant rock catchment area (ditch width + in slope) would be 36 feet or

17
28 feet, respectively. Composite slopes, consisting of both soft and hard rock types
(particularly with hard overlying soft) are susceptible to differential erosion and require
careful consideration. Typically, the hard rock layer will be set back 10 feet from the face of
the underlying soft rock, with an impermeable bench constructed on top of the soft rock
layer.
c) High rock cuts (>30 ft. in height) should be investigated and designed by appropriate
units of the Geotechnical Engineering Section. Investigation of rock quality and rock mass
properties (such as joint orientation and frequency) should be conducted on rock outcrops and
rock core samples to design appropriate cut slopes and ditch catchment areas. High rock cuts
require controlled blasting techniques to limit Rockfalls during construction and after
completion of the project.
d) Transitions into and out of bedrock, both transverse and longitudinal, should be provided
in the design to minimize differential settlement. Provide a minimum of 1:20 taper in the
longitudinal and 1:10 taper in the transverse directions. The District Soils Engineer or the
Geology Unit can provide recommendations for specific projects.
18
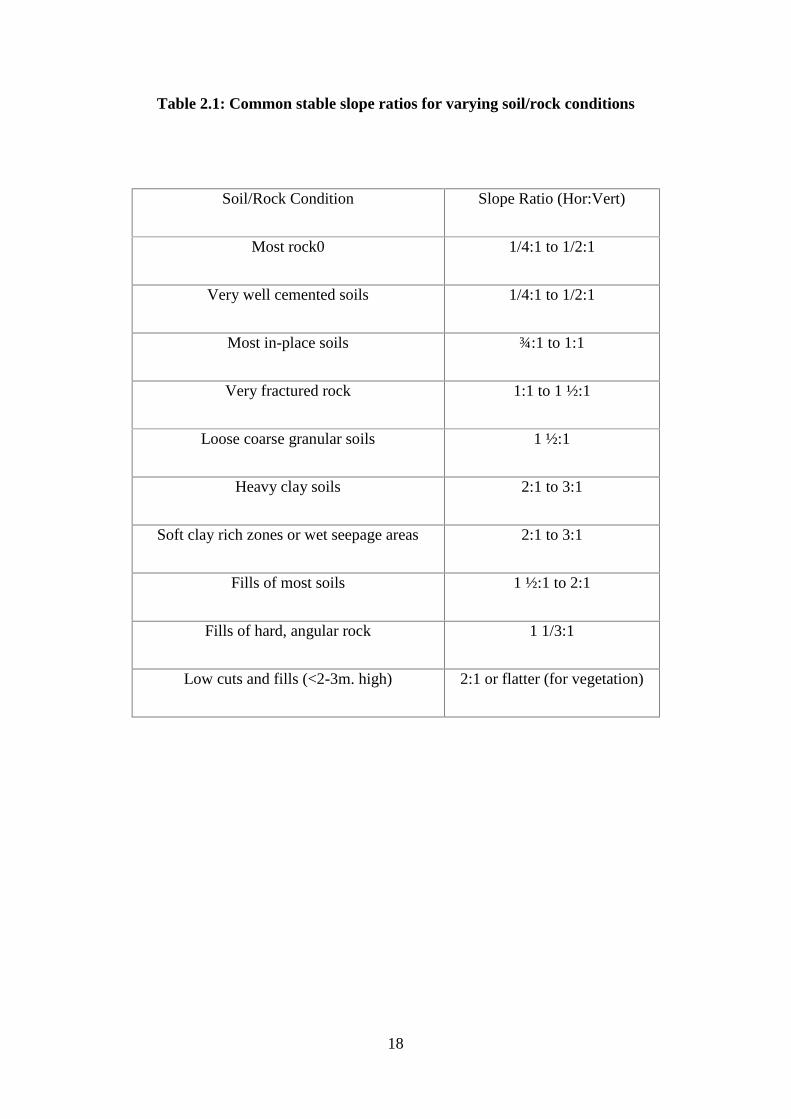
Table 2.1: Common stable slope ratios for varying soil/rock conditions
Soil/Rock Condition Slope Ratio (Hor:Vert)
Most rock0 1/4:1 to 1/2:1
Very well cemented soils 1/4:1 to 1/2:1
Most in-place soils ¾:1 to 1:1
Very fractured rock 1:1 to 1 ½:1
Loose coarse granular soils 1 ½:1
Heavy clay soils 2:1 to 3:1
Soft clay rich zones or wet seepage areas 2:1 to 3:1
Fills of most soils 1 ½:1 to 2:1
Fills of hard, angular rock 1 1/3:1
Low cuts and fills (<2-3m. high) 2:1 or flatter (for vegetation)
19
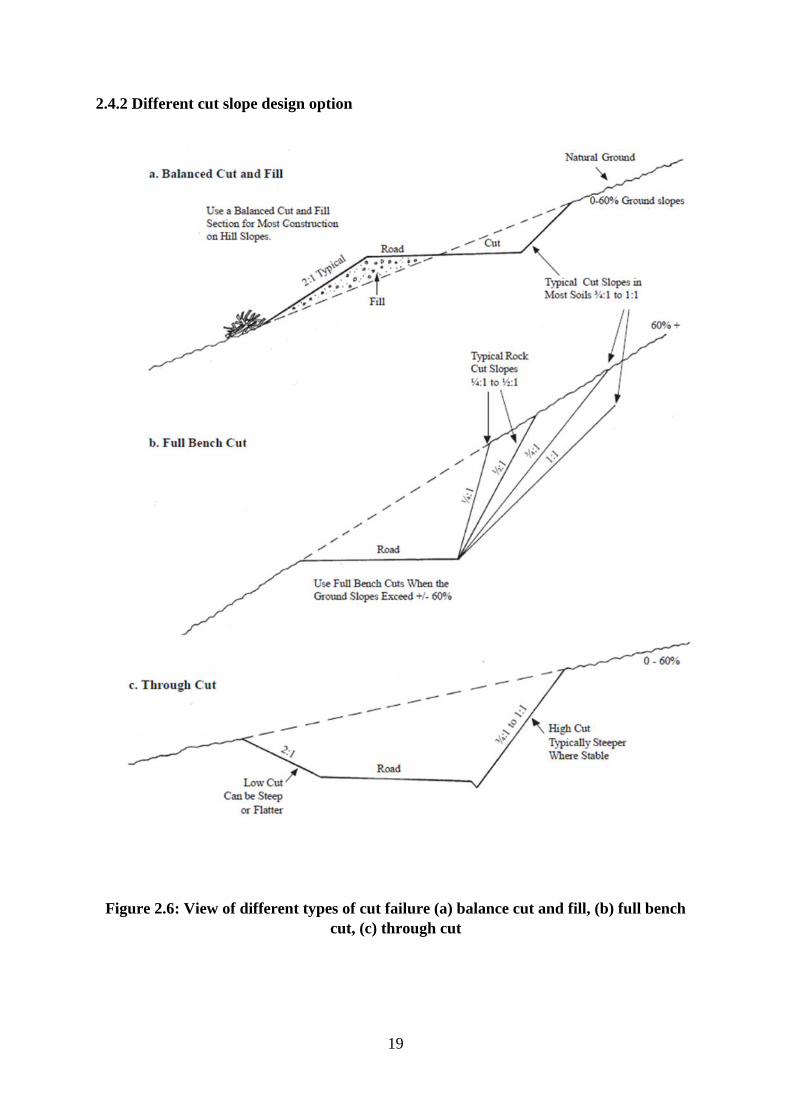
2.4.2 Different cut slope design option
Figure 2.6: View of different types of cut failure (a) balance cut and fill, (b) full benchcut, (c) through cut
20
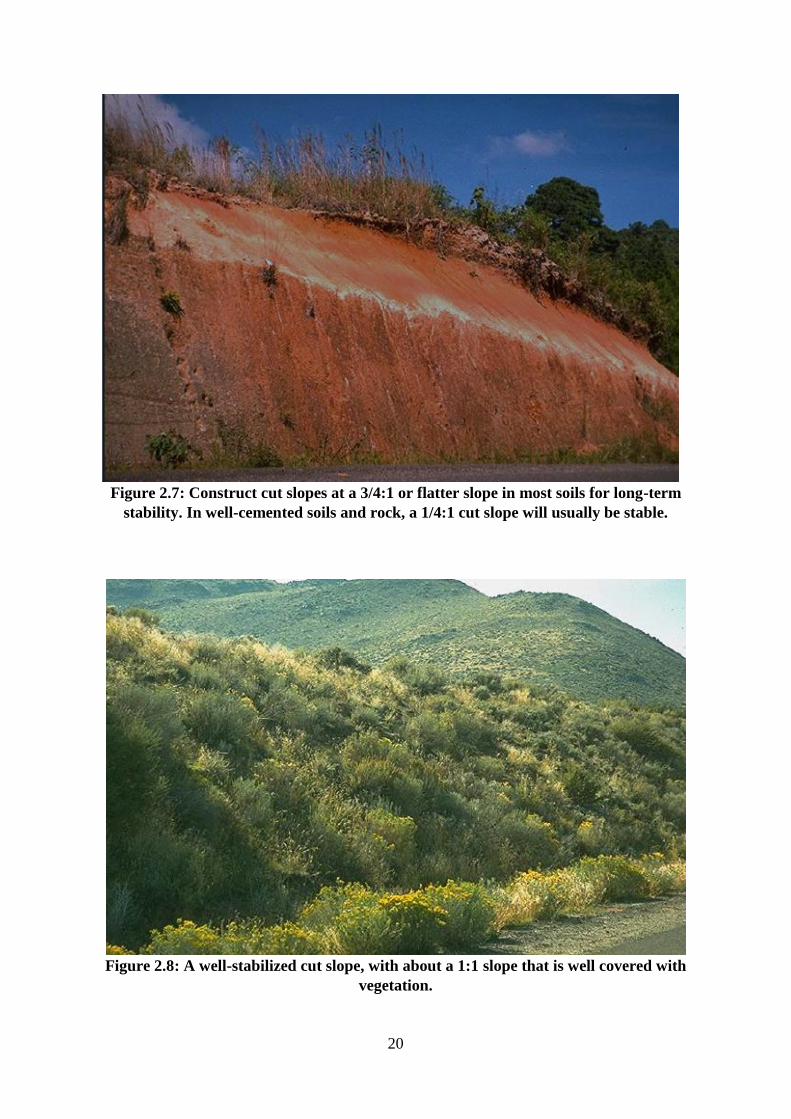
Figure 2.7: Construct cut slopes at a 3/4:1 or flatter slope in most soils for long-termstability. In well-cemented soils and rock, a 1/4:1 cut slope will usually be stable.
Figure 2.8: A well-stabilized cut slope, with about a 1:1 slope that is well covered withvegetation.

21
Figure 2.9: Avoid loose, overstep fill slopes (steeper than 1 1/5:1), particularly alongstreams and at drainage crossings
Figure 2.10: (a) Lateritic soil capping at the top of the Mahabaleshwar plateau, (b)discontinuity orientation in the area.
22
2.5 Types of Slope Movement
2.5.1 Initial response
When a slope is excavated or exposed, there is a period of initial response as a result of
elastic rebound or relaxation of stress. This initial response is most common in any open pit
mines which is having rapid excavation rate. The amount of such initial response may vary
from 150mm to 500 mm depending upon types of rock mass reported by Martin (1993). The
rates of movement during initial response period decreased with time and ultimately indicate
no movement.
2.5.2 Regressive and progressive movement
Subsequent the period of initial response, slope failure can be signposted by development of
tension cracks near the crest of the slope. The development of such cracks is evidence that the
movement of the slope has exceeded the elastic limit of the rock mass. Conversely, it is
possible that mining can safely continue under these conditions with the enactment of a
monitoring system. Ultimately, an “operational slope failure” may develop which can be
described as a condition, where the rate of displacement exceeds the rate at which the slide
material can be safety mined.
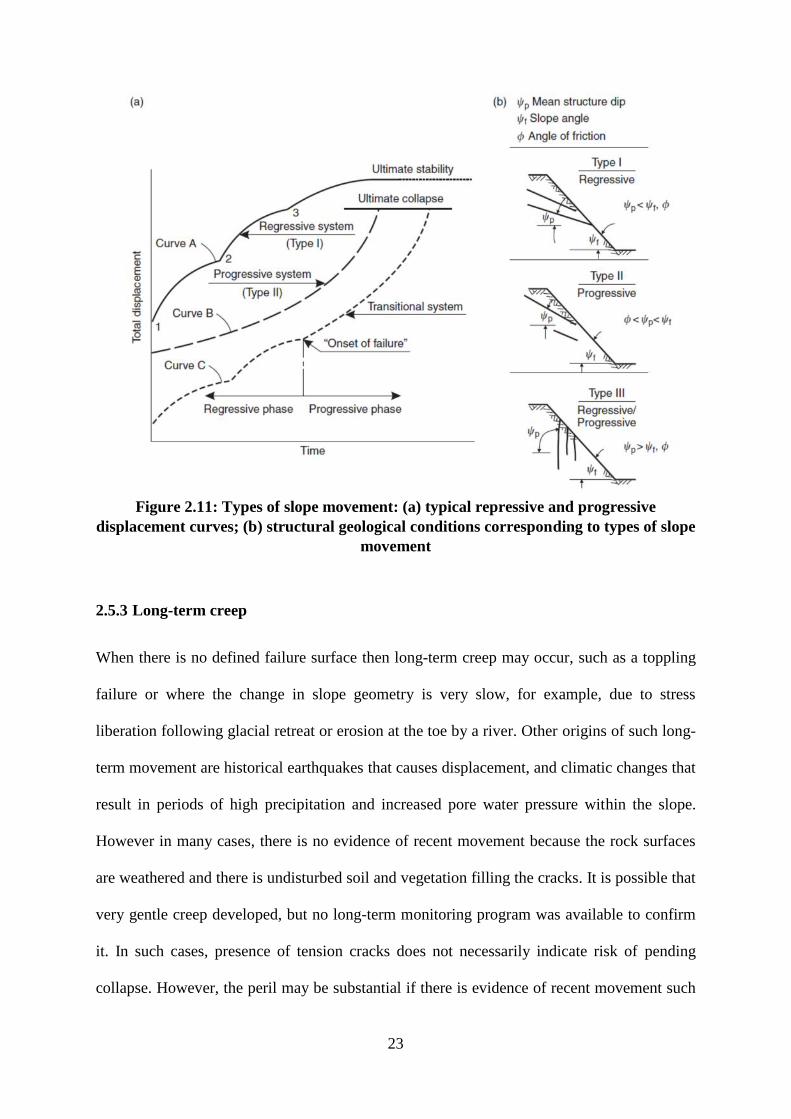
Displacement curves may be used as a practical means for differentiating plastic strain of the
rock mass from operational failure of the slope this is the clear difference between regressive
and progressive time. Short-term decelerating displacement cycles is shown by regressive
failure if disturbing events external to the slope, such as blasting or water pressure, are
removed. Conversely displacement at an increasing rate is caused by progressive failure,
unless stabilization measures are implemented. Correct interpretation of the curves is
valuable in understanding the slope failure mechanism and predicting the future performance
of the slope.
23
Figure 2.11: Types of slope movement: (a) typical repressive and progressivedisplacement curves; (b) structural geological conditions corresponding to types of slope
movement
2.5.3 Long-term creep
When there is no defined failure surface then long-term creep may occur, such as a toppling
failure or where the change in slope geometry is very slow, for example, due to stress
liberation following glacial retreat or erosion at the toe by a river. Other origins of such long-
term movement are historical earthquakes that causes displacement, and climatic changes that
result in periods of high precipitation and increased pore water pressure within the slope.
However in many cases, there is no evidence of recent movement because the rock surfaces
are weathered and there is undisturbed soil and vegetation filling the cracks. It is possible that
very gentle creep developed, but no long-term monitoring program was available to confirm
it. In such cases, presence of tension cracks does not necessarily indicate risk of pending
collapse. However, the peril may be substantial if there is evidence of recent movement such
24
as movement of blocks of rock and disturbance to the soil, or there is an anticipated change to
the forces acting on the slope, due to excavation at the toe.
2.6 Slope Stability Monitoring Methods
In general, sub-surface measurements that require drilling holes to install the instruments and
maintain than that of is more costly than the monitoring of the surface of a slide. However,
surface measurements can only be used where the surface movement precisely represents the
overall movement of the slope. Other factors to consider in the selection of a monitoring
system include the time available to set up the instruments, the rate of movement and the safe
access to the site. Geodetic and terrestrial surveying includes the techniques, imaging
techniques such as photogrammetry, and the use of satellite-based positioning techniques
such as GPS. Ground-based radar interferometry, satellite-based radar interferometry, micro-
seismic emissions and laser scanning are the other techniques.
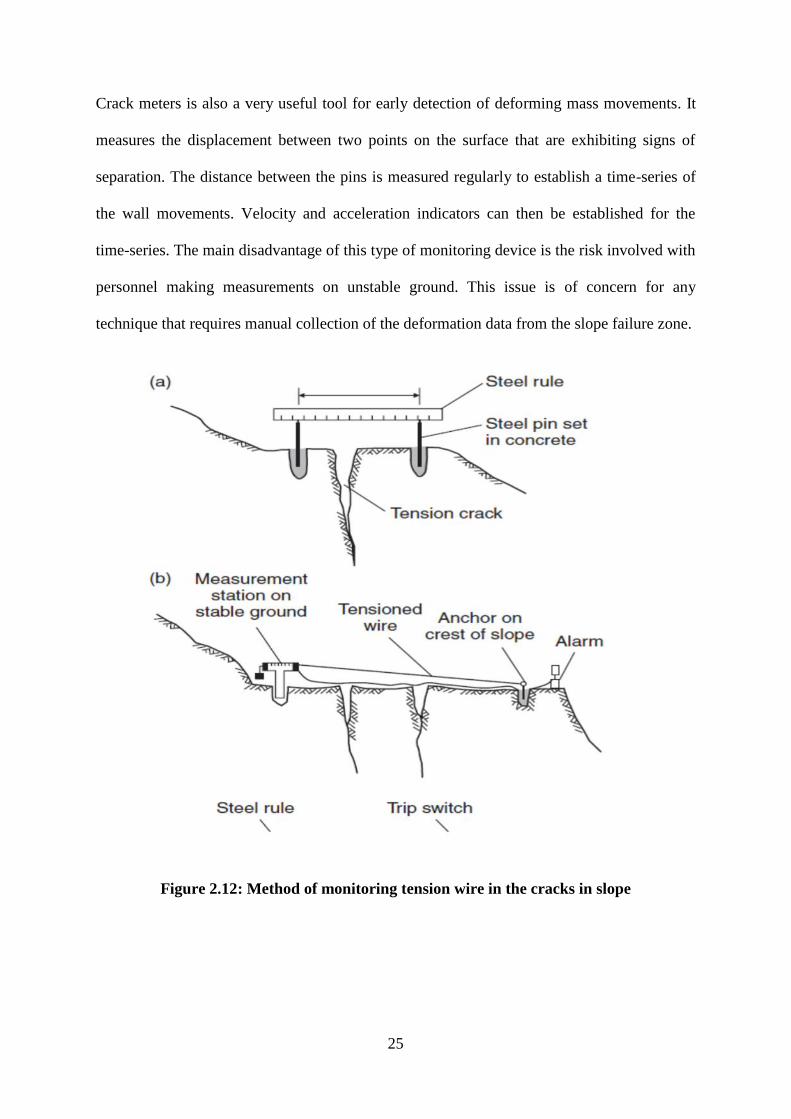
2.6.1 Crack monitors
Measurement of width of the crack developed due tensile failure of the slope is a reliable and
inexpensive means of monitoring slope movement. Two methods of measuring crack widths.
The simplest procedure is to install a pair of pins on either side of the crack and measure the
distance between them with a steel tape. If there are two pins on either side of the crack, then
the linear distance can also be measured to check the transverse displacement. The maximum
practical distance between the pins is probably 2 m. A wire extensometer that can be used to
measure the total movement across a series of cracks over a distance of as much as 20 m. The
measurement station is located on stable ground beyond the cracks, and the cable extends to a
pin located on the crest of the slope. The cable is tensioned using a proper weight, and
movement is measured by the position of the steel block threaded on the cable.
25
Crack meters is also a very useful tool for early detection of deforming mass movements. It
measures the displacement between two points on the surface that are exhibiting signs of
separation. The distance between the pins is measured regularly to establish a time-series of
the wall movements. Velocity and acceleration indicators can then be established for the
time-series. The main disadvantage of this type of monitoring device is the risk involved with
personnel making measurements on unstable ground. This issue is of concern for any
technique that requires manual collection of the deformation data from the slope failure zone.
Figure 2.12: Method of monitoring tension wire in the cracks in slope

26
2.6.2 Surveying
On large slides where access to the slope is hazardous and there is a need to make frequent
and precise measurements and rapidly analyse the results, surveying is the most suitable
monitoring method. There are three components of a survey system.
1. One or several reference points on stable ground, which can be viewed from the instrument
stations closer to the slide.
2. A number of instrument stations set up on reasonably stable ground at locations from
which the slide is visible. If the co-ordinate positions of the movement stations are to be
measured, then the instrument stations should be arranged such that they form an
approximately equilateral triangle.
3. A series of stations set up just outside the slide area, located relative to the instrument
stations. It is preferable that the measurement direction be in the likely direction of movement
so that the distance readings approximate the actual slide movements.
Figure 2.13: Survey system to remotely measure slope movement
27
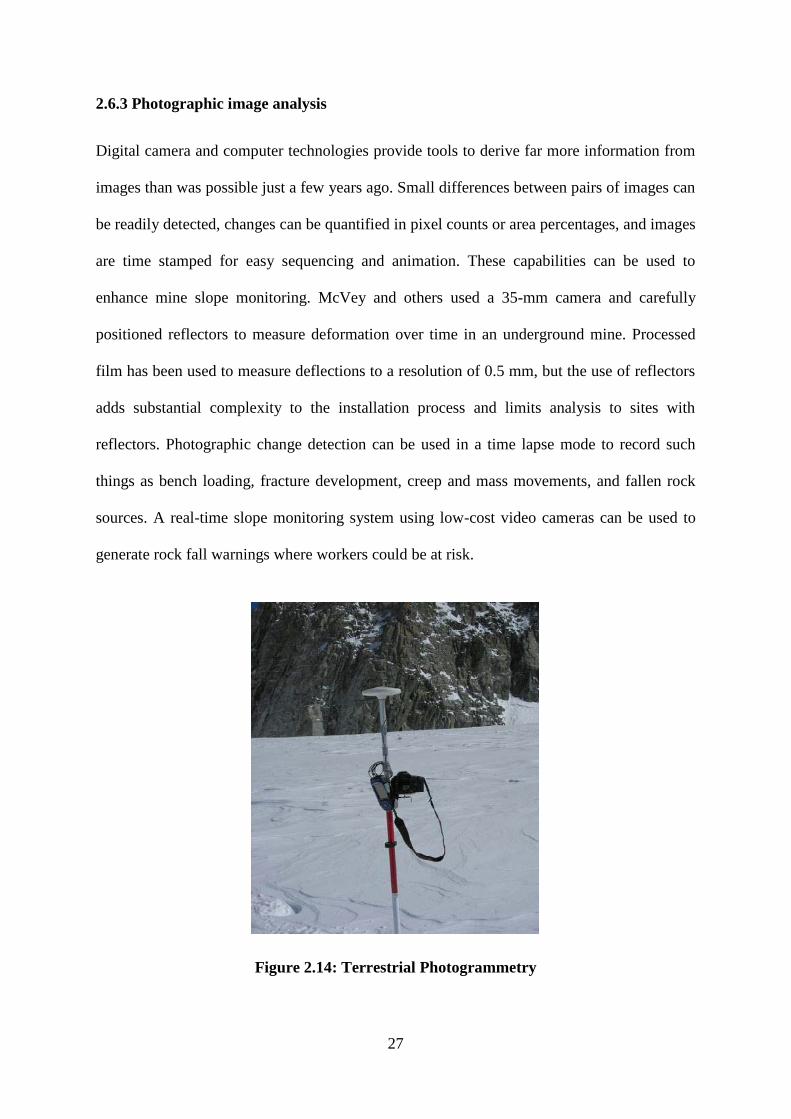
2.6.3 Photographic image analysis
Digital camera and computer technologies provide tools to derive far more information from
images than was possible just a few years ago. Small differences between pairs of images can
be readily detected, changes can be quantified in pixel counts or area percentages, and images
are time stamped for easy sequencing and animation. These capabilities can be used to
enhance mine slope monitoring. McVey and others used a 35-mm camera and carefully
positioned reflectors to measure deformation over time in an underground mine. Processed
film has been used to measure deflections to a resolution of 0.5 mm, but the use of reflectors
adds substantial complexity to the installation process and limits analysis to sites with
reflectors. Photographic change detection can be used in a time lapse mode to record such
things as bench loading, fracture development, creep and mass movements, and fallen rock
sources. A real-time slope monitoring system using low-cost video cameras can be used to
generate rock fall warnings where workers could be at risk.
Figure 2.14: Terrestrial Photogrammetry
28
2.6.4 Total station
Total station consists of a device to measure horizontal and vertical angles, along with
capability to measure distance with help of Electromagnetic Distance Measurement (EDM)
system. This allows the surveyor to measure 3D coordinates of points remotely, typically
targeted by the placement of reflective prisms. It also permits recording of the data in a
digital format to be later downloaded or transmitted to a central processing site. The latest
total station instruments are equipped with servo-motors and automatic target recognition
algorithms that reduce the need for personnel to physically record the observations.
Additionally, due to the introduction of reflector less instruments, survey prisms are no
longer required at the slope surface. One advantage of using total stations to monitor surface
deformation is that the measurements can provide 3D position solutions of the point of
interest.
2.6.5 Global Positioning System (GPS)
GPS is a radio navigation, timing and positioning system based on a constellation of 24
satellites in orbit around the earth at altitudes of approximately 20000 km. These satellites
emit continuous electromagnetic waves coded on two frequencies (L1 = 1.2 GHz and L2 =
1.5 GHz). If the positions of the satellites on their orbits are precisely known and if the
antenna collects at least four satellites, the receiver can solve by trilateration the three
unknown factors (longitude, latitude, and height, or X, Y, Z coordinates) defining its position.
For deformation monitoring, the GPS can be used in two different modes. The first method
involves high precision static methods such as Continuously Operating Reference Systems
(CORS) that are used to monitor regional scale deformations such as crustal dynamics,
subsidence and geotechnical movements. These continuous systems are normally combined
29
to form permanent networks. The second class of GPS technique is the use of episodic GPS
data commonly used for monitoring on a smaller scale (with baselines up to a few
kilometres). The use of the episodic technique commonly includes the monitoring of dams,
open-pit mine walls and landslides. The primary technical differences between the two GPS
monitoring classes are the permanency of the GPS receiver locations and the processing
strategies employed to obtain deformation solutions.
GPS does not require direct line of sight between stations. The antennas, however, must have
good sky visibility, to receive the satellite signals without interference. It can work regardless
of weather conditions, and may be used with rain, mist or fog, strong sunshine, or at night. It
can easily cover larger areas than conventional surveying methods, with high precision.
2.6.6 Acoustic emission technique
The failure process of a rock slope is a transient phenomenon. Therefore, the rock slope
undergoes fracture process irrespective to the duration of the deformation. During this
process, low intensity elastic wave in the form of energy level are generated in the rock. The
acoustic emission (AE) monitoring technique detects such waves generated due to initiation,
formation and growth and coalescence of cracks. The characteristics of acoustic wave signal
can be analysed to evaluate the location of the high energy zone. Further the intensity of the
acoustic emission, dominant frequency and other associated wave characteristics can be used
to access the propensity of an impending slope failure.
This techniques segregation of useful signal and filter of noise signal along with proper
installation of Acoustic emission sensor for a meaningful use of the system. Detection of
acoustic emission signal is very difficult in soil material and characteristics of waves
propagating are different from that in the rock. Therefore, the system requires considerable

30
knowledge of wave characteristic in different mediums for reliable analysis. It provides good
results in hard rock mass.
2.6.7 Laser image scanning system
3-D laser scanning has recently become popular in the mining industry because of its high
precision and speed, which surpasses that of the traditional single-point measurement
method. This technique captures the integrated, comprehensive, consecutive and associated
panoramic coordinate data with high precision. It also describes factually the frame and
configuration of the object. Therefore, the resulting estimates are closer to actual conditions.
The rescale range analysis method and a 3-D laser image scanning system are used to obtain
slope data. From this, the characteristic slope displacement may be analysed.
A 3-D laser scanning system is capable to predict slope failure with better accuracy.
However, the exact identification of a corresponding point in scan is a problem in this
method.
Figure 2.15: 3D-Scanner
31
2.6.8 Time Domain Reflectometry
Time–domain reflectometry (TDR) is another technique of locating a sliding surface, which
can also monitor the rate of movement. This method involves grouting into a borehole, a co-
axial cable comprising inner and outer metallic conductors separated by an insulating
material. When a voltage pulse waveform is sent down the cable, it is reflected at a point
where there is a change in the distance between the conductors. The reflection occurs because
the change in distance alters the characteristic impedance of the cable. Movement of a sliding
plane that causes a crimp or kink in the cable is sufficient to change the impedance, enabling
the instrument to detect the location of the movement. TDR has proven an economical way to
locate shear planes in active slides of both soil and rock masses. Using innovative cable
placement, multiple shear planes can be detected. Even tension cracks can be detected from
horizontal cable placement.
The primary advantage of this technique is that the cable is inexpensive so it can be sacrificed
in a rapidly moving slide mass. Also, the readings can be obtained in a few minutes from
remote location either by extending the cable to a safe location off the slide, or by telemetry.
The ability to make remote readings can achieve significant savings compared to
inclinometers because of the reduced travel time. The readout box directly shows the
movement without the need to download and plot the results.
When combined with in-place tiltmeters and a datalogger, TDR can be used to determine the
depth and direction of movement. Biaxial tiltmeters provide direction, while the TDR cable
locates the depth at which movement is expected. The datalogger can be programmed to turn
on the TDR cable tester and read the coaxial cable and the tiltmeters. A base station can be
programmed to access the data through telemetry.

32
Figure 2.16: Working mechanism of TDR system
Figure 2.17: Computer aided data acquisition form TDR system.

33
2.7 Numerical Modelling
2.7.1 OASYS
The primary function of this software is to analyse the slope stability. An option is available
in this software to include the soil reinforcement and calculate earth pressure and bearing
capacity problems. We can model both soil and rock slopes which shows circular as well as
non-circular failure.
2.7.1.1 Stages in calculating factor of safety
A new model wizard is created and all the required details and description of the model
is given.
Then material properties are defined and stratums are created. We also have to specify
the pore water pressure.
Then the slip surfaces are defined and specifications about the circle radius is given.
Here by default the minimum number of slices to be taken for analysis is 25 and
maximum iteration is 300. These figures are flexible.
After defining all the above steps, we analyse the model and this gives all the possible
slip surface and displays the minimum factor of safety.
2.7.1.2 Procedure of calculating factor of safety
For Circular failure, the method of analysis in OASYS software is as follows:
Bishop’s horizontal inter-slice forces method.
Bishop’s parallel inclined inter-slice forces method.
Bishop’s variably inclined inter-slice forces method.
34
Bishop’s variably inclined inter-slice forces method gives accurate analysis, so usually this
method is preferred for factor of safety calculation. This method assumes that each slice is in
a state of horizontal and vertical equilibrium. Also moment equilibrium exists for each slice.
An initial factor of safety is assumed. Now the iteration starts and after each round of
iteration, the inclinations of the inter-slice forces are varied (but individual stability of each
slice is not affected), to arrive at an overall horizontal, vertical and moment equilibrium. As
we are changing the inclination of inter-slice force, the driving and resisting forces change.
This changes the factor of safety until the factor of safety of previous iteration and current
iteration is less than a specified value. After this the minimum factor of safety is displayed.
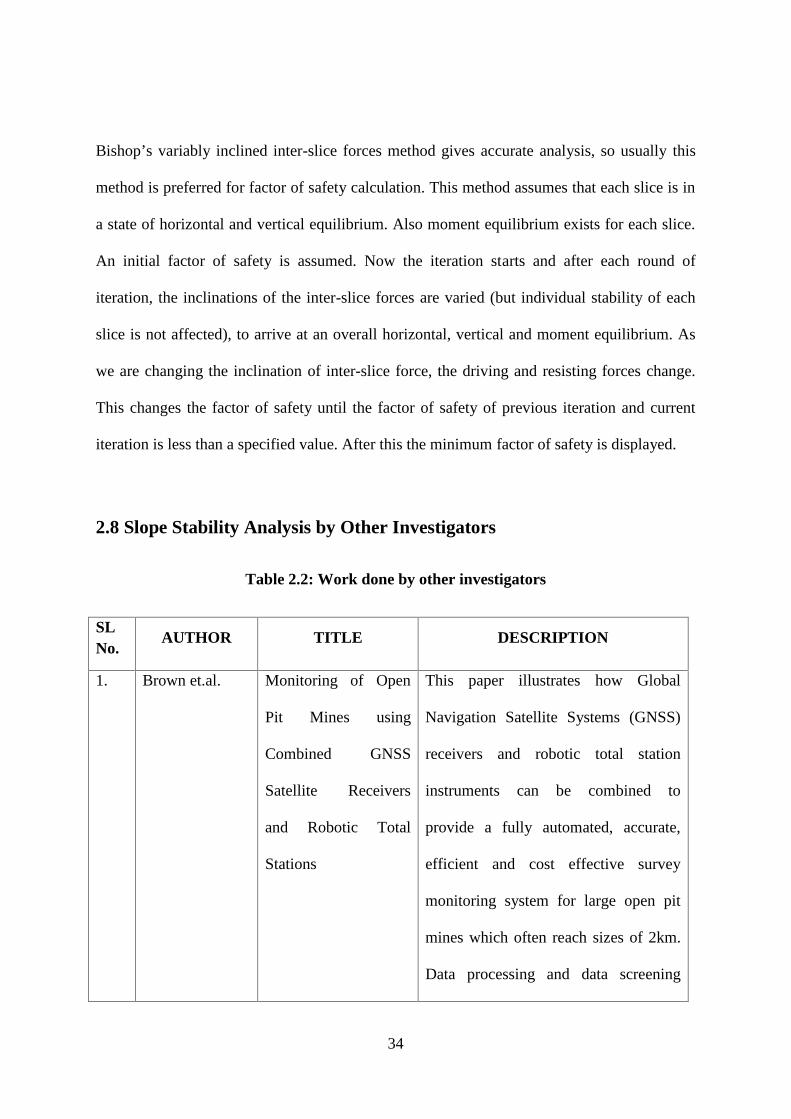
2.8 Slope Stability Analysis by Other Investigators
Table 2.2: Work done by other investigators
SLNo.
AUTHOR TITLE DESCRIPTION
1. Brown et.al. Monitoring of Open
Pit Mines using
Combined GNSS
Satellite Receivers
and Robotic Total
Stations
This paper illustrates how Global
Navigation Satellite Systems (GNSS)
receivers and robotic total station
instruments can be combined to
provide a fully automated, accurate,
efficient and cost effective survey
monitoring system for large open pit
mines which often reach sizes of 2km.
Data processing and data screening

35
techniques that can be used to ensure
the high accuracy are reviewed and in
addition, practical considerations
relating to the design and deployment
of the system are presented. Empirical
results from a 20 day trial installation
are used to illustrate the accuracy of the
system and show that such a system is
able to reliably provide accurate
deformation measurements of the
slopes in an operational environment.
2. F.T. Cawood et.
al.
Slope Monitoring
using Total Station:
What are the
Challenges and How
Should These be
Mitigated?
The purpose of this study is first, to
provide a mine survey perspective on
the typical problems that can be
expected during slope monitoring using
total station (also known as prism
monitoring) and second, to suggest
ways of mitigating such problems. The
aim is to create awareness of the
implications of incorrect use or
negligence during slope monitoring
surveys utilising a total station
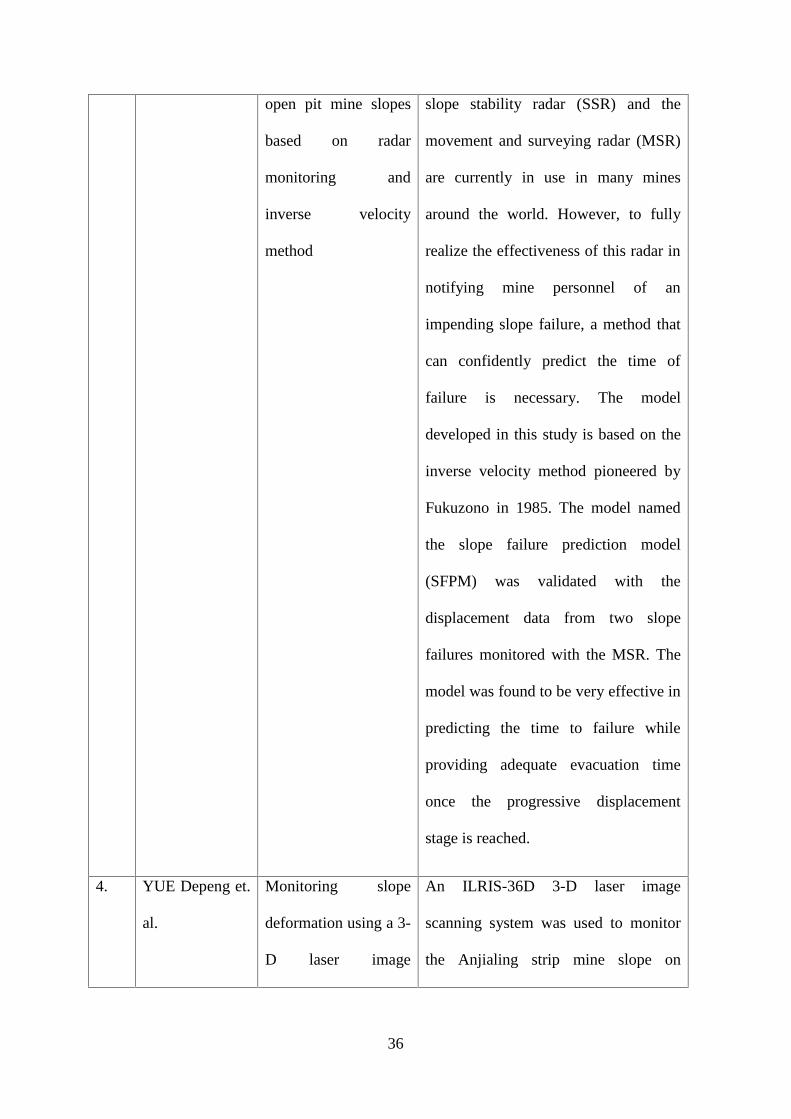
3. Osasan K.S. et.
al.
Automatic prediction
of time to failure of
Radar slope monitoring is now widely
used across the world, for example, the
36
open pit mine slopes
based on radar
monitoring and
inverse velocity
method
slope stability radar (SSR) and the
movement and surveying radar (MSR)
are currently in use in many mines
around the world. However, to fully
realize the effectiveness of this radar in
notifying mine personnel of an
impending slope failure, a method that
can confidently predict the time of
failure is necessary. The model
developed in this study is based on the
inverse velocity method pioneered by
Fukuzono in 1985. The model named
the slope failure prediction model
(SFPM) was validated with the
displacement data from two slope
failures monitored with the MSR. The
model was found to be very effective in
predicting the time to failure while
providing adequate evacuation time
once the progressive displacement
stage is reached.
4. YUE Depeng et.
al.
Monitoring slope
deformation using a 3-
D laser image
An ILRIS-36D 3-D laser image
scanning system was used to monitor
the Anjialing strip mine slope on

37
scanning system: a
case study
Pingshuo in Shanxi province. The basic
working principles, performance
indexes, features and data collection
and processing methods are illustrated.
The point cloud results are analysed in
detail. The rescale range analysis
method was used to analyse the
deformation characteristics of the
slope. The results show that the trend of
slope displacement is stable and that
the degree of landslide danger is low.
This work indicates that 3-D laser
image scanning can supply multi-
parameter, high precision real time data
over long distances. These data can be
used to study the distortion of the slope
quickly and accurately.
5. Emily Cosser et.
al.
Measuring the
dynamic deformation
of bridges using a
total station
It is well known that long term
movements of structures can be
monitored using a total station.
Measurements are taken over minutes,
hours or weeks to a number of targets
to measure settlement or long term
permanent deformations. At the
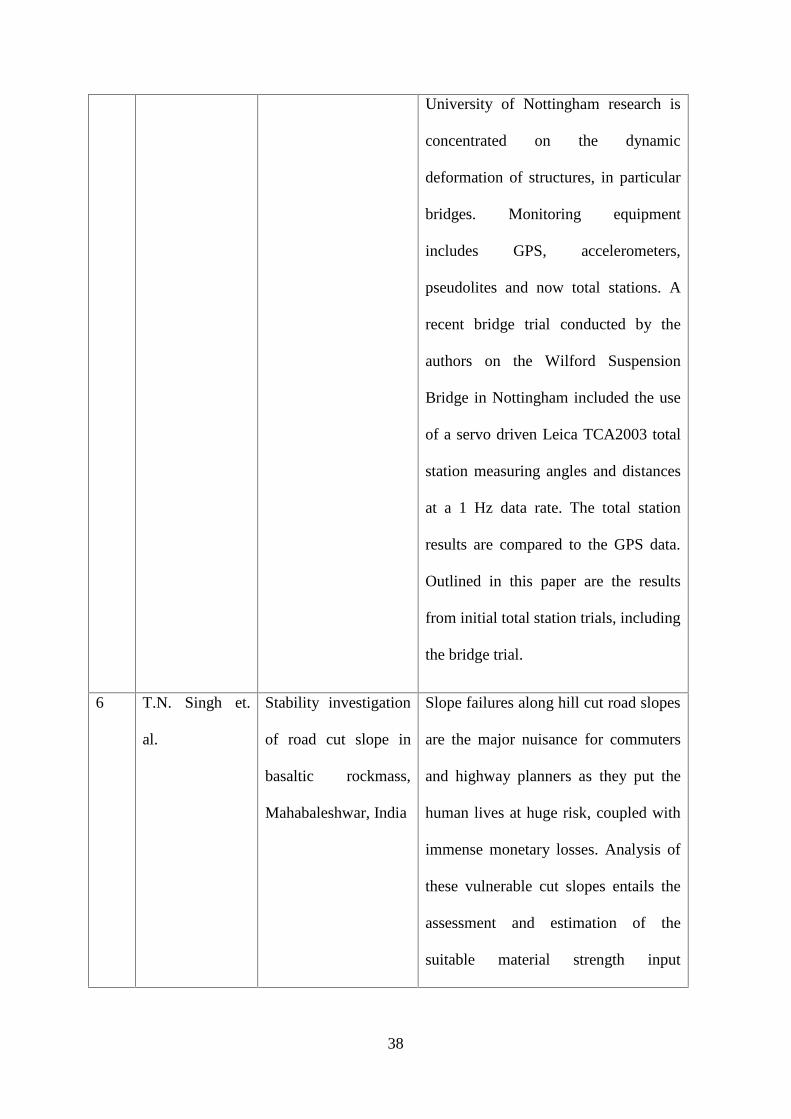
38
University of Nottingham research is
concentrated on the dynamic
deformation of structures, in particular
bridges. Monitoring equipment
includes GPS, accelerometers,
pseudolites and now total stations. A
recent bridge trial conducted by the
authors on the Wilford Suspension
Bridge in Nottingham included the use
of a servo driven Leica TCA2003 total
station measuring angles and distances
at a 1 Hz data rate. The total station
results are compared to the GPS data.
Outlined in this paper are the results
from initial total station trials, including
the bridge trial.
6 T.N. Singh et.
al.
Stability investigation
of road cut slope in
basaltic rockmass,
Mahabaleshwar, India
Slope failures along hill cut road slopes
are the major nuisance for commuters
and highway planners as they put the
human lives at huge risk, coupled with
immense monetary losses. Analysis of
these vulnerable cut slopes entails the
assessment and estimation of the
suitable material strength input
39
parameters to be used in the numerical
models to accomplish a holistic
stability examination. For the present
study a 60 m high, basaltic and lateritic
road cut hill slope in Mahabaleshwar,
India, has been considered. A number
of samples of both basalt and laterite, in
their natural state were tested in the
laboratory and the evaluated maximum,
minimum and mean strength
parameters were employed for the three
cases in a distinct element numerical
model. The Mohr-Coulomb failure
criterion has been incorporated in the
numerical model for the material as
well as the joints. The numerical
investigation offered the factor of
safety and insights into the probable
deformational mechanism for the three
cases.
Beside, several critical parameters have
also been judged from the study viz.,
mode of failure, factor of safety, shear
strain rate, displacement magnitudes

40
etc. The result of this analysis shows
that the studied section is prone to
recurrent failures due to the capping of
a substantially thick layer of weaker
lateritic material above the high
strength basaltic rock mass. External
triggering mechanisms like heavy
precipitation and earthquake may also
accelerate the slope failure in this area.
The study also suggests employing
instant preventive measures to avert the
further risk of damage
41
2.9 Total Station
2.9.1 Slope monitoring using total station
Slope monitoring using total station comprises of three components. Firstly, a network of
reference beacons is required on stable ground that can be observed from the transfer (i.e.
instrument) station. Secondly, a number of transfer stations are established on stable ground
at locations from which the slope surface is visible. If the positions of the monitoring points
are to be measured, then the transfer stations should be arranged so that they form a suitable
survey network for optimal line-of-sight and a robust network. The third component involves
installation of monitoring prisms at the suspected likely unstable slope zone or area of
interest. It is preferable that the measurement direction is in the likely direction of movement
so that the distance readings approximate the actual slope movement. The monitoring points
on the slope can be reflectors or survey prisms, depending on the distance and the accuracy
required. The monitoring frequency depends on the nature of the rock type, operations around
the slope and the objectives of the monitoring programme in place. For slow-moving slopes,
the measurements may be taken every few weeks or even months. For a potentially rapidly-
moving slope, an automated system should be set up to take more frequent readings at pre-set
intervals as determined by the geotechnical engineer. Also, quick checks of stability can be
made by making distance measurements only. When slope movement is detected, there is
need for check surveys (using other methods such as triangulation, GPS etc.) to determine the
coordinates of each station at less frequent intervals to re-confirm measurements and ensure
they are not “outliers”.
42
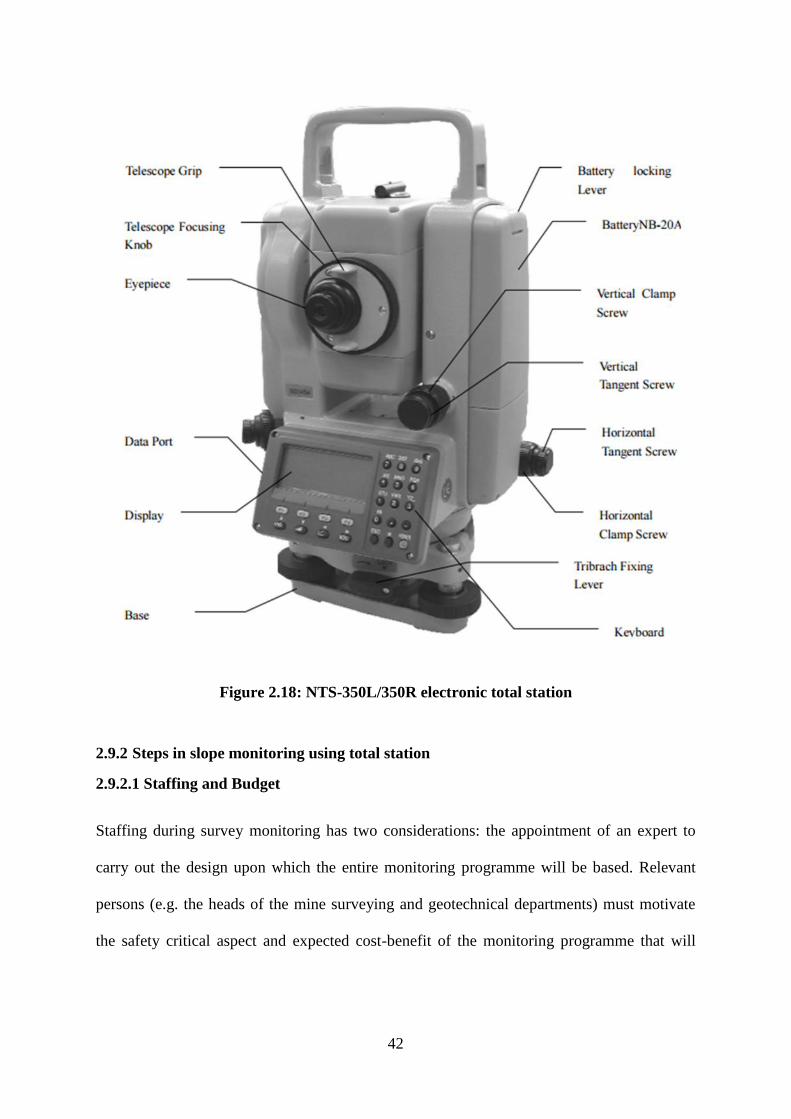
Figure 2.18: NTS-350L/350R electronic total station
2.9.2 Steps in slope monitoring using total station
2.9.2.1 Staffing and Budget
Staffing during survey monitoring has two considerations: the appointment of an expert to
carry out the design upon which the entire monitoring programme will be based. Relevant
persons (e.g. the heads of the mine surveying and geotechnical departments) must motivate
the safety critical aspect and expected cost-benefit of the monitoring programme that will
43
convince management to release adequate budget for slope monitoring. Inadequate personnel
and budgeting would lead to operational failure.
2.9.2.2 Survey system design and implementation
Slope monitoring system design must be a thorough process that takes into account adequate
information and provides a design aimed at mitigating risk. During system design, the
objective of the monitoring system must be clearly stated, coupled with the geological and
geotechnical history of the area under consideration. Detailed reconnaissance entails the
examination of published geological maps and reports, study of aerial photographs, gathering
of local experience, field visits to examine, if possible, the performance of existing slopes in
similar geological conditions, and geophysical studies if data is limited.
Design specifications are carried out in consultation with a geotechnical engineer (i.e.
expected magnitude of movement, parameters to measure, type and scale of deformation to
be monitored, purposes of various instruments, locations of equipment, desired
accuracy/precision, checks using different survey methods and equipment) have great
influence in selection of slope monitoring equipment.
2.9.2.3 Setting up control points
A control point is a point at which the coordinates (X, Y) and the elevation (Z) are known
and from which survey measurements to a number of reference points can be made. Prism
monitoring survey requires three types of points namely: transfer, reference and monitoring
points. The transfer and reference points is part of the survey control network.
For accurate monitoring, the survey control network must have a minimum grouping of four
intervisible forced-centring pillar beacons (that can form a quadrilateral) and spatially fixed
44
by a least squares adjustment. It is recommended to construct additional transfer and
reference beacons for redundancy purposes.
2.9.2.4 Construction of shelter at transfer beacon
A protective shelter must be constructed on the transfer beacon. If the transfer beacon
protective shelter is made from metal sheet, the inner part must be insulated to reduce heat
generation from sunlight. The outer part should also be painted white to reduce the effect of
heat from sunlight. They are usually housed in a protective shelter for the following reasons:
Protection from fly rock resulting from blasting operation;
Protection against dust resulting from drilling, blasting and haulage operation at the
mines;
Protection against excessive sunlight and rain; and
Theft.
2.9.2.5 Installation of monitoring point prisms
Installation of the prisms into the area of interest in the open pit is another task to be carried
out for slope monitoring. The installation of the prisms must be performed when the bench is
still accessible. It is compulsory that the installation of the prisms is done at the early stage of
the mining operations in areas where there are faults and there is likelihood of slope failure.
Holes are drilled into the bench face and then cleaned to remove all dust in the hole before
grouting in a prism rod. Injected grouting material can be used to seal the drilled hole after
inserting the metal rod that holds the prism and its protective (metal) hood. The moveable
plastic arms (U-shaped) that hold the prism can be made rigid by applying silicon sealant (or
an adhesive to keep the prism in place) before installation. In terms of consistency and
uniformity of error propagation, all prisms (or reflectors) must be identical.

45
2.9.2.6 Data Collection and Processing thereof
The two types of data are summarized below:
Total station measurements: horizontal, slope and vertical distances readings, and
angular (horizontal angle, Hz and vertical angle, V) readings.
Data external to total station: Atmospheric conditions (i.e. ambient temperature,
atmospheric pressure and humidity), observation glass properties, etc.
Data from these two sources must be integrated and processed before a meaningful survey
result can be achieved. Such data is processed using suitable computer software. A control
centre for automated data collection and processing thereof must be established.
The final step in slope monitoring is to present the data in a manner that facilitates
interpretation and decision-making. The presentation of the monitoring data can be in form of
graphs, tables, photographs and charts (e.g. movement according to time, rainfall and
temperature variations).

46
CHAPTER 3
CASE STUDY
47
3. CASE STUDY
3.1 Description of Study Area
The National Aluminium Company is exploiting Bauxite deposit at Panchpatmalli mine. It is
one of the most important Bauxite deposit of the country, as far as grade and quality of the
ore are concerned. The importance of safe, properly designed and scientifically engineered
slope is well known. Slope stability study is not yet included as an integral part of the total
slope design in India. The subject gets importance only when slope failure takes place putting
in danger the entire mining operations or when a failure is impending. The mine is located at
about 40 km. away from Koraput district headquarter in Orissa state. It is mechanized mine
using shovel (3 & 4.5 m3) - dumper (35 T) combination with 8 to 10 m high and 20 m wide
benches. The overburden and the Bauxite are soft in nature and do not require drilling and
blasting. The total depth of the pit is 35 m. The average annual rainfall is around 1600 mm.
The water table in the mine is at about 150 m RL. The Bauxite is transported from
Panchpatmalli Mines to Alumina Plant at Damanjodi through a 14.6 km long cable belt
conveyor system. This conveyor line is passing through number of open cut areas at different
places on the way to Alumina plant.
Slope Stability Monitoring in Kharidiguda Area of NALCO mines was conducted at five
different locations including mine area and slopes adjoining cable belt conveyor. A number
of field visits were made to monitor stability of the slopes. The stability of the slopes
primarily depends on the strength properties of the slope materials and groundwater/
rainwater condition within the slope. The ground movement monitoring was carried out with
the help of the Total Station. The results of the slope monitoring at seven areas of NALCO
Mine up to May’2015.
48
3.2 Objective Of Study
Main objective of the study is Monitoring of Slope Stability at Kharidiguda Area NALCO at
the following five different locations
(1) Part-II mining area,
(2) Drive house area,
(3) Area south of drive house,
(4) Area in the form of gully erosion, which is east of drive house,
(5) Deep cut area,
Location of the ground movement monitoring stations were decided after preliminary visit to
the site and in consultation with the mine authorities for the above five locations.
3.2.1 Instrumentation for monitoring stability of slopes
The monitoring information is used for variety of crucial functions including safety control,
evaluation of current mining plans and future slope design. It provides an active input into
mine planning. The early identification of movement zones allows steps to be taken to
minimize the impact of mining on stability by the implementation of corrective measures.
The system contrasts strongly with more common `passive’ systems that frequently only
record the occurrence of an event for subsequent post-mortem examination. The active
monitoring system permits early and confident decision making by management for safety
purposes. The main objective of slope monitoring study is to detect any instability well in
advance so that any damage to men and machineries can be avoided. If the failure is
unavoidable then it can be brought down in a predictable manner. If any instability is
detected in the early stage then it can be stabilized by applying the suitable remedial measure.
If the instability is detected at a later stage then it will be very difficult to check the
instability. The slope materials are inherently weak in the mine. The consequences of slope
49
failures can be very devastating when men or heavy earth moving machines come/ work
close to an unstable zone. The slope failure can cause severe disruption to the complete
mining operations.
The slope failure never occurs suddenly. It gives sufficient signs to understand that the slope
is unstable and it can fail. Generally, the first obvious sign of instability is exhibited by the
formation of tension cracks on the crest of the slopes. It must be treated as warning of
instability. It should be noted that the order of movement near failure are large, of the orders
of meters, and not millimeters. The real hazard is not only the detection of movement in the
slope, but it is the accelerated rate movement which causes failure.
As soon as any movement is detected generally a question is asked regarding the rate of
movement at which men and machinery should be removed. Actually the rate of movement
near failure will depend on many factors including rock soil type, water pressure behind the
slope, type of discontinuity along which failure is occurring etc. For each specific condition
an empirical norm has to be established and then only it is possible to have an exact idea of
rate of movement during failure which is not so easy. So, it is only the rate of acceleration of
the movement, which can clearly tell the time to remove the men and machinery. Various
studies on over 200 slides in soil and rock concluded that complete failure has not occurred in
less than 24 hours when the rate of movement was less than 25 mm per day with the
exception of slides triggered by earthquake. The slope monitoring techniques vary widely
ranging from simple visual observations of signs of potential instability such as slope
bulging, surface fretting and the formation of tension cracks to the use of somewhat complex
instrumentation. The scale of the mining operation, ore transport system and the nature and
location of the potential slope failure decides the application of a particular technique. Survey
based methods can be used for absolute monitoring, that is determining the movement of a
50
point or points relative to some datum believed to be outside the zone of potential deforma-
tion. These include:
(a) Total Station based monitoring,
(b) Tension crack monitors.
Other monitoring methods that may find future and more widespread application include:
(a) Terrestrial Photogrammetric Methods,
(b) Global Positioning Systems, and
(c) Computerised Total Station monitoring.
Whichever is the technique used for slope monitoring, the objective is to predict future slope
instability by appropriate interpretation of Displacement - Time data and analyses of failure
mechanism. The slope monitoring based on standard surveying techniques have found wide
acceptance because of the ability to remotely monitor a wall following the establishment of
targets. Use of EDM techniques along with angular measurements have become most popular
because of the perceived advantage of only having to monitor from one location.
3.2.2 Slope stability study
The mode of failure in the slopes is categorized as a circular failure due to presence of
weathered overburden lithology.
There is unlikely adverse ground water condition in the slopes. In view of the existing
hydrological condition, the most likely geo-slope condition will be drained slope. However,
the presence of rain/ surface water may decrease the shear strength of the overburden soil, so
sensitivity analysis was done separately to determine the effect of water on factor of safety.
The slope stability must be checked regularly, as the stratigraphic layers of overburden units
are dipping in the excavation at few locations. Further, it is certainly to be expected that there
51
will be variation in different geotechnical parameters with time and the confirmation of the
input parameters must be undertaken at least once in a year.
3.3 Monitoring sites at NALCO mine
3.3.1 Slope stability of part-II mining area
The ultimate pit depth is 35 m with an overall slope angle of 60 deg. The slopes are likely to
be stable with the available shear strength parameters. Further, the pit is being back-filled
after reaching to the ultimate depth. It also increases the safety. If the proper drainage is not
provided to divert the rainwater away from the pit, i.e. the slope is left in undrained
condition, then the slopes may become unstable in rainy season.
The bench height should not be more than 10 m. The under-cutting of the slopes should be
avoided. A garland drain should be provided and properly maintained all along the pit to
divert the rain water away from the pit.
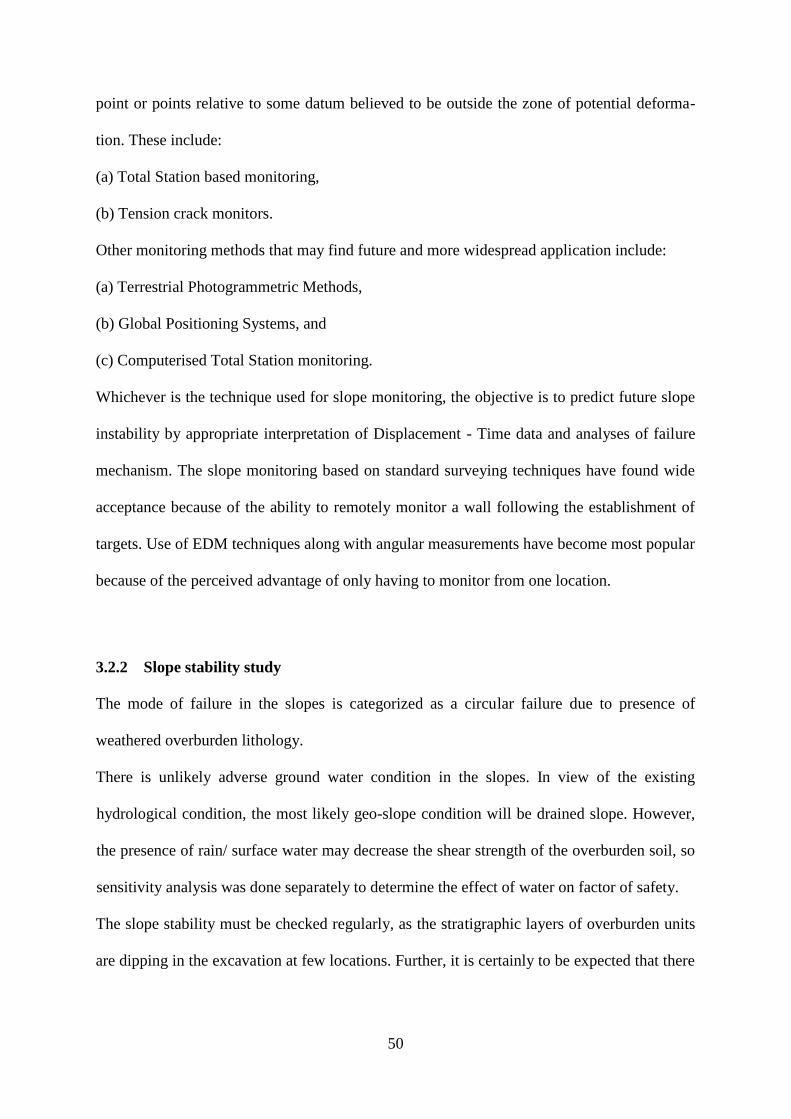
Figure 3.1: Location of south west side of part II mine area

52
3.3.2 Slope stability of drive house area and area south of drive house
The slope conditions of these two sites are almost same. The 32 m high slope of drive house
area is having an overall slope angle of 74 deg. The 24 m high slope which is south of drive
house is standing at an overall slope angle of about 70 deg.
Due to location of the M.R.S., drive house, primary crusher plant and conveyor belt, the
stability of these slopes must be ensured for smooth transport of bauxite to the alumina plant.
These are the critical areas as far as stability is concerned. One failure had already occurred
in the area south of drive house.
These slopes are likely to be stable in drained condition but are likely to be unstable in un-
drained condition. The top of the drive house area (along M.R.S. and primary crusher house)
and also south of it should be well graded to avoid water accumulation in these areas. The
accumulated water will percolate in to the slopes of these areas and may cause failure. So, the
rainwater should be channeled away from these areas. It should be implemented sincerely.
One drain is made across the slope south of drive house but its connection to the upper part of
the slope/ bench is not maintained. The mouth if the drain is blocked. Due to which the rain
water of upper bench accumulates on the lower bench. It percolates inside the slope and may
make it unsafe. The connection of bench collecting drain and across the slope drain should be
cemented and properly maintained to avoid the accumulation as well as percolation of water
in the slope for better slope stability. These across drain and bench collector drain should be
cleaned and well graded for speedy water flow to avoid any water accumulation. The garland
drain from primary crusher house to the area south of drive house should be effectively
maintained.
The undercuts have been observed at the toe level of slopes of MRS and dumper platform.
These undercuts should be filled up and should not be allowed to extend further otherwise it
may cause failure in the overlying slope mass.
53
The exposed slope mass in this area is highly weathered and is likely to fail. Loose dressing
should be done along the high slopes of drive house area to clear the exposed weak and
weathered slope mass. After loose dressing, the slope mass may be treated with gunite layer
(pneumatic spray of cement-concrete mixture) to check the weathering of the exposed slope
mass along with peep holes for free drainage. Due to paucity of the space near the drive
house, a stable and detachable structural steel barricades may also be tried to provide the
passive support to the standing slope mass.
Figure 3.2: Location of drive house area
3.3.3 Slope stability of gully erosion area: (East of drive house)
This area is steeply dipping valley in the east of drive house. A small-scale failure has
occurred in this valley slope in the rainy season. The slopes are steep and unbenched/
unterraced.
A garland drain is provided in this area but it is not being maintained properly. It results in to
accumulation of rainwater and sudden release of water after breaking any part of the drain or
by overflowing of the accumulated water at one point of drain in to the valley. It causes
heavy soil erosion, which forms deep gullies. The slopes along these deep gullies fail in due
course of time.
54
The drain must be continued throughout its course and kept effective. Any discontinuance
will jeopardise the whole effort. The valley slopes in front of drive house should be terraced.
On the upper part of the terraced valley slope, hard laterite blocks can be fixed to avoid soil
erosion due to flow of rainwater. Iron rods can be put in the valley slopes by digging. The
empty coal tar drums can be put through these rods. These coal tar drums should then be
filled with weathered lateritic material. This process will help in making terraces along the
valley slopes. It will stop the momentum of rainwater flow and hence the erosion of the
valley soil slope material. The fast growing and self-sustaining local plant species should be
grown along the slopes for soil stabilisation.
3.3.4 Slope stability of deep cut area
This area is characterised by steeply dipping hard and fractured lithology. The slope height in
this area will be around 20 m. The slopes are steep and unbenched/ unterraced. As such the
slopes are stable. In rainy season, the matrix (cementing material) between blocks may get
washed away due to uncontrolled flow of rain water along the slope. The absence of
cementing material between blocks make the boulders free from the main slope mass. It can
fall in to the conveyor corridor.
Hence, every attempt should be made to keep the constructed garland drain functional. If any
loose boulder is visible in the slope then it can be brought down in a predictable manner. The
proper benching would help to arrest the boulders detached from the upper benches on the
lower one and the damage of the conveyor line by the free fall of the boulders from the top
can be checked.
One of the dangers associated with high rock slopes is that of falls of loose blocks and
boulders from slope. It can cause considerable damage to conveyor belt line. Wire mesh can
be dropped over a steep rock face to prevent rock falls in a critical area of conveyor belt line.
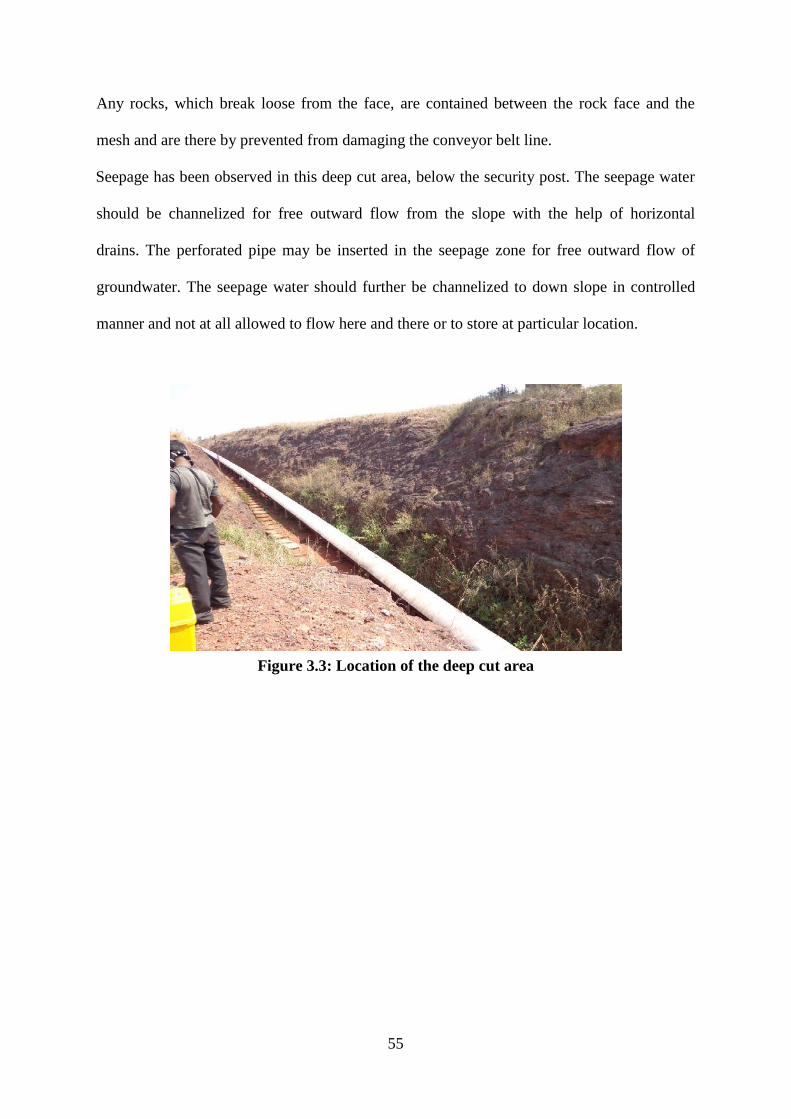
55
Any rocks, which break loose from the face, are contained between the rock face and the
mesh and are there by prevented from damaging the conveyor belt line.
Seepage has been observed in this deep cut area, below the security post. The seepage water
should be channelized for free outward flow from the slope with the help of horizontal
drains. The perforated pipe may be inserted in the seepage zone for free outward flow of
groundwater. The seepage water should further be channelized to down slope in controlled
manner and not at all allowed to flow here and there or to store at particular location.
Figure 3.3: Location of the deep cut area

56
CHAPTER 4
OBSERVATION AND ANALYSIS

57
4.1 Displacement Analysis
Graph 4.1: Changes in Horizontal Distance at Eastern side of part II Mining Area,(Instrument set at CM-3 New) (N18°51.022’, E83° 00.757’)
Graph 4.2: Changes in Horizontal Distance at South West side of part II Mining Area,(Instrument set at CM-4 New) (N18°51.201’, E83° 00.593’)
Observation
In the Eastern and South west side of part II area, 45 monitoring stations are established for
measurement of distances using Total station. Instrument was set at CM-3 and CM-4 station
respectively. The maximum variation of the horizontal displacement was found out to be -4.8,
-4.4, -4.5, -5, 3.4, -4.3, -3.8, -4.2 at station no. 7, 11, 21, 24, 35, 40, 41, 42 respectively the
other maximum is due to the broken of the station.
-6-4-20246
0 5 10 15 20 25 30
horiz
onta
l dist
ance
(cm
)
station no.
Changes in Horizontal Distance at Eastern side of part II Mining Area,(Instrument set at CM-3 New) (N18°51.022’, E83° 00.757’)
2014 2015
-10
-5
0
5
27 29 31 33 35 37 39 41 43 45 47
horiz
onta
l dia
plac
emen
t (cm
)
station no.
Changes in Horizontal Distance at South West side of part II MiningArea, (Instrument set at CM-4 New) (N18°51.201’, E83° 00.593’)
2014 2015

58
Graph 4.3: Changes in Horizontal Distance at western side of Drive House Area,(Instrument set at CM-2A New) (N18°50.761’, E83° 01.317’)
Observation
In the Eastern side of drive house area, 21 monitoring stations are established for
measurement of distances using Total station. Instrument was set at CM-2A station.
Horizontal displacement was not possible to take at eastern side of drive house area because
no points are there due to permanent boundary. The maximum variation of the horizontal
displacement was found out to be 3.3, 3.5, 4.3, and 3.2 at the station no. 24, 26, 28, and 29
respectively.
Graph 4.4: Changes in Horizontal Distance at Western hill of cable belt corridoradjacent to southern side of Drive House , ( Instrument set at CM-5) (N18°50.691’, E83°
01.226’)
-4
-2
0
2
4
6
22 24 26 28 30 32 34 36
horiz
onta
l disp
lace
men
t (cm
)
station no.
Changes in Horizontal Distance at western side of Drive House Area,(Instrument set at CM-2A New) (N18°50.761’, E83° 01.317’)
2014 2015
-6-4-20246
0 2 4 6 8 10 12 14 16
horiz
onta
l disp
lace
men
t (cm
)
station no.
Changes in Horizontal Distance at Western hill of cable belt corridoradjacent to southern side of Drive House ( Instrument set at CM-5)
(N18°50.691’, E83° 01.226’)
2014 2015
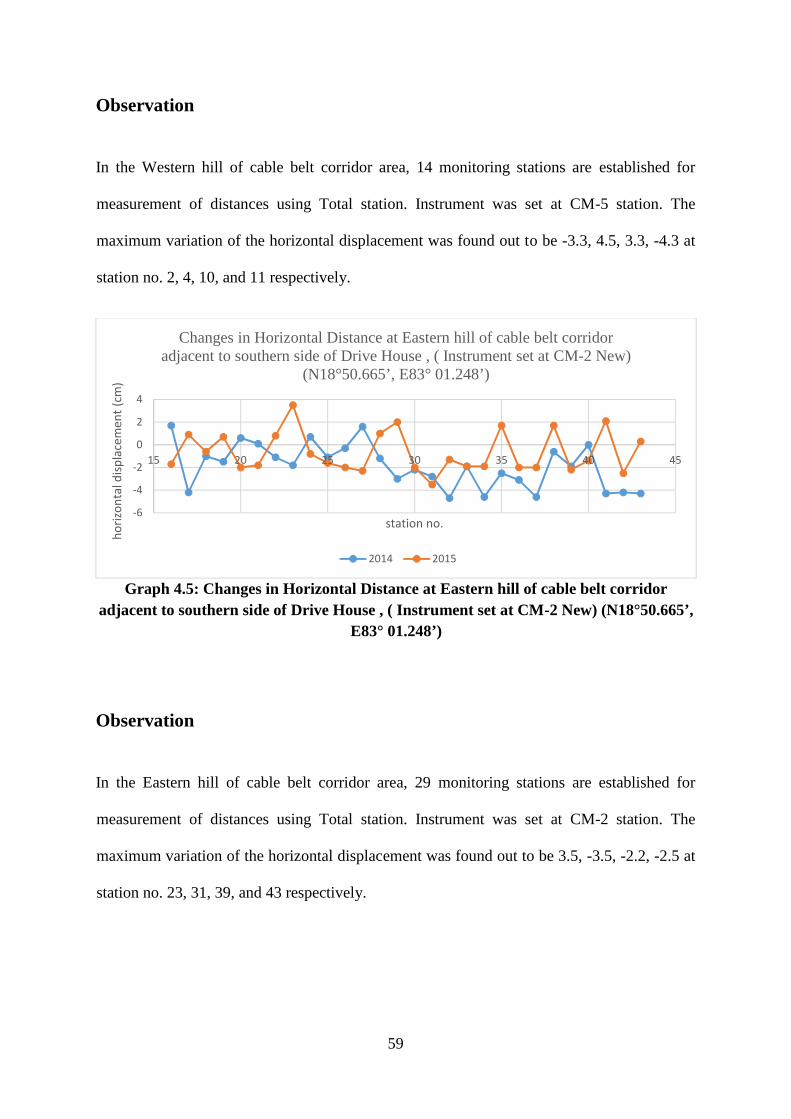
59
Observation
In the Western hill of cable belt corridor area, 14 monitoring stations are established for
measurement of distances using Total station. Instrument was set at CM-5 station. The
maximum variation of the horizontal displacement was found out to be -3.3, 4.5, 3.3, -4.3 at
station no. 2, 4, 10, and 11 respectively.
Graph 4.5: Changes in Horizontal Distance at Eastern hill of cable belt corridoradjacent to southern side of Drive House , ( Instrument set at CM-2 New) (N18°50.665’,
E83° 01.248’)
Observation
In the Eastern hill of cable belt corridor area, 29 monitoring stations are established for
measurement of distances using Total station. Instrument was set at CM-2 station. The
maximum variation of the horizontal displacement was found out to be 3.5, -3.5, -2.2, -2.5 at
station no. 23, 31, 39, and 43 respectively.
-6
-4
-2
0
2
4
15 20 25 30 35 40 45
horiz
onta
l disp
lace
men
t (cm
)
station no.
Changes in Horizontal Distance at Eastern hill of cable belt corridoradjacent to southern side of Drive House , ( Instrument set at CM-2 New)
(N18°50.665’, E83° 01.248’)
2014 2015

60
Graph 4.6: Changes in Horizontal Distance at Eastern side of deep cut area (Instrumentset at CM-7) (N18°47.591’, E82° 58.292’)
Observation
In the Eastern side of deep cut area (CM-7), 9 monitoring stations are established for
measurement of distances using Total station. Instrument was set at CM-7 station. The
maximum variation of the horizontal displacement was found out to be -3.3, 4.3, 3.8, 3.1 at
station no. 1, 3, 4, and 9 respectively.
Graph 4.7: Changes in Horizontal Distance at Eastern side of deep cut area (Instrumentset at CM-8) (N18°47.542’, E82° 58.203’)
-4
-2
0
2
4
6
1 2 3 4 5 6 7 8 9 10
horiz
onta
l disp
lace
men
t (cm
)
station no.
Changes in Horizontal Distance at Eastern side of deep cut area(Instrument set at CM-7) (N18°47.591’, E82° 58.292’)
2014 2015
-4
-2
0
2
4
6
12 12.5 13 13.5 14 14.5 15 15.5 16 16.5
horiz
onta
l disp
lace
men
t (cm
)
station no.
Changes in Horizontal Distance at Eastern side of deep cut area(Instrument set at CM-8) (N18°47.542’, E82° 58.203’)
2014 2015

61
Observation
In the Eastern side of deep cut area, (CM-8) 7 monitoring stations are established for
measurement of distances using Total station. Instrument was set at CM-8 station. The
maximum variation of the horizontal displacement was found out to be 2.6, 2.3, 3.3, and 4.3
at station no. 11, 12, 14, and 16 respectively.
Graph 4.8: Changes in Horizontal Distance at Western side of deep cut area(Instrument set at CM-9) (N18°47’35.25”, E82° 58’15.37”)
Observation
In the Western side of deep cut area, 19 monitoring stations are established for measurement
of distances using Total station. Instrument was set at CM-9 station. The maximum variation
of the horizontal displacement was found out to be 2.2, -2.8, 3.5, -2.9 at station no. 34, 38,
44, and 45 respectively.
-6
-4
-2
0
2
4
27 29 31 33 35 37 39 41 43 45 47
horiz
onta
l disp
lace
men
t (cm
)
station no.
Changes in Horizontal Distance at Western side of deep cut area(Instrument set at CM-9) (N18°47’35.25”, E82° 58’15.37”)
2014 2015
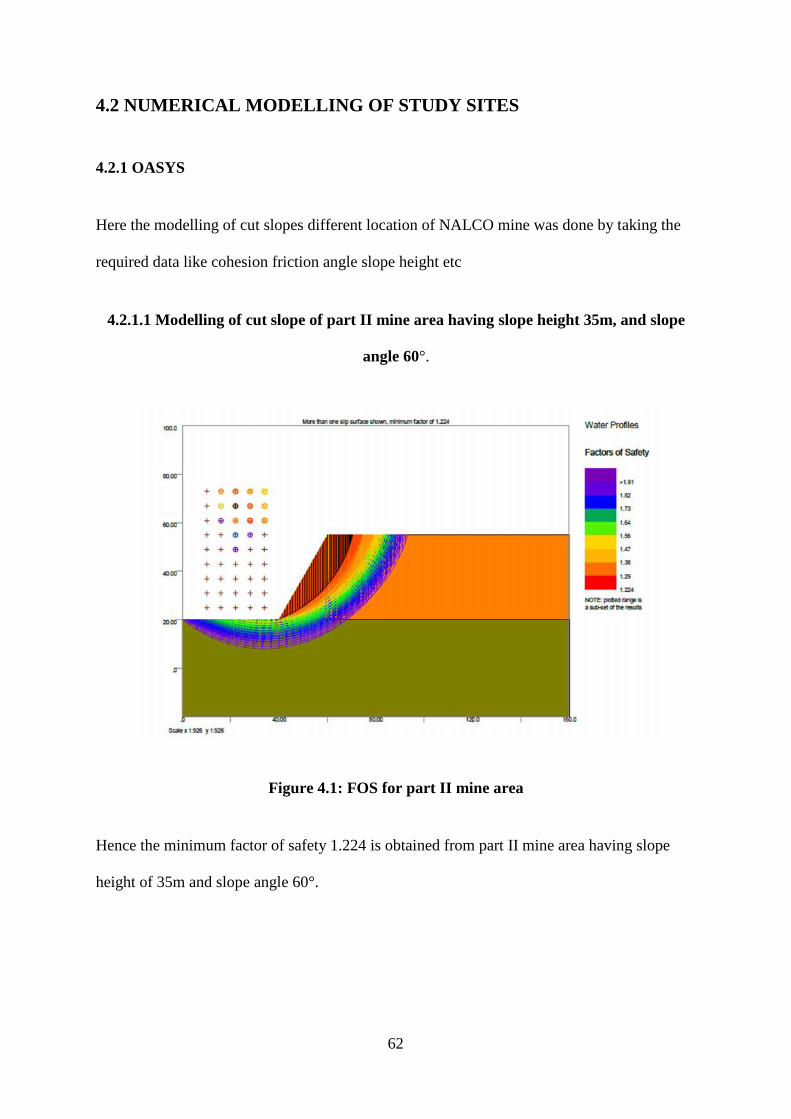
62
4.2 NUMERICAL MODELLING OF STUDY SITES
4.2.1 OASYS
Here the modelling of cut slopes different location of NALCO mine was done by taking the
required data like cohesion friction angle slope height etc
4.2.1.1 Modelling of cut slope of part II mine area having slope height 35m, and slope
angle 60°.
Figure 4.1: FOS for part II mine area
Hence the minimum factor of safety 1.224 is obtained from part II mine area having slope
height of 35m and slope angle 60°.
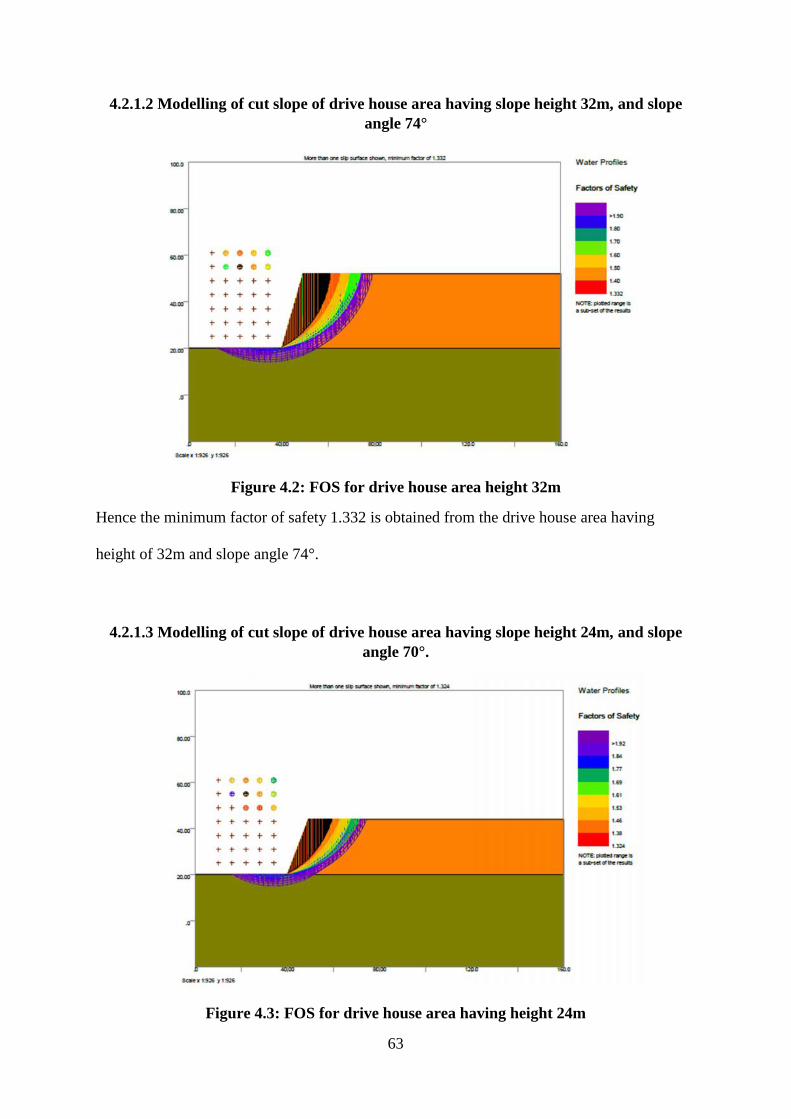
63
4.2.1.2 Modelling of cut slope of drive house area having slope height 32m, and slopeangle 74°
Figure 4.2: FOS for drive house area height 32m
Hence the minimum factor of safety 1.332 is obtained from the drive house area having
height of 32m and slope angle 74°.
4.2.1.3 Modelling of cut slope of drive house area having slope height 24m, and slopeangle 70°.
Figure 4.3: FOS for drive house area having height 24m
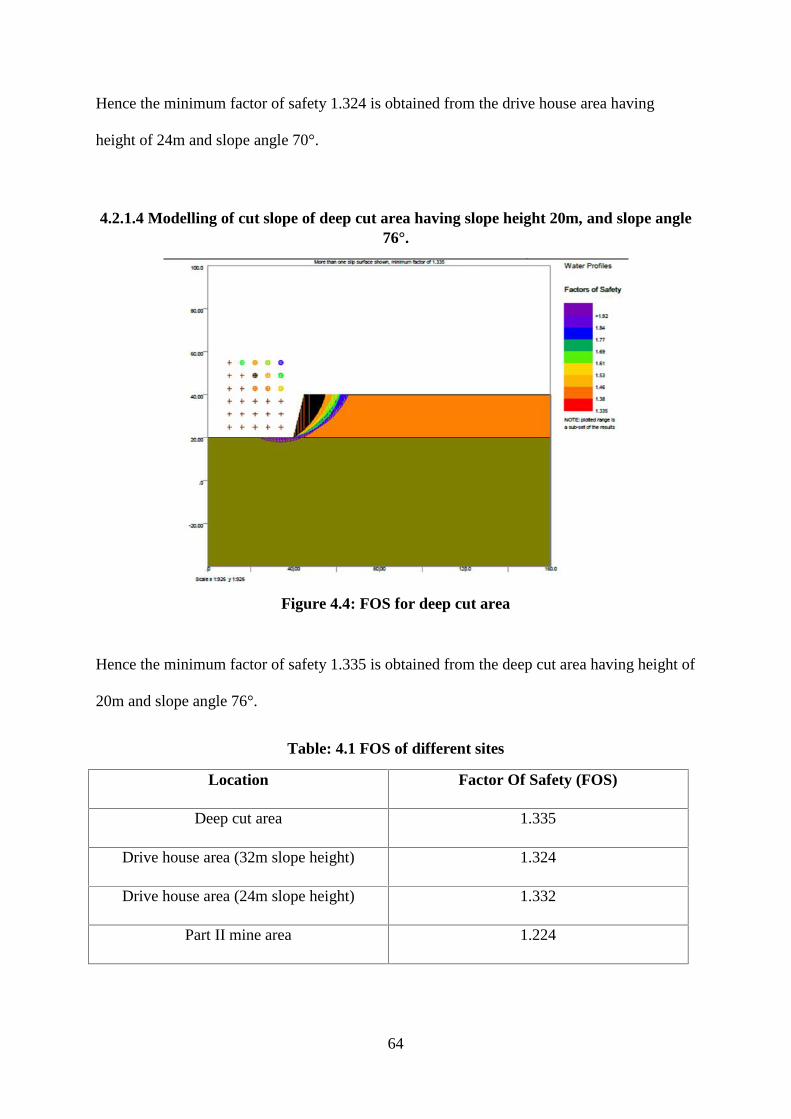
64
Hence the minimum factor of safety 1.324 is obtained from the drive house area having
height of 24m and slope angle 70°.
4.2.1.4 Modelling of cut slope of deep cut area having slope height 20m, and slope angle76°.
Figure 4.4: FOS for deep cut area
Hence the minimum factor of safety 1.335 is obtained from the deep cut area having height of
20m and slope angle 76°.
Table: 4.1 FOS of different sites
Location Factor Of Safety (FOS)
Deep cut area 1.335
Drive house area (32m slope height) 1.324
Drive house area (24m slope height) 1.332
Part II mine area 1.224

65
CHAPTER 5
CONCLUSION
66
5.0 CONCLUSION
On the basis of Numerical Modelling and field observation at cut slope surrounding NALCO
mine the following conclusion are drawn:
1) Cut slope I, (near deep cut area) having slope height of 20m and slope angle of 76° the
factor of safety was found out to be 1.335.
2) Cut slope II, (near drive house area) having slope height of 32m and slope angle of 74°
the factor of safety was found out to be 1.332.
3) Cut slope III, (near drive house area) having slope height of 24m and slope angle of 70°
the factor of safety was found out to be 1.324.
4) Cut slope IV, (near part II mine area) having slope height of 35m and slope angle of 60°
the factor of safety was found out to be 1.224.
5) Above Numerical modelling, safety factor is greater than 1.2 indicated stability of slope.
6) Field observation through total station indicated maximum horizontal displacement of
4.3cm, 3.5cm, 4.5cm, -5cm at cut slope I, cut slope II, cut slope III, cut slope IV
respectively.
7) Except at few places with local slope failure due to rainfall, all other cut slope are
observed to be stable, therefore it is recommended to improve garland drainage and
stabilization through geotextile.
8) Also in graphical analysis the previous data is get compared with the present data and it
was found in safe zone. And the comparative study was done from two approaches.
67
REFERENCES
1. Singh. T. N, Kainthola Ashutosh, Singh. P. K; Stability investigation of road cut slope
in basaltic rockmass, Mahabaleshwar; Beijing; Elsevier publication; 2014
2. Brown. N, Kaloustian. S, Roeckle. M; Monitoring of Open Pit Mines using Combined
GNSS Satellite Receivers and Robotic Total Stations; Switzerland; Leica Geoscience.
3. Cosser. Emily, Roberts. W. G, Meng. X, Dodson. A. H; Measuring the dynamic
deformation of bridges using a total station; Santorini, Greece; University of
Nottingham.
4. Cawood. F. T, Afreni. T. B; Slope Monitoring using Total Station: What are the
Challenges and How Should These be Mitigated? ; Johannesburg; University of the
Witwatersrand.
5. T. R. Stacey, K. S. Osasan; Automatic prediction of time to failure of open pit mine
slopes based on radar monitoring and inverse velocity method; Johannesburg;
Elsevier publication; 2014.
6. Depeng. YUE, Jiping. WANG, Jinxing. ZHOU; Monitoring slope deformation using
a 3-D laser image scanning system: a case study; Beijing; Elsevier publication; 2010.
7. Girard. J. M (2001), “Assessing and Monitoring Open pit Mine Highwalls”, National
Institute for Occupational Safety & Health, Spokane Research Laboratory, Pp: 5-8.
8. FLAC SLOPE Users Guide, (2002), Itasca Consulting Group, Minnesota, Pp: 2-5, 72.
9. Slope Help (2013), OASYS Ltd, 13 Fitzroy street London, Pp: 1, 8-12.
10. Hudson. J, Harrison. J (1997),” Engineering Rock Mechanics”, Volume 1, Elsevier
Science Ltd, UK, Pp: 287-292.
11. http://www.iitbhu.ac.in/faculty/min/rajesh-rai/NMEICT-Slope/Pdf/03%20Types%20
of%20slope%20failure.pdf

68
12. http://www.iitbhu.ac.in/faculty/min/rajesh-rai/NMEICT-Slope/Pdf/02%20Causes
%20of%20slope%20failure.pdf
13. http://www.blm.gov/bmp/low%20volume%20engineering/M_Ch11_Slope_Stabilizati
on.pdf