numerical approach of self-wastage … · numerical approach of self-wastage phenomena ......
TRANSCRIPT

NTHAS8: The Eighth Japan-Korea Symposium on Nuclear Thermal Hydraulics and Safety Beppu, Japan, December 9-12, 2012
Paper Number N8P1070
NUMERICAL APPROACH OF SELF-WASTAGE PHENOMENA
IN STEAM GENERATOR OF SODIUM-COOLED FAST REACTOR
Yuki Ohnishi1*
, Takashi Takata1, Akira Yamaguchi
1, Akihiro Uchibori
2,
Shin Kikuchi2, Akikazu Kurihara
2 and Hiroyuki Ohshima
2
1 Graduate School of Engineering, Osaka University
2-1 Yamadaoka, Suita, Osaka, Japan, 565-0871
phone: +81-6-6879-7895; e-mail: [email protected]
2 Japan Atomic Energy Agency
4002 Narita-cho, O-arai-machi, Higashi-ibaraki-gun, Ibaraki Japan, 311-1393
phone: +81-29-267-4141
ABSTRACT
In the steam generator of sodium-cooled fast reactor (SFR), self-wastage phenomenon is a crack
enlargement on the heat transfer tube itself caused by sodium-water reaction (SWR), which is
triggered by the leakage of steam/water from the initial micro-crack. Therefore, a quantification of
the self-wastage phenomenon is of importance from the viewpoint of safety assessment in the steam
generator. In this study, we propose a numerical approach to evaluate the self-wastage phenomena
and investigate an enlargement of the crack using a multi-dimensional-SWR code “SERAPHIM”.
In the analysis, two-dimensional initial crack is assumed based on SWAT-4 experiment carried out
by Japan Atomic Energy Agency (JAEA). The wastage rate was estimated by Arrhenius type of
the hypothetical equation, and remeshing arrangement was performed by changing solid-cells to
fluid-cells with the estimated wastage amount on the heat exchanger tube in the initial (or former)
model. After simulated again using the remeshing models, the resulting SWR products were distributed not only circumferential direction but also radial direction. The wastage region was
formed invert triangle shape as the similar with experimental observation.
1. INTRODUCTION
When a small crack penetrates to a heat transfer tube wall in a steam generator of sodium-cooled fast reactor,
steam/water inside the tube will leak into liquid sodium
at the shell side resulting in sodium-water reaction
(SWR). At an early stage of the leakage when the leak
rate is too small that the reaction jet due to the SWR
does not reach to a neighbor heat transfer tube, it is
known that the size of crack is being enlarged gradually
and the leakage rate increases because of corrosive
effects caused by the SWR. This is referred to as a
“self-wastage” phenomenon. After the reaction jet
region develops and it reaches to the neighbor tube, a target wastage, where the surface of the neighbor tube is
damaged by the reaction jet, will take place and it has a
possible that a secondary failure of heat transfer tube
happens. Experimental examination of micro leak test
has been studied by using several steels with the
artificial crack (Sandusky, 1976; Green, 1976; Kozlov
et al., 1976; Kuroha et al., 1982; Jeong et al, 2009).
Among these results, the 2.25Cr-1Mo steel gives the
average leak rate of 10-2 to 10-5 g/sec orders until leak
hole enlarged on SWAT-4 experiment (Kuroha et al.,
1982). The maximum leak rate after enlargement of a
crack has become more than 1g/sec order. This leak
rate would induce target wastage, and the time course to enlargement of a crack is 105sec order. On the other
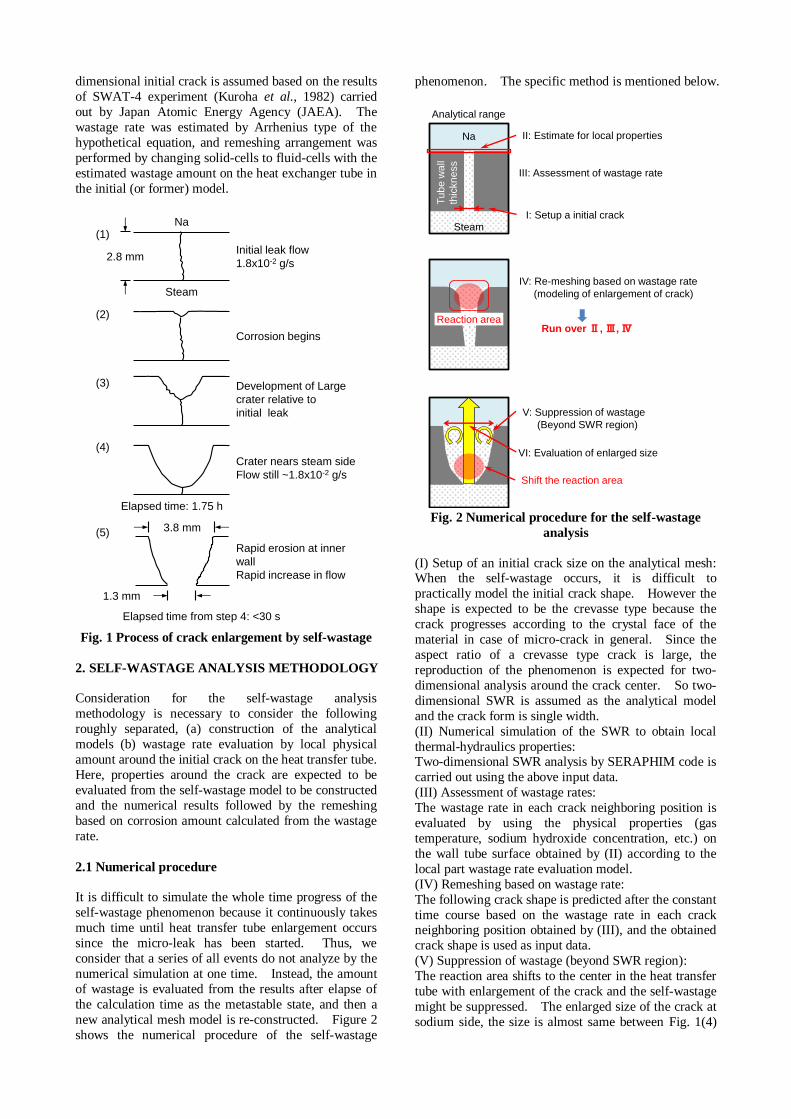
hand, Sandusky explained about self-wastage that the
corrosion started from the sodium side and the leak rate
stays almost unchanged until the thin edge is removed
based on sudden rapid increase of the leak rate as shown
in Fig. 1 (Sandusky, 1976). However, it was hard to
evaluate quantitative analysis of the self-wastage due to
experimental difficulty with treating liquid sodium,
which possesses high chemical activity and opacity in
liquid state. Accordingly a quantification of the self-
wastage phenomenon is important from the viewpoint of not only safety assessment but also elucidation of the
self-wastage mechanism in the steam generator. In
this study, we propose a numerical approach to evaluate
the self-wastage phenomena and investigate an
enlargement of the crack using a multi-dimensional-
SWR code “SERAPHIM” (Takata et al., 2003, 2009).
The SERAPHIM code consists of compressible three-
fluid and one-pressure model, and two chemical
reaction modes. This code calculates the multi-phase
flow with chemical reaction. In the analysis, two-
dimensional initial crack is assumed based on the results
of SWAT-4 experiment (Kuroha et al., 1982) carried
out by Japan Atomic Energy Agency (JAEA). The
wastage rate was estimated by Arrhenius type of the
hypothetical equation, and remeshing arrangement was
performed by changing solid-cells to fluid-cells with the
estimated wastage amount on the heat exchanger tube in
the initial (or former) model.
Fig. 1 Process of crack enlargement by self-wastage
2. SELF-WASTAGE ANALYSIS METHODOLOGY
Consideration for the self-wastage analysis
methodology is necessary to consider the following
roughly separated, (a) construction of the analytical
models (b) wastage rate evaluation by local physical
amount around the initial crack on the heat transfer tube.
Here, properties around the crack are expected to be
evaluated from the self-wastage model to be constructed
and the numerical results followed by the remeshing
based on corrosion amount calculated from the wastage
rate.
2.1 Numerical procedure
It is difficult to simulate the whole time progress of the
self-wastage phenomenon because it continuously takes
much time until heat transfer tube enlargement occurs
since the micro-leak has been started. Thus, we
consider that a series of all events do not analyze by the
numerical simulation at one time. Instead, the amount
of wastage is evaluated from the results after elapse of
the calculation time as the metastable state, and then a
new analytical mesh model is re-constructed. Figure 2
shows the numerical procedure of the self-wastage
phenomenon. The specific method is mentioned below.
Fig. 2 Numerical procedure for the self-wastage
analysis
(I) Setup of an initial crack size on the analytical mesh: When the self-wastage occurs, it is difficult to
practically model the initial crack shape. However the
shape is expected to be the crevasse type because the
crack progresses according to the crystal face of the
material in case of micro-crack in general. Since the
aspect ratio of a crevasse type crack is large, the
reproduction of the phenomenon is expected for two-
dimensional analysis around the crack center. So two-
dimensional SWR is assumed as the analytical model
and the crack form is single width.
(II) Numerical simulation of the SWR to obtain local
thermal-hydraulics properties: Two-dimensional SWR analysis by SERAPHIM code is
carried out using the above input data.
(III) Assessment of wastage rates:
The wastage rate in each crack neighboring position is
evaluated by using the physical properties (gas
temperature, sodium hydroxide concentration, etc.) on
the wall tube surface obtained by (II) according to the
local part wastage rate evaluation model.
(IV) Remeshing based on wastage rate:
The following crack shape is predicted after the constant
time course based on the wastage rate in each crack neighboring position obtained by (III), and the obtained
crack shape is used as input data.
(V) Suppression of wastage (beyond SWR region):
The reaction area shifts to the center in the heat transfer
tube with enlargement of the crack and the self-wastage
might be suppressed. The enlarged size of the crack at
sodium side, the size is almost same between Fig. 1(4)
Na
Steam
Initial leak flow
1.8x10⁻² g/s
3.8 mm
Corrosion begins
Development of Large
crater relative to
initial leak
Crater nears steam side
Flow still ~1.8x10⁻² g/s
Rapid erosion at inner
wall
Rapid increase in flow
Elapsed time: 1.75 h
2.8 mm
1.3 mm
Elapsed time from step 4: <30 s
(1)
(2)
(3)
(4)
(5)
Na
Steam
Tu
be
wa
ll
thic
kne
ss
Analytical range
I: Setup a initial crack
II: Estimate for local properties
III: Assessment of wastage rate
Reaction area
IV: Re-meshing based on wastage rate
(modeling of enlargement of crack)
Run over Ⅱ, Ⅲ, Ⅳ
V: Suppression of wastage
(Beyond SWR region)
VI: Evaluation of enlarged size
Shift the reaction area
and (5). This implies when the crack form becomes
large, the reaction jet (high gas temperature and alkali
corrosion environment) does not reach to the crack
surface.
(VI) Evaluation of enlarged size:
Repeat (II), (III) and (IV), then the final maximum size
of crack enlargement is presumed.
This procedure is also used to evaluate the amount of water leak for target wastage which is the next step of
the SWR by judging the maximum enlarged crack size
as the final.
2.2 Wastage model
2.2.1 How to determine the wastage rate
The self-wastage phenomenon is a continuous event for
a long time in general. Therefore it is extremely
difficult to analyze all events by using numerical
approach. In this study, we adopt the assessment for self-wastage phenomenon after elapse of the calculation
time as the meta-stable state (Fig. 2). The wastage rate
is estimated from the physical amounts of tube surface
around crack which are evaluated from the numerical
results after the elapse of a certain period of the
calculation time. When the wastage rate is
experimentally estimated, the following proportional
equation is commonly used as related temperature with
Eq. (1).
(1)
where WR is wastage rate, K1 and K2 are constants and
T is the absolute temperature of sodium and/or
water/steam (Hori, 1980). The physical amounts
related between SWR and wastage rate are to be gas
temperature, sodium hydroxide (NaOH) concentration.
Na2O is also the physical amount as a secondary
reaction product of the SWR (Hori, 1980). In the
preliminary analysis, we focus on the influence of
primary reaction in the SWR. Therefore, we assume
the following wastage rate in association with Eq. (1)
and Arrhenius equation as Eq. (2).
(2)
where WR is wastage rate [m/s], [NaOH] is sodium
hydroxide concentration [kg/m3], T is gas temperature
[K] and A, B and C are constants. Constant number A
in Eq. (2) is related to the continuous time progress.
Since the self-wastage is evaluated for each state in a
period of time (Fig. 2). Thus, A is disregarded in this
study. Instead, the amount of the maximum wastage is
assumed to be 10% of the tube thickness. Moreover,
for the corrosion of the heat transfer tube, it is expected
that the wastage rate might be changed by NaOH
concentration or gas temperature. So if the wastage proceeds by depending on the NaOH concentration
(sodium hydroxide dominant process: SHDP), B=1 and
C=1 are used as the constant number. While if the
wastage proceeds by depending on the gas temperature
(gas temperature dominant process: GTDP), B=1 and
C=25000 are used as the constant number.
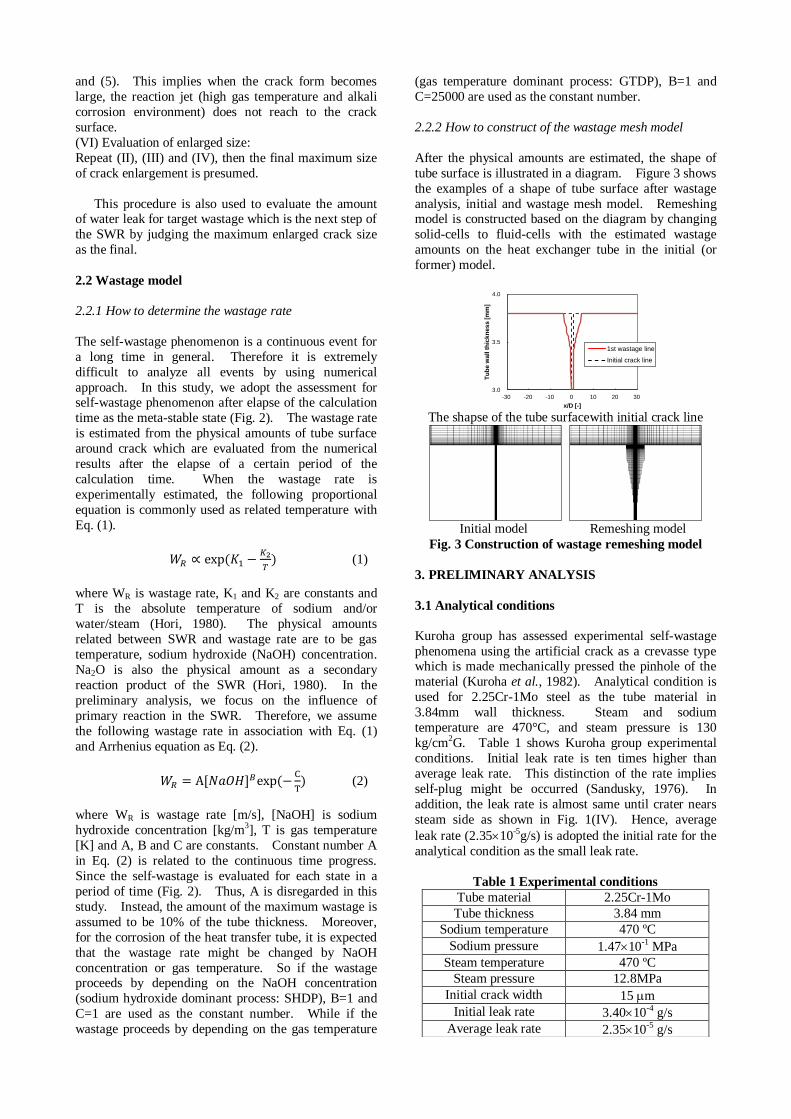
2.2.2 How to construct of the wastage mesh model
After the physical amounts are estimated, the shape of
tube surface is illustrated in a diagram. Figure 3 shows
the examples of a shape of tube surface after wastage
analysis, initial and wastage mesh model. Remeshing model is constructed based on the diagram by changing
solid-cells to fluid-cells with the estimated wastage
amounts on the heat exchanger tube in the initial (or
former) model.
The shapse of the tube surfacewith initial crack line
Initial model Remeshing model
Fig. 3 Construction of wastage remeshing model
3. PRELIMINARY ANALYSIS
3.1 Analytical conditions
Kuroha group has assessed experimental self-wastage
phenomena using the artificial crack as a crevasse type which is made mechanically pressed the pinhole of the
material (Kuroha et al., 1982). Analytical condition is
used for 2.25Cr-1Mo steel as the tube material in
3.84mm wall thickness. Steam and sodium
temperature are 470°C, and steam pressure is 130
kg/cm2G. Table 1 shows Kuroha group experimental
conditions. Initial leak rate is ten times higher than
average leak rate. This distinction of the rate implies
self-plug might be occurred (Sandusky, 1976). In
addition, the leak rate is almost same until crater nears
steam side as shown in Fig. 1(IV). Hence, average
leak rate (2.3510-5g/s) is adopted the initial rate for the
analytical condition as the small leak rate.
Table 1 Experimental conditions
3.0
3.5
4.0
-30 -20 -10 0 10 20 30
Tu
be w
all t
hic
kn
ess [
mm
]
x/D [-]
系列1
系列2
3.0E-03
3.5E-03
4.0E-03
-10 -8 -6 -4 -2 0 2 4 6 8 10
Tu
be
wa
ll t
hic
kn
es
s [
mm
]
x/D [-]
1st wastage line
Initial crack line
Tube material 2.25Cr-1Mo
Tube thickness 3.84 mm
Sodium temperature 470 ºC
Sodium pressure 1.4710-1 MPa
Steam temperature 470 ºC
Steam pressure 12.8MPa
Initial crack width 15 m
Initial leak rate 3.4010-4 g/s
Average leak rate 2.3510-5 g/s

3.2 Initial model
In the numerical simulation, two-dimensional SWR is
conducted using SERAPHIM code with experimental
results as the boundary condition. The initial crack
width is 15m, which is simply measured by Kuroha’s sample (Kuroha et al., 1982; sample number 2022), and
the tube wall thickness is 3.84mm. Liquid sodium
domain is determined by based on Dumm’s empirical
equation for the distance affected by the jet from the
nozzle (Dumm, 1974). The maximum distance affected by the jet is calculated approximately 7mm for
the analytical condition on SWAT-4 experiment.
Therefore, the model size of sodium domain is
approximately three times longer than the jet distance as
20.0mm (width) and 22.1mm (height), respectively.
Figure 4 shows the mesh arrangement and model
scaling. Equally-spaced meshes divided into 15
(1.0m interval) cells in the initial crack and geometry-
spaced divided into 121 (I) 127 (K) cells are arranged to liquid sodium domain. The analytical boundary
conditions are shown in Fig. 5. The inlet boundary is
constant flow rate (2.3510-5g/s), and the outlet
boundary is constant pressure (1.47105Pa). The side walls of sodium region are free-slip condition, and
adiabatic boundary is used as the surface of heat
exchange tube and crack inside with non-slip condition.
The time step is 1.010-10s from the viewpoint of numerical calculation stability.
Fig. 4 Initial mesh model
Fig.5 Analytical boundary conditions
3.3 Result and discussion
3.3.1 Analysis of the initial model
Figures 6 and 7 show the results of analysis of the initial
model at 3.010-5
s and 1.610-4
s, respectively. The streamline is depicted based on gas phase velocity.
High temperature gas phase region (~800 ºC) is located
slightly far from the initial crack on the tube surface in
Fig. 6a. Void fraction indicates the high temperature
region is liquid phase (Fig. 6b) and hydrogen, which is one of the SWR products, is placed this region (Fig. 6c).
On the other hand, there is no outstanding temperature
difference (~1000 ºC) on the tube surface as high
temperature region in Fig. 7a. However, sodium (liquid
phase) is thinly covered on the tube surface as shown in
Fig.7b. Hydrogen concentration is increasing at the
crack neighborhood in liquid phase. This region
would be corrosive domain because sodium hydroxide
(NaOH) is also concentrated this domain. Figure 8
shows heat quantity of a surface reaction (SWR) at
1.610-4s. The SWR has already stopped at high temperature region, and the streamline indicates the gas
phase is rolling through reaction area to the tube surface. The concentration of SWR products on the tube surface
might be carried by this gas phase rolling.
a: Gas temperature b: Void fraction
c: hydrogen concentration
Fig. 6 Results of the initial model at 3.010-5
s
a: Gas temperature b: Void fraction
c: hydrogen concentration
Fig. 7 Results of the initial model at 1.610-4
s
20.0 mm
22
.1 m
m3
.84
mm
600 m
300 m
Inlet boundary
Constant: flow rate, concentration gradient=0
Outlet boundary
Constant: pressure, temperature, concentration
Sodium region
Fre
e-s
lip
Fre
e-s
lip
Non-slip Non-slip
Steam
Adiabatic
boundary
Adiabatic
boundary Ste
am
100
800
[ºC]
100
800
[ºC]
0.0
1.0
[-]
0.0
1.0
[-]
0.0
0.2
[-]
0.0
1200
[℃]
0.0
1.0
[-]
0.0
1.0
[-]
0.0
1.0
[-]
0.0
1.0
[-]

Fig. 8 Heat generation of a surface reaction at
1.610-4
s
Figure 9 shows the relationship between gas
temperature, NaOH concentration and the tube surface
length at 8.010-4s. The x-axis means normalized
horizontal distance by the initial crack width (15m) from the center of the crack. The distribution of both
gas temperature and NaOH concentration in Fig. 9 is
slightly asymmetry. This point indicates elapse of the
calculation time is not enough as a metastable state.
However the time step is used 1.010-10s, the numerical stability is going down to calculation failure.
Therefore we try to assess the wastage rate using the
data at 8.010-4s. NaOH, which is the SWR product, exists around the tube surface close to the crack with
high gas temperature.
Gas temperature and NaOH concentration
on tube surface
Fig. 9 Result of the initial model at 8.010-4
s
3.3.2 Construction of remeshing model
First wastage model
Physical amounts such as gas temperature and NaOH
concentration from the results at 8.010-4s data are turned into Eq. (2), and the shapes of the tube surface
are depicted in Fig. 10. As mentioned above §2.2.1, an
assessment of wastage is performed under the conditions of both SHDP and GTDP, which are changed
the constant number B and C in Eq. (2). In the case of
SHDP, the corrosion occurs at just the crack
neighborhood (Fig. 10a). On the other hand, the
corrosion occurs not only at crack neighborhood but
also at away from the crack as the case of GTDP (Fig.
10b). Although the shapes of both tube surfaces (Fig.
10a and 10b) are not symmetry, the asymmetry of Fig.
10b is emphasized by the large constant number C
(25000).
a: SHDP b: GTDP
Fig. 10 The shapes of the tube surface after first
self-wastage anlalysis
Figures 11 and 12 show the first wastage remeshing
models constructed based on Fig. 10 a and 10b data,
respectively. These mesh models are used to the next
numerical calculation.
Fig. 11 The first remeshing model for SHDP
Fig. 12 The first wastage remeshing model for GTDP
Second wastage model
Figures 13 (SHDP) and 14 (GTDP) show the
relationship between gas temperature and NaOH
concentration in cases of 6.410-4s and 8.010-4s of the tube surface length, respectively. The numerical
calculation is performed as the same condition as the initial model. The inside of deformed initial crack is
placed steam as the same condition before, and the
corrosion parts on the tube surface are replaced solid
cell with fluid cell as liquid sodium region for the
treatment of new mesh model.
0.0
3.5e+10
[W/m3]
0.0E+00
2.0E-04
4.0E-04
6.0E-04
8.0E-04
1.0E-03
0
200
400
600
800
1000
-10 -8 -6 -4 -2 0 2 4 6 8 10
Na
OH
co
nc
en
tra
tio
n [
kg
/m3]
Ga
s t
em
pe
ratu
re [
ºC]
x/D [-]
3.0
3.5
4.0
-10 -8 -6 -4 -2 0 2 4 6 8 10
Tu
be w
all
th
ick
nes
s [
mm
]
x/D [-]
1st
Initial
3.0
3.5
4.0
-10 -8 -6 -4 -2 0 2 4 6 8 10
Tu
be w
all
th
ick
nes
s [
mm
]
x/D [-]
1st
Initial
3.0E-03
3.5E-03
4.0E-03
-10 -8 -6 -4 -2 0 2 4 6 8 10
Tu
be
wa
ll t
hic
kn
es
s [
mm
]
x/D [-]
1st wastage line
Initial crack line
a b
20.0 mm
22
.1 m
m3
.84
mm
600 m
300 m
20.0 mm
22
.1 m
m3
.84
mm
300 m
600 m

Fig. 13 Result of the first wastage model under
SHDP at 6.410-4
s
Fig. 14 Result of the first wastage model under
SHDP at 8.010-4
s
In the case of SHDP, NaOH is distributed on the
surface with higher gas temperature than the result of
initial model (x/D=20). On the other hand, GTDP
case gives the high gas temperature but NaOH concentration is varied. Figure 15 shows the shape of
the tube surface as the second wastage and the second
remeshing model for SHDP. When the wastage
proceeds under the SHDP, the corrosion is occurring
grainy in a wide area on the tube surface (Fig. 15). On
the other hand, if the wastage proceeds under the GTDP,
the corrosion is occurring slightly narrow area but the
wastage depth is the almost same compared with the
SHDP case as shown in Fig. 16.
Fig. 15 The shape of the tube surface and the second
remeshing model for SHDP
Fig. 16 The shape of the tube surface and the second
remeshing model for GTDP
3.3.3 Comparison with the results of the crack enlarged
model
Figures 17 and 18 show the results of the crack enlarged
model started from the initial models at 1.610-4s. In general, gas phase of the first wastage model has tended
to divide and spread in liquid sodium region (Fig. 17b
and 18b). The reason of this tendency is thought that the steam flows from the enlarged crack to liquid
sodium region. In addition, NaOH is directly
distributed on the tube surface with high temperature in
comparison with the results of initial crack model which
sodium (liquid phase) is thinly covered on the tube
surface. Therefore the wastage region of the second
model is larger than the first model. The high
temperature gas phase (~ 1000°C) and NaOH flow
toward the center of the crack depth direction in both
cases (Fig. 17a, c and Fig. 18a, c). This tendency
indicates the wall tube wastage proceeds to be maintained inverted triangle from. Figure 19 shows
comparison of experimental observation and numerical
results. The wastage region was formed inverted
triangle as similar with the experimental observation.
4 CONCLUSIONS
In this study, numerical approach to investigate self-
wastage phenomenon including enlargement of crack
has been proposed, and preliminary numerical
simulation has been carried out to examine applicability of SERAPHIM code.
As the result, sodium layer covered on the tube
surface, and the SWR products concentrated close to the
leakage with high gas temperature in the initial crack
model. The wastage rate was calculated by using
Arrhenius type equation (2) based on proportional
equation (1). The wastage models were constructed by
changing solid cells to fluid cells in the initial (or
former) model according to wastage amounts.
0.0E+00
2.0E-02
4.0E-02
6.0E-02
8.0E-02
1.0E-01
1.2E-01
1.4E-01
0
200
400
600
800
1000
1200
-100 -80 -60 -40 -20 0 20 40 60 80 100
Na
OH
co
nc
en
tra
tio
n [
kg
/m3]
Ga
s t
em
pe
ratu
re [
ºC]
x/D [-]
0.0E+00
2.0E-02
4.0E-02
6.0E-02
8.0E-02
1.0E-01
1.2E-01
1.4E-01
0
200
400
600
800
1000
1200
-100 -80 -60 -40 -20 0 20 40 60 80 100
Na
OH
co
nc
en
tra
tio
n [
kg
/m3]
Ga
s t
em
pe
ratu
re [
ºC]
x/D [-]
3.0
3.5
4.0
-100 -80 -60 -40 -20 0 20 40 60 80 100
Tu
be
wa
ll t
hic
kn
es
s [
mm
]
x/D [-]
系列1
系列2
系列3
3.0
3.5
4.0
-100-80 -60 -40 -20 0 20 40 60 80 100
Tu
be
wa
ll t
hic
kn
es
s [
mm
]
x/D [-]
2nd wastage line
1st wastage line
Initial crack line
20.0 mm
22
.1 m
m3
.84
mm
600 m
3.00 mm
3.0
3.5
4.0
-100 -80 -60 -40 -20 0 20 40 60 80 100
Tu
be
wa
ll t
hic
kn
es
s [
mm
]
x/D [-]
系列1
系列2
系列3
3.0
3.5
4.0
-100-80 -60 -40 -20 0 20 40 60 80 100
Tu
be
wa
ll t
hic
kn
es
s [
mm
]
x/D [-]
2nd wastage line
1st wastage line
Initial crack line
20.0 mm
22
.1 m
m3
.84
mm
600 m
3.00 mm

Assessment of the wastage was carried out to consider
the two types of dominant case as sodium concentration
and gas temperature, respectively. Although there was
a different form close to the leakage in the first wastage
model, both became the form of inverted triangle with
the same size in the second wastage model. The form
was similar with the experimental observation. These
results indicated self-wastage phenomena could be
investigated numerically based on the present approach.
Initial crack model First wastage model Second wastage model
(a) Gas temperature
Initial crack model First wastage model Second wastage model
(b) Void fraction
Initial crack model First wastage model Second wastage model
(c) NaOH concentration
Fig. 17 Results of the crack enlargement model (SHDP)
1200
[℃]
0
1
[-]
0
0.3
[kg/m3]
0

Initial crack model First wastage model Second wastage model
(a) Gas temperature
Initial crack model First wastage model Second wastage model
(b) Void fraction
Initial crack model First wastage model Second wastage model
(c) NaOH concentration
Fig. 18 Results of the crack enlargement model (GTDP)
SHDP case GTDP case
Fig. 19 Comparison of the experimental observation (Gas temperature)
ACKNOWLEDGEMENTS
This work was supported by a study of “Development
of Multi-Physics Evaluation System on Failure
Propagation of Heat Transfer Tubes in the Steam
Generator of Fast Breeder Reactor” entrusted to “Japan
Atomic Energy Agency (JAEA)” by the Ministry of
Education, Culture, Sports, Science and Technology of
Japan (MEXT).
REFERENCES
Dumm, K. (1974). "Small Water/Steam Leaks in
Sodium-Heated Steam Generators," IAEA Study Group
Meeting on Steam Generators for LMFBRs, Summary
Report IAEA IWG FR/1 Bensberg.
Green, D.A. (1976). "Small Leak and Protection
Systems in Steam Generators" Int. Conf. on Liquid
1200
[℃]
0
1
[-]
0
0.3
[kg/m3]
0
1200
[℃]
0
1200
[℃]
0

Metal Technology in Energy Production, Seven Springs,
pp. 233-241.
Hori, M. (1980). "Sodium/Water Reactions in Liquid
Metal Fast Breeder Reactions," Atomic Energy Review,
183, pp.707-778.
Jeong, J-T. et al., (2009) "Analysis of Micro-Leak
Sodium-Water reaction phenomena in a Sodium-Cooled Fast Reactor Steam Generator," Korean J. Chem. Eng.,
26(4), pp. 1004-1008.
Kozlov, F.A. et al., (1976). "Studies on Some Problems
of Leaks in Sodium-Water Steam Generator" Int. Conf.
on Liquid Metal Technology in Energy Production,
Seven Springs, pp. 202-210.
Kuroha, M et al., (1982). "Study of Micro-Defect Self-
Wastage Phenomena on LMBR Prototype Steam
Generator’s Tube." PNC TN941, pp. 82-101.
Sandusky, D. W. (1976). "Small Leak Shutdown,
Location and Behavior in LMFBR Steam Generators,"
Int. Conf. on Liquid Metal Technology in Energy
Production, Seven Springs, pp. 226-232.
Takata, T. et al., (2003) "Numerical Approach to the
Safety Evaluation of Sodium-Water Reaction," J. Nucl.
Sci. Technol., 40(10), pp. 708-718.
Takata, T. et al., (2009) "Computational Methodology
of Sodium-Water Reaction Phenomenon in Steam Generator of Sodium-Cooled Fast Reactor," J. Nucl. Sci.
Technol., 46(6), pp. 613-623.