numerical and experimental study of ti6al4v components ... · numerical and experimental study of...
TRANSCRIPT

Numerical and Experimental Study of Ti6Al4V ComponentsManufactured Using Powder Bed Fusion AdditiveManufacturing
JONAS ZIELINSKI,1,3,4 HANS-WILFRIED MINDT,2 JAN DUCHTING,3
JOHANNES HENRICH SCHLEIFENBAUM,1,3
and MUSTAFA MEGAHED 2,5
1.—RWTH Aachen University - Digital Additive Production, Aachen, Germany. 2.—ESI Group,Essen, Germany. 3.—Fraunhofer Institute for Laser Technology, Aachen, Germany. 4.—e-mail:[email protected]. 5.—e-mail: [email protected]
Powder bed fusion additive manufacturing of titanium alloys is an interestingmanufacturing route for many applications requiring high material strengthcombined with geometric complexity. Managing powder bed fusion challenges,including porosity, surface finish, distortions and residual stresses of as-builtmaterial, is the key to bringing the advantages of this process to productionmain stream. This paper discusses the application of experimental andnumerical analysis towards optimizing the manufacturing process of ademonstration component. Powder characterization including assessment ofthe reusability, assessment of material consolidation and process windowoptimization is pursued prior to applying the identified optima to study thedistortion and residual stresses of the demonstrator. Comparisons of numer-ical predictions with measurements show good correlations along the completenumerical chain.
INTRODUCTION
Additive manufacturing is a versatile manufac-turing route promising shorter lead times for com-plex and personalized functional products. Theprocess flexibility and strength originates from theuse of many control parameters1 and comes at thecost of high nonlinearity of the system. Qualifyingadditive manufacturing processes and assertingproduct quality is coupled with extensive experi-mental effort. To reduce experimental cost, physics-based modeling is expected to offer more insight andenable virtual optimization while providing thenecessary documentation for expected materialand product qualification.2
This paper focuses on the application of a model-ing platform encompassing powder-scale models aswell as component-scale models towards assessingthe final quality of a demonstrator component.3–7
Ti6Al4V is chosen to demonstrate the modelingwork flow. The numerical results of each step arecompared to experimental measurements
confirming the applicability of numerical methodstowards quick economic qualification of additivemanufactured parts.2
EXPERIMENTS
Powder Bed Fusion Machine
For the single-track experiments, an EOS M270and an ILT laboratory machine have been used. Themanufacturing of the distortion specimens and themelt pool monitoring was performed on the latter.One of the important differences between the twomachines is their laser beam diameter (dL).
Single Tracks studies
Melting has been investigated by varying the lineenergy EL ¼ PL=vs (where PL is laser power and ms isscan speed) in such a way, that a transition from a‘heat conduction’-dominated process towards a ‘key-hole’-dominated8 process is observed (Fig. 1). Wehave also investigated the influence of differentlaser beam diameters on the melt pool geometry.
JOM, Vol. 69, No. 12, 2017
DOI: 10.1007/s11837-017-2596-z� 2017 The Author(s). This article is an open access publication
(Published online September 19, 2017) 2711

The influence of the powder layer on energy cou-pling was studied by comparing melt pool charac-teristics with and without a powder layer.
For all the experiments, the melt pool depth,height and width as well as the remolten surfacehave been evaluated. All single-track experimentswere conducted on Ti6Al4V substrate.
Process Parameter: Scan Speed, Laser Power
Starting from the default parameter set (red circlein Fig. 2), ten different combinations of laser powerand scanning velocity are used. Figure 2 shows theline energy as a contour plot for the differentprocess parameters. With increased line energy,more keyholing is expected.
Powder Layer
The single-track studies were performed witheither no powder or with two different layer thick-nesses: hL30 and 60 lm. The powder layers weremanually applied with a scraper with the corre-sponding gap height. To increase the flowability, thepowder was applied in an ethanol suspension(volume weighted 50% powder, 50% ethanol). Theapplied powder layer thickness was measured usingan infinity focus microscope and found to be roughly5 lm higher than the gap height, resulting in layerthicknesses of hL � 35 lm and 65 lm.
Beam Diameter
To vary the laser beam diameter (based on 86%definition), two different SLM machines with beamdiameters of dL EOS ¼ 80lm and dL ILT ¼ 110 lmwere used. The process parameters from the ILTlaboratory machine were transferred to the EOS
machine by keeping the average laser beam inten-sity and scanning velocity constant. The laser powerPL EOS was adapted accordingly:
PL ILT
pd2L ILT
¼ PL EOS
pd2L EOS
¼ constant
Analysis
The fabricated single-track samples were cutperpendicular to the scanning direction. The cross-section was polished and etched with Kroll’s reagent(duration: 30 s). The melt pool boundaries werevisualized using a light microscope. The depth(substrate level to deepest melting point), height(highest remolten material point to substrate level),width (width of melt pool on substrate level) andsurface (integrated area of molten material in cross-section) were measured.
Melt Pool Monitoring: High Speed Videogra-phy
Extracting the length of a melt pool using micro-graphs is time consuming and error-prone. Toobtain the melt pool length, we used high speedvideography. The melt pool width measured byvideography was verified using single-track mea-surements. Other information like the size of pow-der denudation zone and particle movement in theprocess zone could also be observed, but were notpart of this work.
The videos were recorded with a Photron Fas-tCam SA-5 and additional pulsed diode lasers(k � 800 nm) were used to illuminate the processzone. The wavelength of the process laser(k ¼ 1064 nm) was filtered out to avoid
Fig. 1. (a) Heat-conduction mode. (b) Keyhole dominant mode.
Fig. 2. Parameter combinations for laser power and scanningvelocity for the two different laser beam diameters dL. The back-ground color represents the relative line energy in relation to thedefault parameter (red circle).
Zielinski, Mindt, Duchting, Schleifenbaum, and Megahed2712

overexposure. The spatial resolution of the videomaterial was gauged by recording single tracks witha defined hatch spacing. The achieved resolutionwas 9:31 � 0:06 lm
px. The frame rate was 75 kHZ.
NUMERICAL MODELS
The software package ESI-AM was used through-out this study for both powder-scale and workpieceanalysis. Using a discrete element model to obtainthe powder bed characteristics, Mindt et al. showedhow the balance between powder size distribution
and the slit height can affect the coating quality andpowder recyclability.9,10 The numerically obtainedpowder bed was transferred to the meltingmodels to solve Navier–Stokes equations asdescribed in Ref. 6. The mechanical analysis wasassumed weakly coupled to the thermo-metallurgi-cal phenomena.11 The non-linear material behaviorwas accounted for by using a quasi-static incremen-tal analysis.12–14
Ti6Al4V properties reported in the literaturewere used.15–20
DEMONSTRATION COMPONENT
A bridge geometry was chosen as a demonstratorcomponent because of the relative ease of quantify-ing the bridge curvature (BC).21 Table I summa-rizes the process parameters used.
To increase stress and strain, no preheating wasused. The specimens were removed force-free fromthe base plate by EDM. Since the pillars are notheld in place any more, the residual stresses inside
Table I. Process parameters used for bridge build
Laser power (W) 175Scan speed (m/s) 1.2Hatch spacing (lm) 80Layer thickness (lm) 30Stripe width (lm) 500Layer rotation (�) 90
Fig. 3. Bridge geometry used for distortion analysis and BC analysis: cutting (orange), the inherent stress and strain lead to distortion (green),the measurement of the angle aBC (blue).
Fig. 4. (a) Volume and amount weighted particle size distribution of utilized Ti6AlV4 powder. (b) Corresponding numerical powder bed andrecyclability assessment.
Numerical and Experimental Study of Ti6Al4V Components Manufactured Using Powder BedFusion Additive Manufacturing
2713

the material leads to a distortion. The angle aBCM
between the bridge pillars was then measured witha 3D scanner (GOM) (Fig. 3).
RESULTS AND DISCUSSION
Powder Characterization
The powder chemical composition was analyzed,confirming compliance with Ti6Al4V specifications.The particle size distribution was analyzed using anautomated particle measuring system (MorphologiG3). It was found to correspond to the recommendedparticle diameters of dp = 20–63 lm. The particlesize distribution is shown in Fig. 4; it serves asinput for powder-coating simulations. A numericalassessment of powder recyclability was performedusing the models described in Ref. 10. Figure 4
compares the number density of powder fractions infresh powder (source) with those of the powderdeposited on the processing table and the powder inthe recycling bin. Powder particles with the small-est diameters deposit readily on the processingtable. Larger powder sizes deposit proportionally tothe provided volume fraction. By considering thepredicted mass fraction in the recycling bin, it canbe expected that the powder will tend slightly tolarger particle sizes when recycled. An example ofnumerically obtained powder beds used for meltinganalysis is also presented.
Single Track Studies
Figure 5 shows typical results for melt poolmodeling. The images compare melt pool isometricand side views for exemplary conduction (a) and
Fig. 5. (a) Melt pool surface (top) and side view (bottom) colored by temperature for conduction mode. (b) Keyhole mode.
Fig. 6. Experimental and numerical melt pool width (a) and depth (b) as function of line energy.
Zielinski, Mindt, Duchting, Schleifenbaum, and Megahed2714

keyhole conditions (b). The contour plot depicts thetemperatures. The peak temperature is signifi-cantly higher than the melting temperature forboth cases and remains slightly lower than theevaporation temperature due to the latent heat ofevaporation. In the case of the conduction mode,evaporation mainly occurs on the surface of the meltpool. The side view shows that less than two layerswill be remolten in the case of the conduction mode,whereas up to 4–5 layers will remelt in the case ofkeyholing.
Measured and predicted melt pool width anddepth values are compared in Fig. 6. The widthincreases with line energy until a possiblestable state (maximum width) is reached. Themaximum width is roughly 2–2.5 times the beamdiameter. Increasing the line energy after this pointonly increases the melt pool depth. The melt pool
width without powder is a little larger (� 10 lm)than ‘with powder’, possibly due to additionalparticle mass sucked into the melt pool, effectivelycooling the melt pool at its boundaries, thus slowingthe outward expansion of the melt. Single-trackmelt pool width values have also been used toconfirm the accuracy of high speed image process-ing; Fig. 6a shows excellent correlation betweenboth methods for a 30-lm powder layer thicknessand beam diameter of 110 lm.
The melt pool depth increases linearly withincreasing the line energy. Since the depth ismeasured from substrate level to the deepest pointin the melt pool, the depth of the single tracksprocessed without powder is larger than the corre-sponding ‘powder case’ setup. Figure 6b shows thatthe depth difference is roughly the height of thepowder layer hL ¼ 30lm and 60 lm.
Different beam diameters lead to different slopesof the depth-line energy curve. A smaller beamdiameter, dL, results in a deeper melt pool (for thesame line energy). The current working theory forthis effect is that, for the small beam diameter, lessenergy is required to sustain a smaller (not so wide)keyhole leading to a more energy-efficient deepmelting.
Numerical predictions of both the melt pool widthand depth are within experimental accuracy for allcases, except of the case with a line energyEL ¼ 0:42 J=mm, where the computational domainsize was too small so that the boundary conditionswere found to influence the result.
Figure 7 shows the thermal history at two mon-itor points on the track center line. One point isclose to the melt pool surface and the other isdirectly below, near the melt pool base (conductionmode). The results for 0.53 J/mm and 1:38 J=mm arecompared. The higher energy density leads tohigher peak temperatures. The front view of thecorresponding melt pool indicates keyholing. Thecooling rate (peak temperature to solidus) for low
Fig. 7. Cooling rate comparision of two melt pools created using lowand high line energy cases (dL ¼ 80lm, hL ¼ 30lm; PL ¼ 103Wand145W and vs ¼ 1200 and 647 mm
s ).
Fig. 8. (a) Surface area of molten material and (b) depth-to-width ratio as functions of line energy.
Numerical and Experimental Study of Ti6Al4V Components Manufactured Using Powder BedFusion Additive Manufacturing
2715

and high energy densities are 6.3 9 106 K/s and2:27 � 106 K=s respectively; which is comparable tothe validated finding of IN718Plus.5 The differencein cooling rates is attributed to the difference inmelt pool volume.
The surface of the remolten zone also increaseswith line energy (Fig. 8a). For the small beamdiameter, the process seems to be more energyefficient. The depth-to-width ratio (Fig. 8b) for allcases increases linearly with line energy, but theslope for different beam diameters is different. Thereason is that the melt pool width strongly dependson the beam diameter, while the depth dependsmostly on the beam power.
Figure 9 shows the melt pool length extractedfrom high-speed videos compared with the valuesobtained from simulations. From the videos, it canbe seen, that the melt pool length fluctuatesstrongly, resulting in a large statistical error.
Nevertheless, the melt pool length in the simula-tions is only underestimated by up to 75 lm, fittingvery well with the measured data.
Material Consolidation
The process parameters are varied using anevolutionary optimization scheme. Two optimiza-tion objectives are defined: maximizing materialdensity and maximizing deposition rate (defined asthe mass of deposited material per unit time).Figure 10a shows the optimization results (paretofront) that compares the performance of approxi-mately 1800 cases. Each case represents a combi-nation of process parameters including laser power,scan speed, table displacement and hatch spacing.The density (described by a dimensionless factor)and the deposition rate are inversely proportional toone another. The leftmost point of the densitycurves is chosen for the maximum density achiev-able and a point after the increase in deposition rateis chosen for a quicker deposition option. Thecorresponding combination of process parametersis listed for both points. Process window optimiza-tion was also pursued experimentally and it wasfound that a preheat of 200�C is necessary to ensurea stable, crack-free process. Figure 10b shows theconsolidated material density as a function of lineenergy for two different power levels. Both thenumerical and experimental optimization effortsyield similar process parameter combinations. Theexperimental optimum is used to manufacture thebridge specimens.
Distortion and Residual Stresses
Figure 11 shows the maximum vertical displace-ment for each layer. Given the chosen table dis-placement (30 lm) and the predicted powderpacking density, the available gap between buildsurface and coater arm is estimated to be
Fig. 9. Comparison of melt pool length determined from single-trackanalysis, high-speed videography and numerically.
Fig. 10. (a) Pareto front for maximization of material density and depsosition rate. (b) Measured material density vs. volume energy at 200�Cpreheating.
Zielinski, Mindt, Duchting, Schleifenbaum, and Megahed2716
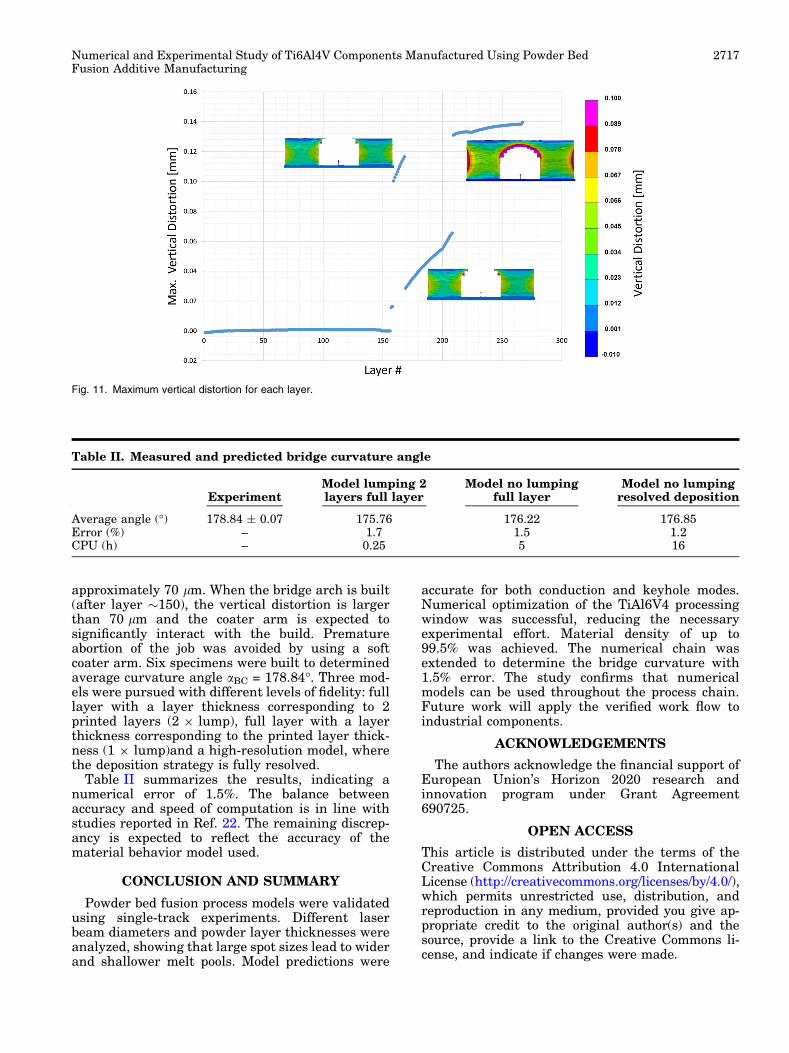
approximately 70 lm. When the bridge arch is built(after layer �150), the vertical distortion is largerthan 70 lm and the coater arm is expected tosignificantly interact with the build. Prematureabortion of the job was avoided by using a softcoater arm. Six specimens were built to determinedaverage curvature angle aBC = 178.84�. Three mod-els were pursued with different levels of fidelity: fulllayer with a layer thickness corresponding to 2printed layers (2 9 lump), full layer with a layerthickness corresponding to the printed layer thick-ness (1 9 lump)and a high-resolution model, wherethe deposition strategy is fully resolved.
Table II summarizes the results, indicating anumerical error of 1.5%. The balance betweenaccuracy and speed of computation is in line withstudies reported in Ref. 22. The remaining discrep-ancy is expected to reflect the accuracy of thematerial behavior model used.
CONCLUSION AND SUMMARY
Powder bed fusion process models were validatedusing single-track experiments. Different laserbeam diameters and powder layer thicknesses wereanalyzed, showing that large spot sizes lead to widerand shallower melt pools. Model predictions were
accurate for both conduction and keyhole modes.Numerical optimization of the TiAl6V4 processingwindow was successful, reducing the necessaryexperimental effort. Material density of up to99.5% was achieved. The numerical chain wasextended to determine the bridge curvature with1.5% error. The study confirms that numericalmodels can be used throughout the process chain.Future work will apply the verified work flow toindustrial components.
ACKNOWLEDGEMENTS
The authors acknowledge the financial support ofEuropean Union’s Horizon 2020 research andinnovation program under Grant Agreement690725.
OPEN ACCESS
This article is distributed under the terms of theCreative Commons Attribution 4.0 InternationalLicense (http://creativecommons.org/licenses/by/4.0/),which permits unrestricted use, distribution, andreproduction in any medium, provided you give ap-propriate credit to the original author(s) and thesource, provide a link to the Creative Commons li-cense, and indicate if changes were made.
Fig. 11. Maximum vertical distortion for each layer.
Table II. Measured and predicted bridge curvature angle
ExperimentModel lumping 2layers full layer
Model no lumpingfull layer
Model no lumpingresolved deposition
Average angle (�) 178.84 ± 0.07 175.76 176.22 176.85Error (%) – 1.7 1.5 1.2CPU (h) – 0.25 5 16
Numerical and Experimental Study of Ti6Al4V Components Manufactured Using Powder BedFusion Additive Manufacturing
2717

REFERENCES
1. I. Yadroitsev, Selective Laser Melting Direct Manufactur-ing of 3D-Objects by Selective Laser Melting of MetalPowders, 1st ed. (Saarbrucken, Germany: LAP LambertAcademic Publishing, 2009).
2. A.D. Peralta, M. Enright, M. Megahed, J. Gong, M. Roybal,and J. Craig, IMMI (2016). doi:10.1186/s40192-016-0052-5.
3. M. Vogel, M. Khan, J. Ibara-Meding, A. Pnkerton, N. N’Driand M. Megahed, 2nd World Congress on ICME, 231(2013).
4. N. N’Dri, H.-W. Mindt, B. Shula, M. Megahed, A. Peralta,P. Kantzos and J. Neumann, TMS, (2015). doi:10.1007/978-3-319-48127-2_49.
5. H.-W. Mindt, M. Megahed, B. Shula, A. Peralta and J.Neumann, AIAA, (2016). doi:10.2514/6.2016-1657.
6. M. Megahed, H.-W. Mindth, N. N’Dri, H. Duan, and O.Desmaison, IMMI (2016). doi:10.1186/s40192-016-0047-2.
7. H.-W. Mindt, O. Desmaison, M. Megahed, A. Peralta, andJ. Neumann, J. Mater. Eng. Perform. (2017). doi:10.1007/s11665-017-2874-5.
8. J. Zhou, H.-L. Tsai, and P.-C. Wang, Trans ASME (2006).doi:10.1115/1.2194043.
9. A.B. Pierings and G. Levy, SFF (2009).10. H.-W. Mindt, M. Megahed, N.P. Lavery, M.A. Holmes, and
S.G.R. Brown, Metall. Mater. Trans. A (2016). doi:10.1007/s11661-016-3470-2.
11. E.R. Denlinger, J.C. Heigel, and P. Michaleris, Proc. Inst.Mech.Eng.BJ.Eng. (2014). doi:10.1177/0954405414539494.
12. J. Carmet, S. Debiez, J. Devaux, D. Pont and. J.B. Leblond,International Conference on Residual Stresses (1989).
13. J.M. Bergheau and J.B. Leblond, Minerals Metals andMaterials Society, 203 (1991).
14. B. Souloumaic, F. Boitout, and J.M. Bergheau, Mathe-matical Modelling of Weld Phenomena 6, ed. H. Cerjak(London: Maney, 2002), p. 573.
15. E. Attar, Simulation der selektiven Elektronen-strahlschmelzprozesse (Erlangen: University of Erlangen-Nuremberg, 2011).
16. K.C. Mills, Recommended values of thermophysical prop-erties for selected commercial alloys (Cambridge England:Woodhead Publishing Limited, 2002).
17. I. Egry, D. Holland-Moritz, E. Ricci, R. Wunderlich, and N.Sobczak, Int. J. Thermophys. 31, 949 (2010).
18. A.N. Arce, Thermal Modeling and Simulation of ElectronBeam Melting for Rapid Prototyping of Ti6Al4V (Raleigh:North Caroline State University, 2012).
19. Z. Zhang, Modeling of Al Evaporation and Marangoni Flowin Electron Beam Button Melting of Ti-6Al-4V (Vancouver:The University of British Columbia, 2013).
20. A. Klassen, T. Scharowsky, and C. Korner, J. Phys. D Appl.Phys. (2014). doi:10.1088/0022-3727/47/27/275303.
21. J.P. Kruth, J. Deckers, E. Yasa, and R. Wauthle, Proc. Inst.Mech.Eng.BJ.Eng. (2012). doi:10.1177/0954405412437085.
22. O. Desmaison, P.-A. Pires, G. Levesque, A. Peralta, S.Sundarraj, A. Makinde, V. Jagdale and M. Megahed, 4thWorld Congress on ICME (2014). doi:10.1007/978-3-319-57864-4_34.
Zielinski, Mindt, Duchting, Schleifenbaum, and Megahed2718