numerical and experimental investigation on the top plate
TRANSCRIPT

I
EXPERIMENTAL AND NUMERICAL INVESTIGATION OF THE TOP PLATE
INFLUENCE ON THE PERFORMANCE OF SOLAR VORTEX ENGINE
by
YEW JIA-WEI
15994
Dissertation submitted in partial fulfillment of
the requirements for the
BACHELOR OF ENGINEERING (HONS)
MECHANICAL ENGINEERING
JANUARY 2016
UNIVERSITI TEKNOLOGI PETRONAS
BANDAR SERI ISKANDAR
31750 TRONOH
PERAK DARUL RIDZUAN

II
CERTIFICATION OF APPROVAL
EXPERIMENTAL AND NUMERICAL INVESTIGATION OF THE TOP PLATE
INFLUENCE ON THE PERFORMANCE OF SOLAR VORTEX ENGINE
by
Yew Jia-Wei
15994
A project dissertation submitted to the
Mechanical Engineering Programme
UNIVERSITI TEKNOLOGI PETRONAS
in partial fulfillment of the requirement for the
BACHELOR OF ENGINEERING (Hons)
MECHANICAL ENGINEERING
Approved by,
(Prof. Dr. Hussain H. Jaafar Al-Kayiem)
UNIVERSITI TEKNOLOGI PETRONAS
TRONOH, PERAK
January 2016

III
CERTIFICATION OF ORIGINALITY
This is to certify that I am responsible for the work submitted in this project, that the
original work is my own except as specified in the references and acknowledgments, and
that the original work contained herein have not been undertaken or done by unspecified
sources or persons.
YEW JIA-WEI

IV
ABSTRACT
Solar energy – the clean and renewable energy has been receiving recognition and
welcome from the society and authorities. Researches have been done all over the world
to improve solar energy harvesting efficiency, and fully utilize solar energy to replace
non-renewable energy resources in the future. Many solar technologies have been
developed to capture solar thermal and light energy. Solar chimney or Solar Updraft
Tower (UTP) is one of the inventions created and provide promising power generation.
Solar Chimney Power Plant (SCPP) captures solar thermal energy and to be converted
into mechanical energy using wind turbine before producing electricity. However, higher
chimney tower is required to enable higher efficiency, inducing a higher construction cost.
Thus, the Solar Vortex Engine (SVE) was proposed to utilize artificially developed
vortexes as replacement on chimney tower.
This research mainly focused on the Solar Vortex Engine (SVE) and aimed to investigate
on the influence of an annulus shaped top plate on the SVE’s power generation
performance and efficiency. The design parameters of top plate were considered as the
controlling variable while the flow field within Solar Vortex Engine (SVE) was treated as
the changing variable.
Numerical methodology applied computational fluid dynamics (CFD) for simulation with
ANSYS Fluent 15 as the operational platform. Simulations were conducted on different
top plate opening diameter ranging from 0.3m, 0.5m, 0.7m and 0.9m. The optimum
opening diameter was then implemented to a canopy shaped top plate. Several slanting
angles (8.53, 10, 20, 30, and 40) were simulated to resolve air-cornering issue.
Experiments were later conducted on pre-built prototype installed in solar research field
within Universiti Teknologi PETRONAS to verify and validate the result findings.
Aluminum and Perspex top plate with 0.3m opening diameter were applied for testing.
This research proved that increasing the transparency of the top plate did improved the
solar updraft and airflow temperature. Increasing top plate opening diameter and slanting
angle did enhanced outlet volume flow rate and resolved the air-cornering issue but failed
to improve updraft velocity.

V
ACKNOWLEDGEMENT
I would like to acknowledge with gratitude to Professor Dr. Hussain H. Al-Kayiem, my
respective supervisor, for giving me the opportunity to work on this research title under
his intellectual guidance. Dr. Hussain has provided guidance and assistance along the way
from title selection to submission of this research paper.
I am immensely grateful to Dr. Hussain who has always been sincere and helpful in
assisting my understanding on the topic. His guidance helped me in all the time of research
and writing of this research paper. I learned a lot from this research and the knowledges
gained are beneficial to both my academic and future career path.
Besides, I would like to express my dearest appreciation to Mr. Ali. A. Ismaeel, a PhD
Candidate who is also my co-supervisor who in-spite assisted me on both numerical
simulation and experimental setup. Mr. Ali has been continuous monitored my progress
and correct my mistake.
My sincere thanks to Mr. Mohammed A. Aurybi, a PhD Candidate who provided vast
assistance on my numerical simulation. Thanks to Mr. Mohammed, solar radiation setup
has been successfully considered within numerical simulation.
Last but not least, I would like to thank my family for supporting me spiritually throughout
the writing of this research paper. This research paper is made possible through the helps
and supports from everyone and I sincerely thank you for their insights and advises.

1
TABLE OF CONTENTS
ABSTRACT ..................................................................................................................... IV
ACKNOWLEDGEMENT ................................................................................................ V
ABBREVIATIONS AND NOMENCLATURES ............................................................. 5
CHAPTER 1 INTRODUCTION ...................................................................................... 6
1.1 – Prelude ............................................................................................... 6
1.2 – Problem Statement ............................................................................. 9
1.3 – Objectives .......................................................................................... 9
1.4 – Scope of Study ................................................................................. 10
CHAPTER 2 LITERATURE REVIEW ......................................................................... 11
2.1 – Solar Vortex Engine ......................................................................... 11
2.2 – Top Plate ........................................................................................... 12
2.3 – Airflow .............................................................................................. 15
CHAPTER 3 METHODOLOGY .................................................................................... 16
3.1 – Project Approaches ........................................................................... 16
3.2 – Modeling On Solar Vortex Engine ................................................... 18
3.3 – Modelling of Top Plate ..................................................................... 20
3.4 – Numerical Investigation ................................................................... 22
3.4.1 Mesh Generation .................................................................... 22
3.4.2 Numerical Simulations ........................................................... 23
3.4.3 Governing Equations .............................................................. 24
3.4.4 Numerical Simulation Setup .................................................. 26
3.4.5 Boundary Conditions ............................................................. 28
3.5 – Experimental Approach .................................................................... 32
3.5.1 Experimental Setup for Solar Vortex Engine (SVE) ............. 33
3.5.2 Components and Dimensions for Solar Vortex Engine ......... 35
3.5.3 Experimental Positioning For Measurements ........................ 36
3.6 – Gantt Chart ....................................................................................... 39
3.6.1 FYP 1 ..................................................................................... 39
3.6.2 FYP 2 ..................................................................................... 40
3.7 – Project Key Milestone ...................................................................... 41
3.8 – Summary ........................................................................................... 41
CHAPTER 4 RESULT AND DISCUSSION ................................................................. 42
4.1 Foreword .............................................................................................. 42
4.2 Numerical Simulation Results ............................................................. 42

2
4.2.1 Mesh Independency Test (MIT) .......................................... 43
4.2.2 Numerical Investigation on Top Plate Material .................. 46
4.2.3 Numerical Investigation on Top Plate Opening Diameter ... 54
4.2.4 Numerical Investigation on Slanting Angle for Canopy
Shaped Top Plate ............................................................................ 57
4.3 Experimental Results ........................................................................... 60
4.3.1 Solar Collector ....................................................................... 60
4.3.2 Vortex Engine Generator ....................................................... 62
4.4 Summary .............................................................................................. 71
CHAPTER 5 CONCLUSION AND RECOMMENDATIONS ..................................... 73
REFERENCE ................................................................................................................... 75
Appendix A – Measuring Instruments ............................................................................ 78
Appendix B – Mesh Independency Test ........................................................................ 87
B.1 Mesh Independency Test at 0.5m/s Inlet Velocity .............................. 87
B.2 Mesh Independency Test at 0.7m/s Inlet Velocity .............................. 88
List of Figures
Figure 1. 1 – Schematic of Solar Updraft Tower (SUT) [4] .............................................. 7
Figure 1. 2 – Vortex Power Generator with Tangential Air Entry Duct-Side View [5] .... 8
Figure 2. 1 - Concept of Solar Vortex Engine (SVE) ...................................................... 12
Figure 2. 2 - Concept of Greenhouse Effect Applied on Top Plate ................................. 12
Figure 3. 1 – Study Approach on SVE Top Plate ............................................................ 16
Figure 3. 2 - Flow Chart for Research Methodology ....................................................... 17
Figure 3. 3 - Sectioned view on Geometrical Modeling for VEG ................................... 18
Figure 3. 4 - Configuration for Vortex Engine Generator (VEG) .................................... 19
Figure 3. 5 – Fluid Body Structure of Vortex Engine Generator (VEG) ......................... 20
Figure 3. 6 – Annulus Shaped Top Plate ......................................................................... 21
Figure 3. 7 – Canopy Shaped Top Plate ........................................................................... 21
Figure 3. 8 - Proposed opening diameters for top plate ................................................... 22
Figure 3. 9 - Proposed Modifications on Solar Top Plate ................................................ 22
Figure 3. 10 – Mesh Generated on VEG model ............................................................... 23
Figure 3. 11 - ANSYS Fluent 15 Viscous Model Setup .................................................. 26
Figure 3. 12 - Solar Vortex Engine Testing Unit installed at UTP Solar Research Site .. 34
Figure 3. 13 – Top View of Solar Vortex Engine (SVE) with Aluminum Top Plate ...... 34
Figure 3. 14 – Top View of Solar Vortex Engine (SVE) with Perspex Top Plate........... 35
Figure 3. 15 - Sectional Schematic for Experimental Measurements Positions .............. 38
Figure 3. 16 – Key Milestone for FYP ............................................................................. 41

3
Figure 4. 1 - Graph of Maximum Simulated Velocity and pressure vs Trials on MIT .... 44
Figure 4. 2 - Graph of Aspect Ratio vs Trials on Mesh Independency Test .................... 44
Figure 4. 3 - XY Plot for Top Plate Outlet Velocity on Trial 11 ..................................... 44
Figure 4. 4 - Graph on Flow Rates vs Trials .................................................................... 45
Figure 4. 5 – Case 1 Sectional Incident Radiation Contour (Aluminum) ........................ 47
Figure 4. 6 – Case 2 Sectional Incident Radiation Contour (Perspex) ............................ 47
Figure 4. 7 – Case 1 Sectional Static Temperature Contour on (Aluminum) .................. 48
Figure 4. 8 – Case 2 Sectional Static Temperature Contour on (Perspex) ....................... 48
Figure 4. 9 – Case 1 Sectional Velocity Magnitude Contour (Aluminum) ..................... 49
Figure 4. 10 – Case 2 Sectional Velocity magnitude Contour (Perspex) ........................ 50
Figure 4. 11 – Case 1 Sectional Pressure Contour (Aluminum) ...................................... 50
Figure 4. 12 – Case 2 Sectional Pressure Contour (Perspex) ........................................... 51
Figure 4. 13 – Illustration on Vortex Engine Generator .................................................. 51
Figure 4. 14 – Case 1 Tangential Velocity at Convection Region (Aluminum) .............. 52
Figure 4. 15 – Case 1 Tangential Velocity at Convergence Region (Aluminum) ........... 52
Figure 4. 16 – Case 2 Tangential Velocity at Convection Region (Perspex) .................. 53
Figure 4. 17 – Case 2 Tangential Velocity at Convergence Region (Perspex) ................ 53
Figure 4. 18 – Case 1 Sectional Vorticity Contour (Aluminum) ..................................... 54
Figure 4. 19 – Case 2 Sectional Vorticity Contour (Perspex) .......................................... 54
Figure 4. 20 – Sectional Temperature Contour at Perspex opening diameter 0.3m ........ 55
Figure 4. 21 – Sectional Temperature Contour at Perspex opening diameter 0.5m ........ 55
Figure 4. 22 – Sectional Temperature Contour at Perspex opening diameter 0.7m ........ 55
Figure 4. 23 – Sectional Temperature Contour at Perspex opening diameter 0.9m ........ 55
Figure 4. 24 – Sectional Velocity Contour at Perspex opening diameter 0.3m ............... 56
Figure 4. 25 – Sectional Velocity Contour at Perspex opening diameter 0.5m ............... 56
Figure 4. 26 – Sectional Velocity Contour at Perspex opening diameter 0.7m ............... 56
Figure 4. 27 – Sectional Velocity Contour at Perspex opening diameter 0.9m ............... 56
Figure 4. 28 – Sectional Temperature Contour at Perspex 8.53° 𝑠𝑙𝑎𝑛𝑡𝑖𝑛𝑔 𝑎𝑛𝑔𝑙𝑒 ......... 57
Figure 4. 29 - Sectional Temperature Contour at Perspex 10° 𝑠𝑙𝑎𝑛𝑡𝑖𝑛𝑔 𝑎𝑛𝑔𝑙𝑒 ............. 57
Figure 4. 30 - Sectional Temperature Contour at Perspex 20° 𝑠𝑙𝑎𝑛𝑡𝑖𝑛𝑔 𝑎𝑛𝑔𝑙𝑒 ............. 57
Figure 4. 31 - Sectional Temperature Contour at Perspex 30° 𝑠𝑙𝑎𝑛𝑡𝑖𝑛𝑔 𝑎𝑛𝑔𝑙𝑒 ............. 57
Figure 4. 32 - Sectional Temperature Contour at Perspex 40° 𝑠𝑙𝑎𝑛𝑡𝑖𝑛𝑔 𝑎𝑛𝑔𝑙𝑒 ............. 58
Figure 4. 33 – Sectional Velocity Contour at 8.53° 𝑠𝑙𝑎𝑛𝑡𝑖𝑛𝑔 𝑎𝑛𝑔𝑙𝑒 ............................. 58
Figure 4. 34 - Sectional Velocity Contour at 10° 𝑠𝑙𝑎𝑛𝑡𝑖𝑛𝑔 𝑎𝑛𝑔𝑙𝑒 ................................. 58
Figure 4. 35 - Sectional Velocity Contour at 20° 𝑠𝑙𝑎𝑛𝑡𝑖𝑛𝑔 𝑎𝑛𝑔𝑙𝑒 ................................. 58
Figure 4. 36 - Sectional Velocity Contour at 30° 𝑠𝑙𝑎𝑛𝑡𝑖𝑛𝑔 𝑎𝑛𝑔𝑙𝑒 ................................. 58
Figure 4. 37 - Sectional Velocity Contour at 40° 𝑠𝑙𝑎𝑛𝑡𝑖𝑛𝑔 𝑎𝑛𝑔𝑙𝑒 ................................. 59
Figure 4. 38 – Maximum Velocity Simulated on Various Top Plate Slanting Angle ..... 59
Figure 4. 39 – Solar Intensity against Time ..................................................................... 60
Figure 4. 40 – Temperatures within Solar Collector (SC) ............................................... 61
Figure 4. 41 – Illustration on VEG Top Plate and TBS ................................................... 62
Figure 4. 42 – Solar Intensity against Time ..................................................................... 62

4
Figure 4. 43 – Measured Top Plate Temperature against Time ....................................... 63
Figure 4. 44 – Temperature of Transparent Bounding Structure (TBS) against Time ... 64
Figure 4. 45 – Illustration on VEG Interior Wall and Base ............................................. 65
Figure 4. 46 – Interior Wall Temperature of VEG against Time .................................... 65
Figure 4. 47 – Measured Base Temperature for VEG against Time ................................ 65
Figure 4. 48 – Illustration on VEG inflow and outflow ................................................... 66
Figure 4. 49 – Measured Transient Behavior of Air Inflow Temperature ....................... 66
Figure 4. 50 – Measured Transient Behavior of Air Outflow Temperature .................... 67
Figure 4. 51 – Air Outflow Humidity (RH %) against Time ........................................... 67
Figure 4. 52 – Measured Transient Behavior of Air Inflow Velocity .............................. 69
Figure 4. 53 - Measured Transient Behavior of Air Outflow Velocity ............................ 69
Figure 4. 54 – Percentage Enhancement in Outflow Velocity against Time .................. 70
Figure 4. 55 – Measured Transient Behavior of Tangential Velocity against Time ........ 70
Figure 4. 56 – Measured Outlet Volume Flow rate against Time .................................... 71
Figure 5. 1 – Proposed Model of Vortex Engine Generator (VEG) ................................ 74
List of Tables
Table 3. 1 – Parameters for Vortex Engine Generator ..................................................... 19
Table 3. 2 – Dimensions for Vortex Engine Generator (VEG) ........................................ 19
Table 3. 3 – Material Properties for Top Plate ................................................................. 22
Table 3. 4 – Boundary Condition for Case 1 ................................................................... 28
Table 3. 5 – Boundary Condition for Case 2 ................................................................... 29
Table 3. 6 – Boundary Condition for Case 3 ................................................................... 30
Table 3.7 – Boundary Condition for Case 4 .................................................................... 31
Table 3. 8 – Components and Dimensions for Solar Vortex Engine ............................... 35
Table 3. 9 – Experimental Measuring Positions with Instruments .................................. 38
Table 3. 10 – Gantt Chart for FYP 1 ................................................................................ 39
Table 3. 11 – Gantt Chart for FYP 2 ................................................................................ 40
Table 4. 1 - Inlet and Outlet Flow rate for 11 trials ......................................................... 45
Table 4. 2 – Comparison on Experimental Measurements bet. Aluminum and Perspex 71
Table 4. 3 – Verification and validation on Case 1 simulated results by experiment 1 ... 72
Table 4. 4 – Verification and Validation on Case 2 simulated results by experiment 2 .. 72

5
ABBREVIATIONS AND NOMENCLATURES
SVE Solar Vortex Engine
VEG Vortex Engine Generator
TP Top Plate
SC Solar Collector
TBS Transparent Bounding Structure
𝐷𝑖 Top Plate inner diameter (𝑚)
𝐷𝑜 Top Plate outer diameter (𝑚)
𝐴𝑡𝑝 Area of Top Plate
h Top Plate Height (m)
𝐼𝐴 Absorbed incident
𝐼𝑅 Reflected incident
𝐼𝑇 Transmitted incident

6
CHAPTER 1
INTRODUCTION
1.1 – Prelude
Based on the World Energy Outlook (WEO) 2014, the “Global energy demand is set to
grow by 37% by 2040 in our central scenario” [1]. The demand of natural gas has grown
by more than half. There is a rising consumption concentrated in the rest of Asia, Africa,
the Middle East and Latin America while a landmark is predicted to be made in the early
2030s when China by-pass United State of America, becoming the largest oil-consuming
country. Subsidies given to fossil fuel ($550billion) in year 2013 were more than 4 times
of renewable energy ($120billion). However, the increase production on non-renewable
resources will indirectly cause passive effect on the ecosystem. Thus, there is a will to
bring down the demand on fossil fuel. The intergovernmental panels have agreed that only
1000 gigatonnes of 𝐶𝑂2 is allowed to be emitted globally. This is to achieve the goal to
allow only 2℃ increase in global temperature [1]. This is where the renewable and clean
energy are applicable.
Renewable Energy
Renewable energy is defined as energy that replenish naturally. This result in significant
energy security and economic benefits. Renewable energy does provide a clean generation
with no greenhouse gas emissions. Diversifying energy supply did indeed reduced the
dependence on imported fuels. Renewable energy range from Wind, Hydropower, Solar,
Geothermal, Biomass and Wave energy. Based on REN21’s report in year 2014,
renewable energy contributed 19% to the global final energy consumption and 22% on
electricity generation in between 2012 to 2013. As a share of the total energy generated
by modern renewables, biomass energy provided 4.2%, hydropower generated 3.8%, other
renewable sources (e.g. Wind and Solar) comprised 1.2% and biofuels accounted for 0.8%.
[2]. Statistic shows that solar renewable sources have not been fully utilized. Further
development and deployment on solar technologies can increase the power supply
generation.

7
Overview on Solar Technologies
Solar energy is energy harvested from light and heat of the Sun. Different technologies
like solar heating, photovoltaics, and solar thermal system have been implemented for
harnessing. The cost of solar technologies have been decreasing due to technological
improvement. Solar thermal electricity (STE) and Solar Photovoltaic Electricity (PV) are
competitive in sunny countries against oil generated electricity [3]. STE has been
providing cheap and promising energy generation. STE mainly apply Concentrating Solar
Power (CSP) and non-concentrating solar power technologies. Parabolic trough, Dish
Stirling, and Solar Power Tower are example of CSP while Solar Updraft Tower is placed
under non-concentrating category.
Figure 1. 1 – Schematic of Solar Updraft Tower (SUT) [4]
Solar Updraft Tower (SUT)
As shown in Figure 1.1, Solar Updraft Tower (SUT) is consisted of three elements, namely
solar collector (SC), chimney/tower, and wind turbines. The SUT apply the principle of
air convection for its operation. Sunlight or solar radiation heats up the air beneath the SC
installed at the base of the tower. The resulting natural convection causes hot air to rise in
the tower by the chimney effect. Pressure variation in tower causes suction which then

8
draws in more hot air. The airflow then drives the wind turbine installed within the tower,
converting mechanical energy to electrical energy. Large-scale Solar Updraft Tower (SUT)
is believed to be capable in generating electricity match to those of conventional power
plants [4]. Although taller or higher solar chimney and larger collector area will be able
to increase the power output efficiency, higher investment cost will be involved for
construction. This is where the Atmospheric Vortex Engine (AVE) is applicable in
overcoming the drawback.
Figure 1. 2 – Side View of Atmospheric Vortex Engine [5]
Solar Vortex Engine (SVE)
As shown in Figure 1.2, Atmospheric Vortex Engine (AVE) was invented with the aim to
replace SUT with a lower and less expensive structure. The cost of an Atmospheric Vortex
Engine (AVE) plant is only 5% of the total cost of solar chimney with the same capacity.
Solar Vortex Engine (SVE) was later proposed as an alternative to AVE. The Solar Vortex
Engine (SVE) is a type of AVE which combines the principle of tornadoes and the
principle of the solar chimney [5]. Instead of applying heat exchanger or industrial wasted
heat energy, the SVE utilized solar radiation to spark the engine operation. The air is

9
heated in the same manner as the solar updraft tower using solar radiant [6]. Besides, the
SVE applies artificially created vortexes and capture the mechanical energy generated
during air convection updraft [7]. The vortexes are created by admitting warm or humid
air tangentially at the base of a circular wall using guide vanes. The height of a virtual
“vortex chimney” could extend much higher into the atmosphere compare to a physical
chimney structure. [5].
Top Plate
The same principle of solar thermal system has been applied on the top plate of the Solar
Vortex Engine. Top plate is installed on the tower outlet to increase the temperature of air
to promote updraft and natural convection. The top plate will be presented in current
research based on numerical and experimental approaches.
1.2 – Problem Statement
Solar Vortex Engine (SVE) was proposed and constructed at solar research site located
within Universiti Teknologi PETRONAS. Current prototype is not ready for power
generation and thus continuous improvement will have to be done to increase natural
convection and improve power generation. Solar Collector (SC) was installed as the major
heat source for the SVE. However, the low air temperature variation compare to ambient
has drag down the engine performance. Top plate was proposed to be installed above the
Vortex Engine Generator (VEG) to increase airflow temperature for further improvement
on natural convection. However, horizontal top plate does prevent updraft and create fluid
cornering. Therefore, this paper is aimed to counter the problems and propose a solution.
1.3 – Objectives
This study was conducted to achieve the following objectives.
1. To evaluate the contribution of the top plate on the performance of Solar Vortex
Engine (SVE) by experimental investigation.
2. To simulate and evaluate the flow field within the Solar Vortex Engine (SVE) by
CFD technique.
3. To determine the optimum top plate opening diameter and slanting angle in
improving solar updraft by CFD technique.

10
1.4 – Scope of Study
This is a research on Solar Vortex Engine (SVE). This research will focus only on the top
plate of the Solar Vortex Engine (SVE). A numerical approach will be applied to study
on various parameters of the top plate and their effects on the updraft, air cornering and
power generation efficiency of the Solar Vortex Engine. Different top plate parameters,
namely type of material (transparency), opening diameter (internal diameter) and slope of
canopy are used as the controlling variable while airflow and air temperature are the
changing variables. The optimum slope and opening diameter that will improve updraft
without compromising the heat transfer efficiency is to be determined in this paper.
The numerical investigation is completed using the Newton-Raphson approach in 1D.
Computational Fluid Dynamics (CFD) technique has been used for simulation on Solar
Vortex Engine (SVE) within ANSYS Fluent 15 simulation software to predict and
calculate the nominal performance.
Experiments were later conducted on a solar vortex engine model that has previously been
built on the solar research ground within Universiti Teknologi PETRONAS to validate the
numerical and simulation approaches.

11
CHAPTER 2
LITERATURE REVIEW
2.1 – Solar Vortex Engine
Solar energy is a clean form of renewable energy. Society has been supportive and agreed
for the development solar technologies. Researches have been done all over the world to
design solar plants and increase their efficiency to fully utilize the solar energy for power
generation. Atmospheric Vortex Engine (AVE) is one of the concept proposed by Norman
Louat and Louis. M. Michaud. Based on Technical Description by Louis. M. Michaud,
“An atmospheric vortex engine (AVE) is a device for producing mechanical energy by
means of a controlled tornado-like vortex.” [8]. The thermal source to heat the air come
from conventional power plants. While a Solar Vortex Engine (SVE) is the modified
version of AVE where the insolation is applied to replace conventional power plants as
the main source of thermal energy to heat the air for operation. The top plate or Solar
Collector (SC) is the main component to separate air underneath from ambient condition
and act as the collector for solar heat energy. This chapter presents a review of the
fundamentals as well as the state-of-the-art researches did previously on Solar Vortex
Engine (SVE) and the effect of collector or top plate on power generation efficiency.
Vortex Engine is applying a controlled tornado-like vortex instead of a physical tower and
using the centrifugal force created by the rotation of a mass of air can prevent horizontal
convergence just as good as a solid wall [9].
Figure 2.1 shows a concept of the Solar Vortex Engine (SVE) which utilize solar radiation
as heating source to reduce airflow buoyancy, promoting updraft.

12
Figure 2. 1 - Concept of Solar Vortex Engine (SVE)
2.2 – Top Plate
The top plate is a flat plate collector which is used for capturing solar radiation, converting
solar energy to heat energy. The solar air collector is installed at engine inlet while top
plate is installed at engine outlet, implementing the concept of the greenhouse effect that
trap short wavelength radiation and reflect long wavelength radiation as shown in Figure
2.2. The thermal performance of a top plate highly depend on the rate of energy incident
direct on the collector, the slope, transparency and the rate of energy loss on both front
and rear surface and the rate of useful energy collected to heat the air [10].
Figure 2. 2 - Concept of Greenhouse Effect Applied on Top Plate

13
Collectors can be categorized into non-concentrating and concentrating. The top plate
applied on the Solar Vortex Engine (SVE) is a flat collector, which is a non-concentrating
collector. Thus, the area that intercepts the solar radiation is the area absorbing solar
radiation. While concentrating collectors have a bigger collector area than absorber [11].
Many researches have been done to improve the thermal efficiency of collector. Most
modeling methodologies were conducted to predict the performance of the solar thermal
system. The Solar Vortex Engine apply a circular top plate as second collector and the
basic design of the circular solar collector was presented and introduced for the solar
chimney power plant of Manzanares prototype in Spain [12].
Al-Kayiem has presented a mathematical modeling on circular configuration solar air
collector. With appropriate and justified assumptions, the governing equation on
conservation of continuity, momentum and energy balance equation were manipulated to
predict the thermodynamic properties of airflow in radial direction at various controlled
conditions. Numerical simulation was conducted using Computational Fluid Dynamics
(CFD) Analysis. Experimental model was later fabricated to validate numerical result [13].
A research done has applied an experimental approach to investigate on the performance
of a solar collector for a Solar Chimney Power Plant (SCPP). Influencing factors have
been applied on the statistical methodology ranging from solar radiation intensity and air
volume flow rate. The efficiency of collector and graphical relationship with influencing
factors were the result findings [14].
A new approach for analyzing solar collector were presented where a conceptual
temperature term – equivalent ambient temperature (𝑡𝑎∗) has been introduced to determine
thermal performance when solar collector is exposed to different front and rear ambient
temperatures. Hottel-Whillier-Bliss (HWB) Analysis has been done using parameters:
Plate Efficiency Factor - F’, Heat Removal Factor - 𝐹𝑅, Overall Heat Loss Coefficient -
𝑈𝐿, and Effective Transmittance-Absorptance Product - (𝜏𝛼)𝑒. Heat Transfer is assumed
to be steady state. A building-integrated solar collector model for heating effect has been
built to demonstrate the concept [10].

14
On the other hand, one-directional heat transfer analysis and Thermal Equilibrium
Equations are applied on the solar collector. The effect of collector radius on power
generation of Solar Chimney Power Plant (SCPP) was investigated to determine the
maximum radius allow for effective power output. Based on the research, “Under the
unloaded conditions, the theoretical power output of an SCPP is directly proportional to
the square of the collector radius.” The research conclude that there is a limitation on the
allowable collector radius, beyond which the proportional relationship between collector
radius and power output is unobtainable [15, 16]
In order to understand the natural convection phenomena, a numerical study have been
conducted by passing laminar airflow through an inclined enclosure and investigate the
convection under various condition like pressure and temperature. Temperature variation
at enclosure inlet and outlet triggered pressure difference and promote air circulation.
Continuity equation has been applied for the study to determine the relationship between
slope and updraft [17].
The outlet diameter of the solar tower will as well affect the engine performance. A
research have been done to study the relationship between collector area, tower height and
chimney’s diameter on power output. Manzanares model in Spain has been used as
comparison in the study and a mathematical equation relating collector area to air
temperature has been derived. Result shows that the chimney outlet diameter has lower
impact on power output compare to other parameter. Increasing the tower outlet diameter
lead to a rise in air mass flow rate but the increased cross-sectional area tends to reduce
the temperature variation between inlet and outlet, lowering the air velocity and rate of
natural convection [18].
Kalidasan has conducted a research to investigate on the transparency and refractivity of
cover on performance for solar water heater. An incremental approach on number of cover
with same material properties has been used and result shows that the instantaneous
efficiency of flat plate collector increases with an increase in number of covers only until
a certain degree. Further plate increment, in fact, start to reduce system performance. On
the other hand, efficiency decreases with an increase in refractive index [19].

15
2.3 – Airflow
The Top Plate is installed on the Solar Vortex Engine (SVE) to collect solar radiation to
heat up the air underneath for operation. The efficiency of the solar collector will directly
affect the airflow. Bernardes considered collector as a cavity between two parallel plates.
The rise of temperature on collector and shear stress on top layer air in contact with solar
collector were considered numerically [20].
Airflow is assumed to be in steady state condition due to low air dynamics. The velocity
and temperature distribution equation were considered within the analytical approach
where velocity and convection heat transfer increase with air temperature [21]. A
numerical model and considered airflow as incompressible due to low variation in air
density. Based on the research, “The computational mesh should be finer near the wall to
capture the thermal and viscosity boundary layer”. On the contrary, compressible airflow
are modeled by Boussinesq where density of air changes with temperature variation [22,
23].
As a conclusion, most studies conducted mainly focus on Solar Collector (SC) and the
comparison on the parameters of Solar Chimney to the power performance. Various
methods have been applied to improve the collector efficiency and to predict the thermal
fluid properties in order to maximize the power generation by thermal plant. However,
there is no single study that focus on the modeling of the top plate to increase temperature
variation within solar tower which can lead to performance improvement.
In this paper, a geometrical model of Solar Vortex Engine was developed and numerical
simulation was applied to determine the top plate efficiency in collecting solar irradiance
and to predict air temperature. Experimental investigation was applied to verify and
validate on the numerical simulation.

16
CHAPTER 3
METHODOLOGY
3.1 – Project Approaches
The strategy of approach for this research is outlined in this chapter. The CFD simulation,
experiments, data collection process and results analysis are included as well. Theoretical
study is conducted on the Solar Collector (SC) of the Solar Vortex Engine (SVE).
Studies conducted are aim to investigate the influence triggered by Top Plate on the
updraft and performance of the Solar Vortex Engine (SVE). Numerical approach is used
to predict the research findings through modeling and simulation. Experimental approach
is used to verify and validate the predictions. Studies conducted on top plate are based on
the following element and sequence.
Figure 3. 1 – Study Approach on SVE Top Plate
Top Plate's Material Analysis (Transparency)
Top Plate's Opening Diameter Analysis
Top Plate's Slope Analysis
Air Velocity and Temperature
SVE Power Generation Performance

17
Problem Statement
Literature
Numerical
Approach
Experimental
Analysis
Result Analysis
Conclusion and
Recommendations
Documentation
and Validation Documentation
Project Evaluation
Project
Implementation
Project Development
Preliminary Research
and Information
Gathering
Problem Identification
Phase
END
Modeling Simulation
Top Plate
Installation
Top Plate Design
Measurement and
Data Collection
Geometry
development
Mesh
Generation
Findings
Comparison
NO
YES
START
Boundary
Condition
Figure 3. 2 - Flow Chart for Research Methodology

18
3.2 – Modeling On Solar Vortex Engine
The geometrical modelling was developed using PTC Creo 2.0 Parametric, an Engineering
Drawing Commercialized Software. The Vortex Engine Generator (VEG) was
constructed at a diameter of 0.9m and with a configuration of 8 rectangular air entry slots,
8 curved guide vanes and a circular base. An outer cylinder with diameter 1.0m of was
constructed to embrace the VEG. A top plate was then constructed and slot in between the
VEG and an octagonal shaped Transparent Bounding Structure (TBS).
The Transparent Bounding Structure (TBS) of height 0.60m was created based on
prototype’s parameters to study on air vortexes extending beyond its physical height of
vortex engine. This is adequate for the preliminary simulations to investigate on the
updraft of airflow. A Boolean function was applied later within ANSYS Design-Modeler
to minus out the interior fluid volume from the geometrical frame for simulation purpose.
The geometrical model constructed is showed in Figure 3.3 in an exploded view. The
dimensions for VEG is showed in Figure 3.4 below.
Transparent Bounding
Structure (TBS)
Outer Cylinder + Insulation
Vortex Engine Generator
(VEG)
Top Plate (TP)
Figure 3. 3 - Sectioned view on Geometrical Modeling for VEG

19
Table 3. 1 – Parameters for Vortex Engine Generator
Parameters unit Value
Height of Transparent Bounding Structure (TBS) m 0.6
Height of Vortex Engine Generator (VEG) m 0.6
Height of Outer Cylinder + Insulation m 1.0
Figure 3. 4 - Configuration for Vortex Engine Generator (VEG)
Table 3. 2 – Dimensions for Vortex Engine Generator (VEG)
Order. Parameters Unit Dimensions
A Air entry slot height m 0.3
B Air entry slot width m 0.1
C VEG diameter m 0.9
D VEG height m 0.6
E Guide vanes angle Degree, 25
F Guide vanes length m 0.35
G Guide vanes height m 0.3
A
B
D
C G
F
E

20
Figure 3.5 shows the interior fluid body of Vortex Engine Generator (VEG) which was
constructed for purpose of numerical simulation.
Figure 3. 5 – Fluid Body Structure of Vortex Engine Generator (VEG)
3.3 – Modelling of Top Plate
This research mainly focus on the top plate of SVE. A geometrical model for top plate
was designed based on available prototype installed in solar research site within Universiti
Teknologi PETRONAS to ease testing and experimental purpose. The top plate has an
annulus structure with an outer diameter and inner diameter. The top plate can be
categorized into two, namely a flat shaped top plate and a concentric circles canopy shaped
top plate. Figure 3.6 and figure 3.7 show the configuration for both types of top plate. The
area of top plate exposed to solar radiation can be calculated as below:

21
Where:
𝐴𝑡𝑝 Top Plate Area
=1
4𝜋𝐷𝑐
2 −1
4𝜋𝐷𝑜
2
(1)
Where:
𝐴𝑡𝑝 Top Plate Area
= 𝜋 (𝐷𝑜
2+
𝐷𝑖
2) √(
𝐷𝑜
2−
𝐷𝑖
2)
2
+ ℎ2
(2)
The top plate has been geometrical constructed with two type of material, namely
Aluminum and Perspex for numerical investigation. The variation in material transparency
will highly affect the Discrete Ordinates (DO) function in ANSYS to simulate the flow
field within Vortex Engine Generator (VEG).
In order to obtain the optimum opening diameter that will improve solar updraft without
compromising the heat transfer by solar radiation, another three top plates with different
inner diameter (0.3m, 0.5m, and 0.9m) were constructed geometrically. The top plate was
removed on the 0.9m case which allowed the Vortex Engine Generator to be fully opened.
The dimensional modifications on the flat Solar Top Plate is showed in Figure 3.8 below.
Simulations were done on all three diameters to determine the relationship between flow
velocity and opening area. The optimum opening diameter simulated was then be made
onto a canopy shape (slanted top plate) to promote air updraft as showed in Figure 3.9.
Figure 3. 6 – Annulus Shaped Top Plate
Figure 3. 7 – Canopy Shaped Top Plate

22
Figure 3. 8 - Proposed opening diameters for top plate
Figure 3. 9 - Proposed Modifications on Solar Top Plate
Table 3.3 below shows the material properties for the Perspex Top Plate.
Table 3. 3 – Material Properties for Top Plate
Properties Value
Perspex Emmisivity, 𝜖𝑝 0.9
Perspex Transimissivity, 𝜏𝑝 0.92
Perspex Absorptivity, 𝛼𝑝 0.06
Stefan-Boltzmann constant, 𝜎 5.67× 10⁻⁸ 𝑊 𝑚2. 𝐾4⁄
3.4 – Numerical Investigation
A 3D Geometrical Modeling on the SVE based on the prototype’s parameters was
developed using PTC Creo 2.0 Parametric. The geometries were then transfer to ANSYS
Workbench 15 for further meshing and simulation. Computational Fluid Dynamics (CFD)
simulation techniques were applied to simulate physical phenomena and to predict on the
dynamic behavior and thermo-properties of air within 3-D cylindrical coordinates. Finite
Volume Method (FVM) was used to discretize the Navier-Stokes Equations, continuity
equation and energy equation [24].
3.4.1 Mesh Generation
Mesh independency tests were conducted preliminary by changing the relevance center to
identify the appropriate cell size or element number which provide the most stable and

23
accurate result with convergence criteria met. The default maximum face size provided
by the system (ANSYS Fluent) was used as reference and further meshing were done by
decreasing the maximum face size by a value of 0.01 for up to a total of 11 trials. Further
decrement on max face size will lead to number of elements to exceed 512,000 cells which
is not allowed under ANSYS educational package. The aspect ratio, number of nodes and
elements were recorded for analysis and selection. Percentage of differences between
current value and last trials (predecessor) were calculated to determine stability of outlet
velocity. Refer to Appendix B for the full mesh independency analysis. Figure 3.10 below
shows the mesh generated on the interior fluid body model of Vortex Engine Generator
(VEG).
Figure 3. 10 – Mesh Generated on VEG model
3.4.2 Numerical Simulations
Simulations in Fluent employed Boussinesq Model for natural convection [25]. This
model assume density remains a constant value in all solved equations, except for the
buoyancy term in the momentum equation. Simulations were conducted based on
unsteady 𝑘 − 𝜀 turbulence model. The Semi Implicit Method for Pressure Linked
Equation – Consistent (SIMPLEC) algorithm was applied for second order discretization
for pressure, momentum and energy to obtain more converged solution.

24
Discrete Ordinates (DO) has been applied under the radiation model to represent the solar
insolation or radiation load passing through the transparent Perspex to heat up the air
underneath. The amount of radiation is highly depend on the solar insolation available and
the value was obtained from solar calculator pre-build in ANSYS Fluent 15. Global
irradiance was employed in solar calculator which include transmitted, absorbed and
reflected irradiance. Thus, the amount of intensity transmitted (Global Irradiance):
𝐼0 = 𝐼𝑇 + 𝐼𝐴 + 𝐼𝑅
(3)
3.4.3 Governing Equations
Various working principle and governing equations have been applied in numerical
simulation done with ANSYS Fluent 15. Bernoulli’s Equation, Conservation of
Momentum and Energy Balance Equation were applied to studies the flow field within
Vortex Engine Generator (VEG).
1. Ideal Gas Law
Top plate is installed to increase the outlet temperature to promote better updraft. Idea Gas
Law can be applied to determine the relationship between air temperature on air density
and pressure.
𝑃 = 𝜌𝑅𝑇 (4)
2. Air Continuity Equation
The flow of air within tower for Solar Vortex Engine is treated to be under confined flow
condition with inlet and outlet. Continuity Equation [26] has been used to identify the
suitable opening area on the top plate without sacrificing airflow velocity. The flow is
assumed to be incompressible where increment in temperature is counterbalanced by
pressure under ideal gas law. Continuity equation based on cylindrical coordinates is
applicable to the top plate simulation. [27, 28].
where 𝜌 is the airflow density, V is the airflow updraft velocity and t is the time.
∇. (𝜌𝑉) = 0
1
𝑟
𝜕(𝑟𝑝𝑣𝑟)
𝜕𝑟+
1
𝑟
𝜕(𝑝𝑣𝜃)
𝜕𝜃+
𝜕(𝑝𝑣𝑧)
𝜕𝑧= 0
(5)
(6)

25
3. Navier-Strokes Equations on Cylindrical Polar Coordinates [26]
𝑟
𝜃
𝑧
𝜌 (𝑣𝑟
𝜕𝑣𝑟
𝜕𝑟+
𝑣𝜃
𝑟
𝜕𝑣𝑟
𝜕𝜃−
𝑣𝜃2
𝑟+ 𝑣𝑧
𝜕𝑣𝑟
𝜕𝑧)
= −𝜕𝑝
𝜕𝑟+ 𝑝𝑔𝑟 + 𝜇 (
1
𝑟
𝜕
𝜕𝑟(𝑟
𝜕𝑣𝑟
𝜕𝑟) −
𝑣𝑟
𝑟2+
1
𝑟2
𝜕2𝑣𝑟
𝜕𝜃2−
2
𝑟2
𝜕𝑣𝜃
𝜕𝜃+
𝜕2𝑣𝑟
𝜕𝑧2)
𝜌 (𝑣𝑟
𝜕𝑣𝜃
𝜕𝑟+
𝑣𝜃
𝑟
𝜕𝑣𝜃
𝜕𝜃+
𝑣𝑟𝑣𝜃
𝑟+ 𝑣𝑧
𝜕𝑣𝜃
𝜕𝑧)
= −1
𝑟
𝜕𝑝
𝜕𝜃+ 𝑝𝑔𝜃 + 𝜇 (
1
𝑟
𝜕
𝜕𝑟(𝑟
𝜕𝑣𝜃
𝜕𝑟) −
𝑣𝜃
𝑟2+
1
𝑟2
𝜕2𝑣𝜃
𝜕𝜃2+
2
𝑟2
𝜕𝑣𝑟
𝜕𝜃+
𝜕2𝑣𝜃
𝜕𝑧2)
𝜌 (𝑣𝑟
𝜕𝑣𝑧
𝜕𝑟+
𝑣𝜃
𝑟
𝜕𝑣𝑧
𝜕𝜃+ 𝑣𝑧
𝜕𝑣𝑧
𝜕𝑧) = −
𝜕𝑝
𝜕𝑧+ 𝑝𝑔𝑧 + 𝜇 (
1
𝑟
𝜕
𝜕𝑟(𝑟
𝜕𝑣𝑧
𝜕𝑟) +
1
𝑟2
𝜕2𝑣𝑧
𝜕𝜃2+
𝜕2𝑣𝑧
𝜕𝑧2)
(7)
(8)
(9)
4. Conservation of Mass [26]
Conservation of Mass principle was applied to investigate the inlet flow rate and outlet
flow rate based on air updraft velocity. Incompressible flow is assumed for the operation
fluid.
𝑚𝑖𝑛𝑙𝑒𝑡 =̇ 𝑚𝑜𝑢𝑡𝑙𝑒𝑡̇
𝜌𝐴𝑖𝑛𝑙𝑒𝑡𝑉𝑖𝑛𝑙𝑒𝑡 = 𝜌𝐴𝑜𝑢𝑡𝑙𝑒𝑡𝑉𝑜𝑢𝑡𝑙𝑒𝑡
𝐴𝑖𝑛𝑙𝑒𝑡𝑉𝑖𝑛𝑙𝑒𝑡 = 𝐴𝑖𝑛𝑙𝑒𝑡𝑉𝑖𝑛𝑙𝑒𝑡
(10)
Preliminary simulation was conducted to seek for improvement on replacement of
material transparency specification. The top plate material was changed from opaque
aluminum to semi-transparent Perspex characteristic. Further simulations were conducted
independently on different top plate opening diameter ranging from 0.3m, 0.5m 0.7m to
0.9m. The optimum opening diameter will then be implemented to canopy shaped top
plate. The canopy shaped top plate was aimed for the investigation on the relationship
between air-cornering underneath top plate with top plate slanting angle. Several slanting
angles (8.53°, 10°, 20°, 30° and 40°) were selected for simulations to identify the optimum
angle in reducing air cornering without compromising the air updraft and temperature.
The simulation findings were later analyzed and validated through experiments.
Convergence criterion was achieved when the ratio of maximum mass imbalance for each
control volume is less than 0.01, the velocity and 𝑘 − 𝜀 viscous reduce to 0.001, while
Discrete Ordinates and energy reduce to 10−6 in residual monitor.

26
3.4.4 Numerical Simulation Setup
The setup for simulation within ANSYS Fluent 15 is as below:
1. Solver Type – Pressure Based, Absolute Velocity Formulation and Steady time
scheme.
2. Model Setup with Energy Equation
Viscous = 𝑘 − 𝜀 model for turbulent flow.
RNG – Swirl dominated flow and S = 0.07
Near – Wall Treatment = Standard Wall Functions
Options – Full Buoyancy Effects
Radiation = Discrete Ordinates (DO)
Solar Load – DO Irradiation with Solar Calculator
Longitude 100.98’ E and Latitude 4.42’ N
Timezone = +8 GMT with North (Z=-1) and East (X=1)
Day 18, Month 2, Hour 13, Minute 0
Solar Irradiation Method = Fair Weather Conditions
Sunshine Factor =1
Figure 3. 11 - ANSYS Fluent 15 Viscous Model Setup
3. Materials – Fluid (Air), Solid (Aluminum) and Solid (Perspex)
Fluid (Air)
Density = Boussinesq (1.225kg/m3)

27
Air Thermal Expansion Coefficient = 0.00303/K
Solid (Aluminum)
Properties = Opaque
Thermal Conductivity = 202.4W/m.K
Density = 2719kg/m3
Specific Heat = 871J/kg.K
Solid (Perspex)
Properties = Semi-Transparent
Thermal Conductivity = 0.189W/m.K
Density = 1200kg/m3
Specific Heat = 1200J/kg.K
4. Boundary Conditions – As described in section 3.4.5
5. Solution Method –
Pressure–Velocity Coupling – SIMPLEC with Skewness Correction: 0
Spatial Discretization –
Gradient – Green-Gauss Cell Based
Pressure – PRESTO!
Momentum – Second Order Upwind
Energy – Second Order Upwind
Turbulent Kinetic Energy – Second Order Upwind
Turbulent Dissipation Rate – Second Order Upwind
Discrete Ordinates – Second Order Upwind
6. Solution Controls – Relaxation Factors
Pressure - 0.3
Momentum – 0.01
Density, Body Forces, and Energy – 0.5
7. Solution Initialization – Compute from main inlets (Air entry slots)

28
3.4.5 Boundary Conditions
Case 1 Boundary Conditions
Case 1 was simulated with Aluminum Top Plate and consideration of Solar Radiation.
Boundary conditions were selected based on Experiment 1 parameters.
Table 3. 4 – Boundary Condition for Case 1
Surfaces/
Components
No. of
Items
Boundary
Type Boundary Conditions
Transparent
Bounding
Structure
(TBS)
8 Wall Material = Perspex
Constant temperature = 315K
Stationary with no slip condition
Top Plate 1 Wall Material = Aluminum
Stationary with no slip condition and
constant temperature = 316K
Top Plate
opening 1 Outflow Opening Diameter = 0.3m
Inner cylinder
(VEG) 1 Wall
Material = Aluminum
Constant temperature = 316K
Stationary with no slip condition
Curved Vanes 8 Wall Material = Aluminum
Constant temperature = 316K
Stationary with no slip condition
Air entry slots 8 Velocity-Inlet Constant normal Velocity = 0.3m/s
Constant temperature = 312K
Base inlet 1 Velocity-Inlet Constant normal Velocity = 0m/s **
Constant temperature = 316K
Ambient
Condition - - Constant Temperature = 314K
** The base inlet air flow velocity was set to be 0m/s as the base opening will be covered
or closed in future experimental works.

29
Case 2 Boundary Conditions
Case 2 was simulated with Perspex Top Plate (0.3m Opening Diameter) and consideration
of Solar Radiation. Boundary conditions were selected based on Experiment 2 parameters.
Table 3. 5 – Boundary Condition for Case 2
Surfaces/
Components
No. of
Items
Boundary
Type Boundary Conditions
Transparent
Bounding
Structure
(TBS)
8 Wall Material = Perspex
Constant temperature = 315K
Stationary with no slip condition
Top Plate 1 Wall Material = Perspex
Stationary with no slip condition and
constant temperature = 322K
Top Plate
opening 1 Outflow Opening Diameter = 0.3m
Inner cylinder
(VEG) 1 Wall
Material = Aluminum
Constant temperature = 325K
Stationary with no slip condition
Curved Vanes 8 Wall Material = Aluminum
Constant temperature = 325K
Stationary with no slip condition
Air entry slots 8 Velocity-Inlet Constant normal Velocity = 0.7m/s
Constant temperature = 322K
Base inlet 1 Velocity-Inlet Constant normal Velocity = 0m/s **
Constant temperature = 325K
Ambient
Condition - - Constant Temperature = 314K
** The base inlet air flow velocity was set to be 0m/s as the base opening will be covered
or closed in future experimental works.

30
Case 3 Boundary Conditions
Case 3 was simulated with changing variable of Perspex Top Plate (0.5m, 0.7m, 0.9m
Opening Diameter) and consideration of Solar Radiation. Boundary conditions were
selected based on Experiment 2 parameters.
Table 3. 6 – Boundary Condition for Case 3
Surfaces/
Components
No. of
Items
Boundary
Type Boundary Conditions
Transparent
Bounding
Structure
(TBS)
8 Wall Material = Perspex
Constant temperature = 315K
Stationary with no slip condition
Top Plate 1 Wall Material = Perspex
Stationary with no slip condition and
constant temperature = 322K
Top Plate
opening 1 Outflow Opening Diameter = 0.5m, 0.7m, 0.9m
Inner cylinder
(VEG) 1 Wall
Material = Aluminum
Constant temperature = 325K
Stationary with no slip condition
Curved Vanes 8 Wall Material = Aluminum
Constant temperature = 325K
Stationary with no slip condition
Air entry slots 8 Velocity-Inlet Constant normal Velocity = 0.7m/s
Constant temperature = 322K
Base inlet 1 Velocity-Inlet Constant normal Velocity = 0m/s **
Constant temperature = 325K
Ambient
Condition - - Constant Temperature = 314K
** The base inlet air flow velocity was set to be 0m/s as the base opening will be covered
or closed in future experimental works.

31
Case 4 Boundary Conditions
Case 4 was simulated with changing variable of Canopy Shaped Perspex Top Plate (8.53’,
10’, 20’, 30’ and 40’ slanting angle) and consideration of Solar Radiation. Boundary
conditions were selected based on Experiment 2 parameters.
Table 3.7 – Boundary Condition for Case 4
Surfaces/
Components
No. of
Items
Boundary
Type Boundary Conditions
Transparent
Bounding
Structure
(TBS)
8 Wall Material = Perspex
Constant temperature = 315K
Stationary with no slip condition
Top Plate 1 Wall Material = Perspex
Stationary with no slip condition and
constant temperature = 322K
Top Plate
opening 1 Outflow
Opening Diameter = 0.3m
Slanting angle = 8.53’, 10’, 20’, 30’,
40’
Inner cylinder
(VEG) 1 Wall
Material = Aluminum
Constant temperature = 325K
Stationary with no slip condition
Curved Vanes 8 Wall Material = Aluminum
Constant temperature = 325K
Stationary with no slip condition
Air entry slots 8 Velocity-Inlet Constant normal Velocity = 0.7m/s
Constant temperature = 322K
Base inlet 1 Velocity-Inlet Constant normal Velocity = 0m/s **
Constant temperature = 325K
Ambient
Condition - - Constant Temperature = 314K
** The base inlet air flow velocity was set to be 0m/s as the base opening will be covered
or closed in future experimental works.

32
3.5 – Experimental Approach
All the experimental procedures, measurements instruments, prototype construction and
modifications have been included in this section. Configurations on SVE prototype and
measurements have been illustrated with figures.
Experiments are conducted with the aims to verify and validate a hypothesis while a
hypothesis is an expectation on how a particular process and phenomena works. In every
experiments, there are changing variable(s), dependent variable(s) and fixed variable(s).
Experiments rely on repeatable steps or procedures and logical analysis of the results.
Results or outcomes of the experiment will either support or disprove the hypothesis.
This experiment is conducted to answer the “What-if” question. Modification and
improvements (Changing Variables = “What-if”) were done on the pre-installed prototype.
Sensors were installed for experimental measurements and measuring results are the
Dependent Variables. Experimental measurements were done on a pretest-posttest basis.
First measurement was done before intervention factor place which an opaque aluminum
top place was installed above the VEG. Same measurements were done later after the
intervention factor took place in which three transparent top plate with different orifice
diameter were installed above the VEG. Comparison on pretest and posttest results were
made to determine the causal effect from the modifications.
The experimental testing on Solar Vortex Engine is categorized as Field Experiment. The
outcome of the experiment is observed in a natural setting rather than a contrived
laboratory experiment. It has a higher external validity. However, field experiment would
suffer higher possibility of contaminations.
Experimental implementation must take into account and make possible control on the
confounding factors. Confounding factor is any factors that would mar the accuracy or
repeatability of the experiment or the ability to interpret the results. Example of
confounding factors would be the experimental errors or uncertainties in measurements.

33
3.5.1 Experimental Setup for Solar Vortex Engine (SVE)
The Solar Vortex Engine (SVE) is consisted on a Vortex Engine Generator (VGE), Solar
Collector (SC) and Transparent Bounding Structure (TBS). The prototype for SVE was
fabricated previously based on before-hand research and is located at Solar Research Site
in Universiti Teknologi PETRONAS. This pre-built prototype has been applied as the
experimental model for this research.
The working environment of the Solar Vortex Engine prototype installed at the solar
research site in Universiti Teknologi PETRONAS is as below:
Location Altitude: 24.23m
Latitude and Longitude: 4.42°𝑁, 100. 98°𝐸
Average wind velocity: 1.4m/s
Average solar intensity: 200-1000𝑊 𝑚2⁄
Ambient temperature: 300-304K
Ambient pressure: 100.2kPa
Two experiments were conducted to verify on the numerical simulations and to determine
the contribution of transparent top plate on the performance of Solar Vortex Engine.
Experiment 1 was conducted to with an opaque Aluminum Top Plate to investigate the air
flow velocity and temperature Experiment 2 was conducted with a Perspex Top Plate
where all other parameters remain constant. The results obtained from experiment 1 were
applied as the reference or baseline value to prove on any modification made on the
prototype. By changing the transparency of the top plate, the solar intensity became the
changing variable between the two experiments. Multiple parameters were measured
ranging from solar updraft velocity, airflow tangential velocity and radial velocity, airflow
and surface temperature and to name a few.

34
Figures below shows the construction of Solar Vortex Engine (SVE).
Figure 3. 12 - Solar Vortex Engine Testing Unit installed at UTP Solar Research Site
Figure 3. 13 – Top View of Solar Vortex Engine (SVE) with Aluminum Top Plate
Transparent
Bounding
Structure
(TBS)
Thermal
Insulation
Vortex Engine
Generator
(VGE)
Solar
Collector
(SC)
Aluminum
Top Plate
Top Plate
opening
(Central hole)

35
Figure 3. 14 – Top View of Solar Vortex Engine (SVE) with Perspex Top Plate
3.5.2 Components and Dimensions for Solar Vortex Engine
Table 3. 8 – Components and Dimensions for Solar Vortex Engine
System
Components
Materials Properties Dimensions
Description Value Items Value
Transparent
Bounding
Structure
(TBS) /
Protector
Perspex
thickness, 𝑡𝑝 5 mm
Height, ℎ𝑇𝐵𝑆 0.6 m
Perspex
emissivity, 𝜖𝑝 0.9
Perspex
transmissivity, 𝜏𝑝 0.92
Perspex
absorptivity, 𝛼𝑝 0.06
Density, 𝜌 1200𝑘𝑔/𝑚3
Specific Heat, C 1200J/kg.K
Thermal Exp.
Coef. 0.003031/K
Thermal
Insulation
Fiberglass
thickness, 𝑡𝑓 0.0254
Radius, 𝑟𝑓 0.5 m Fiberglass
thermal
conductivity, 𝑡𝑝 0.04 W/m.K
Perspex Top
Plate
Vortex Engine
Generator
(VEG)
Guide
Vanes
Air entry
slots
Thermocouples
Sensors

36
Outer
Cylinder
Aluminum
thickness 2 mm Radius, 𝑟𝑂𝐶 0.5 m
Aluminum
thermal
conductivity
25 W/m.K Height, ℎ𝑂𝐶 1.0 m
Inner
Cylinder
Aluminum
thickness 2 mm
Radius, 𝑟𝐼𝐶 0.45 m
Height, ℎ𝐼𝐶 0.6 m
Air entry slot number, 𝑁 8
Air entry slot width, 𝑤𝑠 0.1 m
Air entry slot height, ℎ𝑠 0.3 m
Aluminum
thermal
conductivity
25 W/m.K
Guide vanes number, 𝑁 8
Guide vanes height, ℎ𝑣 0.3 m
Guide vanes deflection
angle, 𝜃𝑣 25
Base radius, 𝑟𝑜𝑏 0.45 m
Base inner radius, 𝑟𝑖𝑏 0.05 m
SC
Steel chassis 1.5 inch
Angle of canopy slope
8.53”
Perspex
emissivity 0.9
Perspex
transmissivity 0.92
Outer radius
4.4 m
Perspex
absorptivity 0.06
Perspex surfaces
roughness, 0
Inner radius
0.5 m Density, 𝜌 1200𝑘𝑔/𝑚3
Specific Heat, C 1200J/kg.K Outer height 0.24 m
Thermal Exp.
Coef. 0.003031/K Inner height 0.79 m
Ground
Sand, Crash
Stone and pebble
stone layers’
absorptivity,
~ 0.7 Outer radius 4.4 m
3.5.3 Experimental Positioning For Measurements
Experimental measurements were divided into Fixed Measurements and Transient
Measurements. All measurements were done with measuring instruments mentioned in
last section which includes: GRAPHTEC DATA LOGGER GL820 for temperature
measuring, Digital Reader KIMO-AMI 300 with Multi Probes for Velocity, Temperature,

37
Humidity and Pressure measuring, and Solarimeter KIMO-SL 200 Instrument for solar
radiation measuring. Details of measuring instruments were attached in Appendix A.
Fixed measurements method applied GRAPHTEC DATA LOGGER GL820 with type J
thermocouples and were installed at certain fixed position on Solar Vortex Engine (SVE)
and data recording is done automatically by the instrument at specified interval. No
manual recording and monitoring is required.
Positioning of experimental measurements are illustrated as below in Figure 3.15.
Thermocouples type J have been installed at position 1 to 9 in radial direction of the Solar
Collector (SC) for measurements of ground, air flow and collector surface temperature.
Thermocouples 1, 2 and 3 were placed under the pebble stones while thermocouples 4, 5
and 6 were place at middle height underneath solar collector. Thermocouples 7, 8 and 9
were installed at top surface of SC. Thermocouple 10 was placed on VEG base aluminum
to measure surface temperature while Thermocouple 11 was placed in the middle at top
plate opening to measure air outflow temperature. Two more thermocouples were installed
at position 13 and 14 to measure surface temperature of VEG interior wall and top plate
surface temperature.
Transient measurements method involved the manual measuring with Digital Reader
KIMO-AMI 300 at specified location within SVE. The measuring interval or frequency
depend solely on user and an hour interval has been applied. The transient measurements
were done at position 11, 12, 14, 16, and 17. Position 11 was mean to measure air outflow
temperature, velocity, humidity, and volume flow rate while position 12 recorded the
ambient temperature, velocity and humidity for comparison purpose. Solarimeter has been
used to measure solar intensity directed above and underneath the top plate at position 14.
Air inflow temperature and velocity were recorded with hotwire prove at position 16 and
airflow tangential and radial velocity were measured at position 17.
The temperature recorded by Thermocouples type J was saved in Excel files format and
was directly transferred to an USB memory drive connected to the Graphtec Data Logger
GL820. Transient experimental measurements on solar intensity, temperature, velocity
and humidity were captured manually on an hourly basis starting from 9a.m. to 5p.m. in a
day. The data were later analyzed and compiled as well in Chapter 4.

38
Figure 3. 15 - Sectional Schematic for Experimental Measurements Positions
Table 3. 9 – Experimental Measuring Positions with Instruments
Items Positions Parameters
Positioning Dimensions
Probe R – axis
(m)
Z –axis
(m)
Ground
1
Temperature
4.4 0
Thermocouples 2 2.4 0
3 0.5 0
Air flow
under SC
4
Temperature
4.4 0.12
Thermocouples 5 2.4 0.27
6 0.5 0.395
SC
7
Temperature
4.4 Canopy
Surface Thermocouples 8 2.4
9 0.5
VEG
10 Temperature 0.3 1.19 Thermocouples
15 Temperature 0.5 1.49 Thermocouples
16 Temperature
0.45 1.29 Hotwire Velocity
17
Tangential
Velocity 0.2 1.29 Hotwire
Radial
Velocity
1 2
12
9
8
7 6
5
4
3
13
11 14
15
10
R
Z
0
0.395
0.79
1.19
1.49
1.79
2.09
16 17

39
Outlet 11
Temperature
0 1.79
Thermocouple
Velocity Hotwire
Vol. flow rate
Humidity Airflow Meter
Ambient 12
Temperature
- - Hotwire
Velocity
Humidity Airflow Meter
TBS 13 Temperature 0.5 2.09 Thermocouple
Top Plate 14 Temperature
0.3 1.79 Thermocouple
Solar Intensity Solarimeter
3.6 – Gantt Chart
3.6.1 FYP 1
Table 3. 10 – Gantt Chart for FYP 1
No Task % WEEK
1 2 3 4 5 6 7 8 9 10 11 12 13 14
1
Stage 1
Title Selection 100
Title understanding 100
2
Stage 2
Research on Vortex Engine and Solar Top
Plate 100
Search for related Research Papers 100
Download ANSYS Fluent 15 Software and
PTC Creo 3.0 100
Research on mesh generation 100
3
Stage 3
Identification of Problem Statement 100
Identification of Objectives 100
Preparation of Keymilestones 100
Literature Review 100
Comparison on previous researches 100
Preparation of First Draft Proposal 100
Extended Proposal and Proposal Defense 100
4
Stage 4
Geometrical Modeling Development 100
Simulation (Trial and Error) 100
Simulation and Prototype Fabrication 100

40
Compare simulation with Previous
Researches 100
Mesh Independency Test 100
Result analysis and recording 100
Submission of report 100
3.6.2 FYP 2
Table 3. 11 – Gantt Chart for FYP 2
No Task % WEEK
1 2 3 4 5 6 7 8 9 10 11 12 13 14
5
Stage 5
Prototype Cleaning 100
Literature Review 100
Experiment 1 100
Experiment 2 100
Conduct Measurements and Record Data 100
Analysis of Results and make comparisons 100
Submission of Progress Report 100
6
Stage 6
Finalize content 100
Technical Paper Preparation 100
Finalize and review on project objectives 100
Compile various simulations into report 100
Seek supervisor review 100
Submission of report and dissertation 100

41
3.7 – Project Key Milestone
Geometrical Modeling, simulations and fabrication of prototype (top plates) are conducted
within FYP 1. Mesh independence test was applied to identify the most suitable cells
number in determining an accurate result.
Figure 3. 16 – Key Milestone for FYP
3.8 – Summary
All the required information on the approaches of this research has been compiled within
this chapter. The methodology started with the conceptual design of the Solar Vortex
Engine and followed by the geometrical modelling for numerical simulation. Boundary
condition and setup adopted has been placed under numerical procedure. The dimensional
information and fabrication of prototype have been included as well in this chapter.

42
CHAPTER 4
RESULT AND DISCUSSION
4.1 Foreword
Solar Vortex Engine (SVE) utilized solar thermal system to heat up airflow underneath
collector to promote natural free convection, generating low pressure within vortex engine,
leading to constant air supply from higher pressure ambient air. Top plate was installed to
further improve updraft by generating larger temperature variation within Vortex Engine
Generator (VEG), lowering air buoyancy and leading to lower internal pressure.
Transparent Top plate allows the penetration of solar radiation and apply solar energy as
the source of energy supply to heat up air. This research was done to improve top plate
efficiency in order to raise power plant performance. With the correct material selected
for the construction on top plate, the efficiency on collector in capturing solar radiation
increased. Higher temperature can be obtained from the airflow underneath the top plate,
leading to a larger temperature variation compare to ambient air. Airflow velocity (natural
convection) increased due to the temperature variation. Efficiency in converting airflow
kinematic energy into mechanical energy was increased as well, promoting the power
plant generation performance.
Results and findings obtained are discussed and analyzed in this chapter. Comparisons
were made between numerical results and experimental measurements for validation
purpose.
4.2 Numerical Simulation Results
Computational Fluid Dynamics Method (CFD) was adopted to simulate the physical
phenomena within Vortex Engine Generator (VEG). Simulations findings are showed in
contours, vectors and X-Y plots. Several cases have been simulated for comparison
purpose and seek for parameters’ improvement due to the modifications did on the top
plate. The optimum opening diameter and slanting angle on canopy shaped top plate are
included at the end of this section. Mesh independency tests were conducted at the very
first place before any iterations to determine the best mesh size for most accurate result.

43
4.2.1 Mesh Independency Test (MIT)
A few runs on simulating the same parameters are conducted through Mesh Independency
Test to identify the appropriate elements number and cells size which provide the stable
result. Lowest mesh size was selected among the stabled trials in order to achieve lowest
duration for simulation. Laminar flow and zero energy have been applied in the test to
accelerate convergent. The default mesh size provided by ANSYS Fluent 15 was treated
as the first simulation and act as a reference. A decrement of 0.01m on maximum face size
was adopted for further trials.
Smoothing operation tends to reposition nodes based on the average of the neighbors’
nodes. Reposition strategy improves the mesh skewness but relaxes the clustering of node
points. Smoothing can be categorized into Laplace smoothing where all types of meshes
are applicable and Skewness based smoothing for triangular and tetrahedral meshes. With
Fine smoothing, the minimum cell size and maximum cell size are limit to 2.057 ×
10−4𝑚 𝑎𝑛𝑑 4.115 × 10⁻²𝑚 . The default meshing provided by ANSYS has Coarse
Relevance Center and Medium Smoothing. A Medium Relevance Center and Medium
Smoothing was adopted as the second trial while Fine Relevance Center and High
Smoothing was applied for third trial.
The aspect ratio, elements number, maximum velocity, maximum pressure and percentage
difference were considered and monitored for mesh size selection. Finally, trial 4 with
Max Face Size of 0.027m, an aspect ratio of 12.40 and cells number of 211,833 was
selected due to approximately zero percentage difference compare to predecessor.
Stability was obtained in trial 4. Although trial 10 recorded the lowest aspect ratio, it was
not selected due to the larger percentage difference. Figure 4.1 and 4.2 shows the stability
of maximum velocity and pressure against trials and their aspect ratio. Refer to Appendix
B.1 for full statistical table on mesh independency test conducted at inlet velocity of
0.5m/s.

44
Figure 4. 1 - Graph of Maximum Simulated Velocity and pressure vs Trials on MIT
Figure 4. 2 - Graph of Aspect Ratio vs Trials on Mesh Independency Test
The inlet flow rate at 8 air inlet slots and top plate single outlet flow rate were calculated
and compared simultaneously within Mesh Independency Test. An average of outflow
velocity at top plate opening has been applied on the calculation on outlet flow rate. Figure
4.3 below shows the approaches in obtaining the average outlet velocity.
Figure 4. 3 - XY Plot for Top Plate Outlet Velocity on Trial 11
1.50
2.00
2.50
3.00
3.50
4.00
4.50
5.00
5.50
1 2 3 4 5 6 7 8 9 10 11
Vel
oci
ty a
nd
Pre
ssu
re
Trials
Velocity and Pressure for MIT Trials
Max Velocity (m/s) Max Pressure (pascal)
0
20
40
60
80
1 2 3 4 5 6 7 8 9 10 11 12 13
Asp
ect
Rat
io
Trials
Aspect ratio for MIT Trials
Trial 4 was
selected
Trial 4 was
selected

45
Table 4. 1 - Inlet and Outlet Flow rate for 11 trials
Trials Inlet Flow Rate
(𝑚3/𝑠)
Outlet Flow Rate
(𝑚3/𝑠)
Percentage
Difference
1 0.12 0.125 0.043
2 0.12 0.124 0.031
3 0.12 0.120 0.002
4 0.12 0.120 0.002
5 0.12 0.123 0.025
6 0.12 0.122 0.013
7 0.12 0.115 0.040
8 0.12 0.128 0.066
9 0.12 0.122 0.019
10 0.12 0.124 0.031
11 0.12 0.124 0.031
Based on Figure 4.4, the outlet flow rates for several trials were matching with the inlet
flow rate of 0.12𝑚3/𝑠. The Conservation of mass principle was achieved in the trials. A
low percentage difference was recorded. Calculation on inlet flow rate and outlet flow rate
are shows as below. Trial 11 has been applied as sample calculation.
𝑄𝑖𝑛𝑙𝑒𝑡 = 8 ∗ 𝐴𝑖𝑛𝑙𝑒𝑡𝑉𝑖𝑛𝑙𝑒𝑡 = 8(0.1𝑚 × 0.3𝑚)(0.5 𝑚 𝑠⁄ ) = 0.12𝑚3/𝑠 (16)
𝑄𝑜𝑢𝑡𝑙𝑒𝑡 = 1.75𝑚/𝑠[𝜋(0.15)2] = 0.1237𝑚3/𝑠 (17)
Figure 4. 4 - Graph on Flow Rates vs Trials
0.1
0.11
0.12
0.13
0.14
0.15
1 2 3 4 5 6 7 8 9 10 11
Flo
w R
ate
(m3
/s)
Trials
Flow Rates vs Trials
Inlet Flow Rate Outlet Flow Rate

46
4.2.2 Numerical Investigation on Top Plate Material
Preliminary simulation (Case 1) was conducted on Aluminum Top Plate (TP) with
consideration on solar radiation. Discrete ordinates (DO) function has been selected within
ANSYS Fluent 15 to investigate and predict the effect on solar updraft the flow
temperature due to the solar radiation. Simulated result from case 1 was applied as a
reference or baseline information for comparison on further simulation. Experiment 1 was
then conducted with Aluminum Top Plate (TP) to verify on the simulated result and
boundary conditions.
Case 2 simulation was conducted with Perspex Top Plate to predict the improvement
compare to case 1. Perspex material properties was entered into numerical setup and semi-
transparency feature has been selected to allow the penetration of solar radiation into the
Vortex Engine Generator (VEG) during simulation. Discrete Ordinates (DO) has been
selected as well in case 2 simulation. Experiment 2 was then conducted to validate on the
boundary conditions and simulated results.
Numerically simulated result ranging from static temperature, static pressure, velocity
magnitude, and tangential velocity were compared and displayed as below.
Solar Radiation Analysis
Solar intensity was the changing variable between the two cases. Solar radiation was
simulated in both cases by Discrete Ordinates (DO) setup. Discrete Ordinates considered
all the radiation intensity ranging from direct normal solar radiation, diffuse solar
irradiation on both vertical and horizontal surfaces and ground reflected solar irradiation.
Opaque Aluminum top plate tended to absorb most of the direct solar radiation, raising
only its own temperature. Solar radiation was blocked and reflected. It was beyond
reaching the interior atmosphere of VEG. Thus, as shown in Figure 4.5, a low intensity of
2.24e+03𝑊 𝑚2⁄ was simulated within the VEG.
On the other hand, Perspex Top Plate allowed the solar radiation to penetrate to heat up
the interior wall and airflow of VEG. Thus, from Figure 4.6, case 2 with Perspex
configuration received peak incident radiation of 4.71e+03𝑊 𝑚2⁄ below the top plate and
reduced further down. Most of the interior airflow received an average radiation intensity

47
of 3.18e+03𝑊 𝑚2⁄ which was higher compare to case 1 with aluminum configuration.
Higher radiation intensity is beneficial in raising airflow temperature and improve engine
performance.
Figure 4. 5 – Case 1 Sectional Incident Radiation Contour (Aluminum)
Figure 4. 6 – Case 2 Sectional Incident Radiation Contour (Perspex)
Temperature Distribution
Solar intensity has been very much affected the temperature distribution of the interior
flow field within the Vortex Engine Generator (VEG). Interior wall and airflow
temperature were directly proportional to the solar intensity. The higher the solar intensity,
the higher the top plate efficiency and thus, more useful heat gain was created.

48
As aluminum top plate blocked most of the solar intensity, a lower wall and airflow
temperature were simulated. As shown in Figure 4.7, the wall achieved maximum
temperature of 316K (43C) while airflow achieve maximum temperature of 314K (41C).
The temperatures simulated have been very much match with the experimental
measurements. A comparison between simulated results and experimental measurements
was done and is included at the end of this chapter.
Case 2 on the other hand, simulated a higher wall and airflow temperature due to the higher
solar intensity. The wall achieved a maximum value of 325K (52C) while airflow reached
peak value of 323K (50C). The modification on top plate transparency has increased the
airflow thermal quality by approximately 9C.
Figure 4. 7 – Case 1 Sectional Static Temperature Contour on (Aluminum)
Figure 4. 8 – Case 2 Sectional Static Temperature Contour on (Perspex)

49
Velocity Magnitude Distribution
There are two methods in driving vertical airflow, namely (1) direct action of temperature
in reducing air buoyancy which also known as natural convection and (2) application of
vertical pressure gradient in creating a suction effect [29]. Increase in solar intensity led
to a higher airflow temperature which then promote natural convection or solar updraft.
A higher velocity was simulated on the side way (Green contour) in both cases due to the
present of vortexes. A lower velocity of approximately 0m/s appeared at the center of flow
field within the VEG. As shown in Figure 4.9, aluminum top plate prevent the penetration
of solar radiation and thus a lower temperature and velocity was simulated in case 1. The
maximum velocity achieved was 1.88m/s and an average outlet velocity of 1.32m/s was
simulated at the top plate orifice. Case 2 in contrast simulated a higher velocity magnitude
as penetrated solar intensity increased. Maximum velocity of 4.57m/s and average outlet
velocity of 2.28m/s were achieved as shown in Figure 4.10. As conclusion, the solar
radiation penetration did promoted better updraft and the velocity has been improved by
0.96m/s.
Figure 4. 9 – Case 1 Sectional Velocity Magnitude Contour (Aluminum)

50
Figure 4. 10 – Case 2 Sectional Velocity magnitude Contour (Perspex)
Static Pressure Distribution
The application of solar intensity to raise airflow temperature led to a higher outlet volume
flow rate and velocity. When the outlet flow rate increased, a low pressure domain was
created within the Vortex Engine Generator (VEG), creating a stack effect to draw in air.
As shown in Figure 4.11 and 4.12, Case 1 with aluminum top plate was simulated with a
higher interior pressure compare to case 2 with Perspex Top Plate. In creating a stack
effect within the Vortex Engine Generator (VEG), a lower interior pressure distribution
will beneficial to draw in more air from Solar Collector (SC), increasing the inlet velocity.
Figure 4. 11 – Case 1 Sectional Pressure Contour (Aluminum)

51
Figure 4. 12 – Case 2 Sectional Pressure Contour (Perspex)
Tangential Velocity Analysis
A raise in outlet volume flow rate tended to create a stack effect within the VEG. In obey
to the continuity equation or conservation of mass principle, the inlet flow rate has been
improved. As guide vanes was installed to direct the airflow to artificially create vortexes,
an increased in inlet mass flow rate indeed enhanced the tangential velocity within VEG.
Figure 4. 13 – Illustration on Vortex Engine Generator
Convection Region
Convergence Region

52
The simulated vector of tangential velocity at both convergence and convection regions
with Case 1 Aluminum Top plate are showed in Figure 4.14 and 4.15. A lower tangential
velocity was simulated in case 1 where an aluminum top plate was applied, only 1.66m/s
of maximum tangential velocity was achieved.
Figure 4. 14 – Case 1 Tangential Velocity at Convection Region (Aluminum)
Figure 4. 15 – Case 1 Tangential Velocity at Convergence Region (Aluminum)
On the contrary, as shown in Figure 4.16 and 4.17, Case 2 attain a maximum tangential
velocity of 3.90m/s on both convection and convergence regions. As conclusion, the
tangential velocity was improved with the replacement of Perspex Top plate which allow
the penetration of solar radiation to heat up the airflow within the Solar Vortex Engine
Generator. The tangential velocity has been improved by 31.74%.

53
Figure 4. 16 – Case 2 Tangential Velocity at Convection Region (Perspex)
Figure 4. 17 – Case 2 Tangential Velocity at Convergence Region (Perspex)
Vorticity Magnitude
Vorticity is directly proportional to the tangential velocity. Increase in tangential velocity
led to a higher vorticity. As shown in Figure 4.18, case 1 with aluminum configuration
was simulated with maximum vorticity of 304/s and 0.672/s in most of the interior
atmosphere (dark blue region). On the other hand, maximum vorticity increased by 181%
in case 2, achieving a value of 855/s. As shown in Figure 4.19, on average, a higher
vorticity of 2.07/s was simulated in case 2 compare to case 1.

54
Figure 4. 18 – Case 1 Sectional Vorticity Contour (Aluminum)
Figure 4. 19 – Case 2 Sectional Vorticity Contour (Perspex)
In summary, the top plate material replacement from opaque Aluminum to transparent
Perspex has been numerically proved on its worthiness. The contribution of the top plate
has been evaluated and all-round improvement has been observed from the simulations.
The temperature distribution, velocity magnitude and pressure have been improved due to
a lift on penetrated solar intensity.
4.2.3 Numerical Investigation on Top Plate Opening Diameter
Numerical simulation has been conducted to determine the optimum opening diameter or
the inner diameter, 𝐷𝑖 of the top plate that will increase engine performance without
compromising the solar updraft and artificially created vortexes. Small opening diameter

55
will tend to drag down vertical updraft velocity and create air-cornering underneath while
large diameter will reduce top plate area that expose to solar radiation, decreasing
efficiency. 3 opening diameter, namely 0.3m, 0.5m, 0.7m, and 0.9m (no top plate) were
simulated before experimental fabrication for verification. The airflow updraft velocity
magnitude is the prioritized parameter. The opening diameter which provide the highest
velocity magnitude will be selected for experimental fabrication.
Static Temperature Distribution
Figure 4. 20 – Sectional Temperature
Contour at Perspex opening diameter
0.3m
Figure 4. 21 – Sectional Temperature
Contour at Perspex opening diameter 0.5m
Figure 4. 22 – Sectional Temperature
Contour at Perspex opening diameter
0.7m
Figure 4. 23 – Sectional Temperature
Contour at Perspex opening diameter
0.9m

56
From the simulations, as shown in Figure 4.20, 4.21, 4.22 and 4.23, the orange region with
temperature of 324K (51C) increased in area when the top plate opening diameter
increased. Although the volume flow rate has been improved with opening diameter, a
lower interior airflow temperature was simulated. As shown in simulation, the
concentrated high temperature region at the base center (dark orange region) started to
disperse and slowly decreased when the top plate opening diameter was increased.
Velocity Magnitude
Figure 4. 24 – Sectional Velocity Contour
at Perspex opening diameter 0.3m
Figure 4. 25 – Sectional Velocity Contour
at Perspex opening diameter 0.5m
Figure 4. 26 – Sectional Velocity Contour
at Perspex opening diameter 0.7m
Figure 4. 27 – Sectional Velocity Contour
at Perspex opening diameter 0.9m
Volume flow rate is directly proportional to both flow area and flow velocity. Increase in
opening diameter tends to increase flow area, leading to a larger volume flow rate. Besides,

57
increase in opening diameter allowed a better vortex to be artificially simulated. A
complete tornado flow field was simulated in opening dimeter of 0.9m where the top plate
was removed. However, increase in opening diameter led to a lower airflow velocity
magnitude. As shown in figure 4.24, 4.25, 4.26 and 4.27, the maximum velocity started to
decrease with opening diameter. As the solar updraft is the top priority in the modification,
the opening dimeter of 0.3m was selected as the optimum top plate.
4.2.4 Numerical Investigation on Slanting Angle for Canopy Shaped Top Plate
Static Temperature Distribution
Figure 4. 28 – Sectional Temperature
Contour at Perspex 8.53° slanting angle
Figure 4. 29 - Sectional Temperature
Contour at Perspex 10° slanting angle
Figure 4. 30 - Sectional Temperature
Contour at Perspex 20° slanting angle
Figure 4. 31 - Sectional Temperature
Contour at Perspex 30° slanting angle

58
Figure 4. 32 - Sectional Temperature Contour at Perspex 40° slanting angle
Velocity Magnitude
Figure 4. 33 – Sectional Velocity Contour
at 8.53° slanting angle
Figure 4. 34 - Sectional Velocity Contour
at 10° slanting angle
Figure 4. 35 - Sectional Velocity Contour
at 20° slanting angle
Figure 4. 36 - Sectional Velocity Contour
at 30° slanting angle

59
Figure 4. 37 - Sectional Velocity Contour at 40° slanting angle
The canopy shaped top plate was simulated at various angle starting from the reference
angle of 8.53 which was obtained from the Solar Collector (SC) of in-situ SVE prototype.
Further increment on slanting angle to 10, 20, 30 and 40 were simulated and the results
are showed in above. As shown in Figure 4.28 to 4.32, the increment on slanting angle did
not caused any major effect on the airflow temperature. However, the efficiency of the top
plate in providing solar radiation reduced with slanting angle. A decreasing trend was
observed at the base center region where the area of dark orange region with 325K (52C)
reduced with top plate slanting angle.
The top plate slanting angle has vast effect on the airflow velocity magnitude. Moving
from 8.53 to 40, the maximum velocity achieved at the outlet was in a decreasing trend.
The maximum velocity simulated for various angle are plotted in Figure 4.38. The slanting
angle of 8.53 was selected as the optimum slope for Perspex Top Plate (TP).
Figure 4. 38 – Maximum Velocity Simulated on Various Top Plate Slanting Angle
4
4.5
5
5.5
6
8.53 0 20 30 40
Vel
oci
ty (
m/s
)
Top Plate Slanting Angle ()
Maximum Velocity

60
4.3 Experimental Results
4.3.1 Solar Collector
The Solar Collector (SC) apply solar radiation to create a greenhouse effect in order to
heat up the air underneath and spark-on the operation of Solar Vortex Engine (SVE). Thus,
experimental measurements mainly focused on the temperature distribution and solar
intensity direct to the Solar Collector (SC). A total of 9 Thermocouples have been installed
to investigate on temperature distribution within Solar Collector (SC). Sensors’
positioning is as shown under section 3.5.3. Each experiments were conducted for a
duration of 4 days to obtain the average data. The measurements obtained were then
analyzed and attached as below.
Solar Intensity
Figure 4. 39 – Solar Intensity against Time
Figure 4.39 shows the solar intensity directed to the solar collector in a day. The plot was
constructed based on the average value obtained from 8 days of experiment. The solar
intensity increased in the morning and decreased after 1pm. The peak solar intensity
recorded was 1050.75𝑊 𝑚2⁄ .
300.00
400.00
500.00
600.00
700.00
800.00
900.00
1000.00
1100.00
9am 10am 11am 12pm 1pm 2pm 3pm 4pm 5pm
Sola
r In
ten
sity
(W
/m2
)
Time
Solar Intensity versus Time

61
Temperature
Figure 4. 40 – Temperatures within Solar Collector (SC)
As shown in Figure 4.40, the ambient temperature was increasing proportionally with the
solar intensity at the beginning of experiment and decreases afterward. A maximum value
of approximately 40C was achieved at 1pm when the solar intensity peaked. The same
trend was observed on the ground temperature, airflow temperature and collector
temperature. The ground achieved the highest temperature compare to air and collector as
the newly installed Pebble Stones were painted in black to create a blackbody effect. The
painted Pebble stones tend to have a higher absorptivity than collector and airflow. The
thermal energy stored within the Pebble Stones allowed the ground structure to achieved
peak value at 2pm even solar intensity started to reduce after 1pm.
The collector has a higher temperature than the air at 9am due to the low solar intensity.
The air was not heat compare to the collector and ground. However, the air temperature
surpass the collector temperature at 10am when the solar intensity increased.
As conclusion, temperatures within the solar collector (ground, airflow and collector) was
directly proportional to the solar intensity. The higher the solar radiation, a higher airflow
temperature was obtained and supplied to the Solar Vortex Engine (SVE).
25.00
30.00
35.00
40.00
45.00
50.00
55.00
60.00
9am 10am 11am 12pm 1pm 2pm 3pm 4pm 5pm
Tem
per
atu
re (
C)
Time
Temperatures within Solar COllector (SC)
Ground Temp Air Temp Collector Temp Ambient Temp

62
4.3.2 Vortex Engine Generator
The Perspex Top Plate (TP) was proposed and installed with the aims to improve solar
updraft and efficiency of the Solar Vortex Engine (SVE). The contribution of top plate in
enhancing the performance of Solar Vortex Engine (SVE) was evaluated by experimental
investigation and the results were plotted in this section.
Figure 4. 41 – Illustration on VEG Top Plate and TBS
Solar Intensity
Figure 4. 42 – Solar Intensity against Time
150.00
350.00
550.00
750.00
950.00
1150.00
9am 10am 11am 12pm 1pm 2pm 3pm 4pm 5pm
Sola
r In
ten
sity
(W
/m2
)
Time
Solar Intensity Accross Top Plate
SI Above Top Plate SI Underneath Top Plate
Top Plate
Transparent Bounding Structure (TBS)

63
As shown in Figure 4.42, solar intensity recorded approximately 300𝑊 𝑚3⁄ at the start of
experiment at 9am in the morning and keep increasing till the peak hour at 1pm. A
maximum solar incidence of 1050𝑊 𝑚3⁄ was recorded above the Solar Collector while
903𝑊 𝑚3⁄ was recorded after the filtration by transparent Perspex Solar Collector (SC).
86% of solar intensity was allowed to penetrate, reaching the VEG interior atmosphere.
Solar intensity tends to reduce after 1pm and reached approximately 460𝑊 𝑚3⁄ at the end
of experiment on 5pm.
Figure 4. 43 – Measured Top Plate Temperature against Time
As shown in figure 4.43, as Aluminum material has a higher thermal conductivity compare
to Perspex, a higher surface temperature was recorded on the aluminum top plate. The
aluminum top plate temperature increased with the solar intensity till a peak value of
approximately 53C was achieved. On the contrary, lower surface temperature was
recorded on Perspex top plate due to the low thermal conductivity. However, the Perspex
top plate did allowed a higher solar intensity to penetrate and warm the interior atmosphere
of Vortex Engine Generator (VEG). This is where the solar heat gain is applicable.
Solar heat gain is defined as the temperature increment in physical object, space or
structure results from solar radiation, while Solar Heat Gain Coefficient (SHGC) is
defined as “the ratio of the solar heat gain entering the space through the fenestration
product to the incident solar radiation.” Solar heat gain included directly transmitted solar
heat and absorbed solar radiation which is then reradiated, conducted or converted into
the space. Although the Aluminum material owns a higher thermal conductivity, the
30
35
40
45
50
55
9am 10am 11am 12pm 1pm 2pm 3pm 4pm 5pm
Tem
per
atu
re (
C)
Time
Top Plate Temperature
Exp 1 (Aluminum) Exp 2 (Perspex)

64
Perspex possess a higher Solar Heat Gain Coefficient (SHGC) which allows high
percentage of Solar Incident to penetrate, reaching the interior airflow and inner wall to
create the greenhouse effect within the Vortex Engine Generator (VEG). Higher
reflectivity and shading coefficient of aluminum tends to reflect and block most of the
solar radiation.
Figure 4. 44 – Temperature of Transparent Bounding Structure (TBS) against Time
Figure 4.44 were plotted based on measured temperature behavior on Perspex TBS surface
in both experiments. Type J Thermocouples have been applied and stick closely to the
surface for measurements. Automatic data recording was applied with Graphtec Data-
logger GL280 for temperature measurements on 5 minutes interval. The data was recorded
with the aim to verify on simulation boundary conditions. A peak value of 44℃ was
recorded on Transparent Bounding Structure (TBS). The experimental results were in
match with boundary condition where the temperature entered into the simulation setup
was 315K (42℃).
35.00
36.00
37.00
38.00
39.00
40.00
41.00
42.00
43.00
44.00
45.00
9am 10am 11am 12pm 1pm 2pm 3pm 4pm 5pm
Tem
per
atu
re (
C)
Time
TBS Temperature

65
Temperature
Figure 4. 45 – Illustration on VEG Interior Wall and Base
Figure 4. 46 – Interior Wall Temperature of VEG against Time
Figure 4. 47 – Measured Base Temperature for VEG against Time
25.00
30.00
35.00
40.00
45.00
50.00
55.00
60.00
9am 10am 11am 12pm 1pm 2pm 3pm 4pm 5pm
Tem
per
atu
re (
C)
Time
Wall Temperature
Exp 1 (Aluminum) Exp 2 (Perspex)
25.00
30.00
35.00
40.00
45.00
50.00
55.00
60.00
65.00
9am 10am 11am 12pm 1pm 2pm 3pm 4pm 5pm
Tem
per
atu
re (
C)
Time
Base Temperature
Exp 2 (Perspex) Exp 1 (Aluminum)
Interior Wall
VEG Base

66
Base on figure 4.42, Perspex Top Plate (TP) only filter approximately 100𝑊 𝑚2⁄ of Solar
Radiation, which allow 903𝑊 𝑚2⁄ of Solar Radiation to pass through top plate, reaching
the inner wall and base of Vortex Engine Generator (VEG). Thus, higher wall and base
temperatures were recorded in figure 4.46 and figure 4.47. Due to the change in solar
intensity during the day, the wall and base temperature vary accordingly. With Perspex
Top Plate (TP), a higher interior component temperature was registered. A peak wall
temperature of 58.94℃ was obtained at 2pm while a peak base temperature of 59.17℃
was obtained at 2pm with the Perspex Top Plate (TP) installed. Maximum wall
temperature of only 48.94℃ and base temperature of 48.70℃ were obtained at 2pm with
Aluminum Top Plate (TP). The worthiness of top plate transparency modification was
once again proved.
Figure 4. 48 – Illustration on VEG inflow and outflow
Figure 4. 49 – Measured Transient Behavior of Air Inflow Temperature
20.00
30.00
40.00
50.00
60.00
9am 10am 11am 12pm 1pm 2pm 3pm 4pm 5pm
Tem
per
atu
re (
C)
Time
Air Inflow Temperature
Exp 1 (Aluminum) Exp 2 (Perspex)
Air inflow
Air outflow

67
Figure 4. 50 – Measured Transient Behavior of Air Outflow Temperature
As shown in figure 4.49 and figure 4.50, the penetrated solar radiation was converted to
useful heat energy which as well improved the air inflow and outflow temperature.
Experiment 2 was conducted for a duration of 4 days with a Perspex Top Plate and airflow
temperature recorded was higher compared to experiment 1 with Aluminum Top Plate.
Experiment 1 with Aluminum achieved peak temperature of 38.43℃ (inlet) and 44.55℃
(outlet) at 2pm while Experiment 2 with Perspex tended to accelerate the heating effect
and reached higher peak value of 48℃ (inlet) and 52℃ (outlet) at 1pm. The difference in
air outflow temperature is 7.45℃.
Relative Humidity (RH%)
Figure 4. 51 – Air Outflow Humidity (RH %) against Time
20.00
30.00
40.00
50.00
60.00
9am 10am 11am 12pm 1pm 2pm 3pm 4pm 5pm
Tem
per
atu
re (
C)
Time
Air Outflow Temperature
Exp 1 (Aluminum) Exp 2 (Perspex)
20.00
30.00
40.00
50.00
60.00
70.00
80.00
90.00
9am 10am 11am 12pm 1pm 2pm 3pm 4pm 5pm
Hu
mid
ity
(RH
%)
Time
Air Outflow Relative Humidity RH%
Exp 1 (Aluminum) Exp 2 (Perspex)

68
Relative humidity is defined as the ratio (in percentage) of the actual amount of moisture
content in the air to the maximum amount that can be present at that temperature. The dew
point temperature is achieved if a given sample of air contain relative humidity of 100%.
Relative humidity is affected by actual temperature and dew point temperature at a
relationship of:
𝑅𝐻 = 100 − 5(𝑡 − 𝑡𝑑) [30]
When the “t” increases, relative humidity tends to decrease. This is because warm air can
hold up more water vapor compare to cool air, thus relative humidity falls when
temperature rises during peak hours with condition that no moisture is added to the air.
As shown in Figure 4.51, the replacement of Perspex Top Plate (TP) allows the penetration
of solar radiation into the Vortex Engine Generator (VEG) which indeed raised the
temperature of airflow and interior aluminum walls, a lower relative humidity of 31.48%
was recorded in second experiment 2 compare to 42.88% in first experiment conducted
with Aluminum Top Plate (TP). These prove the performance enhancement provided from
the replacement of Perspex Top Plate (TP).
Velocity
The increment in airflow temperature have lowered the air buoyancy, which then
enhanced the solar updraft. Higher value of velocities were recorded with the replacement
of Perspex Top Plate (TP) in experiment 2. Due to the increased air inflow and outflow
temperature, vast improvement in both inlet and outlet velocity was observed in figure
4.52 and figure 4.53. Both inlet and outlet airflow velocity have been recorded using the
hotwire probe. Peak value of approximately 0.28m/s was recorded in experiment 1
(Aluminum) while the inlet air velocity reached peak value of 0.81m/s due to the increased
amount of solar intensity in raising airflow temperature.

69
Figure 4. 52 – Measured Transient Behavior of Air Inflow Velocity
The same trend occurred on the outlet air velocity. The airflow velocity increased with
solar intensity and tended to maintain the velocity after 1pm where the solar intensity
started to reduce. The outlet velocity reached peak value of 2.11m/s at 2pm in Experiment
2 (Perspex) which was an hour delay compare to inlet velocity. The maximum recorded
velocity in experiment 1 (Aluminum) was only 1.45m/s. Thus, the replacement of a
transparent Perspex Top Plate (TP) did proved its worthiness in improving engine
performance and enhance flow field within the Solar Vortex Engine (SVE). Figure 4.53
shows the outlet velocity for both experiments.
Figure 4. 53 - Measured Transient Behavior of Air Outflow Velocity
0.00
0.20
0.40
0.60
0.80
1.00
9am 10am 11am 12pm 1pm 2pm 3pm 4pm 5pm
Vel
oci
ty (
m/s
)
Time
Air Inflow Velocity
Exp 1 (Aluminum) Exp 2 (Perspex)
0.80
1.00
1.20
1.40
1.60
1.80
2.00
2.20
9am 10am 11am 12pm 1pm 2pm 3pm 4pm 5pm
Vel
oci
ty (
m/s
)
Time
Air Outflow Velocity
Exp 1 (Aluminum) Exp 2 (Perspex)

70
Figure 4.54 shows the percentage of enhancement on the outlet velocity between
experiment 1 (Aluminum) and experiment 2 (Perspex). The highest percentage of
enhancement (69%) occurred at 4pm where the outlet velocity decreased in experiment 1
(Aluminum) while outlet velocity in experiment 2 (Perspex) tended to maintain at
approximately 2m/s.
Figure 4. 54 – Percentage Enhancement in Outflow Velocity against Time
Figure 4. 55 – Measured Transient Behavior of Tangential Velocity against Time
The solar radiation did not just enhanced the solar updraft, but as well improve the
tangential velocity of airflow within the Vortex Engine Generator (VEG). A peak value
of 0.44m/s was achieved at 2pm in experiment 1 (Aluminum) while 0.46m/s was achieved
at 1pm in experiment 2 (Perspex).
0.00
10.00
20.00
30.00
40.00
50.00
60.00
70.00
80.00
9am 10am 11am 12pm 1pm 2pm 3pm 4pm 5pm
Per
cen
tage
En
han
cem
ent
(%)
Time
Percentage Enhancement on Outflow Velocity
0.00
0.10
0.20
0.30
0.40
0.50
9am 10am 11am 12pm 1pm 2pm 3pm 4pm 5pm
Tan
gen
tial
Vel
oci
ty (
m/s
)
Time
Tangential Velocity
Exp 1 (Aluminum) Exp 2 (Perspex)

71
Volume Flow Rate
Figure 4. 56 – Measured Outlet Volume Flow rate against Time
The outlet velocity is proportional to the outlet volume flow rate. Outlet volume flow rate
in unit of 𝑚3 ℎ𝑟⁄ increased when temperature and velocity of outlet airflow increased.
With transparent Perspex, peak value of 55.48𝑚3 ℎ𝑟⁄ was recorded in experiment 2 at
2pm. Increasing the outlet volume flow rate will indeed raise the power generation
performance of Solar Vortex Engine (SVE).
4.4 Summary
Both numerical simulations and experimental results for Vortex Engine Generator (VEG)
have been presented and discussed in this chapter. Validation and verification on
simulation boundary conditions and results have been done by experimental investigation
and the percentage error for each parameter were listed as below. Comparisons between
experiment 1 (Aluminum) and experiment 2 (Perspex) have been made as well to show
on the worthiness in replacing the top plate.
Table 4. 2 – Comparison on Experimental Measurements bet. Aluminum and Perspex
Maximum Experimental Measurements
Air Inlet
Temperature
Air Outlet
Temperature
Air Inlet
Velocity
Air Outlet
Velocity
Tangential
Velocity
Experiment 1
(Aluminum)
38.43C 44.55C 0.28m/s 1.45m/s 0.44m/s
Experiment 2
(Perspex)
48.51C 52.75C 0.81m/s 2.11m/s 0.46m/s
30.00
35.00
40.00
45.00
50.00
55.00
60.00
9am 10am 11am 12pm 1pm 2pm 3pm 4pm 5pm
Vo
lum
e FL
ow
Rat
e (𝑚
^3∕ℎ𝑟)
Time
Outlet Volume Flow Rate
Q(out) Aluminum Q(out) Perspex

72
Percentage
Enhancement
(%)
26.23% 18.41% 189% 45.52% 4.55%
Table 4. 3 – Verification and validation on Case 1 simulated results by experiment 1
Air Inlet
Temperature
Air Outlet
Temperature
Air Inlet
Velocity
Air Outlet
Velocity
Tangential
Velocity
Experiment 1
(Aluminum)
38.43C 44.55C 0.28m/s 1.45m/s 0.44m/s
Simulation
Case 1
312 (39C) ±314K
(41C)
0.3m/s ±1.32m/s 0.334m/s
Percentage
Difference
1.48% 7.97% 7.14% 8.97% 24%
Table 4. 4 – Verification and Validation on Case 2 simulated results by experiment 2
Air Inlet
Temperature
Air Outlet
Temperature
Air Inlet
Velocity
Air Outlet
Velocity
Tangential
Velocity
Experiment 2
(Perspex)
48.51C 52.75C 0.81m/s 2.11m/s 0.46m/s
Simulation
Case 2
322K
(49C)
±323K
(50C)
0.7m/s ±2.28m/s ±0.44𝑚
/𝑠
Percentage
Error
1.01% 5.21% 13.58% 8.05% 4.35%
In summary, the replacement of Perspex top plate did improved both the airflow
temperature and velocity magnitude. The air outflow velocity from the top plate has been
improved by 45% while temperature has been raised by 18%. At last, the maximum
achieved experimental measurements were applied to verify on the simulated result. All
the parameters have acceptable percentage error except the air inlet velocity into the
Vortex Engine Generator (VEG) and the tangential velocity simulated in case 1
(Aluminum). The percentage error of inflow and case 1 tangential velocity exceeded 10%
of acceptable range.

73
CHAPTER 5
CONCLUSION AND RECOMMENDATIONS
The objective to evaluate the contribution of top plate on the performance of Solar Vortex
Engine (SVE) has been achieved by experimental investigation. Based on results, the
replacement of aluminum top plate with semi-transparent Perspex top plate did prove its
worthiness in increasing interior flow temperature and creating better updraft. Lower
interior pressure has been achieved due to the increased outflow velocity, drawing in
higher air inlet velocity.
The flow field within the Solar Vortex Engine (SVE) has been successfully simulated by
CFD technique. Vortices were simulated within the Vortex Engine Generator. Most of the
parameters are in match with the experimental measurements. The optimum opening
diameter for flat top plate has been identified by CFD technique. Increasing the outlet
diameter lead to a rise in air mass flow rate but the increased cross-sectional area tends to
reduce the temperature variation between inlet and outlet, lowering the air velocity and
rate of natural convection. Besides, the suitable angle for the canopy shaped top plate has
been simulated and evaluated by CFD technique. Increasing the slanting angle of canopy
shape top plate did resolve the air-cornering issue, but the outlet velocity has been reduced.
In conclusion, current prototype of Solar Vortex Engine (SVE) was constructed with less-
expensive material and yet still is generating a peak updraft velocity of 2.11m/s. with
further modification and improvement on the prototype, the Solar Vortex Engine (SVE)
will be ready for power generation. Figure 5.1 below shows the proposed model for the
Vortex Engine Generator (VEG) where the guide vanes and entry slots are suggested to
extend into the convection region. The flat and canopy shaped top plate were proposed to
be implement simultaneously on a prototype.

74
Figure 5. 1 – Proposed Model of Vortex Engine Generator (VEG)
Extended
guide vanes
Slanted Top
Plate
Flat Top Plate
Transparent
Bounding
Structure
(TBS)
VEG
Extended
entry slots

75
REFERENCE
[1] “Executive Summary - World Energy Outlook 2014,” International Energy Agency
- IEA, 2014.
[2] “Renewables 2014 - Global Status Report,” REN21, pp. 21, 2014.
[3] C. Philibert, “Solar Energy Perspectives,” International Energy Agency – IEA,
2011.
[4] J. Schlaich, R. Bergermann, W. Schiel and G. Weinrebe, "Design of Commercial
Solar Updraft Tower Systems—Utilization of Solar Induced Convective Flows for
Power Generation," Journal of Solar Energy Engineering. Vol. 127. pp. 117-124,
2005.
[5] L. M. Michaud, “The Atmospheric Vortex Engine”, AVEtec Energy Corporation,
2008.
[6] A. T. Mustafa, H. H. Al-Kayiem and S. I. U. Gilani, “A Review of the Vortex
Engine,” The Sustainable City VIII, Vol 2, pp. 911-920, 2013.
[7] S. Rathnavel and K. Vijaya sankaran, “Design and Analysis of an Atmospheric
Vortex Engine”, International Journal of Research in Aeronautical and Mechanical
Engineering, Vol. 3, Issue. 2, pp. 1-9, Feb, 2015.
[8] L. M. Michaud, “Atmospheric Vortex Engine - US7086823 B2,” Google Patents,
2006
[9] V. H. Hidalgo Diaz and N. Chen “Application of Vortex Process to Cleaner Energy
Generation,” Applied Mechanics and Materials, Vol. 71-78, pp. 2196-2203, 2011
[10] K. T. K. Ho. and D. L. Loveday, “New Approach for Analyzing Solar Collectors
Subjected to Unequal Front/Rear Ambient Temperatures: The Equivalent Ambient
Temperature Concept, Part 1: Modeling,” Journal of Solar Energy Engineering,
Vol. 124, no. 3, pp. 262, 2002.
[11] W. Contributor, “Solar Thermal Collector,” Wikipedia - The Free Encyclopedia,
2015.
[12] J. Schlaich, W. Schiel, K. Friedrich, G. Schwarz, P.Wehowsky, W. Meinecke, et
al., “The Solar Chimney – Transferability of Results from the Manzanares Solar
Chimney Plant to Larger Scale-Plants”, Tech. Rep., Schlaich Bergermann and
Partner, Civil Engineering, Stuttgart, Germany. pp 5-33, 1995.

76
[13] A. T. Mustafa, H. H. Al-Kayiem and S. I. U. Gilani, “Investigation and Evaluation
of The Solar Air Collector Model to Support The Solar Vortex Engine,” ARPN
Journal of Engineering and Applied Sciences, Vol. 10, no. 12, pp. 5309-5319, July,
2015.
[14] H. Huang et al., “Experimental Performance of A Solar Collector in Solar
Chimney Power Plant System,” International Conference on Electrical and Control
Engineering, pp. 3718-3721, 2010.
[15] A. M Saleh, “Modeling of Flat-Plate Solar Collector Operation in Transient
States,” Purdue University, May, 2012.
[16] J. Y. Li, P. H. Guo and Y. Wang, “Effects of Collector Radius and Chimney Height
on Power Output of A Solar Chimney Power Plant with Turbines”, Renewable
Energy 47 - Elsevier, pp. 21-28, 2012.
[17] U. Prasophingchana, W. Pirompugd, P. Laipradit, and K. Boonlong, “Numerical
Study of Natural Convection of Air in an Inclined Square Enclosure,” International
Journal of Material, Mechanics and Manufacturing, Vol. 1, No. 2, pp. 131 – 135,
May, 2013
[18] M. H. Ali, “Analysis Study of Solar Tower Power Plant and Its Configuration
Effects on Its Performance in Iraq (Baghdad City),” Modern Applied Science, Vol.
7, No. 4, pp. 55 – 69, March, 2013
[19] B. Kalidansan and T. Srinivas, “Study on Effect of Number of Transparent Covers
and Refractive Index on Performance of Solar Water Heater,” Journal of
Renewable Energy, Vol. 2014, Sept, 2014
[20] M. A. dos S. Bernades, A. Voß, G. Weinrebe. “Thermal and Technical Analyses
of Solar Chimneys,” Solar Energy 75 – Elsevier, pp. 511-524, 2003.
[21] E. Gholamalizadeh, S. H. Mansouri, “A Comprehensive Approach to Design and
Improve A Solar Chimney Power Plant: A Special Case – Kerman Project,”
Applied Energy 102 - Elsevier, pp. 975-982, 2013.
[22] A. Asnaghi, S. m. Ladjevardi, “Solar Chimney Power Plant Performance in Iran,”
Renewable and Sustainable Energy Reviews 16 – Elsevier, pp. 3383-3390, 2012

77
[23] G. Xu, T. Ming, Y. Pan, F. Meng and C. Zhou, “Numerical Analysis On The
Performance of Solar Chimney Power Plant System,” Energy Conversion and
Management 52 – Elsevier, pp. 876-883, 2011
[24] D. Natarajan, “Numerical Simulation of Tornado-Like Vortices,” University of
Western Ontario, London, Ontario, Canada, pp. 109, 2011
[25] Boussinesq - ANSYS Fluent 15 Help User Guideline, Now, 2013
[26] B. R. Munson, D. F. Young, T. H. Okiishi, and W. W. Huebsch, “Fundamentals
of Fluid Mechanics,” John Wiley and Sons (Asia) Pte Ltd, Ed. 6, pp. 188 and 307,
2010
[27] S. W. Yuan, “Foundations of Fluid Mechanics,” Englewood Cliffs, N.J. :Prentice-
Hall, 1967
[28] D. J. Acheson, “Elementary Fluid Dynamics,” Oxford University Press, 1990.
[29] A. T. Mustafa, H. H. Al-Kayiem and S. I. U. Gilani, “A Review of Convective and
Artificial Vortices for Power Generation”, Int. J. Sus. Dev. Plann. Vol. 10, No. 5,
pp. 650-665, 2015
[30] M. G. Lawrence, “The Relationship Between Relative Humidity and the
Dewpoint Temperature in Moist Air – A Simple Conversion and Applications”,
American Meteorological Society, 225-233, 2005

78
Appendix A –
Measuring Instruments
Table A. 1 - Specifications on GRAPHTEC DATA LOGGER GL820 Descriptions
Instrument 1 GRAPHTEC DATA LOGGER GL820
Figure
Features
1. Provide isolated input method which ensures signals are not corrupted
by inputs to other channels, eliminating wiring concerns.
2. Suitable for measurements on voltage, temperature, pulse, humidity, and
logic signals.
3. Suitable for combined measurements of different phenomena like
temperature / humidity and voltage.
4. Provide 2GB Internal Flash Memory to secure long term data
measurements
5. Support direct data saving into external USB memory stick.
6. Support direct-Excel graphical display.
Specifications
1. 5.7 inch wide TFT color LCD with resolution of VGA: 640 x 480 dots.
2. Operational voltage range: 20Mv to 50V.
3. Operational humidity range: 0 to 100%RH (B-530)
4. Provide standard configuration of 20 analogue input channels.
5. Provide extension up to 200 channels with extension base kit (B-537).
6. Provide maximum sampling rate up to 10ms.
7. Thermocouple type J: Nickel Constantan
Measurement Range Measurement Accuracy
−200℃ ≤ 𝑇𝑆 ≤ −100℃ ±2.7℃
−100℃ ≤ 𝑇𝑆 ≤ 100℃ ±1.7℃
100℃ ≤ 𝑇𝑆 ≤ 1100℃ ±(0.05% 𝑜𝑓 𝑟𝑒𝑎𝑑𝑖𝑛𝑔 +
1.0℃)
Applications Applied as data logger for SVE fixed positions experimental temperature
measuring.

79
Before experimental measurements are conducted, a calibration is required on the
thermocouples type J to ensure trustworthy of the instruments. Calibration on
thermocouples type J was done with a digital thermometer and a calibration curve was
plotted with equation:
𝑦 = 0.7939𝑥 + 6.1547
Figure A. 1 – Calibration on Thermocouple Type J against Digital Thermometer
Where X represents the digital thermometer reading and Y represents the thermocouples
type J reading.
Thermocouple is a sensor that measure the change in temperature using a welded junction,
generating different voltage. Data logger will then interpret the voltage variation and
record the respective measuring temperatures.
0
10
20
30
40
50
60
70
80
90
10 20 30 40 50 60 70 80 90 100
Ther
mo
cou
ple
s R
ead
ing
(C
)
Digital Thermometer Reading ( C)
Calibration of Thermocouple Type J

80
Table A. 2 - Specifications on Digital Reader KIMO-AMI 300
Descriptions
Instrument 2 Digital Reader KIMO-AMI 300 with Multi Probes
Figure
Features
1. Support multiple probes for air flow properties.
2. Suitable for measurements of air temperature, humidity, velocity
and pressure.
3. Apply software: Datalogger 10
Allow transfer of measured values from instrument to
computer.
Allow 12,000 measurements points or 50 datasets.
Specifications
1. Provide color graphic display with resolution 320 x 240 pixels and
dimension of 70 x 52mm. Able to display 4 to 6 measurements
simultaneous.
2. Operating Environment: Neutral gas
3. Operating Temperature: 0 to 50℃
4. Storage temperature: -20 to +80℃
Applications Applied as data logger for SVE fixed positions experimental
temperature measuring.
Digital Reader KIMO-AMI 300 utilizes different probes to measurement various variables.
Digital reader can be applied for measurements with either automatic or manual method.
Datalogger-10 application has been represented as a function of time on the graph and
chart. Table A.3 shows the measuring probes.
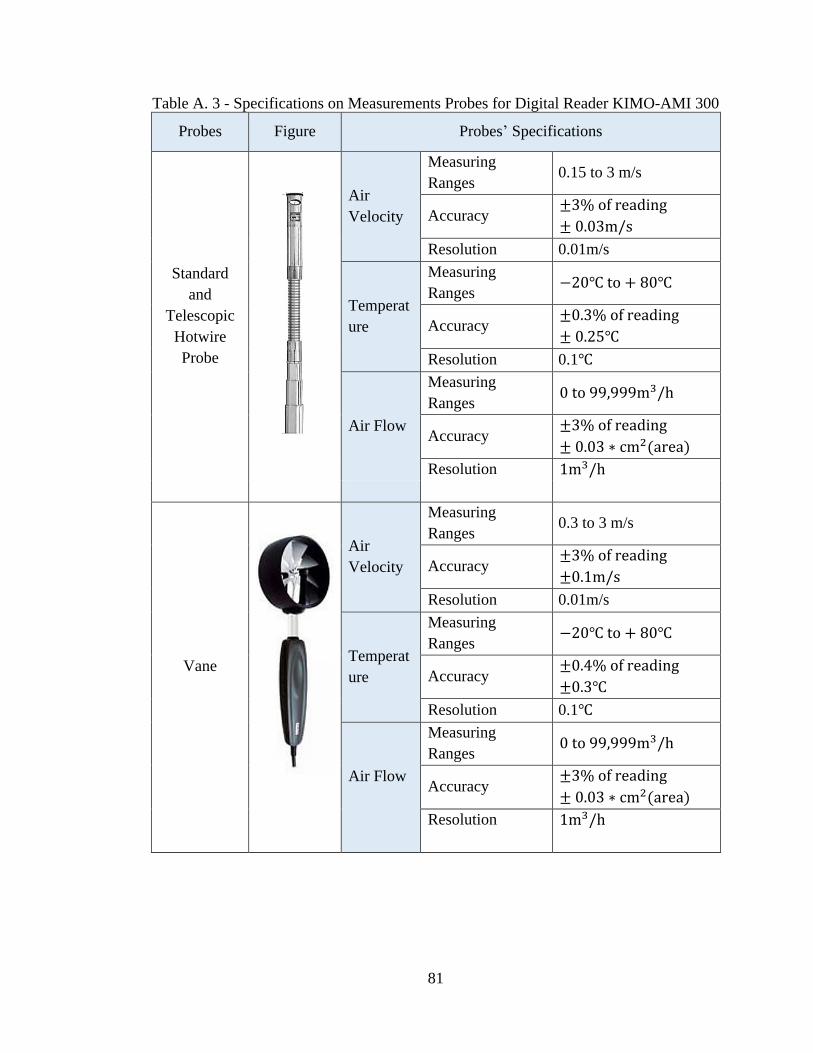
81
Table A. 3 - Specifications on Measurements Probes for Digital Reader KIMO-AMI 300
Probes Figure Probes’ Specifications
Standard
and
Telescopic
Hotwire
Probe
Air
Velocity
Measuring
Ranges 0.15 to 3 m/s
Accuracy ±3% of reading
± 0.03m/s
Resolution 0.01m/s
Temperat
ure
Measuring
Ranges −20℃ to + 80℃
Accuracy ±0.3% of reading
± 0.25℃
Resolution 0.1℃
Air Flow
Measuring
Ranges 0 to 99,999m3/h
Accuracy ±3% of reading
± 0.03 ∗ cm2(area)
Resolution 1m3/h
Vane
Air
Velocity
Measuring
Ranges 0.3 to 3 m/s
Accuracy ±3% of reading
±0.1m/s
Resolution 0.01m/s
Temperat
ure
Measuring
Ranges −20℃ to + 80℃
Accuracy ±0.4% of reading
±0.3℃
Resolution 0.1℃
Air Flow
Measuring
Ranges 0 to 99,999m3/h
Accuracy ±3% of reading
± 0.03 ∗ cm2(area)
Resolution 1m3/h

82
Figure A. 2 – Certification of Calibration for Digital Reader

83
Figure A. 3 – Certification of Calibration for Vane Probe

84
Table A. 4 - Specifications on Solarimeter KIMO-SL 200 Instrument Descriptions
Instrument 3 Solarimeter KIMO-SL 200 Instrument
Figure
Features
1. Provide analysis of sunshine on site, on short and long-term period.
2. Provide automatic data saving and compilation at the end of experimental
measurements.
3. Provide storage and saving of average values of power
4. Provide update of energetic exposure calculation every minute.
5. Provide reading and graphical approximation of data by 24 hours via
transfer data software.
6. Absorb solar radiation through diffuser and correction filter.
Specifications
Instrument SL 200
1. Solar intensity measuring range: 1 𝑊ℎ/𝑚2 𝑡𝑜 1300 𝑊ℎ/𝑚2
2. Energetic exposure measuring range: 1 𝑊ℎ/𝑚2 𝑡𝑜 500 𝑊ℎ/𝑚2
3. Frequency of measurements: 2/s
4. Accuracy: 5% of measurements
5. Calculation frequency (𝑊ℎ/𝑚2): 1/min (Average on 60 sec)
6. Operating temperature: −10℃ to +50℃
7. Storage temperature: −10℃ to +55℃
Solar Cell
8. Operating temperature: −30℃ to +60℃
9. Humidity dependence: 100%RH
10. Effective area: 1𝑐𝑚2
11. Nominal Sensitivity: 100mv for 1000𝑊/𝑚2
12. Material: Polycrystalline silicon
Applications
Solarimeter KIMO-SL 200 provide the measurement for the global solar
radiation. Global solar radiation is the sum of direct solar radiation and
diffused solar radiation.
Applied to measure solar intensity / radiation available and provide output
voltage for analysis to make direct recording on average temperature.

85
Figure A. 4 – Certification of Calibration for Solarimeter

86
Table A. 5 – Specifications on Extech 3-in-1 Humidity, Temperature and Airflow Meter Descriptions
Instrument 4 Extech 3-in-1 Humidity, Temperature and Airflow Meter
Figure
Features
1. Allow the measurement of 3 parameters at once (Velocity, Temperature,
and Humidity).
2. Captures maximum and minimum value simultaneously.
3. Allow value holding for recording.
4. Can be connected with Thermocouple but in limited amount.
Range
Specifications
1. Velocity range: 0.4 to 30m/s.
2. Temperature range: -0 to 50℃.
3. Relative humidity range: 10.0 to 95.0%
Applications Applied to record on ambient and airflow relative humidity.

87
Appendix B –
Mesh Independency Test
B.1 Mesh Independency Test at 0.5m/s Inlet Velocity
Table B. 1 – Mesh Independency Test Statistical Values
No.
trials
Relevance
Center Smoothing
Min
Size
𝑥10−4
Max
Face
Size
𝑥10−2
Max
Size
𝑥10−2
Iterati
ons
Min
AR
Max
AR
Aspect
ratio Nodes Elements
Max
Velocity
(m/s)
Max
Pressure
(pascal)
Percentage
Difference
1 Coarse Medium 9.3 9.3 18.6 758 1.17 90.33 77.02 4,073 19,474 2.20 4.97 0.00
2 Medium Medium 4.6 4.6 9.3 371 1.17 41.83 35.79 12,866 63,426 1.94 2.69 0.12
3 Fine Medium 2.7 2.7 5.4 299 1.16 16.39 14.15 41,546 211,895 2.13 2.68 0.10
4 Fine High 2.7 2.7 5.4 300 1.16 13.94 12.04 41,535 211,833 2.13 2.67 0.00
5 Fine High 2.7 2.6 5.4 286 1.16 16.51 14.26 45,797 234,255 2.05 2.84 0.04
6 Fine High 2.7 2.5 5.4 291 1.16 23.74 20.48 49,759 255,797 2.15 2.79 0.05
7 Fine High 2.7 2.4 5.4 295 1.16 22.05 19.05 55,613 286,526 2.17 2.88 0.01
8 Fine High 2.7 2.3 5.4 300 1.16 24.72 21.34 61,661 319,085 2.26 2.76 0.04
9 Fine High 2.7 2.2 5.4 295 1.16 21.62 18.64 68,615 356,364 2.16 2.77 0.04
10 Fine High 2.7 2.1 5.4 295 1.16 10.43 9.01 77,127 402,355 2.20 2.78 0.02
11 Fine High 2.7 2.0 5.4 297 1.16 23.05 19.89 88,016 459,863 2.33 2.82 0.06
SUM 23.72 32.65
AVERAGE 2.16 2.97

88
B.2 Mesh Independency Test at 0.7m/s Inlet Velocity
Table B. 2 – Mesh Independency Test Statistical Values
No.
trials
Relevance
Center Smoothing
Min
Size
𝑥10−4
Max
Face
Size
𝑥10−2
Max
Size
𝑥10−2
Iteratio
ns
Min
AR
Max
AR
Aspect
ratio Nodes Elements
Max
Velocit
y (m/s)
Max
Pressure
(pascal)
Percentage
Difference
1 Coarse Medium 9.3 9.3 18.6 762 1.17 90.33 77.02 4,073 19,474 3.097 9.71 2.41
2 Medium Medium 4.6 4.6 9.3 379 1.17 41.83 35.79 12,866 63,426 2.728 5.29 -9.79
3 Fine Medium 2.7 2.7 5.4 306 1.16 16.39 14.15 41,546 211,895 2.968 5.24 -1.85
4 Fine High 2.7 2.7 5.4 307 1.16 13.94 12.04 41,535 211,833 2.979 5.21 1.49
5 Fine High 2.7 2.6 5.4 295 1.16 16.51 14.26 45,797 234,255 2.873 5.54 4.99
6 Fine High 2.7 2.5 5.4 300 1.16 23.74 20.48 49,759 255,797 3.020 5.46 0.13
7 Fine High 2.7 2.4 5.4 302 1.16 22.05 19.05 55,613 286,526 3.040 5.63 -0.53
8 Fine High 2.7 2.3 5.4 307 1.16 24.72 21.34 61,661 319,085 3.169 5.41 -4.79
9 Fine High 2.7 2.2 5.4 304 1.16 21.62 18.64 68,615 356,364 3.030 5.42 -0.20
10 Fine High 2.7 2.1 5.4 303 1.16 10.43 9.01 77,127 402,355 3.090 5.45 -2.18
11 Fine High 2.7 2.0 5.4 305 1.16 23.05 19.89 88,016 459,863 3.270 5.54 -8.13
SUM 33.26 63.92
AVERAGE 3.02 5.81