nudges at the dentist - iza institute of labor economicsftp.iza.org/dp6699.pdf · nudges at the...
TRANSCRIPT

DI
SC
US
SI
ON
P
AP
ER
S
ER
IE
S
Forschungsinstitut zur Zukunft der ArbeitInstitute for the Study of Labor
Nudges at the Dentist
IZA DP No. 6699
July 2012
Steffen AltmannChristian Traxler

Nudges at the Dentist
Steffen Altmann IZA
Christian Traxler University of Marburg,
MPI for Research on Collective Goods, and CESifo
Discussion Paper No. 6699 July 2012
IZA
P.O. Box 7240 53072 Bonn
Germany
Phone: +49-228-3894-0 Fax: +49-228-3894-180
E-mail: [email protected]
Any opinions expressed here are those of the author(s) and not those of IZA. Research published in this series may include views on policy, but the institute itself takes no institutional policy positions. The Institute for the Study of Labor (IZA) in Bonn is a local and virtual international research center and a place of communication between science, politics and business. IZA is an independent nonprofit organization supported by Deutsche Post Foundation. The center is associated with the University of Bonn and offers a stimulating research environment through its international network, workshops and conferences, data service, project support, research visits and doctoral program. IZA engages in (i) original and internationally competitive research in all fields of labor economics, (ii) development of policy concepts, and (iii) dissemination of research results and concepts to the interested public. IZA Discussion Papers often represent preliminary work and are circulated to encourage discussion. Citation of such a paper should account for its provisional character. A revised version may be available directly from the author.

IZA Discussion Paper No. 6699 July 2012
ABSTRACT
Nudges at the Dentist* We implement a randomized field experiment to study the impact of reminders on dental health prevention. Patients who are due for a check-up receive no reminder, a neutral reminder postcard, or reminders including additional information on the benefits of prevention. Our results document a strong impact of reminders. Within one month after receiving a reminder, the fraction of patients who make a check-up appointment more than doubles. The effect declines slightly over time, but remains economically and statistically significant. Including additional information in the reminders does not increase response rates. In fact, the neutral reminder has the strongest impact for the overall population as well as for important subgroups of patients. Finally, we document that being exposed to reminders repeatedly does neither strengthen nor weaken their effectiveness. JEL Classification: D03, I11, C93 Keywords: field experiment, reminders, nudges, memory limitations, prevention,
dental health, framing Corresponding author: Steffen Altmann IZA P.O. Box 7240 53072 Bonn Germany E-mail: [email protected]
* We thank Michele Belot, Christoph Engel, Marc Jekel, Andrew Oswald, Philipp Weinschenk, Matthias Wibral, Joachim Winter, and seminar participants in Ann Arbor, Berlin, Bonn, Munich, and Rotterdam for helpful comments. We are grateful to Ulf Jüptner and Juliane Heyda for their invaluable support in conducting the field experiment. Nicolas Kaufung and Tim Stahringer provided excellent research assistance. Financial support from the Max Planck Institute for Research on Collective Goods, the Institute for the Study of Labor, and Volkswagen Foundation is gratefully acknowledged.

1 Introduction
A vast body of evidence documents that limitations in self-control, memory, and attention
can lead people to act against their long-run self interests (see Rabin 1999, Frederick et al.
2002, and DellaVigna 2009 for excellent reviews). These findings have spurred the interest
in how subtle changes in choice architectures can improve ‘Decisions About Health, Wealth,
and Happiness’ (Thaler and Sunstein 2008). Choice-preserving changes in seemingly minor
institutional details – nudges – hold the promise to help some people avoid making mistakes
in intertemporal decisions, without distorting choices of others. Examples of nudges that
have been shown to strongly affect decisions include the specification of default options,
information disclosure policies, or the framing and labeling of policy instruments (see, e.g.,
Madrian and Shea 2001, Wisdom et al. 2010, Abeler and Marklein 2010).
In this paper, we study whether simple reminder messages can be used as a nudge to
encourage dental health prevention. Preventive health care constitutes a potential hot spot for
procrastination. Investments in prevention typically entail short-run costs but yield benefits
only in the long run. Present-biased preferences may thus lead to an under-investment in
preventive health care (Laibson 1997, Loewenstein et al. 2007). Moreover, activities such
as screenings and routine check-ups should be conducted regularly, but at a relatively low
frequency. As a consequence, these key elements of effective health prevention are vulnerable
to limitations in memory and attention (DellaVigna and Pollet 2009, Karlan et al. 2011):
people may simply forget about scheduling the next check-up. Reminders about check-ups
represent a low-cost, and unobtrusive nudge in that they let people schedule their check-ups
whenever they want to. A person who rationally postpones a check-up can thus simply ignore
the reminder. Someone who procrastinates a check-up due to behavioral biases, however,
might benefit from receiving a reminder.
In cooperation with a German dentist, we implemented a randomized field experiment to
examine the impact of reminders on the frequency of dental check-ups. Regular check-ups
are associated with improved periodontal health and ensure that oral diseases are discovered
early – which typically makes treatment less painful and less costly (e.g., Lang et al. 1994).
In addition, healthy teeth yield economic returns (Glied and Neidell 2010). To identify the
causal effect of reminders, we exogenously vary whether people are reminded to schedule a new
check-up appointment. Within the group of people who receive a reminder, we additionally
randomize the informational content of the reminder messages. In particular, we vary whether
the reminder includes a paragraph on the benefits of prevention, and whether this information
is framed positively or negatively, as it is predominantly the case with health warning messages
for tobacco and other potentially harmful products.
1

We find that reminders cause a substantial increase in the number of check-ups. Within
one month after receiving a reminder, the fraction of people who contact the dentist and
schedule a check-up appointment is more than twice as high as in our control group (19.3%
vs. 8.9%). Similarly, the fraction of patients that visit the dentist and have a check-up is
more than 10 percentage points higher in the treated group. The magnitude of the reminder
effect is remarkably persistent over time. Even 100 days after the intervention, the fraction
of patients that had a check-up is 8 percentage points higher in the treated group (30.5% vs.
22.4%). This indicates that reminders activate people who would otherwise not have made
an appointment, or who would have delayed their check-up substantially. Hence, reminder
nudges succeed in encouraging dental health prevention.
In contrast to the strong overall impact of being reminded, the specific type and content
of the reminder seems to matter relatively little. Adding additional information does not
increase patients’ response relative to a neutral reminder. Hence, limited awareness about
the benefits of dental health prevention does not seem to be a major driver of people’s check-
up frequency. In addition, we find no systematic difference in responses to a positive or
negative framing of the reminders’ content.
We also gathered information on a rich set of patient background characteristics, including
individuals’ health insurance status, patient history, and information on people’s residential
areas (e.g., local housing prices). The data allow us to study whether certain groups of
people are especially responsive to reminders, and whether particular types of reminders
have stronger effects for some subgroups. Our findings show that simple nudges seem to work
best for a wide range of people: the neutral reminder message triggers the highest rate of
check-ups among almost all groups of patients. In fact, the evidence suggests that a neutral
and uniform reminder might be preferable to targeting specific groups with different reminder
nudges. This is the case as framed reminders sometimes backfire and completely erode the
positive reminder effect in certain subgroups.
A further important contribution of our paper is an analysis of how people behave when
they are repeatedly exposed to nudges. Over the course of our experiment, several patients
are treated twice as they are due for a further check-up. Our randomization procedure ensures
that we obtain random treatment sequences, in terms of whether and how a given person is
reminded the first and second time that she is up for a check-up. Exploiting these sequences,
we examine whether applying nudges repeatedly strengthens or weakens their effect. In
addition, we study the consequences of taking away reminders. This allows us to address
the concern that people get used to being nudged and rely too heavily on receiving further
nudges – a point that has been raised by critics of libertarian paternalistic interventions (see,
2

e.g., Rizzo and Whitman 2009). We find that patients who receive multiple reminders exhibit
very similar response rates as patients who receive the first reminder in our experiment. At
the same time, the data show no detrimental effect if one stops sending a reminder at a later
check-up interval. This indicates that reminders do not come at the potential cost of a decline
in people’s active choices, once the nudge is taken away. The evidence further shows that
reminders do not solely provoke one-time responses due to a ‘surprise’ effect.
Applying insights from behavioral economics to promote healthy behavior has been high-
lighted as one of the most promising avenues for public policy (e.g., Behavioural Insights
Team 2010, Darzi et al. 2011). There are only a few studies that follow this avenue by
examining nudges in the domain of health prevention. Two recent papers analyze the im-
pact of planning prompts on influenza vaccinations (Milkman et al. 2011) and colonoscopies
(Milkman et al. 2012). They find that asking patients to form a more detailed personal plan
significantly increases the take-up of these activities. Calzolari and Nardotto (2011) study
whether attendance rates at health clubs can be increased through reminders and feedback
provision, and find positive effects of reminders. For the domain of dental health, some clini-
cal trials on the effectiveness of reminder systems have provided mixed evidence (e.g., Reekie
and Devlin 1998, Bos et al. 2005). It is difficult to compare these studies to ours, however, as
they are exclusively concerned with reminding people about already existing, pre-scheduled
appointments. In contrast, we analyze whether reminders encourage people to engage more
strongly in preventive health care by making new appointments.
Reminders are widespread in decision environments beyond health prevention: software
companies remind customers about the availability of updates, research institutes remind
survey participants to fill in questionnaires (Groves et al. 2002), and conference organizers
remind participants about upcoming registration deadlines. With some notable exceptions,
the impact of such reminder systems has rarely been evaluated. The results from the few
existing studies (Karlan et al. 2011, Apesteguia et al. 2012, Kast et al. 2012) suggest that our
main findings might generalize to other decision environments. First, these papers all docu-
ment strong reminder effects. Kast et al. (2012), for instance, compare reminder messages to
other activities designed to increase savings, such as meetings in self-help groups. They ob-
serve that simple reminders have an equally strong effect as the more elaborate interventions.
Second, the previous studies also find little or no evidence on content- or framing-specific
differences in the effectiveness of reminders. Karlan et al. (2011), who study the influence
of reminders on savings behavior, find no differences between reminders that are framed in
terms of gains and losses, paralleling our findings from the positively and negatively framed
treatments. Apesteguia et al. (2012) show that adding additional content to a simple re-
3

minder does not further increase the frequency at which library customers return borrowed
items in time.
The remainder of the paper is organized as follows. In the following section, we provide
an overview of the institutional framework and discuss how different biases might affect
patients’ decisions in dental health prevention. Section 3 outlines the setup and procedures
of the experiment. In Section 4, we present our empirical results, and Section 5 concludes.
2 Check-ups and dental health prevention
Health prevention is a non-trivial inter-temporal problem. In the case of dental health,
brushing one’s teeth regularly, flossing, and avoiding sugary food is costly today – in terms of
time, effort and foregone pleasure. However, investments in prevention generate potentially
high returns through improved future health. In addition to these direct, health-related
payoffs, healthy teeth might yield higher wages (Glied and Neidell 2010) and other benefits
associated with beauty (e.g., Mocan and Tekin 2010, Belot et al. 2012). Superior dental
health can also have positive externalities, since individuals with healthy teeth miss fewer
days at work than people regularly suffering from excruciating toothache.
One key factor in dental health prevention are routine check-ups. Regular check-ups are
associated with improved periodontal health and ensure that oral diseases are discovered
early, which typically makes treatment less painful and less costly (e.g., Lang et al. 1994).
Recommendations for check-up intervals vary between three months and more than a year,
depending on patients’ risk factors and dental health status (see, e.g., National Institute for
Health and Clinical Excellence 2004). In Germany, the recommended check-up interval for
healthy patients is six months. High-risk groups (e.g., diabetes mellitus patients who face
increased parodontitis risks) are recommended more frequent check-ups.1 Acknowledging
the importance of dental prevention, many health care providers use economic incentives to
encourage regular check-ups. Patients covered by the German public health insurance (more
than 80% of our sample), for instance, are eligible for free dental check-ups and receive 20%
[30%] allowance on treatment costs if they had at least one annual check-up over the last 5
[10] years.2
1There is an ongoing debate in the medical literature about best practices for check-up intervals. Thedebate reflects the lack of causal evidence on how different intervals affect long-run health outcomes (see,e.g., Mettes 2005). Motivated by the missing evidence, a large-scale randomized trial on different check-upintervals has been launched recently in the UK (see https://viis.abdn.ac.uk/HSRU/Interval/).
2 Private health insurance contracts are more heterogenous. Generally, the incentives to regularly attendcheck-ups tend to be weaker than under the public insurance system. In addition, the costs for check-ups arehigher for privately insured patients.
4

In our setup, there are two steps to a dental check-up. First, a patient has to contact
her dentist to schedule an appointment. To make an appointment that is in line with the
recommended check-up interval, people therefore have to remember their last check-up date.
Beyond the cognitive costs of remembering, contacting the dentist entails only modest trans-
action and opportunity costs.3 Second, once a date for the check-up is arranged, the patient
has to keep the appointment and go to the dentist. This second step involves further transac-
tion and opportunity costs (traveling to the dentist, waiting costs, etc.). Repeatedly carrying
out the two steps determines an individual’s check-up frequency.
Fully rational patients with perfect knowledge about their benefits and costs from check-
ups will attend check-ups at an individually optimal frequency. However, a growing body
of research suggests that some people may be prone to make sub-optimal decisions in the
context of health prevention (see, e.g., Loewenstein et al. 2007, Thaler and Sunstein 2008).
In particular, present-biased preferences and memory limitations may contribute to the pro-
crastination of check-ups.
People with present-biased preferences might defer check-ups, in order to avoid the short-
run costs of check-ups (Laibson 1997). In addition to the transaction costs mentioned above,
these costs might involve people’s fear of going to the dentist. People will also invest too little
in prevention if they underestimate its net returns. This could be the case if individuals are
not fully aware of the future benefits of prevention, or if they underestimate the costs of future
treatments. Finally, people with memory limitations will have fewer check-ups as they forget
about their last check-up date and do not have the task of making the next appointment
on the ‘top of their minds’ (see, e.g., Karlan et al. 2011 and Altmann et al. 2012 for formal
treatments of limited memory and task delay).
3 The field experiment
Evaluating whether people choose check-up frequencies that are optimal from an personal or
public-policy perspective is inherently difficult, since almost all potential benefits and costs of
check-ups are uncertain and individual-specific. Moreover, the factors that might contribute
to delaying check-ups vary in the patient population and are typically unobservable. Rather
than trying to induce optimal check-up schedules, we implement an unobtrusive change in
patients’ choice architecture: we study whether simple reminder messages encourage patients
to have dental check-ups.
3Some dentists assign a date for the next check-up already at the previous appointment. With thisprocedure, it is less important to remember the date of the last appointment, however, it is crucial to keepin mind the date of the future, pre-arranged appointment.
5

Our approach is not based on the presumption that all people exhibit sub-optimally long
check-up intervals. Rather, reminder messages constitute a nudge that preserves patients’
freedom to schedule check-ups whenever they want to. A patient who rationally postpones
a check-up (e.g., because she faces a period of high opportunity costs, or because she is
‘rationally inattentive’) can simply ignore the reminder message. Reminders might, however,
help people who would otherwise procrastinate check-ups due to memory limitations, limited
awareness, or present-biased preferences.
3.1 Treatments
We examine a nested experimental design with two layers of randomization. First, we ex-
ogenously vary whether individuals who should make a new check-up according to their rec-
ommended check-up interval receive a reminder postcard. Second, within the treated group,
we randomize design, content, and framing of the reminder postcards. Overall, we consider
six treatments. The group of patients who receive no reminder (No-Reminder) serves as our
main control group. Patients in treatment Neutral receive a reminder postcard that asks to
make a new check-up appointment. In addition, the postcard provides the dentist’s name,
phone number and address. This content is also included in all further reminder treatments,
which contain additional information about the benefits of dental health prevention. Two
treatments provide positively framed information that emphasizes the long-run health ben-
efits as well as the potential pecuniary advantages of prevention. The final two treatments
provide the same information, but the text stresses the negative consequences of not taking
care of dental health (see Table A.1 in the Appendix).
Together with the text manipulations we vary the cover design of the postcards. The
neutral postcard displays a picture of a calendar, with the word ‘Dentist’ written on one of
the dates. In the positively framed treatments, the postcard shows either a smiling female
or male face with healthy teeth (treatments PosF and PosM , respectively). In the treat-
ments with negative framing of information, the cover displays a female or male patient with
toothache (NegF , NegM). The cover designs of the postcards are presented in Figure A.1 in
the Appendix.
An overview of the treatments is presented in Figure 1. Testing the top row against
the bottom row of treatments allows us to identify whether reminders affect patients’ check-
up behavior. There are two main reasons why we expect people to make more check-up
appointments in response to reminders. First, reminders increase patients’ attention by
making the need for dental prevention salient. They should therefore encourage check-ups of
people with memory limitations, who would otherwise forget about the date of their last visit,
their recommended check-up interval, and the need to arrange a new appointment. Second, all
6

Figure 1: Overview of treatments.
reminders provide the dentist’s contact details, and thereby reduce the immediate transaction
costs of calling and scheduling an appointment. While this should affect all decision-makers,
one might argue that the reduction in immediate costs is particularly relevant for present-
biased people. Note, however, that the main costs of a check-up originate from the actual
visit at the dentist, rather than from scheduling the appointment. The impact of reminders
on the actual check-up frequencies of present-biased people might therefore be limited.4
The different treatment cells in the bottom part of Figure 1 reflect our second layer of
randomization. Comparing these treatments, we can analyze whether the design and content
of reminders matters, and which reminders are particularly effective for specific subgroups of
the patient population. As compared to the neutral reminder, one might expect the reminders
containing additional information to further increase patients’ awareness about the benefits of
check-ups (or the risks of not going to check-ups). Observing a higher frequency of check-ups
in the treatments with additional information would thus indicate that limited awareness is
a driving force in people postponing check-ups.
4More precisely, the reduction in transaction costs through reminders might induce a present-biaseddecision-maker who is naıve about his bias to contact the dentist and arrange an appointment. On theday of the check-up appointment, however, the higher immediate costs of going to the dentist and having thecheck-up might dominate. Observing an increase in scheduled check-ups, but also an increase in the frequencyof missed appointments in the reminder treatments, would thus be indicative of present-biases (and naıvete).
7

Despite the frequent use of policies that apply framing in the domain of risky behaviors
(e.g., negatively framed warning messages on tobacco packages), little is known about the in-
fluence of framing on health prevention. Evidence from other domains shows that positive and
negative frames can alter people’s perception of information (Tversky and Kahneman 1981).
Earlier survey evidence also indicates that gain/loss framings affect intentions for adopting
different strategies in health prevention (Rothman et al. 1999). Comparing treatments PosF
and PosM against NegF and NegM , we can test whether the framing of information in terms
of gains or losses actually influences check-up behavior. Finally, by comparing treatments
PosF and NegF against treatments PosM and NegM , we can study whether the gender of the
persons depicted on the message cover influences responses, as suggested by Bertrand et al.
(2010).
3.2 Sample and randomization
We conducted the experiment in cooperation with a dentist in Bonn, Germany, who uses a
computer-guided reminder system. At the first visit at this dentist, patients are classified
according to their dental health status as ‘regular’ or ‘at-risk’ patients. The classification
implies a recommended check-up frequency of 6 or 4 months, respectively. The dentist’s
computer system keeps track of each patient’s visits. If a patient with a recommended m-
month check-up frequency has not been at the dentist since m months, a reminder flag is
generated by the system. Every month, we randomly assigned all patients with a reminder
flag into one of our six treatments.5 When a patient is treated (or stays untreated in case she
is assigned to the control group), or when a patient comes to a check-up, the reminder flag
is switched off for another m months. Hence, a patient will receive reminders in intervals of
at most m months.6
Several aspects of the procedure are worth noting. First, one has to bear in mind that
we randomize within a selected sample of patients. Patients who schedule their check-ups
in a particularly timely manner are less likely to be part of our sample, whereas patients
who are not sticking to their recommended check-up schedule have a higher likelihood of
participating in the experiment. From a policy perspective, our experimental sample seems
5If a patient visits the dentist after the flag is generated but before we randomize, the flag is switched off.As discussed below, such a patient self-selects out of the sample.
6Suppose Mr. A, a patient with a recommended check-up interval of 6 months, had a check-up on 15January 2010. He does not visit the dentist in the following 6 months. Starting with 16 July 2010, thedatabase flags Mr. A for his next check-up. Suppose that he is randomly assigned to a reminder treatment on1 August 2010. If Mr. A responds to the reminder and comes to a check-up appointment on, say, 20 August,the reminder flag would pop up again on 21 February, 2011. If Mr. A does not respond to the reminder andhas no check-up in the following six months, the flag pops up on 2 February 2011 – 6 months (and one day)after sending the last reminder.
8

to be interesting for implementing nudge-based policies, since it pools procrastinators with
others that might rationally postpone check-ups.
Second, we randomize at the household rather than at the individual level: in any ran-
domization wave, members of the same household are assigned to the same treatment. In this
way, we try to avoid possible treatment spillovers (Miguel and Kremer 2004) and minimize
patients’ consciousness of an ongoing experiment. Third, during the 11 months in which the
experiment was conducted, several patients are treated repeatedly. This is the case since
some patients will be flagged for a check-up at two points in time during the experimental
period. We independently randomize each time a patient is up for a check-up. This procedure
generates random treatment sequences, which allows us to study the impact of repeatedly
treating patients and the role of different treatment orders.
Finally, and related to the previous point, one has to bear in mind that the dentist operated
a system of reminder postcards already before the start of our experiment. This affects the
interpretation of some of our findings, as we do not introduce reminders for the first time in
the entire patient population. However, we have access to patients’ reminder history before
the start of the experiment, and we can further exploit the randomized treatment sequence in
our experiment. This allows us to assess potential differences in response rates upon receipt
of the first versus subsequent reminders in more detail (see Section 4.4).7
3.3 Implementation and measures
The experiment was conducted between April 2010 and March 2011. Overall, our sample
covers 1227 instances in which a patient was up for a check-up appointment. These cases
spread over 817 individuals from 713 households. For roughly half of the patients, we have
data on repeated treatment sequences. Randomization was implemented in 11 waves, with
reminders being sent out on average every five weeks. All postcards were sent out by the
dentist on Fridays, immediately after randomization took place. According to Deutsche Post,
postcards should be delivered on Monday at the latest. We therefore measure response time
(in days), starting with the Monday after a randomization wave as day 1.8 For the response
duration in the control group, we use the same starting day.
7A priori, it is unclear whether the initial or the repeated application of reminders triggers strongerresponses. On the one hand, the introduction of a reminder system could initially yield particularly highresponse rates due to a ‘surprise effect’. On the other hand, routinely applying reminders could increasepatient responses through a ‘habituation effect’.
8Patients receiving a postcard on Saturday could send an email or leave a message on the dentist’s an-swering machine over the weekend. However, there was not a single response via email or the answeringmachine.
9

Our main variable of interest is whether or not a participant calls the dentist for scheduling
an appointment. The date of the call measures the first point in time at which people
respond to our intervention. In a second step, we study patients’ actual show-up at the
dentist. Considering the date of the first contact rather than the actual check-up (which
is, on average, scheduled 14 days after a patient called) has the advantage that it avoids
potential congestion in check-up dates due to the dentist’s capacity limits. More precisely,
one might worry that finding longer delays in check-up dates for the No-Reminder condition
might be the result of the response of patients in the reminder treatments, who ‘block’ dates
for earlier appointments.
In addition to our main outcome variables, we compiled a rich set of patient background
characteristics. Next to the patient’s gender, age, and risk classification (i.e., the recom-
mended check-up interval), we know whether a patient is covered by private or public health
insurance (Private HI ).9 In addition, we observe whether a patient lives in a household in
which other household members took part in the experiment (Family).10 We further measure
when a patient first visited the dentist, and derive information about individuals’ check-up
and dental treatment history before the experiment. For people with a Patient retention of
more than 12 months, we also construct an indicator whether a patient attended at least two
check-ups in the year prior to a randomization wave (Regular). Furthermore, we construct a
binary variable, Pain, which captures whether a patient was exposed to a major root canal
treatment or other painful dental treatments in the past.11 Beyond the information from the
dentist’s database, we matched patients’ precise address with data obtained from immobilien-
scout24.de, Germany’s largest real estate platform. In this way, we obtain the average rental
price in the patients’ neighborhood (Rental price). From the address data, we also compute
the spatial distance between each patient’s home and the dentist (Distance).
Table 1 presents the descriptive statistics of our data and summarizes the outcomes of
randomization. Patients in our sample are on average 38 years old (with age varying between
15 and 92 years), 59% of them are female, and about 12% belong to households in which
additional family members are patients at the dentist. As noted above, about 20% of patients
are covered by private health insurance. On average, individuals in our sample have been
9 Controlling for insurance status is important since contractual terms might differ under private and publichealth insurance (see above). Moreover, in the German health system, the privately insured are a selectedsample since only persons with a gross yearly income above 50K Euro, self-employed, and civil servants areeligible for private health insurance. Due to Bonn’s history as the former capital of West Germany, a largepart of the privately health insured in our sample seem to be civil servants.
10To avoid confounds from parents arranging joint appointments for themselves and their children, ourdata analysis excludes children below the age of 15.
11The results presented below are robust to using alternative definitions of patient check-up history andpainful treatments.
10

Treatment No-Rem Neutral PosF PosM NegF NegM Total F-test t-test(p-value) (p-value)
Age 37.23 38.62 40.11 36.64 37.28 38.40 38.05 0.128 0.364(13.42) (13.48) (13.88) (13.32) (13.28) (14.19) (13.62)
Female 0.542 0.594 0.612 0.579 0.570 0.624 0.588 0.592 0.159(0.500) (0.492) (0.488) (0.495) (0.496) (0.485) (0.492)
Family 0.151 0.129 0.092 0.134 0.087 0.108 0.117 0.288 0.105(0.359) (0.336) (0.290) (0.341) (0.282) (0.311) (0.321)
Private HI 0.219 0.138 0.204 0.193 0.193 0.174 0.186 0.369 0.202(0.414) (0.346) (0.404) (0.396) (0.396) (0.380) (0.389)
At-Risk 0.182 0.138 0.209 0.257 0.159 0.094 0.172 <0.001 0.680(0.387) (0.346) (0.408) (0.438) (0.367) (0.292) (0.378)
Patient 3.717 3.627 3.830 3.410 3.546 3.549 3.611 0.593 0.505retention (2.401) (2.366) (2.471) (2.292) (2.473) (2.435) (2.406)Regular 0.469 0.482 0.447 0.405 0.47 0.466 0.457 0.727 0.731
(0.500) (0.501) (0.499) (0.492) (0.500) (0.500) (0.498)Pain 0.249 0.196 0.172 0.237 0.204 0.252 0.218 0.241 0.259
(0.433) (0.398) (0.378) (0.427) (0.404) (0.435) (0.413)Distance 0.124 0.217 0.125 0.137 0.116 0.116 0.140 0.296 0.646
(0.444) (0.776) (0.370) (0.557) (0.408) (0.377) (0.513)Rental price 7.194 7.131 7.168 7.147 7.318 7.087 7.173 0.494 0.793
(1.181) (1.183) (1.224) (1.182) (1.225) (1.264) (1.210)N 192 217 202 196 213 207 1227
Table 1: Background characteristics. Mean values (standard deviations in parentheses).Notes: ‘Family’ is a dummy, indicating if several household members took part in the study. ‘Private HI’is equal to 1 if a patient is covered by private health insurance (0 for public health insurance). ‘At-Risk’indicates if a patient is recommended a 4 months check-up interval. ‘Patient retention’ is the number ofyears since a patient first visited the dentist. ‘Distance’ is the great-circle distance between a patient’s homeaddress and the dentist (scale: 1 = 100km). ‘Rental price’ is the average rent at the patient’s home address(Euros per square meter, excluding utilities and dues). The dummy ‘Regular’ indicates whether a patientmade at least two check-ups in the year prior to a given randomization wave. ‘Pain’ indicates if a patientwas exposed to a painful dental treatment in the year prior to a given randomization wave. Time-variantpatient characteristics (e.g., age, patient retention, etc.) are computed at each randomization wave. Thefinal two columns report (i) p-values of F-tests from regressions of the respective characteristics on individualtreatment dummies and (ii) p-values of t-tests comparing the characteristics in the No-Reminder treatmentvs. all patients who received a reminder.
patients at the dentist for 3.6 years, and 17% are classified as ‘at-risk’ patients. 46% of
patients have attended at least two check-ups in the previous year.
The final two columns of Table 1 report validation checks on the randomization. Com-
paring patients in the control treatment to those in the different reminder conditions (pooled
sample) yields no significant differences in patients’ background characteristics (see final col-
umn of Table 1). This indicates that randomization in patient characteristics was successful
for our most important treatment comparison. F-tests for regressions of the individual pa-
tient characteristics on dummies for the six different treatments yield no significant difference
11

except for the fraction of at-risk patients. In what follows, we provide evidence on the ba-
sic treatment effects as well as parametric analyses that control for differences in patient
characteristics across treatments.
4 Results
This section presents the results of the experiment. We first focus on the short-run effect of
reminders. We analyze how many people make a check-up appointment within one month
after the treatment intervention, and how many actually keep their appointment. Section
4.2 examines whether these effects differ for different subgroups of the patient population.
Thereafter, we study a considerably longer response period and assess the robustness of the
short-run effects. In a final step, we exploit the panel nature of our data and analyze how
people respond if they are ‘repeatedly nudged’.
4.1 Do reminders influence behavior?
Our first main result is shown in Figure 2. The figure depicts the fraction of patients who
contact the dentist within one month after the treatment intervention. We observe a strong
effect of the reminders on patients’ behavior: without receiving a reminder, only 8.9% of
patients schedule a check-up. In the reminder treatments, the response rate is on average more
than twice as high (19.3%). This difference is highly significant (p < 0.001).12 Compared
to the control treatment, response rates are significantly higher in each of the reminder
treatments (p < 0.001 for Neutral and PosF , respectively, p = 0.031 for PosM , p = 0.012 for
NegF , and p = 0.009 for NegM).
Figure 2 further illustrates that the reminders which include additional information do not
yield higher response rates than the neutral reminder. The frequencies of responses for the
different reminder treatments vary between 16.3% (PosM) and 23.0% (Neutral). All pairwise
treatment differences turn out to be insignificant.13 The comparison between negatively and
positively framed reminders further indicates that gain/loss framing does not affect response
rates in our setup. We also find no significant differences in responses to postcards with
male vs. female covers.14 Hence, the specific content of reminders does not seem to play
a major role for patients’ responses. The simple nudge in treatment Neutral has (statisti-
cally) the same impact on behavior as reminder messages that include additional information,
independently of how this information is framed.
12The test statistics are based on two-sided t-tests that account for clustering at the household level.13Except for the comparison of the Neutral and the PosM reminder (p = 0.107), all pairwise tests yield
p-values that are well above conventional significance levels.14p = 0.593 for treatments PosF and PosM versus NegF and NegM ; p = 0.382 for treatments PosF and
NegF versus PosM and NegM .
12

0.0
5.1
.15
.2.2
5F
ract
ion
of p
atie
nts
who
res
pond
with
in 3
0 da
ys
No−Rem Neut PosF PosM NegF NegM
Figure 2: Impact of reminders on response rates. Fraction of patients who contact dentistwithin 30 days after treatment intervention.
The strong reminder effect persists once we control for patient characteristics and potential
seasonal differences during our experiment. To demonstrate this point, we consider the model
Resp30 = α + β Rem + γ1 Rem × PosF + γ2Rem × PosM
+ γ3Rem × NegF + γ4Rem × NegM +Xδ +Wϕ+ ε, (1)
where X is a vector of patient characteristics and W includes dummies for the different
randomization waves. The dependent variable, Resp30, measures whether a person makes
a check-up appointment within 30 days after the treatment intervention.15 Rem indicates
whether a person has received any reminder postcard. The coefficient β thus identifies the
main reminder effect. In the full specification, β corresponds to the impact of the neutral
reminder relative to the control group. The effect of the framed reminders is given by β+ γk,
for k ∈ {1, 2, 3, 4}, where the γ-coefficients capture the differences between a framed reminder
and the neutral reminder.
Table 2 reports estimation results based on linear probability models.16 Specification
(1) estimates the average impact of reminders on patients’ response rates. Specification
15Our results are robust when we consider shorter and longer response periods (see Figure 3 below). Notefurther that we start counting the response time at the same day for the treated and the control group (i.e.,the first workday after we sent out reminder postcards in the respective randomization wave).
16To avoid complications with the interpretation of marginal effects from interaction terms in non-linearmodels (Ai and Norton 2003), we focus on LPM estimations. Results from probit estimations, which yieldvery similar results, are available from the authors.
13

Dependent variable: Response within 30 days(1) (2) (3) (4) (5)
Reminder 0.105⋆⋆⋆ 0.142⋆⋆⋆ 0.133⋆⋆⋆ 0.129⋆⋆⋆ 0.145⋆⋆⋆
[0.024] [0.038] [0.038] [0.038] [0.040]Rem × PosF -0.011 -0.010 -0.017 -0.031
[0.044] [0.043] [0.042] [0.044]Rem × PosM -0.067 -0.065 -0.059 -0.074⋆
[0.041] [0.041] [0.041] [0.042]Rem × NegF -0.057 -0.054 -0.051 -0.072⋆
[0.040] [0.040] [0.040] [0.043]Rem × NegM -0.052 -0.051 -0.054 -0.064
[0.043] [0.042] [0.042] [0.045]Male -0.021 -0.007
[0.023] [0.024]Age 0.003⋆⋆⋆ 0.001
[0.001] [0.001]Family 0.004 0.008
[0.037] [0.038]Private HI -0.028 -0.023
[0.029] [0.028]Distance -0.041⋆⋆ -0.046⋆⋆⋆
[0.019] [0.009]Patient retention 0.007 0.007
[0.005] [0.005]At-Risk -0.001 -0.018
[0.034] [0.035]Regular 0.148⋆⋆⋆
[0.025]Pain -0.025
[0.027]Rental price 0.030⋆⋆⋆
[0.009]Constant 0.089⋆⋆⋆ 0.089⋆⋆⋆ 0.126⋆⋆⋆ 0.024 -0.220⋆⋆
[0.020] [0.020] [0.039] [0.050] [0.089]Wave dummies no no yes yes yesN 1,227 1,227 1,227 1,227 1,095
Table 2: Response within 30 daysNotes: All specifications are estimated with a linear probability model. Robust standard errors, clustered atthe household-level, are reported in brackets. ⋆⋆⋆, ⋆⋆ and ⋆ indicates significance at a 1%-, 5%-, and 10%-level,respectively.
(2) includes treatment dummies for the reminders that contain additional information. As
noted above, all these treatments display an insignificantly weaker increase in response rates
compared to the neutral reminder. The results do not change when we include dummies for
the randomization waves (Column 3) or a first set of background characteristics (Column 4).
Specification (5) includes the full set of controls (which slightly reduces the sample size due
to missing observations). The point estimate in this specification indicates that the neutral
14

reminder increases the response rate by 14.5 percentage points relative to the control group.
For all reminders with additional information, the increase in response rates is somewhat less
pronounced. The difference to the Neutral treatment is significant at the 10%-level for the
PosM and the NegF treatment. However, relative to the untreated control group, all framed
reminders still have a significantly positive effect on the response rate (F -tests for significance
of β+γk: p = 0.003 for PosF , p = 0.051 for PosM , p = 0.044 for NegF , p = 0.025 for NegM).17
In sum, these results demonstrate that reminder messages lead to a sizeable and robust
increase in the number of patients who schedule check-ups. Additional information about
the benefits of dental prevention does not further increase the strength of the effect relative
to the simple reminder in the Neutral treatment.
Result 1: Reminders significantly increase the likelihood of scheduling check-up
appointments. The fraction of people who arrange a check-up within one month is
more than twice as high as in the control group. The specific content and design of
the reminder message has no significant influence on responses.
A potential interpretation of these findings is that limited awareness about the importance
of dental health prevention is not a major factor contributing to delayed check-ups. Rather,
being reminded per se seems to be of first-order importance. This ‘pure’ reminder effect is
likely to operate via increased attention and, potentially, via a reduction in the transaction
cost of responding. Recall, however, that the main transaction cost of a check-up typically
emerges with the actual visit at the dentist. In the next step, we thus consider the impact of
reminders on patients’ check-up attendance.
Who keeps an appointment?
One could imagine that patients who are ‘nudged’ into scheduling an appointment are more
likely to miss the appointment. This could, for instance, be the case since reminders only
reduce the costs of arranging an appointment, but not the costs of attending the check-
up. (Naıve) Present-biased people might therefore schedule more check-ups in the reminder
treatments, but then cancel or miss their appointments. A higher frequency of missed ap-
pointments in the reminder treatments could also occur if check-up appointments that are
made in response to a nudge are less carefully planned. This could (at least partially) offset
the impact of reminders on actual dental health prevention. Our data clearly reject this
possibility.
17Consistent with earlier evidence on socio-demographic correlates of dental health prevention (e.g., Langet al. 1994), specifications (4) and (5) of Table 2 also document that several patient characteristics influenceresponse behavior.
15

Conditional on having made an appointment within a month, 9.7% of the patients in the
reminder treatments miss their check-up date. This compares to 17.7% in the control group.
While the difference is not statistically significant (p = 0.402), the observation indicates
that the reminder effect summarized in Result 1 is not diluted by missed appointments. If
anything, the impact of reminders is even stronger when we account for missed dates: the
overall fraction of patients who contact the dentist within a month and actually show up at
their check-up is 7.3% for the control and 17.6% for the treated group (p < 0.001).18 The
fact that we do not observe an increase in missed appointments for the treatment group
suggests that reminders do not predominantly operate via the reduction in transaction costs
for (naıve) present-biased individuals.
Result 2: The frequency of actual check-ups in the reminder treatments is signifi-
cantly higher than in the control group.
4.2 Does one reminder ‘fit all’?
We now turn to the question whether particular types of reminders have stronger or weaker
effects for specific subgroups. From a policy perspective, this analysis is interesting as it
provides insights into whether targeting different groups of patients with type-specific re-
minders can increase their overall impact. To address this question, we estimate equation
(1) for different subgroups of patients. We split our sample according to several important
background characteristics: patients’ gender, the type of health insurance, whether patients
attended regular check-ups in the previous year, and whether they were exposed to a painful
dental treatment in the past. In addition, we provide estimations for patients who are above
and below median age, and for people living in neighborhoods with above- vs. below-median
rental prices. Results are reported in Table 3.
The estimates reinforce our previous findings on the effectiveness of the neutral reminder.
For almost all subgroups, this reminder triggers the highest response rate. Moreover, there
is not a single subsample for which any of the reminders with additional information signifi-
cantly increases response rates relative to the Neutral treatment. In fact, some of the framed
reminders perform significantly worse than the neutral reminder in several subgroups. Among
male patients, for instance, the negative male framing completely erodes the reminder effect,
bringing down the response rate to the level of the untreated control group (see Column 2a).
For patients with a painful dental treatment in the past, the neutral reminder has a very
18If we replace the dependent variable in Table 2 by an indicator for actual check-ups, we get nearly identicalestimates. The results are available from the authors.
16

strong positive impact, whereas all other reminders yield no significant increase in responses
relative to the control group (Column 8a). While an explanation for these patterns is beyond
the scope of this paper, we can draw a clear-cut conclusion: the neutral reminder works best
in that it is never dominated by any reminder with additional information.
Dependent variable: Response within 30 days
Panel A
(1) (2a) (2b) (3a) (3b) (4a) (4b)Full Male Female Younger Older Priv.HI Publ.HI
Reminder 0.129⋆⋆⋆ 0.138⋆⋆ 0.129⋆⋆⋆ 0.144⋆⋆⋆ 0.122⋆⋆ -0.017 0.165⋆⋆⋆
[0.038] [0.058] [0.049] [0.047] [0.059] [0.093] [0.040]Rem × PosF -0.017 -0.034 -0.014 -0.089⋆ 0.017 -0.003 -0.014
[0.042] [0.064] [0.054] [0.051] [0.062] [0.091] [0.048]Rem × PosM -0.059 -0.084 -0.046 -0.038 -0.089 0.002 -0.068
[0.041] [0.063] [0.053] [0.056] [0.060] [0.091] [0.046]Rem × NegF -0.051 -0.051 -0.058 -0.034 -0.072 -0.044 -0.048
[0.040] [0.064] [0.051] [0.055] [0.058] [0.095] [0.045]Rem × NegM -0.054 -0.130⋆⋆ -0.018 -0.070 -0.037 0.016 -0.068
[0.042] [0.060] [0.053] [0.055] [0.062] [0.092] [0.045]
N 1,227 506 721 613 614 228 999
Panel B
(5) (6a) (6b) (7a) (7b) (8a) (8b)Full High Rent Low Rent Regular Non-Reg. Pain No-Pain
Reminder 0.145⋆⋆⋆ 0.236⋆⋆⋆ 0.034 0.177⋆⋆⋆ 0.126⋆⋆⋆ 0.264⋆⋆⋆ 0.115⋆⋆
[0.040] [0.057] [0.057] [0.066] [0.048] [0.087] [0.046]Rem × PosF -0.031 -0.070 0.031 -0.013 -0.067 -0.231⋆⋆ 0.017
[0.044] [0.065] [0.057] [0.072] [0.052] [0.102] [0.049]Rem × PosM -0.074⋆ -0.115⋆ -0.019 -0.072 -0.102⋆⋆ -0.146 -0.059
[0.042] [0.061] [0.055] [0.075] [0.048] [0.101] [0.047]Rem × NegF -0.072⋆ -0.082 -0.037 -0.068 -0.077 -0.237⋆⋆ -0.047
[0.043] [0.064] [0.056] [0.072] [0.050] [0.102] [0.049]Rem × NegM -0.064 -0.077 -0.003 -0.024 -0.117⋆⋆ -0.253⋆⋆⋆ -0.018
[0.045] [0.070] [0.056] [0.075] [0.050] [0.094] [0.052]
N 1,095 577 518 502 593 246 849
Table 3: Response within 30 days for different subsamplesNotes: Estimation (1) and (5) replicate specification (4) and (5) from Table 2. The estimates in panel A [B]include a full set of wave dummies and the restricted [full] set of controls, as reported in Column (4) [(5)]of Table 2. Specifications (3a–b) and (6a–b) split the sample according to the median age and rental price,respectively. Estimated coefficients for control variables and the constant are suppressed. Robust standarderrors, clustered at the household-level, are reported in brackets. ⋆⋆⋆, ⋆⋆ and ⋆ indicates significance at a 1%-,5%-, and 10%-level, respectively.
The estimates in Table 3 further reveal two groups of patients who do not react to re-
minders. Among patients covered by private health insurance (Column 4a) and patients living
17

in low-rent neighborhoods (Column 6b), none of the reminders induces a significant increase
in check-ups. The absence of a reminder effect for privately insured patients might be at-
tributable to the differences in insurance conditions (e.g., the higher costs to regularly attend
check-ups, see Fn. 2), which in turn could lead to more deliberate planning of check-up fre-
quencies. For people from low-rent neighborhoods (Column 6b), neither the neutral reminder
nor providing information about the potential benefits from check-ups significantly increases
response rates. Follow-up research indicates, however, that providing additional economic
incentives can help to encourage prevention in this group (see Altmann et al. 2012). We
summarize our findings in
Result 3: The neutral nudge works best, in the sense that there is no group of
patients for which a framed reminder increases responses significantly relative to the
neutral reminder. There is a positive reminder effect in all subgroups, except for
patients with private health insurance and patients living in cheaper neighborhoods.
Our analysis of patient subgroups corroborates the positive impact of the simple, neutral
reminder message. For a wide range of the patient population, the neutral reminder leads
to a strong and significant increase in check-up arrangements. In fact, our results suggest
that a neutral and uniform reminder might be preferable to targeting specific groups with
different reminder nudges. This point is further reinforced if one accounts for higher costs of
implementing group-specific nudges.
4.3 The long-run impact of reminders
So far, we have focused on the short-run response to our treatments. In what follows, we study
whether the observed effects are driven by patients scheduling their check-ups just somewhat
earlier than intended or whether there is indeed a persistent, positive reminder effect. Stated
differently, we examine whether reminders activate patients that would otherwise not have
scheduled check-up appointments.
To approach this question, we consider patients’ responses up to 100 days after our treat-
ment intervention.19 Figure 3 depicts the cumulative frequency of responses over time for
patients in the reminder treatments (black line) and the control treatment (grey line). Al-
ready a few days after receiving a reminder, the response rate is strictly higher in the reminder
treatments. Over time, the gap between the two groups slightly declines. However, the treat-
ment effect never vanishes. Patients in the reminder conditions exhibit a persistently higher
19Analyzing response rates for a longer time period is problematic, since high-risk patients will alreadyreceive their next reminders.
18

0.00
0.10
0.20
0.30
0.40
Res
pons
e ra
te
0 20 40 60 80 100Days since treatment
Reminder No Reminder
Figure 3: Cumulated response of patients in the reminder treatments (black line) and thecontrol treatment (grey line) over time.
frequency of making check-up appointments. For days 51–100, the treatment difference is
nearly constant at roughly 8 percentage points. This is also confirmed when we estimate
equation (1) with a dummy indicating the response within 100-days as dependent variable.
To provide a parametric analysis of the incidence and timing of patients’ responses in
the different treatments, we conduct a duration analysis. Table 4 reports estimated hazard
ratios based on Cox proportional hazard model. Specification (1) shows that patients who
received a reminder exhibit on average a 40% higher hazard rate than the control group.
Specification (2) estimates separate effects for the different reminder treatments. In line with
the results for the short-run response, the results document that the neutral reminder has
the strongest impact. The estimated hazard ratio for Neutral is roughly 1.5 relative to the
control group. A similar effect is found for the PosF treatment. For the other treatments, the
coefficients imply that the chance of contacting the dentist (conditional on not having done
so before) is increased by a factor of 1.2–1.4 relative to the control treatment. Except for one
treatment (PosM), these effects are significant at the 5% and 10% level. When we include
wave dummies and further control variables (specifications 3–5), the underlying standard
errors slightly increase but the estimated hazard rations remain almost unchanged.
We also replicated the different steps of analysis using an indicator for the actual show-
up at the check-up. As in the short-run analysis, the frequency of missed appointments is
relatively small (10.12% on average). Missed appointments occur again more frequently in
the No-Reminder condition than in the reminder treatments (14.00% versus 9.58%). Thus,
we obtain qualitatively similar results for the impact of reminders on the rate of actual check-
19

Dependent variable: Response duration
(1) (2) (3) (4) (5)
Reminder 1.418⋆⋆
(0.019)Neutral 1.581⋆⋆ 1.506⋆⋆ 1.488⋆⋆ 1.542⋆⋆
(0.014) (0.031) (0.032) (0.027)PosF 1.563⋆⋆ 1.479⋆⋆ 1.401⋆ 1.486⋆⋆
(0.014) (0.035) (0.068) (0.041)PosM 1.161 1.111 1.116 1.135
(0.449) (0.597) (0.577) (0.537)NegF 1.428⋆⋆ 1.365⋆ 1.351⋆ 1.360
(0.048) (0.092) (0.098) (0.105)NegM 1.371⋆ 1.315 1.261 1.269
(0.086) (0.141) (0.208) (0.208)
Wave dummies no no yes yes yesControls no no no yesi yesii
N 1,227 1,227 1,227 1,227 1,095
Table 4: Duration analysis (Cox proportional hazard model)Notes: The table reports hazard ratios from estimations based on Cox proportional hazards model. P -valuesbased on robust standard errors, clustered at the household-level, are reported in parentheses. Specification(4) and (5) include the (i) restricted and (ii) the full set of control variables, respectively. ⋆⋆⋆, ⋆⋆ and ⋆
indicates significance at a 1%-, 5%-, and 10%-level, respectively.
ups: in the treated group, the frequency of actual check-ups is 8 percentage points higher
than in the control group (30.53% versus 22.39%).
Result 4: The reminder effect is persistent. In response to the reminders, check-up
appointments increase by 8 percentage points after 100 days. The neutral reminder
continues to have the strongest impact, increasing the conditional likelihood to call
the dentist by 50% relative to the control group.
The analysis of patients’ long-run behavior demonstrates that the reminder effect is long
lasting. While the absolute treatment effect is somewhat smaller than in the short run, the
effect is still sizable and statistically significant. Our findings indicate that reminders – and in
particular the neutral reminder message – bring significantly more patients to check-ups who
would otherwise not have made an appointment (or would have delayed their next check-up
for a long time).
20

4.4 Being ‘nudged’ more than once
Over the course of our experiment, several patients were treated twice. For these patients,
random treatment assignment generates different sequences of treatments. This allows us to
study whether the reminder effects depend on a patient’s past exposure to the nudge. Among
the group of patients who are up for a check-up at two points in time during our experiment,
at T1 and at T2, we compare the following four treatment sequences: (1) Patients that neither
received a reminder in T1 nor in T2 (i.e., patients that are in the control group twice), (2)
patients that received a reminder in T1 and in T2 (RemT1×RemT2), (3) patients that were
untreated in T1, but were reminded in T2 (NoRemT1×RemT2), and finally (4) patients that
received a reminder in T1, but not in T2 (RemT1×NoRemT2).
To analyze whether these different sequences generate differential response patterns after
the second treatment intervention, we estimate the model
Resp30T2 = λ0 + λ1RemT1 × RemT2 + λ2NoRemT1 × RemT2 + λ3RemT1 ×NoRemT2 + ν, (2)
where Resp30T2 is an indicator for a response within 30 days after the second intervention
(at T2). The coefficients λ1 and λ2 measure the reminder effects at T2 relative to the group
which remains untreated twice, for patients who did (λ1) or did not (λ2) receive a reminder in
T1. Comparing these coefficients allows us to assess whether reminders have a stronger effect
when they are applied twice (which would imply λ1 > λ2) or whether repeatedly nudging
people has a weaker impact (λ1 < λ2). By comparing λ1 and λ2, we can therefore assess
wether reminders work mostly through a ‘surprise’ or a ‘habituation’ effect, or whether the
effect of reminders is not affected by a patient’s history of receiving reminders.
The coefficient λ3 captures the behavior in the group that does not receive a reminder in
T2, after having received a reminder in T1. An estimate of λ3 < 0 would indicate that ‘taking
away’ the reminder has detrimental effects, in the sense that patients’ response rate falls below
the one of the reference group who was neither reminded in T1 nor in T2. This could be
the case, for instance, if people get used to being nudged and rely too heavily on receiving
the next nudge. We thus explicitly address the concern that nudges can not easily be taken
away and therefore might provide a slippery slope towards more heavy-handed interventions
– a point that has been raised by critics of libertarian paternalism (e.g., Rizzo and Whitman
2009).
21
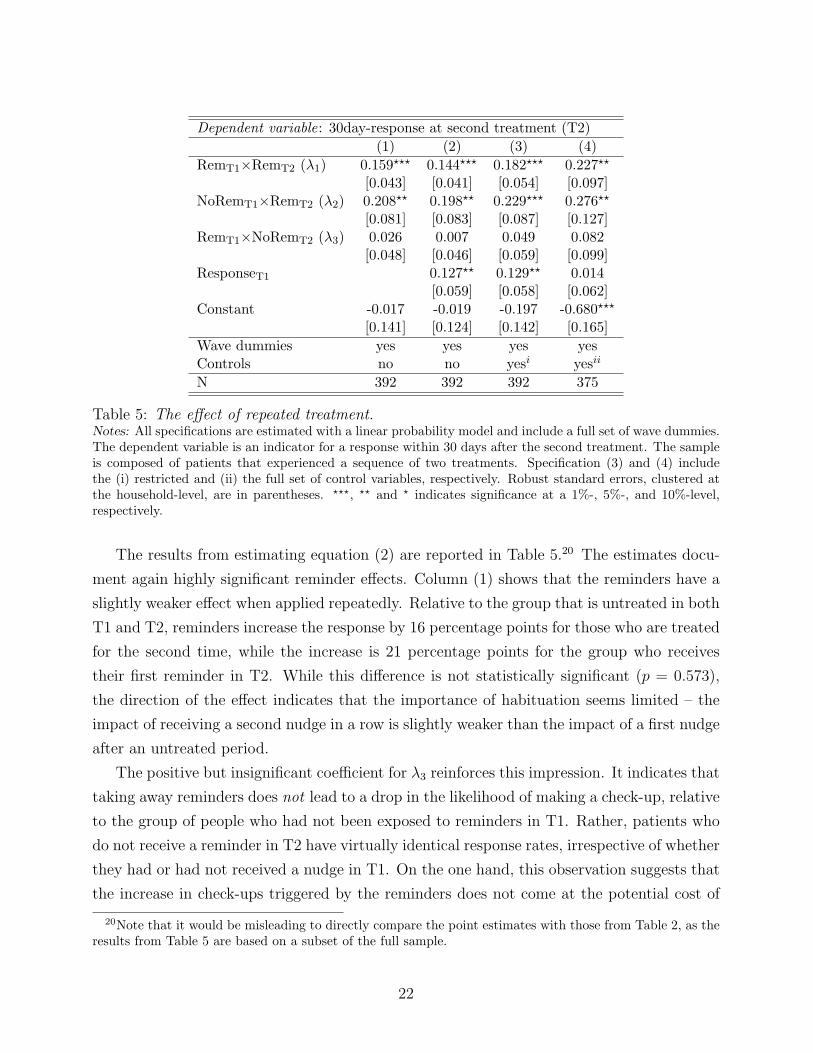
Dependent variable: 30day-response at second treatment (T2)
(1) (2) (3) (4)
RemT1×RemT2 (λ1) 0.159⋆⋆⋆ 0.144⋆⋆⋆ 0.182⋆⋆⋆ 0.227⋆⋆
[0.043] [0.041] [0.054] [0.097]NoRemT1×RemT2 (λ2) 0.208⋆⋆ 0.198⋆⋆ 0.229⋆⋆⋆ 0.276⋆⋆
[0.081] [0.083] [0.087] [0.127]RemT1×NoRemT2 (λ3) 0.026 0.007 0.049 0.082
[0.048] [0.046] [0.059] [0.099]ResponseT1 0.127⋆⋆ 0.129⋆⋆ 0.014
[0.059] [0.058] [0.062]Constant -0.017 -0.019 -0.197 -0.680⋆⋆⋆
[0.141] [0.124] [0.142] [0.165]
Wave dummies yes yes yes yesControls no no yesi yesii
N 392 392 392 375
Table 5: The effect of repeated treatment.Notes: All specifications are estimated with a linear probability model and include a full set of wave dummies.The dependent variable is an indicator for a response within 30 days after the second treatment. The sampleis composed of patients that experienced a sequence of two treatments. Specification (3) and (4) includethe (i) restricted and (ii) the full set of control variables, respectively. Robust standard errors, clustered atthe household-level, are in parentheses. ⋆⋆⋆, ⋆⋆ and ⋆ indicates significance at a 1%-, 5%-, and 10%-level,respectively.
The results from estimating equation (2) are reported in Table 5.20 The estimates docu-
ment again highly significant reminder effects. Column (1) shows that the reminders have a
slightly weaker effect when applied repeatedly. Relative to the group that is untreated in both
T1 and T2, reminders increase the response by 16 percentage points for those who are treated
for the second time, while the increase is 21 percentage points for the group who receives
their first reminder in T2. While this difference is not statistically significant (p = 0.573),
the direction of the effect indicates that the importance of habituation seems limited – the
impact of receiving a second nudge in a row is slightly weaker than the impact of a first nudge
after an untreated period.
The positive but insignificant coefficient for λ3 reinforces this impression. It indicates that
taking away reminders does not lead to a drop in the likelihood of making a check-up, relative
to the group of people who had not been exposed to reminders in T1. Rather, patients who
do not receive a reminder in T2 have virtually identical response rates, irrespective of whether
they had or had not received a nudge in T1. On the one hand, this observation suggests that
the increase in check-ups triggered by the reminders does not come at the potential cost of
20Note that it would be misleading to directly compare the point estimates with those from Table 2, as theresults from Table 5 are based on a subset of the full sample.
22

a decline in active patient responses, once the nudge is taken away. On the other hand, the
insignificant coefficient also indicates that having received a reminder in T1 does not increase
the likelihood of calling the dentist once a subsequent check-up is due in T2.
One might be concerned that the estimates are influenced by whether or not a patient
made a check-up in T1 – which is clearly affected by the treatment in T1. To account for
this concern, Column (2) includes an indicator for patients’ behavior in T1 (ResponseT1).
The point estimate for ResponseT1, however, should be treated with caution, as the dummy
is likely correlated with the error term in equation (2). The coefficients for λ1, λ2, and λ3 are
hardly affected when we include this new variable. Qualitatively, this also holds when we add
further control variables in Columns (3) and (4). The point estimates for λ1 and λ2 increase,
but the difference between both coefficients remains insignificant. Similarly, response rates
in the treated-untreated sequence are always higher than for patients who are neither treated
in T1 nor in T2 (λ3 > 0), but the difference is statistically insignificant.
Result 5: Patients who receive the second reminder in a row exhibit similar response
rates as patients who receive the first reminder. Taking away a reminder has no
detrimental effect on patients’ response rates.
Extending the analysis from above, we also studied whether differences in the sequences
of receiving (i) neutral or framed reminders, (ii) positively or negatively framed reminders,
and (iii) male or female framings matter for the observed treatment effects. In addition, we
tested whether there are ‘alternation effects’, in the sense that receiving different reminders
in repeated treatment sequences strengthens or weakens the reminder effect. Our analysis
did neither reveal any further sequence effects nor any evidence on an effect from alternating
the nudges.
5 Conclusions
Using random treatment assignment, we analyzed whether reminder nudges influence pa-
tients’ likelihood of making dental check-ups. Our results document a strong and persistent
effect of reminders on patient behavior. The effect of reminders does not come at the cost
of a decline in active patient responses, once the nudge is taken away. Our data further
indicate that simple nudges seem to work best: including additional information and framing
does not increase responses relative to a simple, neutral reminder message. This observation,
which corroborates evidence from other decision environments, suggests that limited aware-
ness about the benefits of prevention does not play a major role in our context. Given that
the observation seems to generalize to other domains, it also casts some doubt on the effec-
23

tiveness of negatively framed information – such as warning messages on tobacco packages –
in the regulation of (un)healthy behaviors.
From a more general policy perspective, our results show that reminders can be used as an
unobtrusive, and low-cost instrument for encouraging health prevention. Preventive activities
involve cognitive and economic costs in the short run, but yield benefits only in the long run.
This makes prevention vulnerable to procrastination due to present-biased preferences or
limitations in memory and attention. Since reminders play on both of these biases, our study
does not provide a ‘mechanism experiment’ in the sense of Ludwig et al. (2011). While we
cannot precisely pin down the channel which renders the reminders successful, some of our
results suggest that the effects are not predominantly driven by present biases. A full-fledged
structural approach – as suggested in Card et al. (2011) – appears to be a particularly
promising avenue for quantifying the relative importance of limited memory and present-
biased preferences in future research.
24

References
Abeler, J. and Marklein, F. (2010). Fungibility, labels, and comsumption, CeDEx Dis-
cussion Paper No. 2010-13, University of Nottingham.
Ai, C. and Norton, E. C. (2003). Interaction terms in logit and probit models. Economics
Letters, 80 (1), 123–129.
Altmann, S., Traxler, C. and Weinschenk, P. (2012). Limited memory, deadlines, and
incentives: Theory and experimental evidence, Mimeo, Max-Planck-Institute for Research
on Collective Goods.
Apesteguia, J., Funk, P. and Iriberri, N. (2012). Promoting rule compliance in daily-
life: Evidence from a randomized field experiment in the public libraries of Barcelona,
Working Paper, Universitat Pompeu Fabra.
Behavioural Insights Team (2010). Applying behavioural insight to health. Discussion
Paper, Cabinet Office Behavioural Insights Team.
Belot, M., Bhaskar, V. and van de Ven, J. (2012). Beauty and the sources of discrim-
ination. Journal of Human Resources, forthcoming.
Bertrand, M., Karlan, D., Mullainathan, S., Shafir, E. and Zinman, J. (2010).
What’s advertising content worth? evidence from a consumer credit marketing field exper-
iment. Quarterly Journal of Economics, 125 (1), 263–306.
Bos, A., Hoogstraten, J. and Prahl-Andersen, B. (2005). Failed appointments in an
othodontic clinic. American Journal of Orthodontics and Dentofacial Orthopedics, 127 (3),
355–357.
Calzolari, G. and Nardotto, M. (2011). Nudging with information: A randomized field
experiment on reminders and feedback. Working Paper, University of Bologna.
Card, D., DellaVigna, S. and Malmendier, U. (2011). The role of theory in field
experiments. Journal of Economic Perspectives, 25 (3), 39–62.
Darzi, A., Beales, S., Hallsworth, M., King, D., Macdonnell, M. and Vlaev, I.
(2011). The five bad habits of healthcare – how new thinking about behaviour could reduce
health spending. World Economic Forum, Industry Agenda.
25

DellaVigna, S. (2009). Psychology and economics: Evidence from the field. Journal of
Economic Literature, 47, 315–372.
— and Pollet, J. M. (2009). Investor inattention and friday earnings announcements.
Journal of Finance, 64, 709–749.
Frederick, S., Loewenstein, G. and O’Donoghue, T. (2002). Time discounting and
time preferences: A critical review. Journal of Economic Literature, 40 (2), 351–401.
Glied, S. and Neidell, M. (2010). The economic value of teeth. Journal of Human Re-
sources, 45 (2), 468–496.
Groves, R., Dillman, D., Eltinge, J. and Little, R. (2002). Survey Nonresponse. New
York: Wiley.
Karlan, D., McConnell, M., Mullainathan, S. and Zinman, J. (2011). Getting to
the top of mind: How reminders increase saving, Working Paper, Harvard University.
Kast, F., Meier, S. and Pomeranz, D. (2012). Under-savers anonymous: Evidence on
self-help groups and peer pressure as a savings commitment device, IZA Discussion Paper
No. 6311.
Laibson, D. (1997). Golden eggs and hyperbolic discounting. Quarterly Journal of Eco-
nomics, 112 (2), 443–478.
Lang, W. P., Farghaly, M. M. and Ronis, D. L. (1994). The relation of preventive
dental behaviors to periodontal health status. Journal of Clinical Periodontology, 21, 194–
198.
Loewenstein, G., Brennan, T. and Volpp, K. G. (2007). Asymmetric paternalism to
improve health behaviors. Journal of the American Medical Association, 298 (20), 2415–
2417.
Ludwig, J., Kling, J. R. and Mullainathan, S. (2011). Mechanism experiments and
policy evaluations. Journal of Economic Perspectives, 25 (3), 17–38.
Madrian, B. C. and Shea, D. F. (2001). The power of suggestion: Inertia in 401(k)
participation and savings behavior. Quarterly Journal of Economics, 116, 1149–1187.
Mettes, D. (2005). Insufficient evidence to support or refute the need for 6-monthly dental
check-ups. Evidence-Based Dentistry, 6, 62–63.
26
Miguel, E. and Kremer, M. (2004). Worms: Identifying impacts on education and health
in the presence of treatment externalities. Econometrica, 72 (1), 159–217.
Milkman, K., Beshears, J., Choi, J., Laibson, D. and Madrian, B. (2011). Using im-
plementation intentions prompts to enhance influenza vaccination rates. PNAS, 108 (26),
10415–10420.
—, —, —, — and — (2012). Following through on good intentions: The power of planning
prompts, NBER Working Paper No. 17995.
Mocan, N. and Tekin, E. (2010). Ugly criminals. Review of Economics and Statistics,
92 (1), 15–30.
National Institute for Health and Clinical Excellence (2004). Dental recall –
recall interval between routine dental examinations. Clinical Guidelines, CG19.
Rabin, M. (1999). Psychology and economics. Journal of Economic Literature, 36, 11–46.
Reekie, D. and Devlin, H. (1998). Preventing failed appointments in general dental prac-
tice: A comparison of reminder methods. British Dental Journal, 185, 472–474.
Rizzo, M. J. andWhitman, D. G. (2009). Little brother is watching you: New paternalism
on the slippery slopes. Arizona Law Review, 51, 685–739.
Rothman, A. J., Martino, S. C., Bedell, B. T., Detweiler, J. B. and Salovey,
P. (1999). The systematic influence of gain- and loss-framed messages on interest in and
use of different types of health behavior. Personality and Social Psychology Bulletin, 25,
1355–1369.
Thaler, R. and Sunstein, C. (2008). Nudge – Improving Decisions About Health, Wealth,
and Happiness. New Haven, CT: Yale University Press.
Tversky, A. and Kahneman, D. (1981). The framing of decisions and the psychology of
choice. Science, 211 (4481), 1124–1131.
Wisdom, J., Downs, J. S. and Loewenstein, G. (2010). Promoting healthy choices:
Information versus convenience. American Economic Journal: Applied Economics, 2, 164–
178.
27

A. Appendix
Framing Text cover Message text back
Neutral time for dental prevention Please make an appointment for your nextcheck-up.
Positive ...keep your nice smile tomor-row
Investing some time on dental health preven-tion today decreases your risk of a painfuldental disease in the future. In addition,you may avoid considerable costs of involvedtreatments.Please make an appointment for your nextcheck-up.
Negative ...don’t lose your nice smile to-morrow
Not investing some time on a dental healthprevention today increases your risk of apainful dental disease in the future. In ad-dition, you may incur considerable costs ofinvolved treatments.Please make an appointment for your nextcheck-up.
Table A.1: Text of reminder messages.
28

Figure A.1: Covers of reminder postcards. Top row (left to right): Neutral, PosF , and PosM
treatment. Bottom row (left to right): NegM and NegF treatment.
29