nudges and norms: peer networks as a platform for ... · platform for encouraging pro-social...
TRANSCRIPT

Nudges and Norms: Peer Networks as a Platform for Encouraging Pro-Social Investment
in Preventive Health Care Products
Workshop ‘Towards Gender Equity in Development’ UNU-WIDER , Namur
3-4 February 2017
Salma Khalid (University of Michigan Ann Arbor, PhD. Candidate) and
Ghazala Mansuri (Lead Economist, The World Bank)

Motivation• Current empirical literature on peer effects demonstrates that social networks can
influence a diverse set of individual choices– Saving (Duo and Saez, 2002); Investment (Hong, Kubik and Stein, 2004); Technology adoption
(Bandiera and Rasul, 2006; Conley and Udry, 2001)
• In particular, compelling evidence that peer networks can facilitate the take up of a variety of health technologies
– Deworming pills (Miguel and Kremer, 2004), insecticide treated bed nets (Dupas, 2014) and menstrual cups (Oster and Thronton, 2011)
• However, the role attributed to peer networks in this literature is limited to one of information diffusion and learning facilitation
• Evidence from the lab and field on contributions to public goods has shown that social networks can also be powerful catalysts for socially desirable behavior
– by triggering image motivation, leadership, or the desire to seek approval from others
• Yet, the presence or strength of these motivations in influencing decision making over health remains unexplored, despite low take-up of preventive health products
• This paper assesses the impact of using peer groups (in this case village based community organizations) to introduce and encourage the uptake of a critical preventive health care product through a series of framed field experiments

Roadmap of talk
• Motivation and Questions• Description of underlying IE on which the motivation IE was
done• Description of the motivation IE and each FFE • Elicitation of the WTP in each FFE • Elicitation of the social norm around WTP• Results

The Preventive Health Product Used and its Need• Point of Use (POU) water treatment
• Why Water?– High levels of water contamination in sample area despite near universal
access to improved water sources
– Over 2/3rds of all water E-coli contaminated• 68% of water collected from storage devices in homes• 55% of water collected from from community water schemes –at source• 35% of water collected from household water sources (hand pumps and mechanized
pumps)• But rates as high as 50% at source in some areas
• Diarrhea caused by bacterial, viral and parasitic agents most commonly spread through feces-contaminated water. Pakistan has over 50,000 annual child deaths from diarrhea
• The relationship between diarrhea and stunting well established
• In addition to diarrheal causes, scientists are investigating the role of environmental enteropathy (EE) in contributing to linear growth deficit
– EE develops from constant exposure to fecal pathogens and compromises intestinal absorption of nutrients – most dangerous for 0-5 year olds.

Impact of Water Contamination on Diarrhea and Stunting
• Stunting and Diarrhea Rates– Diarrhea 23% (2012 national)– Stunting: 43% (2011, national)
• The midline survey also collected self-reported diarrhea incidence amongst children 0-5 years in past 6 months – At the HH level, over 40% of the households (with 0-5 kids) report an incidence of
diarrhea in the past 6 months – Contamination of drinking water at POU positively predicts diarrhea incidence
Why POU?– Nearly 99% of households stated that they did not treat their water in any way
– Over 96% of households stored their water before use, hence POU treatment necessary
– Water sources are not typically shared and contamination doubles between source and storage point
Why chlorine tablets?– Locally sourced and therefore sustainable; cheap (Rs. 240/month for HH) at market
price; recommended by WHO

• Can affinity based community organizations help build demand for POU water treatment with chlorine?
– Offering chlorine tablets for sale in a CO meeting allows us to leverage social incentives to increase individual adoption
• Which types of motivation triggers are most impactful?
– We test three: Image, Leadership, Subsidy
• Do women respond differently in villages that got the inclusion treatment in the underlying IE?
• Do VO members (leaders of COs) as ‘Natural’ leaders act in a more pro-social manner?
Questions

Underlying IE from 2010-2016 created the community groups
Improve Governance Inclusion mandates for women and
for poor HHs (Poverty Score Card) At least 40% of CO and VO
members need to be women and 50% need to be from poor households
VDP subject the to village wide secret ballot ratification
158 villages in 5 districts across PakistanDeepen Inclusion
At least 50% of HHs organized into Community Organization (COs) The social groups include women
only, men only and mixed gender groups
Cover more than 50% of the village population which ensures greater representativeness and generalizability of our results.
Create a Village Level Organization (VO) based on CO leaders
Provide an open livelihood fund to each village US $30,000 per village plus 20%
community contribution VO creates village development plan
(VDP) to allocate the CIF

Motivation IE Design-July-September 2016 (post endline)
Information campaign (village level treatment) delivered at CO meetings (designed for largely low/no literacy context)Campaign focused on: Village water contamination levels Key health behaviors to keep water safe and prevent contamination/recontamination Use of chlorine for POU water treatment Water tasting and distribution of water storage canister to each HH free of chargeIn the externalities arm, attendees were informed that their actions would affect the health of others as well as their own healthThree behavioral FFEs (within village, CO level randomization) used to encourage POU water treatment

Structure of the Image FFE
Image motivation (Ariely et al., 2009) is the tendency of individual behavior to be affected by the perceptions of others, the impact of which is inherently tied to how visible individual behavior is to their social reference group
Meeting participants are randomly assigned to one of three treatment arms:
• Arm 1: Private Bid• Private bidders are told that their bids will not be revealed to
anyone in their meeting group • Arm 2: Public Bid
• Public bidders are told that the bid they place will be revealed to everyone in the meeting group at the end of the bidding process
• Arm 3: Self-selection into bidding • Participants select their own bidding environment, public or private
• Question: Do individuals have higher demand when their actions are observable to other CO members (Public)? Does self-selection into public bidding increase WTP? Who self-selects?

Structure of the Leadership FFE
Meeting participants are randomly assigned to one of two groups:– Arm 1: Randomized Leader
• One half of the participants in the randomized sample are randomized into first mover position
• Randomized first movers are told that their bids will be collected first and revealed to randomized followers before the latter place their bids
– Arm 2: Self Select Leader • Participants are told that they can self-select into a first mover position • Self-selected first movers place their bids first which are revealed to the
self-selected followers before the latter place their bids
• Natural Leaders: – ‘Natural leaders’ are subject to the same randomization as the meeting
participants and therefore fall into one of the following treatment arms: • Natural Randomized Leader • Natural Self Select Leader
Question: Which types of leaders are more effective (have higher wtp and encourage demand among others? Those who are picked in the intervention to be leaders or those who self-select into leadership positions? Who self-selects?

Structure of the Subsidy FFE
• Arm 1: Randomized Sharing – Each member is anonymously paired with a fellow CO member – Each member is told:– that they can privately choose how much of their subsidy to share
• they are explicitly told that they may share 0, effectively keeping the full subsidy
– that subsidies are only triggered by purchase• If no purchase, their own subsidy and the subsidy shared by them will be lost.• the option of utilizing any subsidy transferred to them by their partner is also lost
• Arm 2: Self Selection Sharing – Players are allowed to choose whether they want an individual or shared subsidy– As before, subsidies are only triggered by purchase
In both arms, players are unaware of how much subsidy they have received from their partners until all decision making is over
Question: Do subsidies work better to encourage demand when they are provided to individuals or when they are shared? Does self selection into sharing improve outcomes? Who-self-selects?

Elicitation of WTP • Offered price varied from Rs. 60-150 • Image and Leadership FFEs: The purchase decision is elicited via a Becker
DeGroot Marschak (BDM) auction:– Participants are asked to state their reservation price for the product –their
bid– Price (P) is determined randomly via lottery – If P<= MWTP, the bidder must purchase the product at P – If P>MWTP, the bidder cannot purchase the product
• The dominant strategy for a bidder is to bid their MWTP• BDM has been tested in a similar population of low numeracy and shown
consistent results (Berry et al., 2015)
• Subsidy FFE: The purchase decision is elicited via a Take It Or Leave It (TIOLI) offer:– Price is determined randomly via lottery – Participants can choose whether or not to purchase at the randomly drawn
price minus any subsidy (The subsidy size was fixed at Rs. 40.

Elicitation of others WTP (tells us the social norm)– Prior to random assignment within each meeting, we elicit beliefs from individual
bidders regarding the average willingness to pay at the meeting level:
How much do you think the average CO member in this meeting will be willing to pay for the chlorine tablets today?
– We can use these individuals beliefs regarding the social norm to construct a variable – DevNorm – that denotes the deviation of an individual’s bid from their belief regarding the social norm (BidNorm).
– This denotes the degree of conformity to the social norm that an individual exercises in their bidding behavior when they are randomized into private or public bidding
– DevNorm thus measures how far bidders are willing to deviate from their perception of the descriptive norm.
– For the Image FE: If individuals demonstrate status seeking influences in public, bids should increase in public. If individuals demonstrate conformity in public, the DevNorm should decrease in public
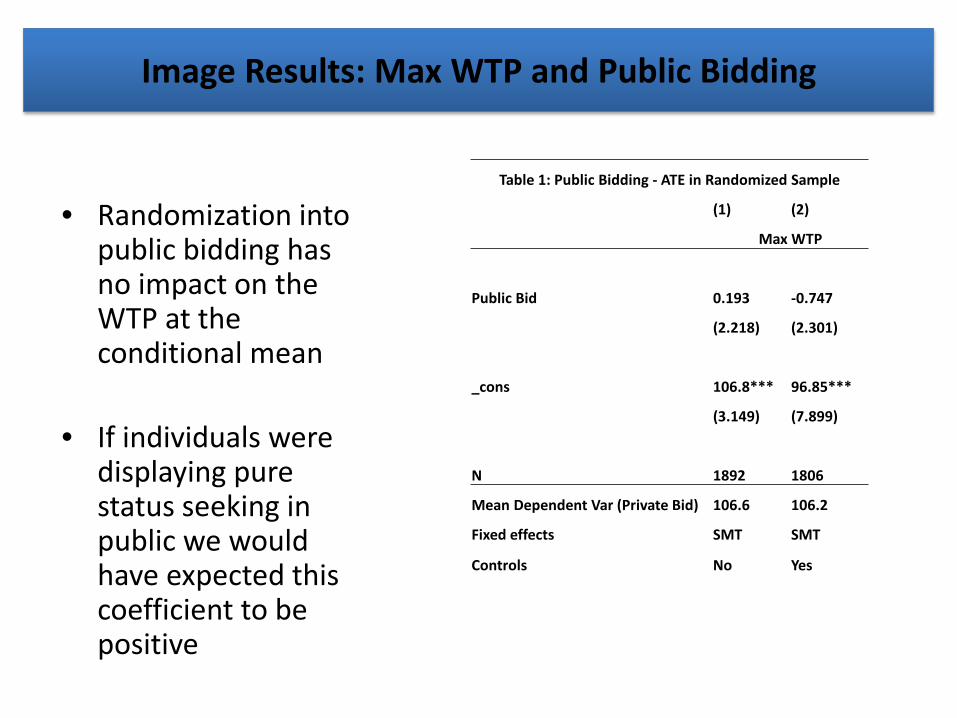
Image Results: Max WTP and Public Bidding
• Randomization into public bidding has no impact on the WTP at the conditional mean
• If individuals were displaying pure status seeking in public we would have expected this coefficient to be positive
Table 1: Public Bidding - ATE in Randomized Sample
(1) (2)
Max WTP
Public Bid 0.193 -0.747
(2.218) (2.301)
_cons 106.8*** 96.85***
(3.149) (7.899)
N 1892 1806
Mean Dependent Var (Private Bid) 106.6 106.2
Fixed effects SMT SMT
Controls No Yes

Image Results: DevNorm and Public Bidding
• Randomization into public bidding shifts the distribution of the DevNorm function, with the distribution more closely centered around zero

Image Results: DevNorm and Public Bidding
Table 4: Simultaneous Quantile Regression of Difference between Own Bid and Average Bid (DevNorm)(1) (2) (3) (4) (5) (6) (7) (8) (9)
DevNorm
Quantile Q10 Q20 Q30 Q40 Q50 Q60 Q70 Q80 Q90
Public bid 0.448 -2.688 -8.444** -8.006** -6.670** -6.024 -1.827 1.690 2.639(7.891) (3.744) (3.770) (3.184) (3.276) (4.245) (4.841) (3.873) (5.924)
_cons -63.79*** -21.98** 12.74 36.36** 39.49*** 52.46*** 60.26*** 78.93*** 97.42***(22.22) (10.93) (17.68) (15.48) (12.26) (9.444) (10.46) (11.35) (11.00)
N 1456 1456 1456 1456 1456 1456 1456 1456 1456MDepVar -82.23 -18.66 5.16 18.34 29.13 42.74 56.02 73.5 101.1
• Randomization into public bidding results in a reduction in the DevNorm in the portion of the distribution where bidders are bidding above their beliefs regarding the average group bid
• Bidders thus narrow the difference between their own bids and their beliefs regarding the average group bid —resulting in increased conformity in public bidding

Image Results: Conformity and Public Bidding
• Randomization into public bidding also results in a significantly higher probability of placing bids that are equivalent to the individual’s beliefs regarding the average group bid
• Hence, in public, individuals are more likely to follow the crowd (or their belief regarding the crowd)
Table 5: Probability of Bidding Higher than BidNorm
(1) (2) (3)Pr (MWTP > BidNorm) Pr (MWTP = BidNorm) Pr (MWTP < BidNorm)
Public Bid -0.058*** 0.032** 0.0265(0.0251) (0.0168) (0.0209)
_cons 0.540*** 0.100*** 0.359***(0.577) (0.397) (0.0517)
N 1456 1456 1456Mean Dep Var (Private Bid) 0.648 0.104 0.248

Image Results: Externalities and Max WTP
• The negative impact of conformity is drawn from villages where externalities priming is not done
• When externalities priming is done, bidders randomized into public bidding increase their bids and the disparity between their bids and their beliefs regarding the average bid – consistent with status seeking
Table 6: Externalities and Conformity (1) (2) (3) (4) (5) (6) (7) (8) (9)
DevNorm
Quantile Q10 Q20 Q30 Q40 Q50 Q60 Q70 Q80 Q90Public Bid -7.574 -7.413 -8.264 -9.962*** -10.69** -9.839* -4.855 -2.846 6.900
(7.198) (7.958) (5.189) (3.291) (4.590) (5.265) (5.537) (7.635) (8.786)
Externality -9.585 -5.310 -1.451 -3.117 -8.686** -5.346 2.730 2.678 10.29(9.951) (6.768) (5.644) (4.017) (4.009) (4.988) (4.534) (4.973) (8.172)
Public*Externality 17.30 10.35 5.283 5.912 10.69* 12.01 5.938 3.750 -11.57(10.75) (10.10) (7.581) (5.015) (5.940) (7.619) (8.264) (8.717) (10.25)
N 1456MeanDepVar (Pvt) -43.07 -15.7 3.86 18.81 30.82 44.39 57.92 76.16 99.03Ftest Pub = Pub*Ext 0.3267 0.2636 0.1933 0.064 0.0092 0.059 0.3272 0.6458 0.3179

Image Results: Conformity and Women
Table 7: Gender and Conformity (1) (2) (3) (4) (5) (6) (7) (8) (9)
DevNorm
Quantile Q10 Q20 Q30 Q40 Q50 Q60 Q70 Q80 Q90Public Bid 1.909 -1.758 -7.706 -2.815 0.695 0.566 0.362 -6.504 -5.540
(10.24) (7.352) (7.101) (5.011) (5.527) (4.261) (4.989) (5.322) (5.434)
Female 13.54 4.477 6.440 10.83** 9.461** 8.989 3.051 -6.547 -10.82**(14.48) (6.268) (5.669) (4.255) (4.703) (5.729) (4.580) (6.891) (5.410)
Public*Female -4.505 -1.091 -1.090 -8.175 -10.55 -10.57 -4.238 10.99 11.21(14.90) (8.185) (7.054) (6.657) (7.226) (8.704) (8.012) (8.701) (9.745)
N 1456MeanDepVar (Pvt) -57.29 -21.76 1.38 9.95 20.06 34.15 52.99 80.86 111.42
Ftest Fem=Pub*Fem 0.512 0.699 0.508 0.068 0.077 0.153 0.521 0.231 0.111
• Overall, the trend towards conformity appears to be stronger among women • Hence, while women bid higher than men across much of the bidding distribution, they
are also more likely to lower their bids in public in line with the conformity effects found in the full sample

Image Results: Conformity and Women
• This is clearer in the tendency of women to lower their bids in Public, when they are bidding in excess of their beliefs regarding the average willingness to bid
• In tandem, there is a rise in the probability of placing bids equivalent to their beliefs regarding the average bid in the group
• This pattern is not replicated for men
Table 7_2 (1) (2) (3) (4)Pr (MWTP>BidNorm) Pr (MWTP=BidNorm)
Females Males Female Males Public -0.0936*** -0.0218 0.0488** 0.0145
(0.0352) (0.0357) (0.0237) (0.0241)
_cons 0.616*** 0.500*** 0.0577 0.131**(0.0755) (0.0794) (0.0480) (0.0558)
N 745 711 745 711

Image Results: Conformity and Women in Mixed Meetings
• This effect seems stronger and more stable among women in mixed groups.• While men in mixed meetings appear to not show any evidence of conformity, for
women in mixed groups, the disparity between their bids and their beliefs regarding the group average bid decreases when randomized into public bidding
Table 8: Gender and Conformity Mixed Meetings(1) (2) (3) (4) (5) (6) (7) (8) (9)
DevNorm
Quantile Q10 Q20 Q30 Q40 Q50 Q60 Q70 Q80 Q90Public Bid -17.13* -4.038 -8.02e-14 -1.40e-13 0.936 5.160 4.298 -1.585 -3.157
(9.984) (6.854) (7.014) (4.660) (5.408) (5.837) (7.775) (8.796) (9.925)
Female -11.95 -8.545 1.22e-13 10.00*** 6.160 9.172 0.0900 -6.172 -20.57(12.78) (6.942) (7.921) (3.821) (4.749) (7.436) (7.481) (8.223) (14.42)
Public*Female 20.04 -1.025 -10.000 -10.000* -10.78 -15.06 -7.513 5.862 11.78(17.15) (10.65) (11.32) (5.466) (8.179) (9.992) (9.349) (10.31) (13.71)
N 968MeanDepVar (Pvt) -27.53 -12.51 4.67 8.89 22.63 31.12 52.76 81.09 119.28Ftest Fem=Public*Fem 0.261 0.611 0.557 0.009 0.1545 0.123 0.6182 0.428 0.222

Image Results: Conformity in Inclusion Villages
Table 9: Inclusion and Conformity(1) (2) (3) (4) (5) (6) (7) (8) (9)
DevNorm
Quantile Q10 Q20 Q30 Q40 Q50 Q60 Q70 Q80 Q90Public Bid 4.312 5.594 -5.805 -4.814 -5.246 2.419 5.421 7.542 12.49
(14.62) (8.229) (6.859) (4.591) (4.110) (5.279) (7.200) (7.640) (8.233)
Inclusion 23.21 14.22** 7.314 6.364 3.424 14.99*** 14.36*** 12.54 10.93(14.39) (5.758) (6.348) (4.185) (5.319) (5.316) (4.909) (7.923) (8.360)
Public*Inclusion -14.57 -13.92 -2.764 -4.647 -3.907 -17.77*** -13.79 -12.31 -13.77(17.99) (10.42) (8.999) (5.372) (5.393) (6.621) (8.425) (10.95) (9.748)
N 1456MeanDepVar (Pvt) -63.53 -30.23 -0.811 12.93 26.35 30.25 43.65 64.49 89.88
Bids are significantly higher in Inclusion village and the tendency to reduce bids in public is confined to those far away from the norm.

Image Results: Conformity and Women
• Inclusion villages also demonstrate a tendency to reduce bids in public
• However this trend does not coincide with an increase in bids at the norm, since we can see from the earlier specification that it is occurring among bidders who are further away from the norm and hence their reversion does not bring them to the norm but merely closer to it
Table 10_2 (1) (2) (3) (4)Prob(MWTP>BidNorm) Prob(MWTP=BidNorm)Inclusion Non Inclusion Inclusion Non Inclusion
Public -0.0729** -0.0462 0.0285 0.0371(0.0346) (0.0364) (0.0238) (0.0242)
_cons 0.618*** 0.483*** 0.0572 0.152***(0.0821) (0.0805) (0.0581) (0.0529)
N 760 696 760 696

Image Results-SummaryImage (peer actions)
– People generally tend to conform to how they think others will behave when their actions are public.
• For a person whose individual optimum lies below their expectation of the group average, conformity and status seeking coincide to drive their demand up towards the group average.
• For a person whose individual optimum lies above the group average, conformity pressures will lower their willingness to pay while status seeking will operate to increase it.
– Both men and women generally believe that others have low demand-this poses a challenge for the adoption of chlorine
– Women generally bid higher but show greater conformity than men
BUT– Externality priming dampens this effect– Both men and women in inclusion villages have higher bids overall
• Community groups are essential for:– Improving beliefs regarding the behavior of others by allowing individuals to see
each other’s behavior and establish correct beliefs–
– Self-selection of public bidders yields highest bidding in public and therefore most positive beliefs regarding value of the product

Leadership Summary Statistics
Table 2 Randomized Sample Self Selection Sample
Leader Follower Leader Follower
Mean bid (Max WTP) 110.7 107.06 111.15 106.69
Median bid (Max WTP) 100 100 100 100
Natural Leader Mean bid 119.23 110.98 134.93 109.25
Natural Leader Median bid 120 100 140 100
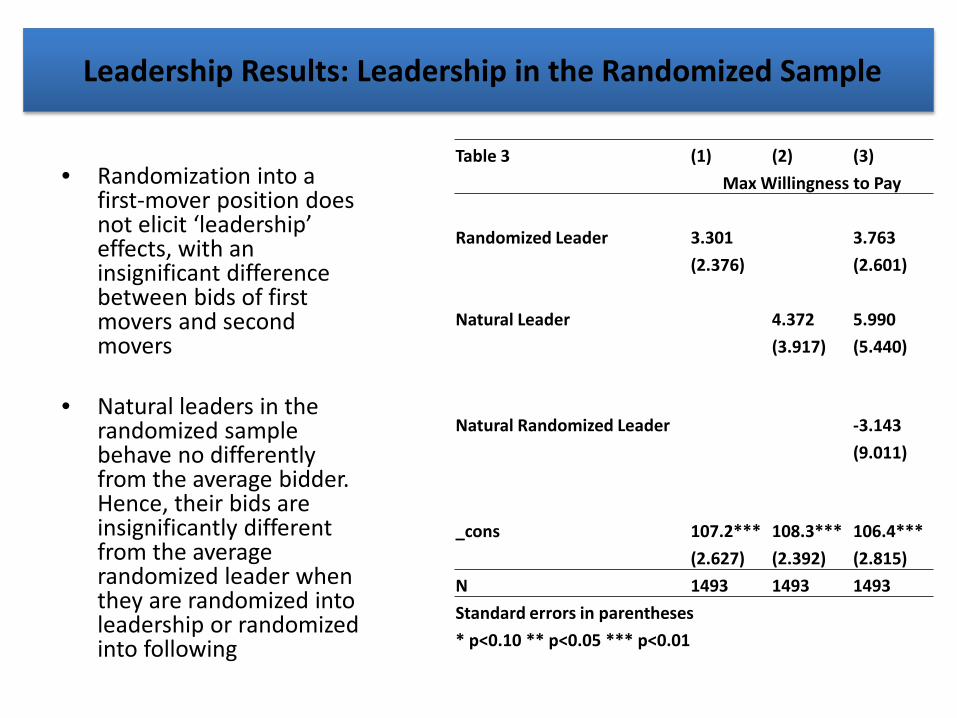
Leadership Results: Leadership in the Randomized Sample
• Randomization into a first-mover position does not elicit ‘leadership’ effects, with an insignificant difference between bids of first movers and second movers
• Natural leaders in the randomized sample behave no differently from the average bidder. Hence, their bids are insignificantly different from the average randomized leader when they are randomized into leadership or randomized into following
Table 3 (1) (2) (3)Max Willingness to Pay
Randomized Leader 3.301 3.763(2.376) (2.601)
Natural Leader 4.372 5.990(3.917) (5.440)
Natural Randomized Leader -3.143(9.011)
_cons 107.2*** 108.3*** 106.4***(2.627) (2.392) (2.815)
N 1493 1493 1493Standard errors in parentheses* p<0.10 ** p<0.05 *** p<0.01

Leadership Results: Leadership in the Self Selection Sample
• The average bidder that self-selects into a first-mover position demonstrates no significant leadership effects, and has an insignificantly different bid from the average second-mover
• Natural leaders in the self-selection arm have a significantly higher bid relative to the average bidder
• This effect is driven mainly by natural leaders who self-select into a first-mover position and bid significantly higher than the average bidder
Table 4 (1) (2) (3)Max Willingness to Pay
Self Select Leader (S) 2.483 0.458(2.874) (2.989)
Natural Leader (N) 11.80*** 4.352(4.194) (5.683)
Natural Self Select Leader (NS) 15.49*(8.657)
_cons 107.5*** 107.2*** 107.0***(2.384) (2.069) (2.448)
N 1413 1413 1413P value on F test of (S+N+NS) 0.0024

Leadership Results: Leadership and Women
• Parsing the effect of first movers in the self-selection sample, where leadership effects were discovered, we find that this effect is driven by female natural leaders
• Hence, women natural leaders who self-selected into first mover positions are likely to demonstrate a large leadership effect relative to women natural leaders who did not self select into leadership (first mover) and average female bidders
• Male natural leaders on the other hand have an insignificant difference in bids when they are first movers relative to average male bidders and natural male leaders who are second movers
Table 7 (1) (2)Max Willingness to
Pay Females Males
Self Select Leader (S) -2.151 2.832(3.580) (5.087)
Natural Leader (N) -4.053 8.663(7.796) (8.838)
Natural Self Select Leader (NS) 28.14** 7.994(12.01) (12.53)
_cons 104.4*** 110.9***(3.201) (3.746)
N 792 621Coefficient (S+N+NS) 21.936 19.489P value on F test (S+N+NS) 0.017 0.0598

Leadership Results: Randomized Leadership and Inclusion
• In inclusion villages, natural leaders who are randomized into first mover positions are also more likely to bid higher relative to second movers and natural leaders who are not randomized into first movers
• In contrast, natural leaders in non inclusion villages who are not first movers bid (insignificantly) higher but there is no first mover effect among natural randomized leaders
Table 9 (1) (2)
Max Willingness to Pay
Inclusion Non Inclusion
Randomized Leader (R ) 0.855 4.304
(3.637) (3.598)
Natural Leader (N) -2.507 12.52
(7.876) (8.769)
Natural Randomized Leader (RN) 19.53* -9.593
(10.98) (12.95)
_cons 108.9*** 104.6***
(4.470) (4.820)
N 788 705

Leadership Results: Self Selection Leadership and Inclusion
• Significantly, the result of natural self select leaders displaying first mover leadership effects is also primarily driven by inclusion villages
• In contrast, natural leaders in non inclusion villages who self select into leadership, while having significantly higher bids than second movers overall, have a smaller overall leadership effect as evidenced by the joint coefficient (S+N+NS), which is also weakly significant and estimated with lower precision
Table 10 (1) (2)
Inclusion Non Inclusion
Max Willingness to Pay
Self Select Leader (S) -1.794 2.076(4.421) (4.778)
Natural Leader (N) 8.391 -3.332(7.562) (10.29)
Natural Self Select Leader (NS) 23.70** 20.50(11.11) (15.67)
_cons 108.7*** 105.1***(4.217) (4.864)
N 734 679Coefficient (S+N+NS) 30.297 19.244P value on F test of (S+N+NS) 0.000 0.0942

Leadership Results: Externalities and Randomized Sample
• Externalities messaging increases the overall level of bids (mean dependent variable)
• Externalities messaging also triggers a leadership effect amongst first movers, with randomized leaders bidding significantly higher than followers
• This increase in bids is similarly reflected in natural leaders who are randomized into leadership
• In the absence of externalities messaging, only natural leaders appear to bid more when randomized into first mover position but this effect is imprecisely estimated
Table 5 (1) (2)Max Willingness to Pay
Externalities No Externalities
Randomized Leader (R ) 8.893** -3.214(3.668) (3.414)
Natural Leader (N) 11.29 0.536(9.323) (7.363)
Natural Randomized Leader (NR) -6.826 10.82(13.12) (12.35)
_cons 108.6*** 104.1***(4.037) (4.926)
N 793 700Mean Dep Var 113.9 103.3Coefficient (R+N+NR) 13.36 8.142P value on F test of (R+N+NR) 0.0875 0.3795P value on F test of (N+NR) 0.5718 0.2481

Leadership Results: Externalities and Self Selection Sample
• Externalities similarly raise the overall level of bids in the self-selection sample (mean dependent variable)
• However, the first mover effect in the self-selection sample with externalities is dampened, possibly due to the overall increase in bid levels, and natural leaders who self-select into first mover positions are no different in their bids relative to second movers overall (F test on S+N+NS)
• On the other hand, the first mover effect in no externality villages is extremely large and highly significant
Table 6 (1) (2)Max Willingness to Pay
Externalities No Externalities
Self Select Leader (S) -3.464 6.557(4.332) (4.474)
Natural Leader (N) -6.862 16.14*(7.736) (9.027)
Natural Self Select Leader (NS) 21.97* 20.15*(12.86) (11.93)
_cons 115.8*** 95.80***(4.169) (3.826)
N 759 654Mean Dep Var 114.9 101.1Coefficient (S+N+NS) 11.644 42.847P value on F test of (S+N+NS) 0.1972 0.000

Leadership Results– When self-selection into leadership is allowed, VSO members
who choose to self-select bid significantly more than the rest of the sample
– This effect is driven largely by women natural leaders who self-selected into first mover positions
– In inclusion villages, the bids of both men and women leaders, whether assigned to leadership or self selecting into leadership are significantly higher.
– Externalities messaging increases the overall level of bids– Externalities messaging also triggers a leadership effect
amongst first movers, particularly among leaders randomized into leadership.
– Interestingly, when leaders can self-select into leadership, natural leaders bid higher regardless of externality messaging.

Understanding of Subsidy Mechanism
• Using survey questions involving hypothetical price draws, we assess level of understanding of the subsidy mechanism prior to the actual bidding round
Table 1 (1) (2) (3) (4) (5)Correct Response to Subsidy Questions
Self Selection Subsidy -0.0191(0.0140)
Inclusion Village -0.0319(0.0310)
Externalities Treatment -0.0362(0.0303)
Female 0.00361(0.0291)
Poverty Score 0.000845(0.000770)
_cons 0.814*** 0.824*** 0.824*** 0.806*** 0.781***(0.0161) (0.0168) (0.0205) (0.0229) (0.0262)
N 2751 2751 2751 2751 2576Standard errors in parentheses* p<0.10 ** p<0.05 *** p<0.01

Summary Statistics
Table 2 Randomized Sharing Self Selection Sharing
Total Male Female Total Male Female
Sharing Positive Subsidy Amount 73.31 72.62 73.89 47.11 47.41 46.87
Mean Subsidy Shared (conditional) 16.06 16.51 15.7 16.54 16.48 16.59
Median Subsidy Shared (conditional) 20 20 20 20 20 20
Mean Max Willingness to Pay (Self Report) 77.52 84.2 71.99 78.5 85.44 72.82
Accept TIOLI offer 82.06 84.35 80.16 80.67 85.19 76.97

Subsidy Results: Self Selection Reduces Sharing
• The ability to select out of a sharing environment lowers the probability of sharing, among both men and women
• This result is consistent with results found in lab experiments using dictator games (Lazear, Malmendier and Weber, 2012), but ours is the first framed field experiment to show this result
Table 3 (1) (2)Probability of Sharing
Self Selection Subsidy -0.263***(0.0270)
Self Selection Subsidy -0.257***(0.0384)
Female -0.0327(0.0430)
Self Selection Subsidy * Female -0.0113(0.0502)
_cons 0.733*** 0.751***(0.0240) (0.0325)
N 1790 1790

Subsidy Results: Externalities and Sharing
• The overall effect of externalities messaging is insignificant, but this masks important differences by gender
• Externalities messaging improves the propensity to share among men who are randomized into shared subsidies. However, this effect does not persist among the sub sample that is allowed to opt out of sharing environments
• Among women externalities reduce the propensity to share when women are randomized into sharing, with this effect dampening among women who self-select into sharing. The overall effect of self-selection remains negative
Table 4 (1) (2)Probability of Sharing
Self Selection Subsidy (SS) -0.261*** -0.206***(0.0358) (0.0562)
Externalities (E) -0.0163 0.112*(0.0475) (0.0641)
Self Selection*Externalities (SSE) -0.00579 -0.0984(0.0535) (0.0758)
Female (F) 0.0787(0.0530)
Self Selection Subsidy*Female (SSF) -0.0907(0.0684)
Externalities*Female (EF) -0.244***(0.0872)
Self Selection*Externalities*Female (SSEF) 0.165(0.101)
_cons 0.740*** 0.693***(0.0313) (0.0458)
N 1790 1790

Check on women beliefs
One potential channel that explains the negative response to externalities messaging among women is expectations regarding average willingness to payWomen have a much lower overall expectation regarding the average willingness to pay for the product among their fellow CO members

Subsidy Results: Inclusion and Sharing
• Among women, non-inclusion villages appear to drive the trend towards lower sharing when randomized into sharing and exposed to externalities treatment. This effect is nullified in inclusion villages, where externalities treatment does not reduce sharing.
• Men are similarly inclined to share more in inclusion villages when randomized into sharing and exposed to externalities treatment
• Self Selection still drives people out of sharing but this appears to be dampened in inclusion villages that are given externalities treatment
Table 6 (1) (2)Prob of Sharing
Females MalesSelf Selection Subsidy (SS) -0.294*** -0.183**
(0.0644) (0.0712)Externalities (E) -0.199** 0.0777
(0.0977) (0.0898)Self Selection*Externalities (SSE) -0.00595 -0.137
(0.117) (0.0980)Inclusion Village (I) 0.0412 0.0205
(0.0731) (0.0943)Self Selection*Inclusion Village (SSI) -0.00310 -0.0519
(0.0872) (0.113)Externalities*Inclusion Village (EI) 0.101 0.0877
(0.127) (0.126)Self Selection*Externalities*Inclusion (SSEI) 0.118 0.0985
(0.149) (0.156)_cons 0.770*** 0.661***
(0.0577) (0.0665)
N 987 803Externalities in Inclusion Village (E+I+EI) -0.0568 0.1859P Value on F Test of (E+I+EI) 0.5316 0.0248

Subsidy Results: CO type
While all female CO have lower expectations overall, the difference in expectations by externalities treatment is greater in Mixed CO women
Net coef of all female w/out ext = -13.62Net coef of all female w/ ext= -12.534Net coef of mixed w/out ext= 9.009Net coef of mixed w/ext= -15.595
(1) (2) (3)Expected WTP
Female -7.510**(3.151)
All Female CO -6.443 -13.62**(4.290) (5.744)
Externalities All Female CO -2.724 -5.187(4.478) (5.413)
All Female CO* Externalities -3.529 6.273(6.521) (8.407)
Mixed CO -6.771(5.384)
Female*Mixed CO 15.78*(8.185)
Externalities * Mixed CO 9.350(8.913)
Female * Externalities * Mixed CO -21.42*(12.40)
_cons 84.17*** 85.56*** 87.37***(2.365) (3.313) (4.217)
N 1436 1436 1436

Subsidy Results:
(1) (2) (3) (4)Prob of Sharing
Females Females in Inclusion Males Males in Inclusion Externalities (Single Gender CO) -0.259*** -0.249** 0.116 0.294***
(0.0959) (0.120) (0.0724) (0.0999)Self Selection (Single Gender CO) -0.301*** -0.314*** -0.237*** -0.197*
(0.0728) (0.0866) (0.0686) (0.105)Externalities *SelfSelection (Single Gender CO) 0.104 0.217 -0.124 -0.150
(0.119) (0.149) (0.0860) (0.144)Mixed CO -0.0503 -0.0664 -0.0352 0.161
(0.0637) (0.0918) (0.0983) (0.144)Externalities *Mixed CO 0.221* 0.292* -0.0503 -0.417**
(0.123) (0.156) (0.150) (0.202)Self Selection *Mixed CO 0.00332 0.0262 0.104 -0.137
(0.0900) (0.113) (0.117) (0.174)Externalities* Self Selection *Mixed CO -0.0675 -0.182 0.169 0.464**
(0.149) (0.183) (0.145) (0.231)
_cons 0.823*** 0.829*** 0.680*** 0.621***(0.0433) (0.0458) (0.0531) (0.0694)
N 987 574 803 334
Well they do have poor beliefs overall, they are just not activated by externalities

Subsidy Results• Belonging to an inclusion village increases the probability of individuals choosing
to share their subsidies.
• Inclusion villages are also more likely to share non-zero amounts when randomized into sharing (therefore the overall amount shared is higher)
• People who share positive amounts of the subsidy are more likely to purchase the product than people with individual subsidies, even though the size of their subsidy is smaller because of sharing.
• When people are allowed to self-select into sharing, 50% of the sample self-selects into sharing, everyone shares a positive amount and people are more likely to actually purchase the product.
– This effect is driven by women, and is stronger in inclusion relative to non-inclusion villages
APPENDIX

Impact of Inclusion-Endline Community Organization (Affinity Group) members are more likely to be
women and to be poor, leading to a higher number of female only COs and higher overall levels of participation.
A higher proportion of households are organized – 63% in Inclusion villages vs. 57% in Non Inclusion villages.
Village Body (VSO) members more likely to be female (53% versus 30%) and poor (54% versus 44%).
Politically connected and traditionally influential individuals MUCH less likely to be presidents in inclusion villages (almost 5 fold difference 4% versus 19%).
Inclusion villages also have more women in leadership positions in VSOs, (23% versus 13%) and more poor men (28% versus 9%).

Impact of Inclusion-Endline 2013 national elections Female Voter Turnout was much higher in Inclusion Villages
57% in inclusion villages vs. 43% in control villages for females (sig at 1%) 70% in inclusion villages vs. 66% in control villages for males (not sig)
2016 local government elections
Higher political competition in Treatment villages (2 candidates versus .5 candidates, on average)
Candidates from Treatment villages more likely to come from households that have participated in community development activities in their village in the past.
Less likely to be from households where a member has been part of the civil bureaucracy or held past political office