nuclear magnetic resonance...
TRANSCRIPT

August 20171 NMR Spectroscopy
Nuclear Magnetic Resonance SpectroscopyStructural Elucidation
Nuclear magnetic resonance spectroscopy is the name given to the technique which exploits the magnetic properties of nuclei and measures their radio frequency absorptions. Two very important techniques are proton NMR and carbon-13 NMR, although some other nuclei can be measured as well. The impact of NMR Spectroscopy on the natural sciences is substantial. It can be used to study mixtures of analyte; to understand dynamic effects such as change in temperature and reaction mechanisms; it can be used in the solution and solid state; and critically it is an invaluable tool in understanding protein and nucleic acid structure and their function.
August 20172 NMR Spectroscopy
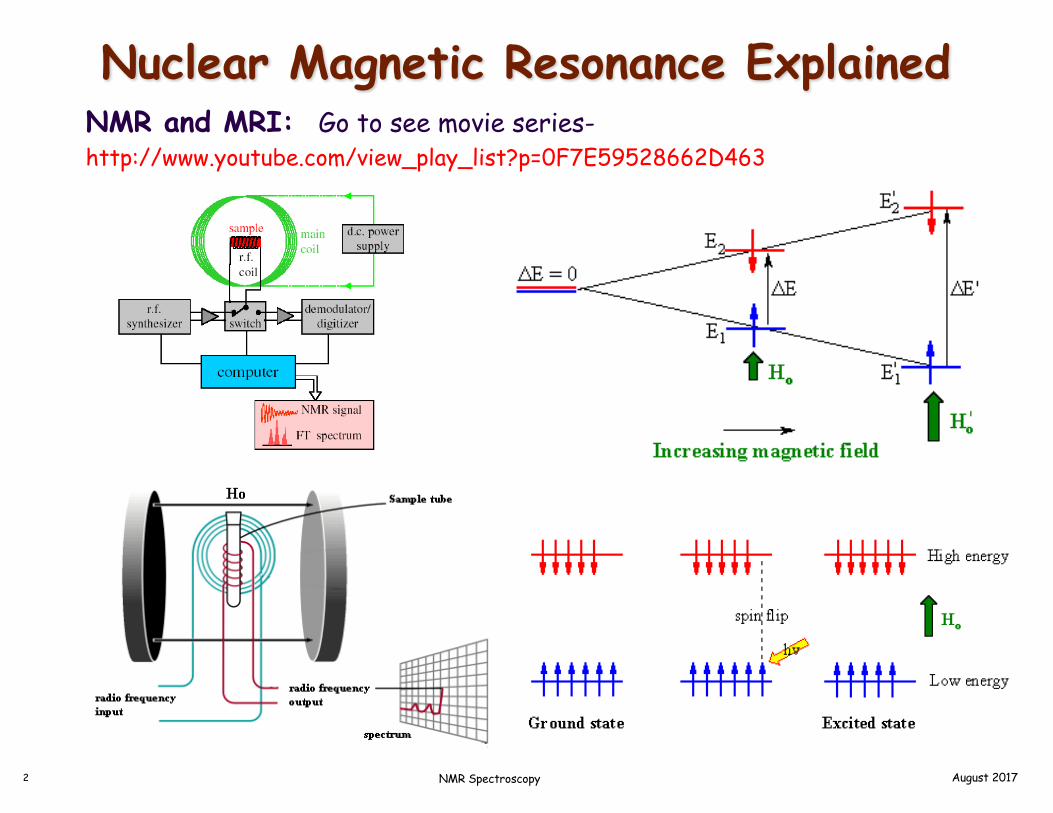
Nuclear Magnetic Resonance ExplainedNMR and MRI: Go to see movie series-http://www.youtube.com/view_play_list?p=0F7E59528662D463

August 20173 NMR Spectroscopy
NMR an OverviewNMR Spectroscopy• NMR only works for nuclei that have the quantum mechanical property of SPIN.
• Spin exists for nuclei with odd atomic mass.
• The spin properties of nuclei give rise to a parameter called the chemical shift.
• Coupling constants and relaxation times for a chemical give connectivity information between atoms.
• NMR can be used to follow chemical dynamics and chemical reactions.
• NMR samples can be solid, liquid, or gas, as well as mixture of chemicals
• Sample quantities in the range of micro- to milligram can be analyzed by NMR spectroscopy.
Proton 1H NMR Spectroscopy• 1H NMR yield hydrogen type in organic compounds. i.e., -CH, -CH2, -CH3.
• 1H NMR spectrum yield environment of the hydrogen atoms via the chemical shift.
• 1H NMR spectrum yield relative number of hydrogen atoms area of the signals
• 1H NMR spectrum yield number of neighboring hydrogens via the splitting pattern of the signals.
Carbon-13 13C NMR Spectroscopy• 13C NMR spectrum yield type of carbon in molecule. ie., Alkyl, aromatic, carbonyl
• 13C NMR spectrum provide the electronic environment around each type of carbon.
• 13C NMR chemical shifts tells the number of neighbor around a carbon nuclei

August 20174 NMR Spectroscopy
Basic Theory of NMR
• An electron may be in a position of spin up or spin down.
• Subatomic particles (electrons, protons and neutrons)
can spin on their axes.
• Some nuclei, such as 12C, possess spins that are paired
against each other, which results in the nucleus of the
atom having no overall spin.
• Other nuclei such as those found in 1H and 13C
possess an overall spin.

August 20175 NMR Spectroscopy
NMR active Nuclei and spin stateThe rules for determining the net spin of a nucleus-
1. If the neutrons and protons are both even, then the nucleus has NO spin.
2. If the neutrons plus protons is odd, then it has a half-integer spin (i.e. 1/2, 3/2, 5/2)
3. If the neutrons and protons are both odd, then it has an integer spin (i.e. 1, 2, 3)
NMRActiveNuclei

August 20176 NMR Spectroscopy
The NMR TransitionThe overall spin, I, is important. Quantum mechanics tells us that a nucleus of spin I
will have 2I + 1 possible orientations. A nucleus with spin 1/2 will have 2 possible
orientations. A nucleus with spin 3/2 has 4 orientation. In the absence of an external
magnetic field, these orientations are of equal energy. If a magnetic field is applied,
then the energy levels split. Each level is given a magnetic quantum number, ms.
No Magnetic Field Presence of Magnetic Field

August 20177 NMR Spectroscopy
The NMR TransitionIf a magnetic field is applied, then the energy levels split to a higher spin state and a lower spin state. The difference in population determines the strength of the signal.
When the nucleus is in a magnetic field, the initial populations of the energy levels are determined by thermodynamics, as described by the Boltzmann distribution. This is very important, and it means that the lower energy level will contain slightly more nuclei than the higher level. It is possible to excite these nuclei into the higher level with electromagnetic radiation. The frequency of radiation needed is determined by the difference in energy between the energy levels.

August 20178 NMR Spectroscopy
Energy of TransitionThe nucleus has a positive charge and spins. This generates a small magnetic field. The nucleus therefore possesses a magnetic moment, µ , which is proportional to its spin, I.
µ = g I h / 2 p (magnetic moment)
The constant, g, is called the gyromagnetic (magnetogyric) ratio and is a fundamental nuclear constant which has a different value for every nucleus. h is Planck’s constant. This, g, is defined as the ratio of its magnetic dipole moment and its angular momentum. The energy of a particular energy level is given by;
E = -(g h / 2 p ) µ B (Energy of spin states)
Where B is the strength of the magnetic field at the nucleus.

August 20179 NMR Spectroscopy
Energy of TransitionThe difference in energy between levels (the transition energy) can be found from
DE = -(g h B / 2 p ) (Energy of transition)
Recall that µ = g I h / 2 p rearranging for µ / I yields the equation D E = - µ B / I
This means that if the magnetic field, B, is increased, so is DE. It also means that if a nucleus has a relatively large gyromagnetic ratio, then D E is correspondingly large.
If you had trouble understanding this section, see the movie recommended at the end of this section. Also look up absorption of radiation by a nucleus in a magnetic field and review the concepts presented.

August 201710 NMR Spectroscopy
Spin Flip in a Magnetic FieldWhat happens to a charged particle in a magnetic field?In a magnetic field, a nucleus (of spin 1/2) will have a tendency to occupy a lower energy level (i.e. its magnetic moment does not oppose the applied field). The nucleus is spinning on its axis. In the presence of a magnetic field, this axis of rotation will precess around the magnetic field;
The frequency of precession is termed the Larmor frequency, which is identical to the transition frequency.
The potential energy of the precessing nucleus is given by: E = - µ B cos qwhere q is the angle between the direction of the applied field and the axis of nuclear rotation.

August 201711 NMR Spectroscopy
Spin Flip in a Magnetic FieldWhat happens to a charged particle in a magnetic field?If energy is absorbed by the nucleus, then the angle of precession, q, will change. For a nucleus of spin 1/2, absorption of radiation "flips" the magnetic moment so that it opposes the applied field (the higher energy state).
It is important to realize that only a small proportion of "target" nuclei are in the lower energy state (and can absorb radiation). There is the possibility that by exciting these nuclei, the populations of the higher and lower energy levels will become equal. If this occurs, then there will be no further absorption of radiation. The spin system is saturated. The possibility of saturation means that we must be aware of the relaxation processes which return nuclei to the lower energy state.

August 201712 NMR Spectroscopy
Upon ExcitationThe energy difference between nuclear spin states is small compared with the average kinetic energy of room temperature samples, and the +1/2 and -1/2 states are nearly equally populated. Indeed, in a field of 2.34 T (100MHz Proton) the excess population of the lower energy state is only six nuclei per million. Although this is a very small difference , when we consider the number of atoms in a practical sample (remember the size of Avogadro's number), the numerical excess in the lower energy state is sufficient for selective and sensitive spectroscopic measurements.
The diagram illustrates the macroscopic magnetization of a sample containing large numbers of spin 1/2 nuclei at equilibrium in a strong external magnetic field (Bo). A slight excess of +1/2 spin states precess randomly in alignment with the external field and a smaller population of -1/2 spin states precess randomly in an opposite alignment. An overall net magnetization therefore lies along the z-axis.

August 201713 NMR Spectroscopy
Upon ExcitationThe diagram and animation on the right show the changes in net macroscopic magnetization that occur as energy is introduced by rf irradiation at right angles to the external field. It is convenient to show the rf transmitter on the x-axis and the receiver-detector coil on the y-axis.
First, the net magnetization shifts away from the z-axis and toward the y-axis. This occurs because some of the +1/2 nuclei are excited to the -1/2 state, and the precession about the z-axis becomes coherent (non-random), generating a significant y component to the net magnetization (M). After irradiation the nuclear spins return to equilibrium in a process called relaxation. As the xy coherence disappears and the population of the +1/2 state increases, energy is released and detected by the receiver. The net magnetization spirals back, and eventually the equilibrium state is reestablished.

August 201714 NMR Spectroscopy
Relaxation PathwaysFor NMR spectroscopy to be practical, an efficient mechanism for nuclei in the higher energy -1/2 spin state to return to the lower energy +1/2 state must exist. In other words, the spin population imbalance existing at equilibrium must be restored if spectroscopic observations are to continue. Now an isolated spinning nucleus will not spontaneouly change its spin state in the absence of external perturbation. Indeed, hydrogen gas (H2) exists as two stable spin isomers: ortho (parallel proton spins) and para (antiparallel spins). NMR spectroscopy is normally carried out in a liquid phase (solution or neat) so that there is close contact of sample molecules with a rapidly shifting crowd of other molecules (Brownian motion). This thermal motion of atoms and molecules generates local fluctuating electromagnetic fields, having components that match the Larmor frequency of the nucleus being studied. These local fields stimulate emission/absorption events that establish spin equilibrium, the excess spin energy being detected as it is released. This relaxation mechanism is called Spin-Lattice Relaxation (or Longitudinal Relaxation). The efficiency of spin-lattice relaxation depends on factors that influence molecular movement in the lattice, such as viscosity and temperature. The relaxation process is kinetically first order, and the reciprocal of the rate constant is a characteristic variable designated T1, the spin-lattice relaxation time. In non-viscous liquids at room temperature T1 ranges from 0.1 to 20 sec. A larger T1 indicates a slower or more inefficient spin relaxation.
Another relaxation mechanism called spin-spin relaxation (or transverse relaxation) is characterized by a relaxation time T2. This process, which is actually a spin exchange, will not be discussed here.

August 201715 NMR Spectroscopy
Pulse and ListenIn a given strong external magnetic field, each structurally distinct set of hydrogens in a molecule has a characteristic resonance frequency, just as different size chimes have different characteristic frequencies. The drawing below depicts a set of four chimes, with the frequency of each designated by a colored sine wave. To reveal the frequency of a chime it is strike with a mallet and measure the sound emitted. This procedure can be repeated for each chime in the group so that all the characteristic frequencies are identified. An alternative means of acquiring the same information is to strike all the chimes simultaneously, and to subject the complex collection of frequencies produced to mathematical analysis. In the following diagram, the four frequencies assigned to our set of chimes are added together to give a complex summation wave. This is a straightforward conversion; and the reverse transformation, while not as simple, is readily accomplished, provided the combination signal is adequately examined and characterized.

August 201716 NMR Spectroscopy
Pulse Versus Continuous WaveA CW NMR spectrometer functions by irradiating each set of distinct nuclei in turn, a process
analagous to striking each chime independently. For a high resolution spectrum this must be done
slowly, and a 12 ppm sweep of the proton region takes from 5 to 10 minute
C C OHH
H
H
HH

August 201717 NMR Spectroscopy
Pulse Versus Continuous WaveIt has proven much more efficient to excite all the proton nuclei in a molecule at the same time, followed by
mathematical analysis of the complex RF resonance frequencies emitted as they relax back to the equilibrium state.
This is the principle on which a pulse Fourier transform spectrometer operates. By exposing the sample to a very
short (10 to 100 μsec), relatively strong (about 10,000 times that used for a CW spectrometer) burst of rf energy
along the x-axis, as described above, all of the protons in the sample are excited simultaneously. The macroscopic
magnetization model remains useful if we recognize it is a combination of magnetization vectors for all the nuclei
that have been excited.

August 201718 NMR Spectroscopy
Free Induction Decay and Fourier TransformThe overlapping resonance signals generated as the excited protons relax are collected by a computer and subjected to a Fourier transform mathematical analysis. As shown in the diagram on the left, the Fourier transform analysis, abbreviated FT, converts the complex time domain signal emitted by the sample into the frequency (or field) domain spectrum we are accustomed to seeing. In this fashion a complete spectrum can be acquired in a few seconds.
Because the relaxation mechanism is a first order process, the RF signal emitted by the sample decays exponentially. This is called a free induction decay signal, abbreviated FID.
Since, the FID signal collected after one pulse, may be stored and averaged with the FID's from many other identical pulses prior to the Fourier transform, the nmr signal strength from a small sample may be enhanced to provide a useable spectrum. This has been essential to acquiring spectra from low abundance isotopes, such as 13C. In practice, the pulse FT experiment has proven so versatile that many variations of the technique, suited to special purposes, have been devised and used effectively.

August 201719 NMR Spectroscopy
1H NMR Spectrum
Proton 1H NMR Spectroscopy
• 1H NMR yield hydrogen type in organic compounds. i.e., -CH, -CH2, -CH3.
• 1H NMR spectrum yield environment of the hydrogen atoms via the chemical shift.
• 1H NMR spectrum yield relative number of hydrogen atoms area of the signals
• 1H NMR spectrum yield number of neighboring hydrogen via the splitting pattern of the signals.

August 201720 NMR Spectroscopy
Chemical ShiftThe magnetic field at the nucleus is not equal to the applied magnetic field; electrons around the nucleus shield it from the applied field. The difference between the applied magnetic field and the field at the nucleus is termed the nuclear shielding.
Consider the s-electrons in a molecule. They have spherical symmetry and circulate in the applied field, producing a magnetic field which opposes the applied field. This means that the applied field strength must be increased for the nucleus to absorb at its transition frequency. This upfield shift is also termed diamagnetic shift.
Electrons in p-orbitals have no spherical symmetry. They produce comparatively large magnetic fields at the nucleus, which give a low field shift. This "deshielding" is termed paramagnetic shift. In proton (1H) NMR, p-orbitals play no part (there aren't any!), which is why only a small range of chemical shift (10 ppm) is observed. We can easily see the effect of s-electrons on the chemical shift by looking at substituted methanes, CH3X. As X becomes increasingly electronegative, so the electron density around the protons decreases, and they resonate at lower field strengths (increasing dH values).
Chemical shift is defined as nuclear shielding / applied magnetic field. Chemical shift is a function of the nucleus and its environment. It is measured relative to a reference compound. For 1H NMR, the reference is usually tetramethylsilane, Si(CH3)4. effectively.
August 201721 NMR Spectroscopy
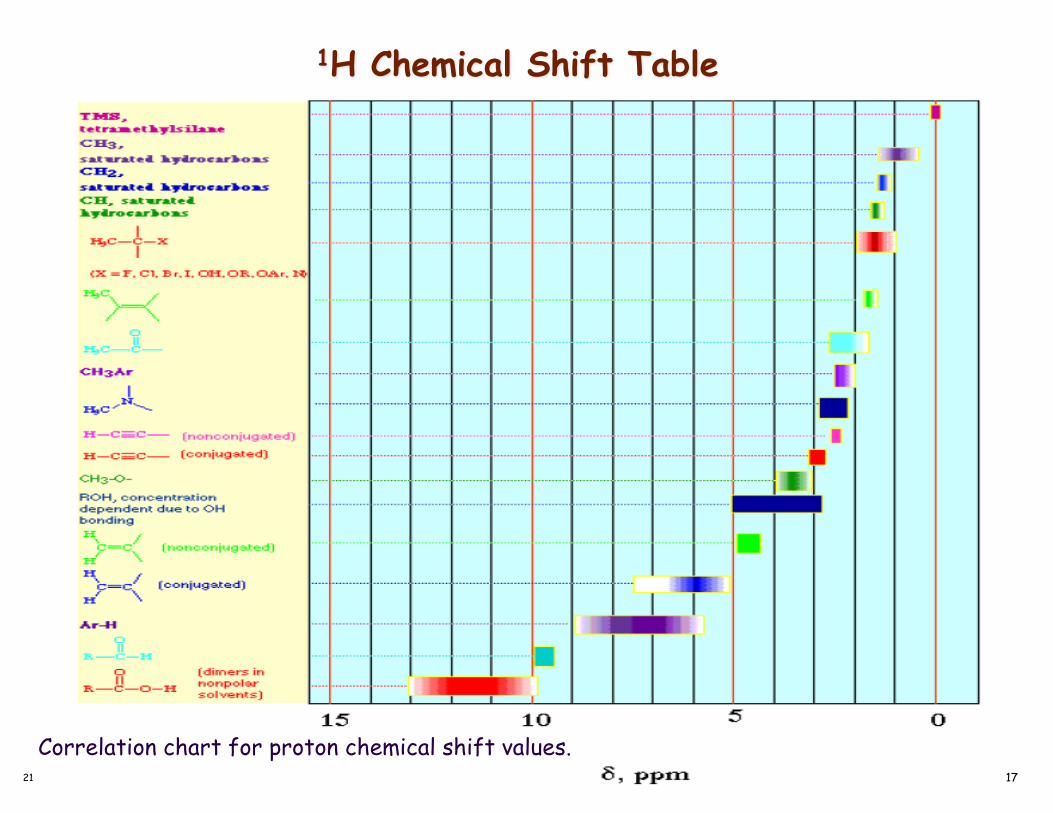
1H Chemical Shift Table
Correlation chart for proton chemical shift values.
August 201722 NMR Spectroscopy
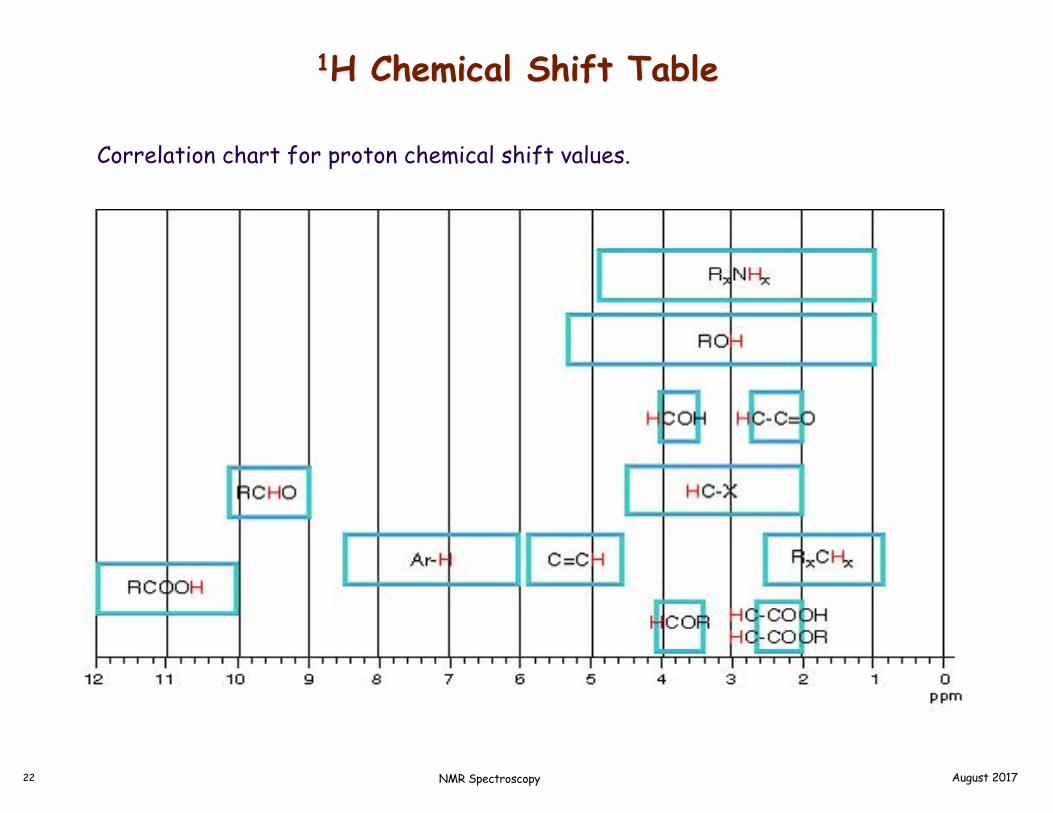
1H Chemical Shift Table
Correlation chart for proton chemical shift values.

August 201723 NMR Spectroscopy
1H Chemical Shift Table
Detailed correlation chart for hydrogen-1 chemical shift values.
August 201724 NMR Spectroscopy
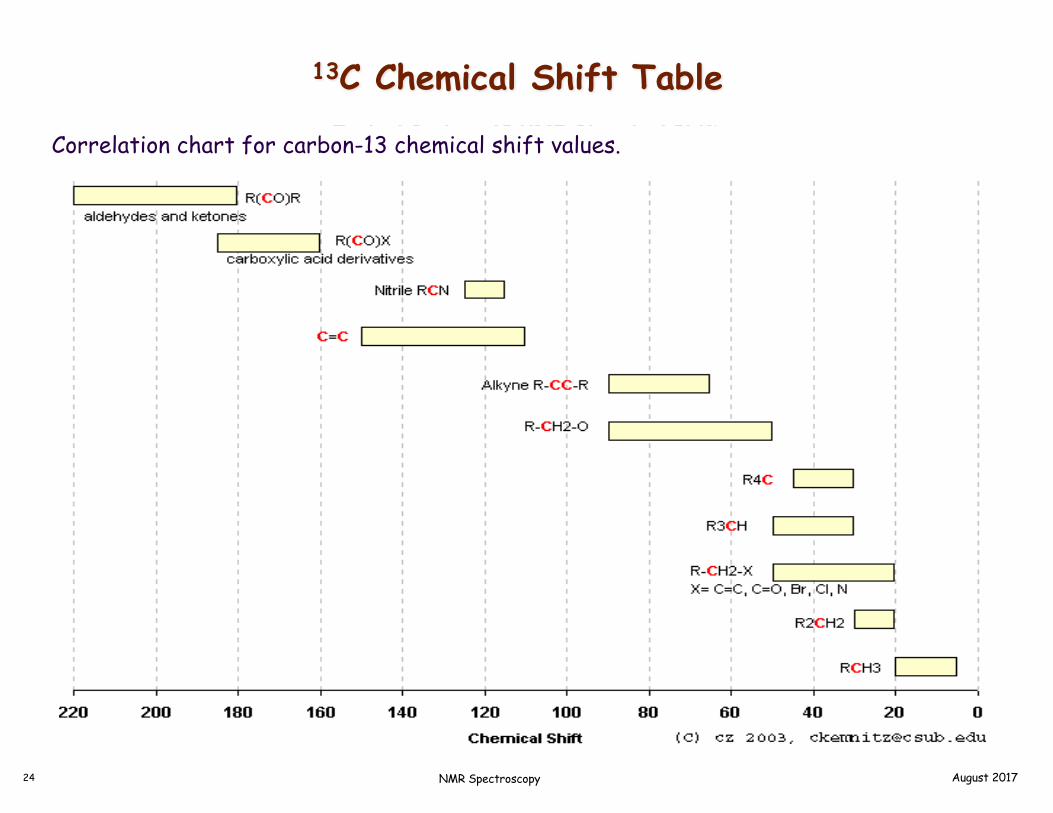
13C Chemical Shift Table
Correlation chart for carbon-13 chemical shift values.

August 201725 NMR Spectroscopy
13C Chemical Shift TableCorrelation chart for carbon-13 chemical shift values.
Structure Chemical Shift (ppm)Carbonyl (ketone) 205-220Carbonyl (aldehyde) 190-200 Carbonyl (ester, acid) 170-185 Aromatic 125-150 Alkenes 115-140
Alkynes 67-85RCH2OH 50-65
RCH2Cl 40-45RCH2NH2 37-45
R3CH 25-35CH3CO 20-30
R2CH2 16-25RCH3 10-15

August 201726 NMR Spectroscopy
1H NMR Spectrum
Proton 1H NMR Spectroscopy
• 1H NMR yield hydrogen type in organic compounds. i.e., -CH, -CH2, -CH3.
• 1H NMR spectrum yield environment of the hydrogen atoms via the chemical shift.
• 1H NMR spectrum yield relative number of hydrogen atoms area of the signals
• 1H NMR spectrum yield number of neighboring hydrogens via the splitting pattern of the signals.

August 201727 NMR Spectroscopy
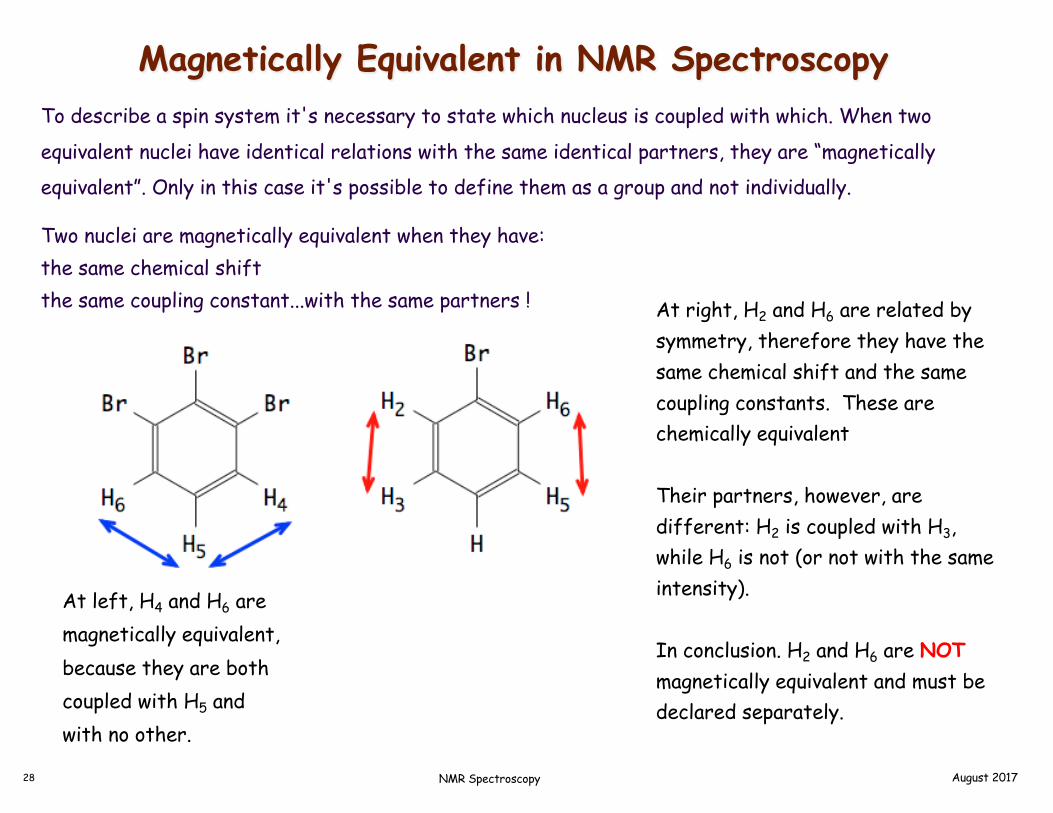
Magnetically Equivalent in NMR SpectroscopyTo describe a spin system it's necessary to state which nucleus is coupled with which. When two
equivalent nuclei have identical relations with the same identical partners, they are “magnetically
equivalent”. Only in this case it's possible to define them as a group and not individually.
Two nuclei are magnetically equivalent when they have: the same chemical shiftthe same coupling constant...with the same partners !
At left, H4 and H6 are magnetically equivalent, because they are both coupled with H5 and with no other.
At right, H2 and H6 are related by symmetry, therefore they have the same chemical shift and the same coupling constants. These are chemically equivalent
Their partners, however, are different: H2 is coupled with H3, while H6 is not (or not with the same intensity).
In conclusion. H2 and H6 are NOTmagnetically equivalent and must be declared separately.
August 201728 NMR Spectroscopy
Magnetically Equivalent in NMR SpectroscopyTo describe a spin system it's necessary to state which nucleus is coupled with which. When two
equivalent nuclei have identical relations with the same identical partners, they are “magnetically
equivalent”. Only in this case it's possible to define them as a group and not individually.
Two nuclei are magnetically equivalent when they have: the same chemical shiftthe same coupling constant...with the same partners !
At left, H4 and H6 are magnetically equivalent, because they are both coupled with H5 and with no other.
At right, H2 and H6 are related by symmetry, therefore they have the same chemical shift and the same coupling constants. These are chemically equivalent
Their partners, however, are different: H2 is coupled with H3, while H6 is not (or not with the same intensity).
In conclusion. H2 and H6 are NOTmagnetically equivalent and must be declared separately.

August 201729 NMR Spectroscopy
Spin-Spin Coupling (Methyl Hydrogen)
Consider the structure of ethanol;The 1H NMR spectrum of ethanol (below) shows the methyl peak has been split into three peaks (a triplet) and the methylene peak has been split into four peaks (a quartet). This occurs because there is a small interaction (coupling) between the two groups of protons. The spacings between the peaks of the methyl triplet are equal to the spacings between the peaks of the methylene quartet. This spacing is measured in Hertz and is called the coupling constant, J.
To see why the methyl peak is split into a triplet, consider the methylene protons. There are two protons, and each can have one of two possible orientations (aligned with or opposed against the applied field). This gives a total of four states shown in the figure. In the first possible combination, spins are paired and opposed to the field. This has the effect of reducing the field experienced by the methyl protons; therefore a slightly higher field is needed to bring them to resonance, resulting in an upfield shift.
Neither combination of spins opposed to each other has an effect on the methyl peak. The spins paired in the direction of the field produce a downfield shift. Hence, the methyl peak is split into three, with the ratio of areas 1:2:1.

August 201730 NMR Spectroscopy
Spin-Spin Coupling (Methyl Hydrogen)
x 3
Methyl signal
C C
H
OH
H
H
H
H
C C
H
OH
H
H
H
H
C C
H
OH
H
H
H
H
C C
H
OH
H
H
H
H

August 201731 NMR Spectroscopy
...Spin-Spin Coupling (Continue)
Similarly, the effect of the methyl protonson the methylene protons is such that thereare eight possible spin combinationsfor the three methyl protons;
Out of these eight groups, there are two groups of three magnetically equivalent combinations. The methylene peak is split into a quartet. The areas of the peaks in the quartet have the ration 1:3:3:1.In a first-order spectrum (where the chemical shift between interacting groups is much larger than their coupling constant), interpretation of splitting patterns is quite straightforward;• The multiplicity of a multiplet is given by the number of equivalent protons in neighbouring atoms plus one, i.e. the n + 1 rule• Equivalent nuclei do not interact with each other. The three methyl protons in ethanol cause splitting of the neighboring methylene protons; they do not cause splitting among themselves• The coupling constant is not dependent on the applied field. Multiplets can be easily distinguished from closely spaced chemical shift peaks.

August 201732 NMR Spectroscopy
Spin-Spin Coupling (Methylene Hydrogens)
C C
H
OH
H
H
H
H
C C
H
OH
H
H
H
H
C C
H
OH
H
H
H
H
C C
H
OH
H
H
H
H
C C
H
OH
H
H
H
H
C C
H
OH
H
H
H
H
C C
H
OH
H
H
H
H
C C
H
OH
H
H
H
H
x 2
Methylene signal

August 201733 NMR Spectroscopy
Proton-Proton coupling Constant (J)
Spin-Spin Coupling correlation chart.

August 201734 NMR Spectroscopy
Proton-Proton coupling Constant (J)
Spin-Spin Coupling correlation chart.

August 201735 NMR Spectroscopy
Interpreting 1H NMRThe interpretation of a 1H spectra depends on three features: chemical shifts, multiplicities and integrated peak area.• Note the presence or absence of saturated structures, most of which gives resonances between 0 and 5 d ppm.
• Note the presence or absence of unsaturated structures in the region between 5 & 9 d ppm. Alkene protons resonate between 5 and 7 d ppm and aromatic protons between 7 and 9 d ppm. Note that alkyne protons resonance upfield around 1.5 d ppm.
• Note any very low field resonance (downfield) between 9 and 16 d ppm, which are associated with aldehydic and acidic protons, especially those involving in H-bonding.
• Measure the integrals, if recorded, and calculate the number protons in each resonance signal.
• Check for spin-spin splitting patterns given by adjacent alkyl group according to the n+1 rule and Pascal’s triangle. Note that the position of the lower field multiplet of the two is very sensitive to the proximity of electronegative elements and groups such as O, CO, COO, OH, X, NH2, etc.)
• Examine the splitting pattern given by aromatic protons, which couple around the ring and are often complex due to second order effects.
• 1,4 and 1,2-disubstituted rings give complex but symmetrical looking patterns of peaks, whereas mono- 1,3-and tri-substituted rings give more complex asymmetric patterns.
• Note any broad single resonance, which are evidence of liable protons from alcohols, phenols, acids and amines that can undergo slow exchange with other labile protons.
August 201736 NMR Spectroscopy
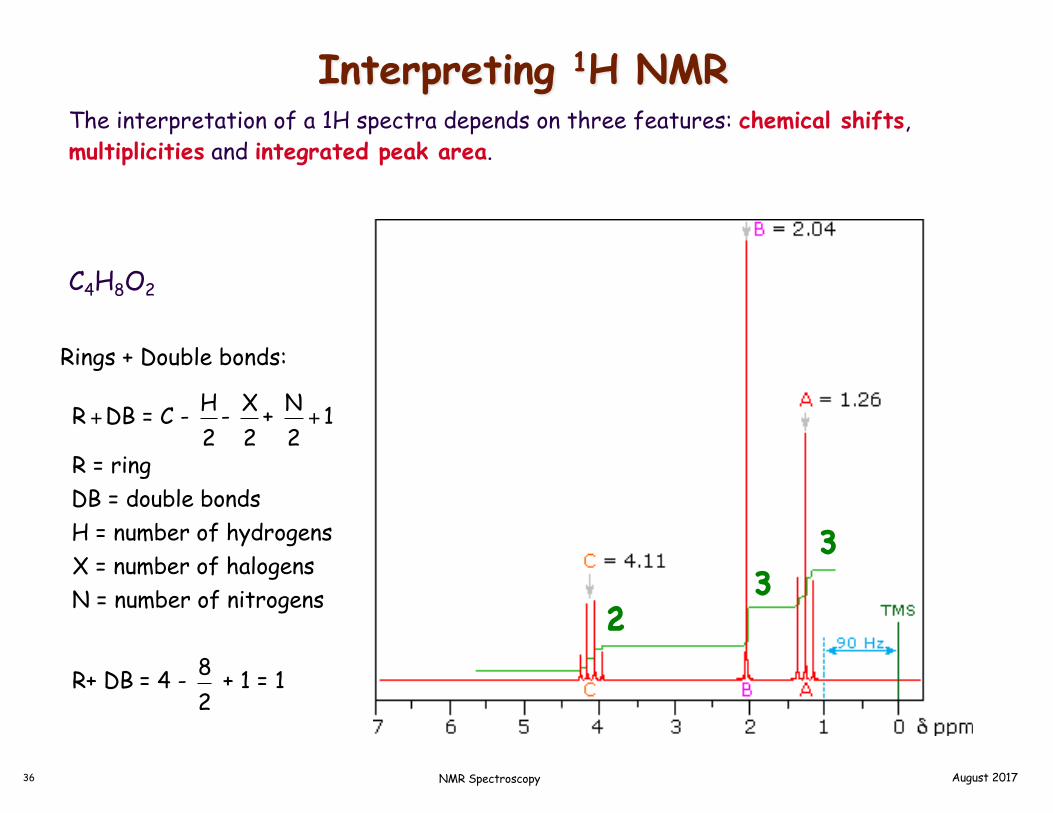
Interpreting 1H NMRThe interpretation of a 1H spectra depends on three features: chemical shifts, multiplicities and integrated peak area.
C4H8O2
Rings + Double bonds:
R +DB = C - H2
- X2
+ N2+ 1
R = ringDB = double bondsH = number of hydrogensX = number of halogensN = number of nitrogens
R+ DB = 4 - 82
+ 1 = 1
33
2

August 201737 NMR Spectroscopy
Interpreting 13C NMR
Carbon-13 spectra cover a much wider range of chemical shifts than proton spectra,
but the positions of resonances are generally determined by the same factors.
Remember that the p-electrons are now responsible for shielding and deshielding
the nuclei. The spectra are usually recorded as decoupled spectra to eliminate the
effects of coupling to adjacent protons which would otherwise split the carbon-13
resonance according to the n+1 rule and Pascal’s triangle. Decouple spectra consist
of a single peak for each chemically different carbon in the molecule and spectral
interpretation is confined to the correlation of their chemical shifts with structure,
augmented by reference to chemical shift data and the spectra of known
compounds. Proton coupling can be observed under appropriate experimental
conditions.
August 201738 NMR Spectroscopy
Interpreting 13C NMRUnder decoupling conditions note the following-
• Note the presence or absence of saturated structures, most of which give resonance
between 0 and 90 d ppm.
• Note the presence or absence of unsaturated structures in the region between 100
and 160 d ppm. Note that alkyne protons resonance upfield between 70 and 100 d ppm.
• Note any very low field resonances (160 to 220 d ppm), which are associated with
carbonyl and ether carbons. Carboxylic acids, anhydrides, esters, amides, acyl halides
and ethers are all found all found in he range of 160 to 180 d ppm, while aldehydes and
ketones lie between 180 and 220 d ppm.

August 201739 NMR Spectroscopy
Interpreting 13C NMR13C NMR
12
3
10
9 8
45
August 201740 NMR Spectroscopy
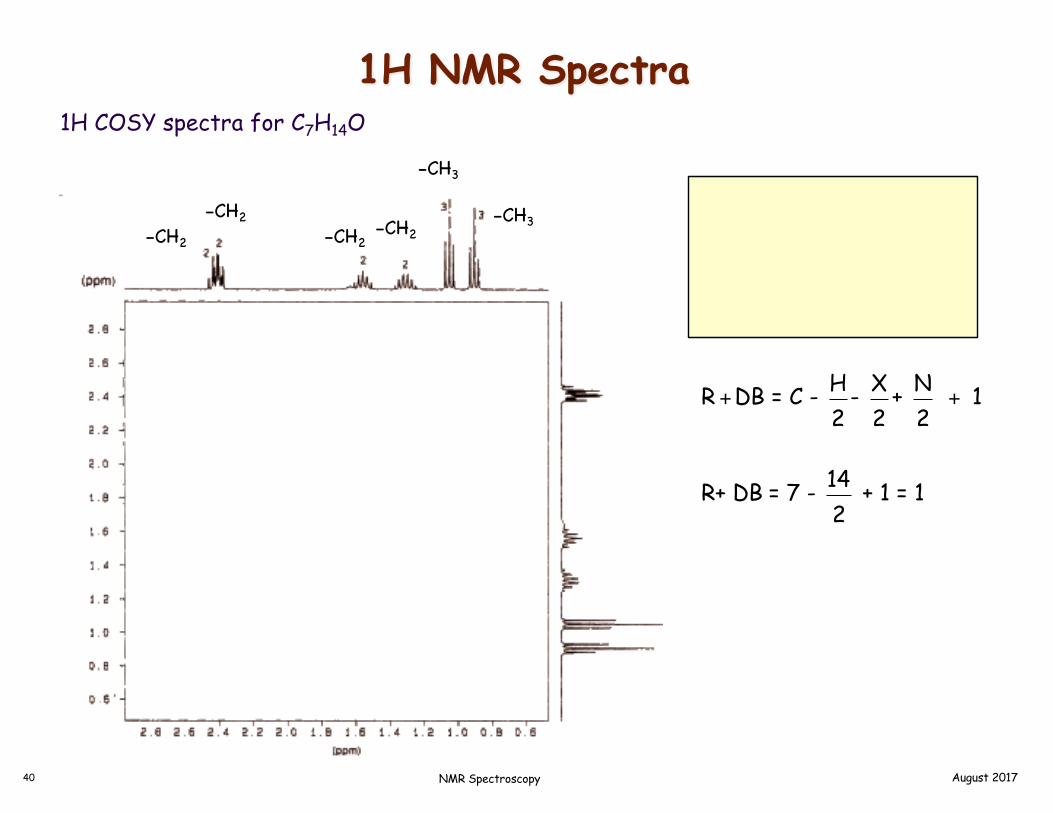
1H NMR Spectra1H COSY spectra for C7H14O
O
R +DB = C - H2
- X2
+ N2
+ 1
R+ DB = 7 - 142
+ 1 = 1
-CH3
-CH3
-CH2-CH2-CH2
-CH2

August 201741 NMR Spectroscopy
1H NMR Spectra1H COSY spectra for C7H14O
O
R +DB = C - H2
- X2
+ N2
+ 1
R+ DB = 7 - 142
+ 1 = 1
-CH3
-CH3
-CH2-CH2-CH2
-CH2

August 201742 NMR Spectroscopy
Dept 13C SpectraDEPT - Distortionless Enhancement by Polarization Transfer.The DEPT experiment differentiates CH, CH2 and CH3 groups by variation of the selection angle parameter (the tip angle of the final 1H pulse):- 135° angle gives all CH and CH3 in a phase opposite to CH2
- 90° angle gives only CH groups, the others being suppressed
- 45° angle gives all carbons with attached protons
C10H12O2 Propyl benzoateC
O
H2C
CH2
O
CH3
8 13C resonances
81
2
34
5
6
67
7
1234 5 8
67

August 201743 NMR Spectroscopy
Dept 13C SpectraDEPT - Distortionless Enhancement by Polarization Transfer.The DEPT experiment differentiates CH, CH2 and CH3 groups by variation of the selection angle parameter (the tip angle of the final 1H pulse):- 135° angle gives all CH and CH3 in a phase opposite to CH2
- 90° angle gives only CH groups, the others being suppressed
- 45° angle gives all carbons with attached protons
135° + CH and CH3- CH2
90° + CH
45° + CH, CH2, CH3
C10H12O2 Propyl benzoate
130.1
165.9
68.8
21.9
10.3129.9128.6
133.0
128.6 129.9
CO
H2C
CH2
O
CH3
CO
H2C
CH2
O
CH3

August 201744 NMR Spectroscopy
18.6
144.4
146.2
166.5
61.4
14.2H3C
HC
CH
CO
H2C
CH3
OHetcorHETCOR –
Heteronuclear SpectroscopyC6H10O2 Rings + db = 2
COSY HETCOR
2.05
4.20
1.36
5.83
6.88
H3CHC
CHC
O
H2C
CH3
O
H
H
H3C
HC
CH
CO
H2C
CH3
O
Rings + Double Bonds
1 1
2 3 3