nts plano - emc department nts test report no ... antenna port conducted spurious emissions tests...
TRANSCRIPT

NTS Plano - EMC Department NTS Test Report No. PR033647 Rev. 1
Report Date: Feb 10, 2015
Page 51
20M – QPSK – Low
20M – QPSK – High

NTS Plano - EMC Department NTS Test Report No. PR033647 Rev. 1
Report Date: Feb 10, 2015
Page 52
20M – 16QAM – Low
20M – 16QAM – High

NTS Plano - EMC Department NTS Test Report No. PR033647 Rev. 1
Report Date: Feb 10, 2015
Page 53
20M – 64QAM – Low
20M – 64QAM – High

NTS Plano - EMC Department NTS Test Report No. PR033647 Rev. 1
Report Date: Feb 10, 2015
Page 54
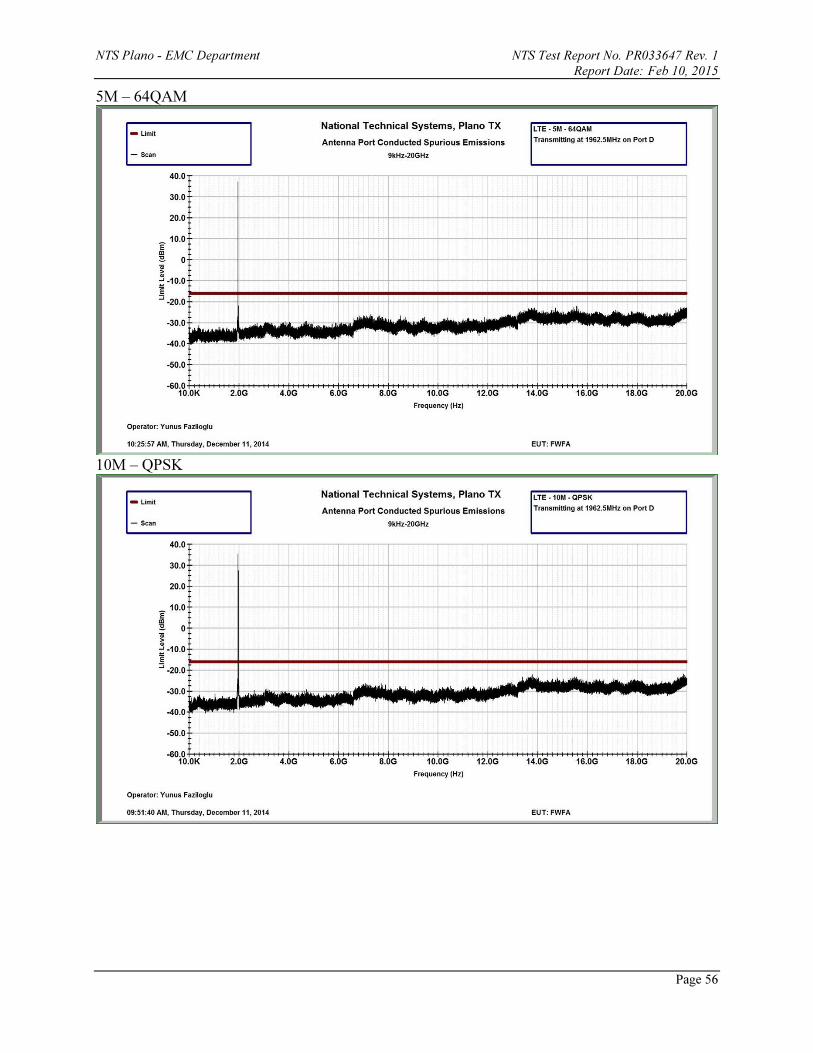
Transmitter Antenna Port Conducted Spurious Emissions
Tests performed at Port D on center channel for all modulations and bandwidth modes. Due to
2x2 MIMO operation, limit is -16.02dBm (-13dBm – 10*log(2)) per FCC KDB 662911D01
v02r01. TILE6 measurement software was used during testing. Except for the fundamental, all
the readings were at noise floor.
Measurements taken with the following settings: Frequency Range RBW VBW Number of
data points
Divided into Detector Sweep
Time
Max hold
over
9kHz-150kHz 1kHz 3kHz 8000 1 segment Peak Auto 50 sweeps
150kHz-1.5MHz 100kHz 300kHz 8000 1 segment Peak Auto 50 sweeps
1.5MHz-20GHz 1MHz 3MHz 8000 10 segments Peak Auto 50 sweeps
Corresponding plots are included on the following pages.

NTS Plano - EMC Department NTS Test Report No. PR033647 Rev. 1
Report Date: Feb 10, 2015
Page 55
5M – QPSK
5M – 16QAM
NTS Plano - EMC Department NTS Test Report No. PR033647 Rev. 1
Report Date: Feb 10, 2015
Page 56
5M – 64QAM
10M – QPSK

NTS Plano - EMC Department NTS Test Report No. PR033647 Rev. 1
Report Date: Feb 10, 2015
Page 57
10M – 16QAM
10M – 64QAM

NTS Plano - EMC Department NTS Test Report No. PR033647 Rev. 1
Report Date: Feb 10, 2015
Page 58
15M – QPSK
15M – 16QAM

NTS Plano - EMC Department NTS Test Report No. PR033647 Rev. 1
Report Date: Feb 10, 2015
Page 59
15M – 64QAM
20M – QPSK

NTS Plano - EMC Department NTS Test Report No. PR033647 Rev. 1
Report Date: Feb 10, 2015
Page 60
20M – 16QAM
20M – 64QAM

NTS Plano - EMC Department NTS Test Report No. PR033647 Rev. 1
Report Date: Feb 10, 2015
Page 61
Transmitter Radiated Spurious Emissions
Prescans have been performed in the 30MHz – 20GHz frequency range when the unit was in
15MHz QPSK mode while transmitting on its center channel at 1962.5MHz. Antenna port
conducted spurious emissions results for all modulations and channel bandwidth modes
produced similar results around instrumentation noise floor. 15MHz QPSK mode produced the
highest spikes in bandedge tests and therefore was selected for radiated spurious emissions test.
Final maximized peak radiated emissions were measured at the center channel in this mode.
During testing both antenna ports of the base station were terminated with 50ohm termination
blocks. Unit was operating in its 2x2 MIMO configuration at full power.
Frequency
(MHz)
Polarity
(H/V)
Raw
Reading
at 3m
(dBuV)
Amplifier
Gain (dB)
Antenna
Factor
(dB/m)
Cable
Loss
(dB)
Corrected
Field
Strength at
3m
(dBuV/m)
Limit at
3m
(dBuV/m)
Margin
(dB)
59.5 H 82.3 -38.95 7.56 0.43 51.34 82.2 -30.86
59.5 V 85.5 -38.95 7.56 0.43 54.54 82.2 -27.66
425.5 H 58.6 -38.33 17.1 1.29 38.66 82.2 -43.54
425.5 V 56.3 -38.33 17.1 1.29 36.36 82.2 -45.84
3925.0 H 64.2 -47.02 32.73 2.86 52.77 82.2 -29.43
3925.0 V 63.3 -47.02 32.73 2.86 51.87 82.2 -30.33
Corrected Field Strength = Raw Reading + Amplifier Gain + Antenna Factor + Cable Loss
Negative margin indicates a passing result.
Detector: Peak, RBW=1MHz, VBW=3MHz, Max-hold
In the 30M-1GHz range emissions recorded were from the unintentional circuitry of the EUT.
Harmonics of the fundamental, except for the 2nd harmonic, were below the instrumentation
noise floor. All other spurious emissions were below the instrumentation noise floor as well.
Highest noise floor of the measurement instrumentation was more than 20dB below the
82.2dBuV/m at 3m limit (equivalent to –13dBm EIRP).
Since all maximized readings were more than 20dB below the 82.2dBuV/m at 3m limit
(equivalent to -13dBm EIRP), substitution measurements were not performed.
TILE software was used for all prescans and plots included on the following pages.

NTS Plano - EMC Department NTS Test Report No. PR033647 Rev. 1
Report Date: Feb 10, 2015
Page 62
30MHz – 1GHz Peak Prescan at 3m – H
30MHz – 1GHz Peak Prescan at 3m – V

NTS Plano - EMC Department NTS Test Report No. PR033647 Rev. 1
Report Date: Feb 10, 2015
Page 63
1GHz – 18GHz Peak Prescan at 3m – H
1GHz – 18GHz Peak Prescan at 3m – V

NTS Plano - EMC Department NTS Test Report No. PR033647 Rev. 1
Report Date: Feb 10, 2015
Page 64
18GHz – 20GHz Peak Prescan at 3m – H
18GHz – 20GHz Peak Prescan at 3m – V

NTS Plano - EMC Department NTS Test Report No. PR033647 Rev. 1
Report Date: Feb 10, 2015
Page 65
Frequency Stability
In order to demonstrate carrier frequency stability at extreme temperatures and voltages, bandedge
compliance was verified at Port D on lowest and highest channels in 10MHz QPSK mode. This mode was
selected since it had the highest readings at 1930MHz and 1995MHz block edges during previous
bandedge tests.
Nominal operating voltage of the product is declared as 115VAC.
Bandedge reading results are listed below for extreme voltages and temperatures. The limit for
compliance is same as the limit applied during previous bandedge tests, i.e. -16.02dBm.
Extreme Voltages
Extreme Temperatures
Results above are deemed sufficient to demonstrate carrier frequency stability for all other channel
bandwidth modes and modulations since all carriers are controlled by the same frequency stabilization
circuitry that was subjected to the extreme conditions under this test.
All corresponding plots are included on the following pages.
20C Low High97.7VAC -18.56 -18.4
132.3VAC -17.68 -17.21
115VAC Low High
-30 -18.66 -16.92
-20 -17.38 -17.95
-10 -18.27 -19.08
0 -18 -18.46
10 -19.11 -18.27
20 -17.72 -17.34
30 -17.63 -18.26
40 -18.61 -17.32
50 -18.91 -17.54

NTS Plano - EMC Department NTS Test Report No. PR033647 Rev. 1
Report Date: Feb 10, 2015
Page 66
20C 115VAC 10M QPSK Low Bandedge 20C 115VAC 10M QPSK High Bandedge
20C 97.7VAC 10M QPSK Low Bandedge 20C 97.7VAC 10M QPSK High Bandedge
20C 132.3VAC 10M QPSK Low Bandedge 20C 132.3VAC 10M QPSK High Bandedge
-30C 115VAC 10M QPSK Low Bandedge -30C 115VAC 10M QPSK High Bandedge

NTS Plano - EMC Department NTS Test Report No. PR033647 Rev. 1
Report Date: Feb 10, 2015
Page 67
-20C 115VAC 10M QPSK Low Bandedge -20C 115VAC 10M QPSK High Bandedge
-10C 115VAC 10M QPSK Low Bandedge -10C 115VAC 10M QPSK High Bandedge
0C 115VAC 10M QPSK Low Bandedge 0C 115VAC 10M QPSK High Bandedge
10C 115VAC 10M QPSK Low Bandedge 10C 115VAC 10M QPSK High Bandedge

NTS Plano - EMC Department NTS Test Report No. PR033647 Rev. 1
Report Date: Feb 10, 2015
Page 68
30C 115VAC 10M QPSK Low Bandedge 30C 115VAC 10M QPSK High Bandedge
40C 115VAC 10M QPSK Low Bandedge 40C 115VAC 10M QPSK High Bandedge
50C 115VAC 10M QPSK Low Bandedge 50C 115VAC 10M QPSK High Bandedge

NTS Plano - EMC Department NTS Test Report No. PR033647 Rev. 1
Report Date: Feb 10, 2015
Page 69
End of Report
This page is intentionally blank and
marks the last page of this test report.