nt pastoral feed outlook - march 2017 - dpir.nt.gov.au€¦ · web viewnt pastoral feed outlook -...
TRANSCRIPT

DEPARTMENT OF PRIMARY INDUSTRY AND RESOURCES
NT Pastoral Feed Outlook - March 2017The purpose of this quarterly outlook is to summarise information relevant to the pastoral industry such as current feed supplies, seasonal conditions, the development of drought conditions in central Australia and fire risk.
You can see the entire document and all districts by continuing to scroll through this file. If you are interested in selected sections, you can click on the links below.
Summary of current situation & trends - all districts
Northern Territory Seasonal Outlook – as at March 2017
Individual District Summaries:
Darwin District
Katherine District
Victoria River District
Sturt Plateau District
Roper District
Gulf District
Barkly District
Tennant Creek District
Northern Alice Springs District
Plenty District
Southern Alice Springs District

NT Pastoral Feed Outlook – March 2017
Summary of current situation & trends - all districts – March 2017KEY Green = low risk Orange = watch Red = high risk
KEY ↑ = increasing trend ↓ = decreasing trend ↔ = steady
Northern Territory Pastoral Districts
Indicator Darwin Katherine VRD Sturt
Plateau Roper Gulf Barkly Tennant Creek
Northern Alice Springs
PlentySouthern Alice Springs
Comments
2016/17 total pasture growth ↔ ↔ ↔ ↔ ↔ ↔ ↑ ↑ ↑ ↑ ↑ Arrows indicate trend
compared to the long-term median.
Current estimated standing biomass ↑ ↑ ↑ ↑ ↑ ↑ ↑ ↑ ↑ ↑ ↑ Arrows indicate trend
since previous quarter.
Current seasonal outlook ↓ ↓ ↓ ↓ ↓ ↓ ↓ ↓ ↓ ↓ ↓
Arrows indicate the trend since previous quarter and taking into account the forecasted model predictions.
Current fire risk ↓ ↓ ↓ ↓ ↓ ↓ ↓ ↓ ↓ ↔ ↔ Arrows indicate the trend since previous quarter.
For further information about this Outlook, please contact Chris Materne on 8951 8135 or Dionne Walsh on 8999 2178
© Northern Territory Government Page 2 of 16

NT Pastoral Feed Outlook – March 2017Northern Territory Seasonal Outlook as at March 2017
Sourced from the Australian Bureau of Meteorologyhttp://www.bom.gov.au/climate/outlooks/ The national outlook for March to May 2017 period indicates that:
Drier than average conditions are expected across the southern two-thirds of the NT, south of Elliott.
Wetter than average conditions expected across the Top End, Katherine and Roper districts
Warmer than average days and nights are more likely across the Southern NT.
Cooler than average days and nights are more likely across the Northern NT.
Without a strong influence from the Indian or Pacific oceans, secondary climate drivers contribute more to the outlooks. Higher than average pressure is forecast over the Great Australian Bight and southern and western Australia, meaning fewer rain-bearing systems are likely to cross the coast.
Seasonal Indicators Comments (sourced from the Australian Bureau of Meteorology)
El Niño Southern Oscillation (ENSO)
http://www.bom.gov.au/climate/enso/Current outlook:
WatchLa Niña WATCH Level(ENSO status)
ENSO at neutral.
Although ENSO is currently neutral, some indicators show an increased chance of El Niño developing during 2017.
While recent changes in tropical Pacific Ocean sea surface temperatures and the Southern Oscillation Index (SOI) are typical of those expected prior to an El Niño, both these and other indicators remain firmly within neutral boundaries. All climate model outlooks show further warming of the Pacific is likely, with six reaching El Niño thresholds during the southern hemisphere winter of 2017.
El Niño WATCH means that there is approximately a 50% chance of El Niño developing in 2017, which is about twice the normal likelihood
© Northern Territory Government Page 3 of 16
Chance of exceeding the median rainfallMarch to May 2017
Chance of exceeding the median max. temp.March to May 2017

NT Pastoral Feed Outlook – March 2017Indian Ocean Dipole (IOD)
http://www.bom.gov.au/climate/enso/#tabs=Indian-OceanCurrent outlook:
Neutral
IOD also neutral..The IOD also remains neutral (neither positive nor negative), as is typical at this time of year.
When the IOD is neutral it has limited impact on Australian climate.
However, the continued presence of much warmer than average water to the north and northwest of Australia may see continued influence on Australia, including enhanced rainfall.
© Northern Territory Government Page 4 of 16

NT Pastoral Feed Outlook – March 2017
Darwin DistrictRisks: Nil to report.Note: In a typical wet season pasture growth in the Darwin region is limited by available soil nitrogen, not water. Therefore a poor wet season may not generally affect the quantity of pasture growth on upland.
Currently (as at 1st March 2017)<1,000kg/ha >1,000 &
<2,000kg/ha>2,000 &
<3,000kg/ha >3,000kg/haWet Season
Pasture Growth(kg/ha)
0% 57% 41% 2%
Total Standing Dry Matter
(kg/ha)0% 36% 50% 14%
Currently (as at 1st March 2017)Below Average Average Above Average
Pasture Growth(% of district) 35% 35% 30%
Total Standing Dry Matter
(% of district)66% 28% 6%
Fire Risk(% of district)
High0%
Moderate100%
Low0%
Area Burnt(% of district)
0% (since 1st January 2017)21% (2016/17 Total Area Burnt)
2016/17 Median Pasture Growth (kg/ha)
(Running Total)
Chance of exceeding Median Pasture Growth(March 2017 – June 2017)
0500
1000150020002500
Jul
Aug
Sep
tO
ctN
ovD
ec Jan
Feb
Mar
Apr
May Jun
Median 2015/16 2016/17
Total 2016/17 Pasture Growth(July 2016 – March 2017)
Current EstimatedTotal Standing Dry Matter
© Northern Territory Government

NT Pastoral Feed Outlook – March 2017
Katherine DistrictRisks:- Nil to report.
Currently (as at 1st March 2017)<1,000kg/ha >1,000 &
<2,000kg/ha>2,000 &
<3,000kg/ha >3,000kg/haWet Season
Pasture Growth(kg/ha)
0% 62% 38% 0%
Total Standing Dry Matter
(kg/ha)1% 27% 57% 15%
Currently (as at 1st March 2017)Below Average Average Above Average
Pasture Growth(% of district) 23% 49% 28%
Total Standing Dry Matter
(% of district)48% 43% 9%
Fire Risk(% of district)
High0%
Moderate100%
Low0%
Area Burnt(% of district)
0% (since 1st January 2017)22% (2016/17 Total Area Burnt)
2016/17 Median Pasture Growth (kg/ha)
(Running Total)
Chance of exceeding Median Pasture Growth(March 2017 – June 2017)
0500
1000150020002500
Jul
Aug
Sep
tO
ctN
ovD
ec Jan
Feb
Mar
Apr
May Jun
Median 2015/16 2016/17
Total 2016/17 Pasture Growth(July 2016 – March 2017)
Current EstimatedTotal Standing Dry Matter
© Northern Territory Government

NT Pastoral Feed Outlook – March 2017
Victoria River DistrictRisks:- Nil to report.
Currently (as at 1st March 2017)<1,000kg/ha >1,000 &
<2,000kg/ha>2,000 &
<3,000kg/ha >3,000kg/haWet Season
Pasture Growth(kg/ha)
6% 51% 40% 3%
Total Standing Dry Matter
(kg/ha)1% 21% 38% 40%
Currently (as at 1st March 2017)Below Average (< 30%) Average Above Average
Pasture Growth(% of district) 7% 21% 72%
Total Standing Dry Matter
(% of district)25% 32% 43%
Fire Risk(% of district)
High24%
Moderate76%
Low0%
Area Burnt(% of district)
0% (since 1st January 2017)9% (2016/17 Total Area Burnt)
2016/17 Median Pasture Growth (kg/ha)
(Running Total)
Chance of exceeding Median Pasture Growth(March 2017 – June 2017)
0
500
1000
1500
2000
2500
Jul
Aug
Sep
tO
ctN
ovD
ec Jan
Feb
Mar
Apr
May Jun
Median 2015/16 2016/17
Total 2016/17 Pasture Growth(July 2016 – March 2017)
Current EstimatedTotal Standing Dry Matter
© Northern Territory Government

NT Pastoral Feed Outlook – March 2017
Sturt Plateau DistrictRisks:- Nil to report.
Currently (as at 1st March 2017)<1,000kg/ha >1,000 &
<2,000kg/ha>2,000 &
<3,000kg/ha >3,000kg/haWet Season
Pasture Growth(kg/ha)
5% 53% 42% 0%
Total Standing Dry Matter
(kg/ha)3% 15% 68% 14%
Currently (as at 1st March 2017)Below Average Average Above Average
Pasture Growth(% of district) 0% 37% 63%
Total Standing Dry Matter
(% of district)9% 50% 41%
Fire Risk(% of district)
High4%
Moderate96%
Low0%
Area Burnt(% of district)
0% (since 1st January 2017)8.5% (2016/17 Total Area Burnt)
2016/17 Median Pasture Growth (kg/ha)
(Running Total)
Chance of exceeding Median Pasture Growth(March 2017 – June 2017)
0
500
1000
1500
2000
2500
Jul
Aug
Sep
tO
ctN
ovD
ec Jan
Feb
Mar
Apr
May Jun
Median 2015/16 2016/17
Total 2016/17 Pasture Growth(July 2016 – March 2017)
Current EstimatedTotal Standing Dry Matter
© Northern Territory Government

NT Pastoral Feed Outlook – March 2017
Roper DistrictRisks:- Nil to report.
Currently (as at 1st March 2017)<1,000kg/ha >1,000 &
<2,000kg/ha>2,000 &
<3,000kg/ha >3,000kg/haWet Season
Pasture Growth(kg/ha)
2% 46% 50% 2%
Total Standing Dry Matter
(kg/ha)1% 12% 45% 42%
Currently (as at 1st March 2017)Below Average Average Above Average
Pasture Growth(% of district) 2% 15% 83%
Total Standing Dry Matter
(% of district)9% 39% 52%
Fire Risk(% of district)
High0%
Moderate100%
Low0%
Area Burnt(% of district)
0% (since 1st January 2017)8% (2016/17 Total Area Burnt)
2016/17 Median Pasture Growth (kg/ha)
(Running Total)
Chance of exceeding Median Pasture Growth(March 2017 – June 2017)
0
500
1000
1500
2000
2500
Jul
Aug
Sep
tO
ctN
ovD
ec Jan
Feb
Mar
Apr
May Jun
Median 2015/16 2016/17
Total 2016/17 Pasture Growth(July 2016 – March 2017)
Current EstimatedTotal Standing Dry Matter
© Northern Territory Government

NT Pastoral Feed Outlook – March 2017
Gulf DistrictRisks:- Nil to report.
Currently (as at 1st March 2017)<1,000kg/ha >1,000 &
<2,000kg/ha>2,000 &
<3,000kg/ha >3,000kg/haWet Season
Pasture Growth(kg/ha)
3% 44% 50% 3%
Total Standing Dry Matter
(kg/ha)1% 16% 44% 39%
Currently (as at 1st March 2017)Below Average Average Above Average
Pasture Growth(% of district) 0% 13% 87%
Total Standing Dry Matter
(% of district)9% 46% 45%
Fire Risk(% of district)
High1%
Moderate99%
Low0%
Area Burnt(% of district)
<1% (since 1st January 2017)8% (2016/17 Total Area Burnt)
2016/17 Median Pasture Growth (kg/ha)
(Running Total)
Chance of exceeding Median Pasture Growth(March 2017 – June 2017)
0
500
1000
1500
2000
2500
Jul
Aug
Sep
tO
ctN
ovD
ec Jan
Feb
Mar
Apr
May Jun
Median 2015/16 2016/17
Total 2016/17 Pasture Growth(July 2016 – March 2017)
Current EstimatedTotal Standing Dry Matter
© Northern Territory Government

NT Pastoral Feed Outlook – March 2017
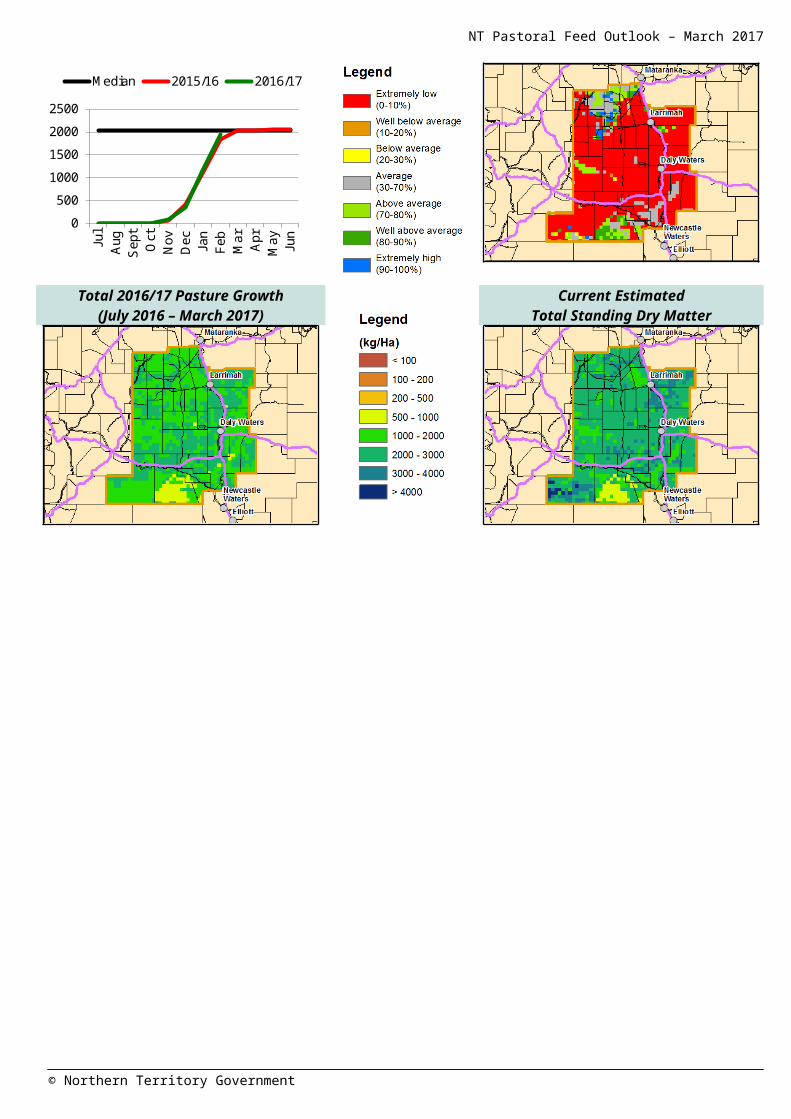
Barkly DistrictRisks:- Nil to report.
Currently (as at 1st March 2017)<250kg/ha >250 & <500kg/ha >500 &
<1,000kg/ha >1,000kg/haPasture Growth
(kg/ha)Since 1st July 2016
0% 0% 19% 81%
Total Standing Dry Matter
(kg/ha)0% 0% 7% 93%
Currently (as at 1st March 2017)Below Average Average Above Average
Pasture Growth(% of district) 0% 0% 100%
Total Standing Dry Matter
(% of district)1% 10% 89%
Fire Risk(% of district)
High17%
Moderate83%
Low0%
Area Burnt(% of district)
<1% (since 1st January 2017)<1% (2016/17 Total Area Burnt)
2016/17 Median Pasture Growth (kg/ha)
(Running Total)
Chance of exceeding Median Pasture Growth(March 2017 – June 2017)
0250500750
10001250150017502000
Jul
Aug
Sep
tO
ctN
ovD
ec Jan
Feb
Mar
Apr
May Jun
Median 2015/16 2016/17
Total 2016/17 Pasture Growth(July 2016 – March 2017)
Current EstimatedTotal Standing Dry Matter
© Northern Territory Government
NT Pastoral Feed Outlook – March 2017
Tennant Creek DistrictRisks:- Nil to report.
Currently (as at 1st March 2017)<250kg/ha >250 & <500kg/ha >500 &
<1,000kg/ha >1,000kg/haPasture Growth
(kg/ha)Since 1st July 2016
0% 0% 16% 84%
Total Standing Dry Matter
(kg/ha)0% 0% 2% 98%
Currently (as at 1st March 2017)Below Average Average Above Average
Pasture Growth(% of district) 0% 0% 100%
Total Standing Dry Matter
(% of district)2% 21% 77%
Fire Risk(% of district)
High43%
Moderate57%
Low0%
Area Burnt(% of district)
0% (since 1st January 2017)1% (2016/17 Total Area Burnt)
2016/17 Median Pasture Growth (kg/ha)
(Running Total)
Chance of exceeding Median Pasture Growth(March 2017 – June 2017)
0250500750
10001250150017502000
Jul
Aug
Sep
tO
ctN
ovD
ec Jan
Feb
Mar
Apr
May Jun
Median 2015/16 2016/17
Total 2016/17 Pasture Growth(July 2016 – March 2017)
Current EstimatedTotal Standing Dry Matter
© Northern Territory Government

NT Pastoral Feed Outlook – March 2017
Northern Alice Springs DistrictRisks:- As at the 1st March 2017, 70% of the district had a high fire risk.
Currently (as at 1st March 2017)<250kg/ha >250 & <500kg/ha >500 &
<1,000kg/ha >1,000kg/haPasture Growth
(kg/ha)Since 1st July 2016
0% 3% 18% 79%
Total Standing Dry Matter
(kg/ha)0% 0% 4% 96%
Currently (as at 1st March 2017)Below Average Average Above Average
Pasture Growth(% of district) 0% 0% 100%
Total Standing Dry Matter
(% of district)1% 24% 75%
Fire Risk(% of district)
High70%
Moderate30%
Low0%
Area Burnt(% of district)
<1% (since 1st January 2017)1% (2016/17 Total Area Burnt)
2016/17 Median Pasture Growth (kg/ha)
(Running Total)
Chance of exceeding Median Pasture Growth(March 2017 – June 2017)
0250500750
10001250150017502000
Jul
Aug
Sep
tO
ctN
ovD
ec Jan
Feb
Mar
Apr
May Jun
Median 2015/16 2016/17
Total 2016/17 Pasture Growth(July 2016 – March 2017)
Current EstimatedTotal Standing Dry Matter
© Northern Territory Government

NT Pastoral Feed Outlook – March 2017
Plenty District Risks:- As at the 1st March 2017, 88% of the district had a high fire risk.
Currently (as at 1st March 2017)<250kg/ha >250 & <500kg/ha >500 &
<1,000kg/ha >1,000kg/haPasture Growth
(kg/ha)Since 1st July 2016
0% 9% 26% 65%
Total Standing Dry Matter
(kg/ha)0% 3% 22% 75%
Currently (as at 1st March 2017)Below Average Average Above Average
Pasture Growth(% of district) 0% 0% 100%
Total Standing Dry Matter
(% of district)0% 19% 81%
Fire Risk(% of district)
High88%
Moderate12%
Low0%
Area Burnt(% of district)
0% (since 1st January 2017)0% (2016/17 Total Area Burnt)
2016/17 Median Pasture Growth (kg/ha)
(Running Total)
Chance of exceeding Median Pasture Growth(March 2017 – June 2017)
0250500750
10001250150017502000
Jul
Aug
Sep
tO
ctN
ovD
ec Jan
Feb
Mar
Apr
May Jun
Median 2015/16 2016/17
Total 2016/17 Pasture Growth(July 2016 – March 2017)
Current EstimatedTotal Standing Dry Matter
© Northern Territory Government

NT Pastoral Feed Outlook – March 2017
Southern Alice Springs DistrictRisks:- As at the 1st March 2017, 99% of the district had a high fire risk.
Currently (as at 1st March 2017)<250kg/ha >250 & <500kg/ha >500 &
<1,000kg/ha >1,000kg/haPasture Growth
(kg/ha)Since 1st July 2016
4% 11% 39% 46%
Total Standing Dry Matter
(kg/ha)0% 2% 17% 81%
Currently (as at 1st March 2017)Below Average Average Above Average
Pasture Growth(% of district) 0% 0% 100%
Total Standing Dry Matter
(% of district)0% 42% 58%
Fire Risk(% of district)
High99%
Moderate1%
Low0%
Area Burnt(% of district)
0% (since 1st January 2017)0% (2016/17 Total Area Burnt)
2016/17 Median Pasture Growth (kg/ha)
(Running Total)
Chance of exceeding Median Pasture Growth(March 2017 – June 2017)
0
250
500
750
1000
Jul
Aug
Sep
tO
ctN
ovD
ec Jan
Feb
Mar
Apr
May Jun
Median 2015/16 2016/17
Total 2016/17 Pasture Growth(July 2016 – March 2017)
Current EstimatedTotal Standing Dry Matter
© Northern Territory Government

Pasture Information
The pasture and fire risk information in this document is derived from AussieGRASS. AussieGRASS is a model that simulates pasture growth and standing biomass using climate data, vegetation mapping, fire history and regional estimates of grazing pressure. The model can be used to track simulated pasture growth and total standing pasture biomass at the landscape scale.
Note that the model does not use stocking rate data for individual properties. Where stock numbers are significantly higher or lower than typical for a district, model estimates of total standing dry matter may be erroneous.
Disclaimer
While all care has been taken to ensure that information contained in this document is true and correct at the time of production, changes in circumstances after the time of distribution may impact on the accuracy of its information. The Northern Territory of Australia gives no warranty or assurance, and makes no representation as to the accuracy of any information or advice contained herein, or that it is suitable for your intended use.
You should not rely upon information in this document for the purpose of making any business or investment decisions without obtaining independent and/or professional advice in relation to your particular situation.
The Northern Territory of Australia disclaims any liability or responsibility or duty of care towards any person for loss of damage caused by any use of or reliance on this information.