nsw pork industry overview 2015 - nsw department of · pdf file ·...
TRANSCRIPT
NSW pork industry overview 2015I N T E N S I V E L I V E S T O C K P R O D U C T I O N
1361
0_JU
L201
5
Published by the NSW Department of Primary Industries
NSW Pork Industry Overview 2015
First published September 2015
ISBN 978-1-74256-779-2
More information
Jayce Morgan, Development Officer Pigs, Dairy and Intensive Livestock, Tamworth
www.dpi.nsw.gov.au
Acknowledgments
Cover image: Jayce Morgan PUB 15/230 JTN 13619
© State of New South Wales through the Department of Industry, Skills and Regional Development, 2015. You may copy, distribute and otherwise freely deal with this publication for any purpose, provided that you attribute the NSW Department of Primary Industries as the owner.
Disclaimer: The information contained in this publication is based on knowledge and understanding at the time of writing (September 2015). However, because of advances in knowledge, users are reminded of the need to ensure that information upon which they rely is up to date and to check currency of the information with the appropriate officer of the Department of Primary Industries or the user’s independent adviser.
NSW Pork Industry Overview 2015
1 NSW Department of Primary Industries, September 2015
Contents Introduction ................................................................................................................................. 2 Industry facts ............................................................................................................................... 3 Current situation of the NSW pork industry ................................................................................. 4 Current situation of the Australian pork industry .......................................................................... 5
Industry history and context ..................................................................................................... 7 Industry economics – NSW pork industry ................................................................................ 7 Pork production systems ......................................................................................................... 8 Marketing .............................................................................................................................. 11
Industry bodies – roles and responsibilities ............................................................................... 13 Australian Pork Limited (APL) ................................................................................................ 13 Pork Cooperative Research Centre (CRC) ............................................................................ 13 NSW Farmers Pork Committee ............................................................................................. 14 Other industry groups ............................................................................................................ 14
Industry legislation .................................................................................................................... 14 Current issues affecting the NSW and Australian pork industries .............................................. 17
Costs of production in Australia ............................................................................................. 17 Costs of production in comparison with overseas .................................................................. 18 Production trends .................................................................................................................. 19 Animal welfare ....................................................................................................................... 20 Processing facilities – lack of choice ...................................................................................... 21 Competition from imports ....................................................................................................... 22 Environmental impacts .......................................................................................................... 24 Other issues .......................................................................................................................... 24
Future growth trends and opportunities ..................................................................................... 24 Australian Bureau of Agricultural and Resource Economics and Sciences ............................ 25 IBISWorld Australia ............................................................................................................... 25 Commonwealth Bank ............................................................................................................ 26
Responses to current issues, challenges and opportunities ...................................................... 26 NSW Government ................................................................................................................. 26 NSW DPI ............................................................................................................................... 26
Addressing the environmental impacts of the pork industry ....................................................... 27 Developments since 2010 ..................................................................................................... 28
References ............................................................................................................................... 29
NSW Pork Industry Overview 2015
2 NSW Department of Primary Industries, September 2015
Introduction This overview is a snapshot of the NSW pork industry as at June 2015. The industry is dynamic and changes in response to a range of influences such as supply and demand, exchange rates, and environmental factors such as droughts and floods, which affect the supply of inputs.
The overview is intended for a broad audience. Its aim is to provide unbiased and objective industry intelligence. It will be revised and updated regularly.
The pork industry in Australia is the smallest of the livestock industries but is the only one competing with imported product, principally from Denmark, the USA, Canada and the Netherlands. Approximately two-thirds of processed pork product (which includes ham, bacon and smallgoods) is made from imported pork. The fresh pork market is all Australian. The key markets of the small export market include Singapore, New Zealand and other Asian markets.
The pork industry is based on intensive production systems, in which all pigs are fully housed. This system accounts for approximately 90% of all pork produced in Australia. Infrastructure on conventional intensive farms is costly and species specific.
The sow is the productive unit for the piggery, and most farms are described in terms of the number of sows. Some farms operate as ‘grow-out’ facilities and only house growing pigs for market.
Some farms, such as Rivalea, at Corowa, are completely vertically integrated, with production and supply chains part of the one organisation. Most, though, are family farms, some operating as second- or third-generation enterprises.
The last 10 years has seen an increase in interest in outdoor production systems. NSW has the highest proportion of small-scale farmers in this category. There are exciting developments in this area, but they also come with increased biosecurity risk due to the populations of feral pigs in Australia and the endemic diseases that they carry, such as brucellosis (Brucella suis) and leptospirosis, which are also contagious to humans (zoonotic).
Production of pigs of bacon weight (75–85 kg carcase) takes about a 10-month turnaround from conception in the sow to slaughter of the pig (gestation 115 days, lactation 28 days, and wean-to-finish 20–22 weeks). Heavy pigs are more profitable for conventional intensive farms. Efficient farms aim at 2.4 litters per sow per year.
Small-scale growers and free-range producers tend to target niche markets, and pigs produced for sale range from weaners to bacon weight. Production system efficiency is very variable in this group, with producers having a range of goals from lifestyle to speciality producers.
Climate change and the growing world human population are the big challenges facing agriculture. Opinions vary widely on how best to meet these challenges. One facet of the argument supports intensive specialist agriculture and technology-based solutions; another facet seeks a more ecological agriculture and changes to the human diet.
Intensive systems in the pork industry are very efficient in terms of resource use, and the industry is a leader among the livestock industries in methods to reduce the carbon footprint of production. However, this section of the industry is under attack from the animal welfare lobby because animal welfare is perceived as poor.
Free-range systems are perceived as being more welfare friendly, but management has the greatest influence on animal welfare, not production system. Conversely, there are concerns about the environmental impact of outdoor systems.
It is likely that all systems will have a role in our future food supply; efficiency of production and effective management of the systems will be crucial to their success.

NSW Pork Industry Overview 2015
3 NSW Department of Primary Industries, September 2015
Industry facts • The pork industry is the only livestock industry in Australia competing with imports. • Denmark, the USA, Canada and the Netherlands are the major sources of Australia’s
processed pork product imports (~$600 million) (APL 2015a). • Australians consume 25 kg of pork products annually (includes fresh and processed pork), of
which half is imported. • Per-capita fresh pork consumption is approximately 9.8 kg, with an annual growth of 182 g
per person per year over the last 5 years (APL 2015a). • Australia and NSW produce pork predominantly for the fresh pork market, and approximately
30% of processed products. • Australia exports 13% of its production, mainly to Singapore, New Zealand, PNG, the
Philippines and Hong Kong (APL 2015a). • NSW produces around 815 000 pigs annually. This is 16.6% of Australia’s total of 4.9 million
pigs (APL 2015a). • Globally, around 7.35 million tonnes of pork was exported in 2012, which is approximately 21
times Australia’s current production of pork (APL 2015). • Australia exports around 35 000 tonnes per year, which gave Australian pork a 0.5% share of
the international pork trade in 2012. • NSW has the largest number of pig farms in Australia with fewer than 50 sows. • NSW has the greatest polarisation of pig production, with 72% of sows on 2% of the farms
and 7% of sows on 81% of the farms. • Since 1960, Australia’s number of farms producing pigs has dropped by 97%. • NSW suffers from a lack of pork processing facilities and faces significant transport costs
from farm to slaughter. Costs for slaughter include interstate levies for interstate pork health programs.
NSW Pork Industry Overview 2015
4 NSW Department of Primary Industries, September 2015
Current situation of the NSW pork industry In NSW, 72% of sows are farmed on just over 2% of the state’s farms, which have 500 or more sows; these farms produce the majority of the pork in NSW. Conversely, only 7% of sows are farmed on 81% of the state’s farms, which have 50 or fewer sows. This is the highest proportion of small-scale pig farms in Australia.
Five abattoirs process pigs in NSW, but their locations mean long freight journeys for many pigs. Two of these are export-licensed abattoirs, at opposite ends of the state: Booyong Service Processing, at Booyong, near Lismore, and Rivalea, at Corowa.
The abattoirs at Cowra, Wollondilly and Frederickton are multi-species domestic-licensed abattoirs. Hawkesbury Valley Meats at Wilberforce also kills a small number of pigs.
A lot of pigs in southern NSW travel into Victoria for slaughter, especially those from producers requiring export-licensed abattoirs. Victoria charges a sales tax, the Victorian Swine Duty (up to 16¢ per pig in 2010), on all pigs slaughtered on top of the slaughter levy. Approaches at the ministerial level to have this tax refunded to NSW producers have been unsuccessful.
Some processors offer transport subsidies to their producers if there is a long journey to the abattoir to offset transport costs.
The Rivalea abattoir at Corowa is a private abattoir that slaughters only Rivalea pigs. Rivalea produces approximately 18% of Australia’s pork; 30% of this is exported, mainly to Singapore (Tonkin 2015).
Pork production on the North Coast of NSW has been in decline, and the Northern Co-operative Meats Booyong Service Processing plant relies on pigs from Queensland to maintain throughput. A recent investigation revealed that this abattoir is operating at about 70% of capacity. A strategic plan for the potential for industry expansion in the Northern Rivers area was released in July 2015 (Fletcher 2015).
In 2010, the export-licensed Burrangong abattoir at Young went into receivership and closed. It had processed pigs, sheep and cattle. It reopened in 2014 but only for sheep and cattle. Pigs were excluded as the site was constrained by its proximity to homes, and its Halal certification required separate kill facilities for pigs. Producers in the region requiring export-licensed abattoirs must now send their pigs to Melbourne.
In November 2012, the abattoir at Coonabarabran closed. It had killed a small number of pigs. It may reopen, but nothing definite has been stated. Pigs are now sent to Frederickton, near Kempsey, on the North Coast; Cowra, in the Central West; or Wollondilly, near Picton.
NSW Pork Industry Overview 2015
5 NSW Department of Primary Industries, September 2015
Current situation of the Australian pork industry The Australian pork industry employs more than 20 000 people and contributes approximately $2.8 billion in gross domestic product to the economy. Around 1500 pig farmers produce around 4.8 million pigs annually, accounting for 2.13% of total Australian farm production (APL 2014). Sow herd size is the main farm descriptor, although some farms grow out pigs and have no sows.
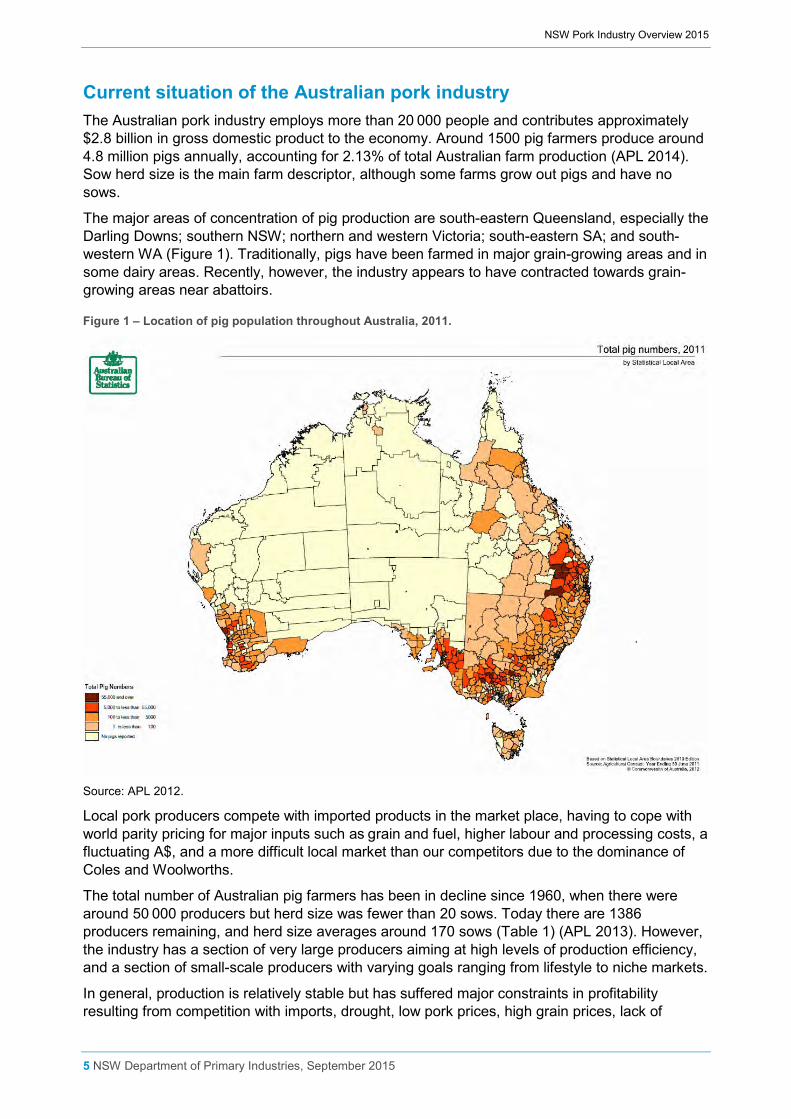
The major areas of concentration of pig production are south-eastern Queensland, especially the Darling Downs; southern NSW; northern and western Victoria; south-eastern SA; and south-western WA (Figure 1). Traditionally, pigs have been farmed in major grain-growing areas and in some dairy areas. Recently, however, the industry appears to have contracted towards grain-growing areas near abattoirs.
Figure 1 – Location of pig population throughout Australia, 2011.
Source: APL 2012.
Local pork producers compete with imported products in the market place, having to cope with world parity pricing for major inputs such as grain and fuel, higher labour and processing costs, a fluctuating A$, and a more difficult local market than our competitors due to the dominance of Coles and Woolworths.
The total number of Australian pig farmers has been in decline since 1960, when there were around 50 000 producers but herd size was fewer than 20 sows. Today there are 1386 producers remaining, and herd size averages around 170 sows (Table 1) (APL 2013). However, the industry has a section of very large producers aiming at high levels of production efficiency, and a section of small-scale producers with varying goals ranging from lifestyle to niche markets.
In general, production is relatively stable but has suffered major constraints in profitability resulting from competition with imports, drought, low pork prices, high grain prices, lack of
NSW Pork Industry Overview 2015
6 NSW Department of Primary Industries, September 2015
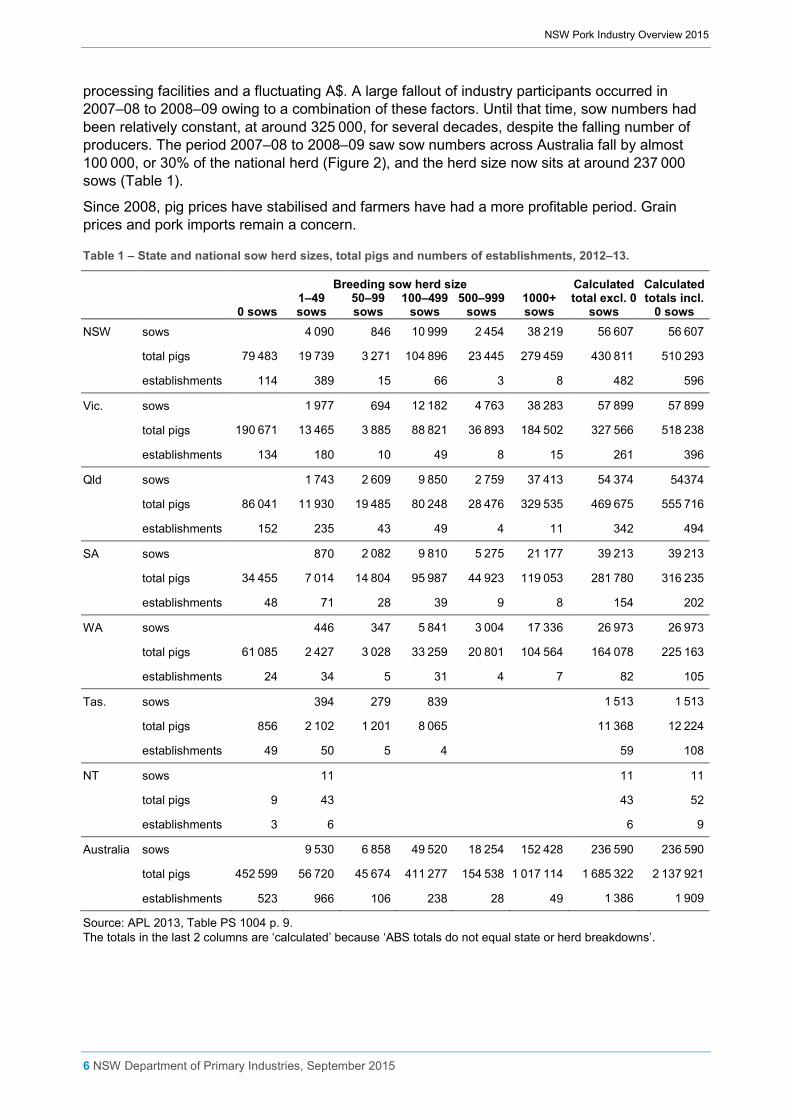
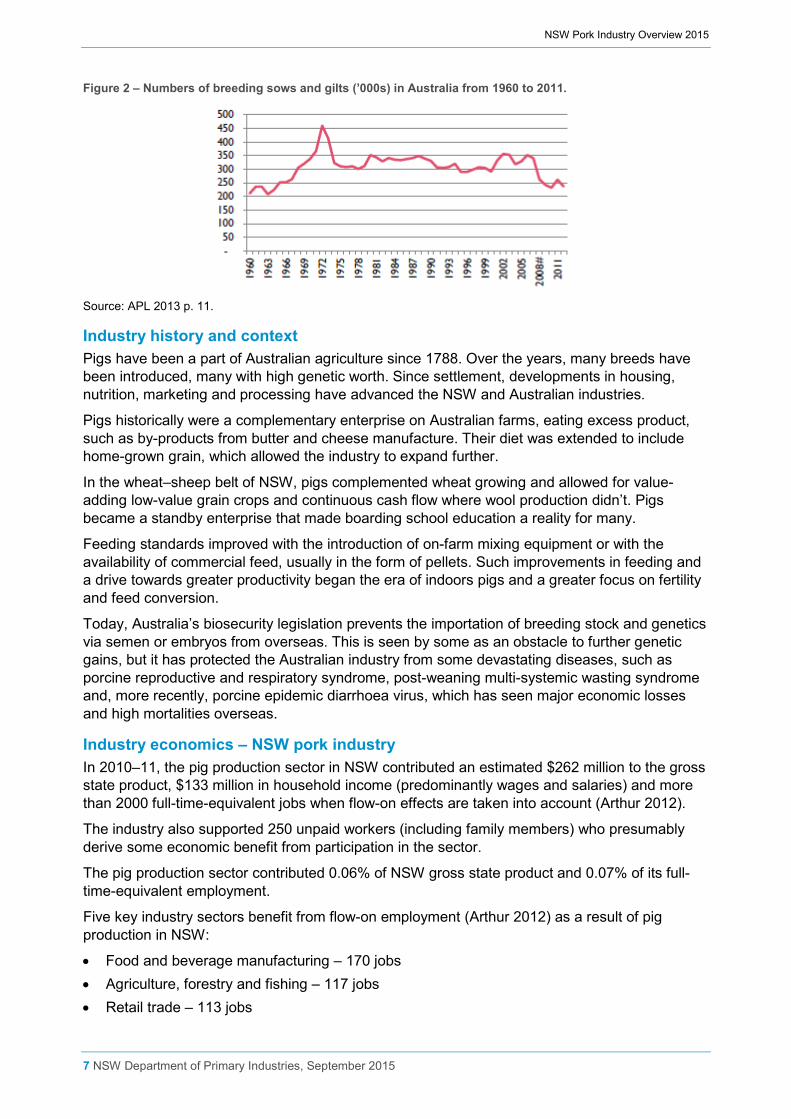
processing facilities and a fluctuating A$. A large fallout of industry participants occurred in 2007–08 to 2008–09 owing to a combination of these factors. Until that time, sow numbers had been relatively constant, at around 325 000, for several decades, despite the falling number of producers. The period 2007–08 to 2008–09 saw sow numbers across Australia fall by almost 100 000, or 30% of the national herd (Figure 2), and the herd size now sits at around 237 000 sows (Table 1).
Since 2008, pig prices have stabilised and farmers have had a more profitable period. Grain prices and pork imports remain a concern.
Table 1 – State and national sow herd sizes, total pigs and numbers of establishments, 2012–13.
Breeding sow herd size Calculated total excl. 0
sows
Calculated totals incl.
0 sows 0 sows 1–49 sows
50–99 sows
100–499 sows
500–999 sows
1000+ sows
NSW sows
4 090 846 10 999 2 454 38 219 56 607 56 607
total pigs 79 483 19 739 3 271 104 896 23 445 279 459 430 811 510 293
establishments 114 389 15 66 3 8 482 596
Vic. sows
1 977 694 12 182 4 763 38 283 57 899 57 899
total pigs 190 671 13 465 3 885 88 821 36 893 184 502 327 566 518 238
establishments 134 180 10 49 8 15 261 396
Qld sows
1 743 2 609 9 850 2 759 37 413 54 374 54374
total pigs 86 041 11 930 19 485 80 248 28 476 329 535 469 675 555 716
establishments 152 235 43 49 4 11 342 494
SA sows
870 2 082 9 810 5 275 21 177 39 213 39 213
total pigs 34 455 7 014 14 804 95 987 44 923 119 053 281 780 316 235
establishments 48 71 28 39 9 8 154 202
WA sows
446 347 5 841 3 004 17 336 26 973 26 973
total pigs 61 085 2 427 3 028 33 259 20 801 104 564 164 078 225 163
establishments 24 34 5 31 4 7 82 105
Tas. sows
394 279 839 1 513 1 513
total pigs 856 2 102 1 201 8 065 11 368 12 224
establishments 49 50 5 4 59 108
NT sows
11 11 11
total pigs 9 43 43 52
establishments 3 6 6 9
Australia sows 9 530 6 858 49 520 18 254 152 428 236 590 236 590
total pigs 452 599 56 720 45 674 411 277 154 538 1 017 114 1 685 322 2 137 921
establishments 523 966 106 238 28 49 1 386 1 909
Source: APL 2013, Table PS 1004 p. 9. The totals in the last 2 columns are ‘calculated’ because ‘ABS totals do not equal state or herd breakdowns’.
NSW Pork Industry Overview 2015
7 NSW Department of Primary Industries, September 2015
Figure 2 – Numbers of breeding sows and gilts (’000s) in Australia from 1960 to 2011.
Source: APL 2013 p. 11.
Industry history and context Pigs have been a part of Australian agriculture since 1788. Over the years, many breeds have been introduced, many with high genetic worth. Since settlement, developments in housing, nutrition, marketing and processing have advanced the NSW and Australian industries.
Pigs historically were a complementary enterprise on Australian farms, eating excess product, such as by-products from butter and cheese manufacture. Their diet was extended to include home-grown grain, which allowed the industry to expand further.
In the wheat–sheep belt of NSW, pigs complemented wheat growing and allowed for value-adding low-value grain crops and continuous cash flow where wool production didn’t. Pigs became a standby enterprise that made boarding school education a reality for many.
Feeding standards improved with the introduction of on-farm mixing equipment or with the availability of commercial feed, usually in the form of pellets. Such improvements in feeding and a drive towards greater productivity began the era of indoors pigs and a greater focus on fertility and feed conversion.
Today, Australia’s biosecurity legislation prevents the importation of breeding stock and genetics via semen or embryos from overseas. This is seen by some as an obstacle to further genetic gains, but it has protected the Australian industry from some devastating diseases, such as porcine reproductive and respiratory syndrome, post-weaning multi-systemic wasting syndrome and, more recently, porcine epidemic diarrhoea virus, which has seen major economic losses and high mortalities overseas.
Industry economics – NSW pork industry In 2010–11, the pig production sector in NSW contributed an estimated $262 million to the gross state product, $133 million in household income (predominantly wages and salaries) and more than 2000 full-time-equivalent jobs when flow-on effects are taken into account (Arthur 2012).
The industry also supported 250 unpaid workers (including family members) who presumably derive some economic benefit from participation in the sector.
The pig production sector contributed 0.06% of NSW gross state product and 0.07% of its full-time-equivalent employment.
Five key industry sectors benefit from flow-on employment (Arthur 2012) as a result of pig production in NSW:
• Food and beverage manufacturing – 170 jobs • Agriculture, forestry and fishing – 117 jobs • Retail trade – 113 jobs
NSW Pork Industry Overview 2015
8 NSW Department of Primary Industries, September 2015
• Transport, postal and warehousing – 112 jobs • Professional, scientific and technical services – 86 jobs
Pork production systems Pork production systems fall into three main categories: conventional intensively housed, outdoor-bred (breeding sows are held outdoors and growing pigs are housed indoors) and free-range (all pigs are held outdoors all the time). Other combinations are possible. Buildings for intensive pork production are purpose built and expensive – around $6000 per sow place.
In November 2010, the pork industry voted to move to group housing for gestating sows by 2017, away from the use of gestation stalls in the intensive indoor system. The move has been welcomed by some animal welfare organisations, but pressure still remains from animal activist groups. It is estimated that 70% of sows are currently housed in group housing (The Land 4 August 2015). The industry defines ‘sow stall free’ thus:
Sows and gilts are kept in loose (group) housing from at least 5 days after the last mating until 1 week before farrowing. In loose housing, sows and gilts – either singularly or in groups – have freedom of movement to turn around and extend their limbs. Housing must meet the space allowance requirements of the Model Code of Practice for the Welfare of Pigs, 3rd edition (2007). Where a pen is used to confine a sow individually during gestation (up to 1 week before farrowing); the sow must have freedom of movement.
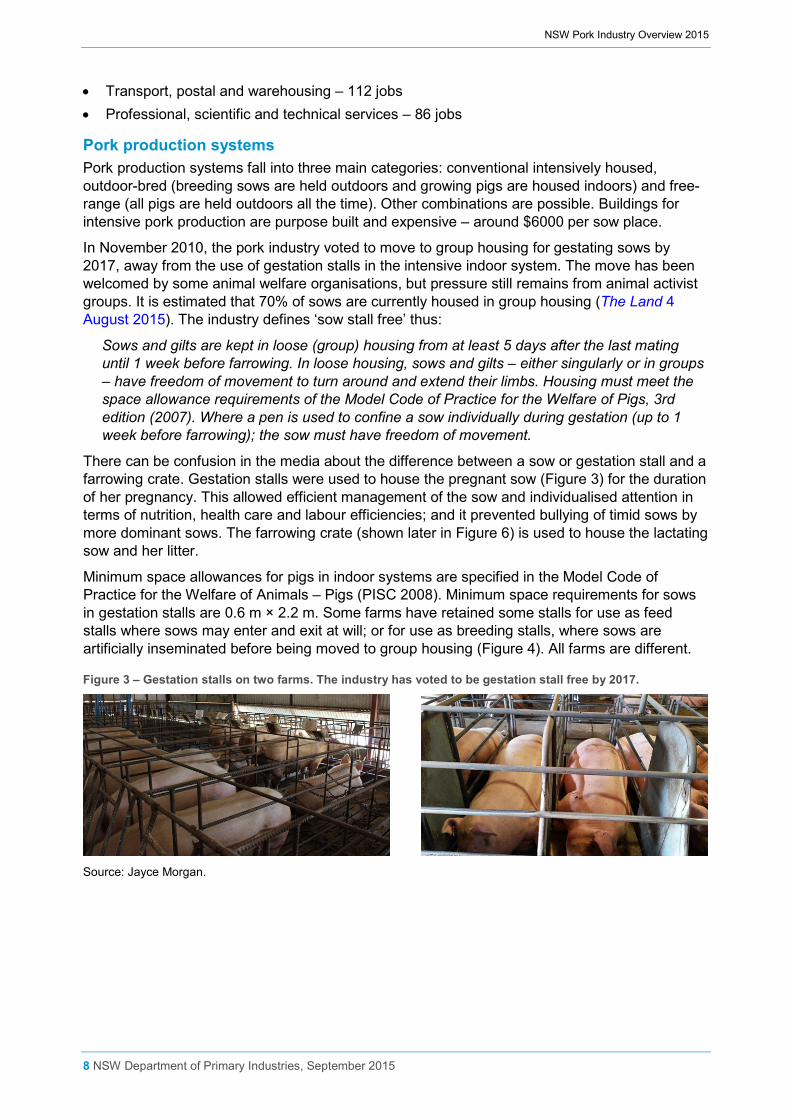
There can be confusion in the media about the difference between a sow or gestation stall and a farrowing crate. Gestation stalls were used to house the pregnant sow (Figure 3) for the duration of her pregnancy. This allowed efficient management of the sow and individualised attention in terms of nutrition, health care and labour efficiencies; and it prevented bullying of timid sows by more dominant sows. The farrowing crate (shown later in Figure 6) is used to house the lactating sow and her litter.
Minimum space allowances for pigs in indoor systems are specified in the Model Code of Practice for the Welfare of Animals – Pigs (PISC 2008). Minimum space requirements for sows in gestation stalls are 0.6 m × 2.2 m. Some farms have retained some stalls for use as feed stalls where sows may enter and exit at will; or for use as breeding stalls, where sows are artificially inseminated before being moved to group housing (Figure 4). All farms are different.
Figure 3 – Gestation stalls on two farms. The industry has voted to be gestation stall free by 2017.
Source: Jayce Morgan.

NSW Pork Industry Overview 2015
9 NSW Department of Primary Industries, September 2015
Figure 4 – Group housing of sows allows the sows to move freely within the pen. Some farms house their sows on straw, while others, such as in this photo, use concrete floors for ease of cleaning.
Source: Jayce Morgan.
The issues for farmers converting to group housing include costly remodelling of the internal steel and concrete areas of the sheds. The need for more sow space may require new, larger sheds and the need for approvals from regulators. Farmers have not received any government support for remodelling of pig sheds. Group housing is a more challenging system and has required new management techniques and further training of staff.
Some farmers (usually on the larger operations) use electronic sow feeders (Figure 5). These rely on tagging of sows with an electronic ear tag. The system records sow visits to the feeder, the amount eaten and the time of day. When a sow’s behaviour pattern changes relative to established behaviour, it can indicate health or reproductive problems, and the sow can be drafted out of the group for treatment.
Outdoor systems are perceived to have better pig welfare, but this depends on management. The sows are not confined, but mortalities can be significantly higher in outdoor systems. White pigs are susceptible to sunburn, so many small-scale farmers seek coloured breeds, such as Berkshire, Tamworth, Large Black, Hampshire and Wessex Saddleback. These pigs have not been as heavily selected for high growth performance as the Large White, Landrace and Duroc breeds, which form the major commercial lines. Outdoor breeders rely heavily on crossbreeding, and white boars are popular to add growth and improve carcases.
Farrowing crates are designed to protect piglets from being laid on by their mothers. They ensure maximum survival of the piglets and ease of assistance to sows in difficulty at farrowing. Sows can weigh 150 to 250 kg. Lying on piglets is the major cause of death in the first 3 days after birth. Farrowing crates do confine a sow during her lactation (about 25 days).
Critics of farrowing crates cite deprivation of the sow’s nest building instincts and restricted movement as the major problems with their use. Research around the world is investigating better options (Figure 6). However, at this point, no system protects piglets as well as the farrowing crate. The trade-off for piglets’ survival is sow confinement during lactation, and farmers await a scientifically proven replacement system. Newly farrowed sows can also be very protective of their litter, and this can pose hazards for stock attendants.
NSW Pork Industry Overview 2015
10 NSW Department of Primary Industries, September 2015
Figure 5 – Views of the interior of two electronic sow feeders available in Australia (left, Skold ESF DM3; right, Osborne Industries TEAM). The feeder protects the sow from bullying while she eats, and records statistics such as time of entry and amount eaten.
Source: Jayce Morgan.
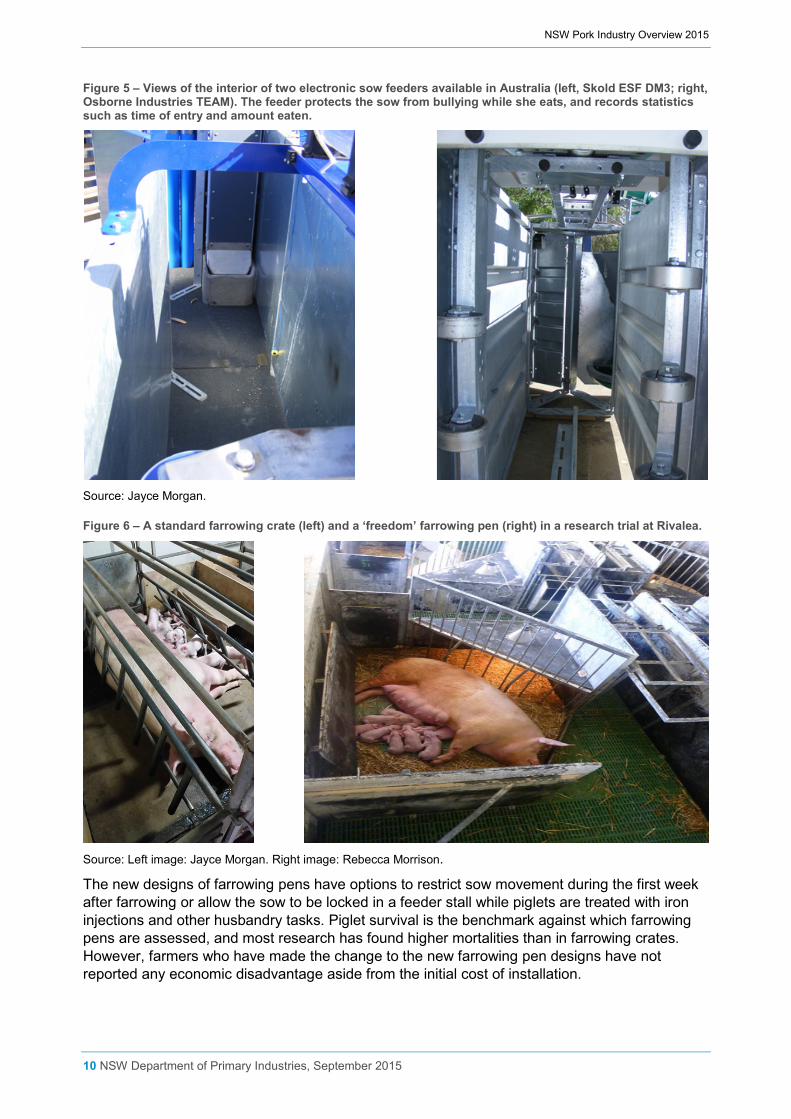
Figure 6 – A standard farrowing crate (left) and a ‘freedom’ farrowing pen (right) in a research trial at Rivalea.
Source: Left image: Jayce Morgan. Right image: Rebecca Morrison.
The new designs of farrowing pens have options to restrict sow movement during the first week after farrowing or allow the sow to be locked in a feeder stall while piglets are treated with iron injections and other husbandry tasks. Piglet survival is the benchmark against which farrowing pens are assessed, and most research has found higher mortalities than in farrowing crates. However, farmers who have made the change to the new farrowing pen designs have not reported any economic disadvantage aside from the initial cost of installation.
NSW Pork Industry Overview 2015
11 NSW Department of Primary Industries, September 2015
Changes and developments to housing and production systems within industry are ongoing. The Pork Cooperative Research Centre is funding many projects to establish better housing options for pigs while maintaining productivity (Morrison and Baxter 2013).
Marketing Pork production can include income from:
• pigs sold for meat in fresh and processed market segments • pigs sold to other farmers for breeding animals • semen sales from productive boars housed in registered breeding centres • pigs sold to other farmers for growing out and subsequent sale to processors • sales of manure and bedding as compost or fertiliser – the opportunities are not covered in
this section, but major research projects are looking at the environmental impacts of effluent and emissions and subsequent effluent uses.
The various niche markets tend to be serviced by smaller-scale pork producers, although some larger-scale farmers target these markets also. Some of these niches include organic pork, free-range pork, and weaner pigs for the spit pig market, on-line marketing and farmers’ markets. In some market niches such as organic pork, demand outstrips supply (Australian Organic Market Report 2014).
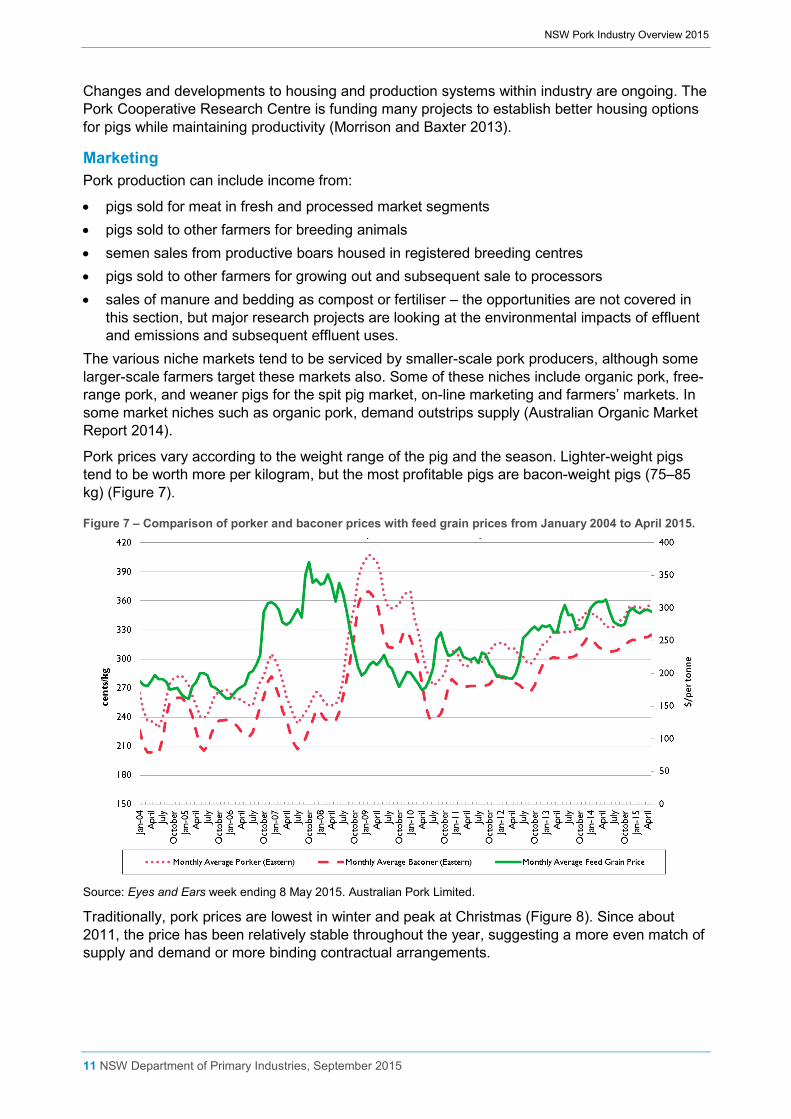
Pork prices vary according to the weight range of the pig and the season. Lighter-weight pigs tend to be worth more per kilogram, but the most profitable pigs are bacon-weight pigs (75–85 kg) (Figure 7).
Figure 7 – Comparison of porker and baconer prices with feed grain prices from January 2004 to April 2015.
Source: Eyes and Ears week ending 8 May 2015. Australian Pork Limited.
Traditionally, pork prices are lowest in winter and peak at Christmas (Figure 8). Since about 2011, the price has been relatively stable throughout the year, suggesting a more even match of supply and demand or more binding contractual arrangements.
NSW Pork Industry Overview 2015
12 NSW Department of Primary Industries, September 2015
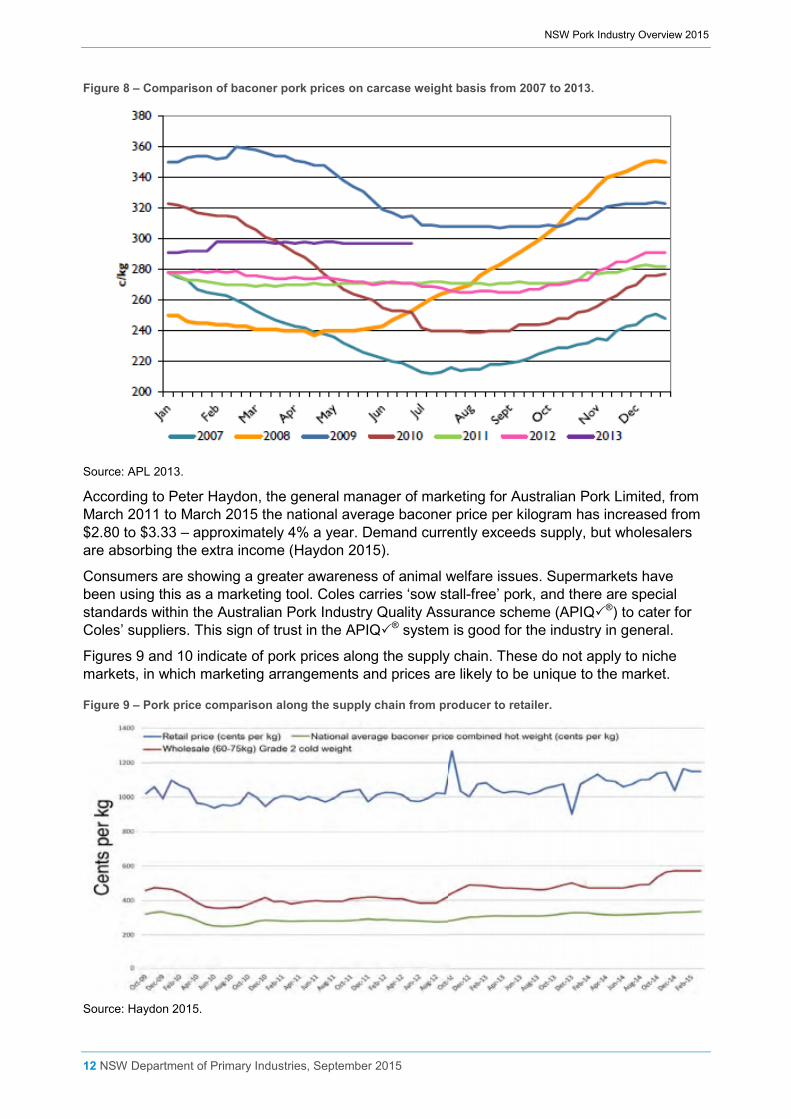
Figure 8 – Comparison of baconer pork prices on carcase weight basis from 2007 to 2013.
Source: APL 2013.
According to Peter Haydon, the general manager of marketing for Australian Pork Limited, from March 2011 to March 2015 the national average baconer price per kilogram has increased from $2.80 to $3.33 – approximately 4% a year. Demand currently exceeds supply, but wholesalers are absorbing the extra income (Haydon 2015).
Consumers are showing a greater awareness of animal welfare issues. Supermarkets have been using this as a marketing tool. Coles carries ‘sow stall-free’ pork, and there are special standards within the Australian Pork Industry Quality Assurance scheme (APIQ®) to cater for Coles’ suppliers. This sign of trust in the APIQ® system is good for the industry in general.
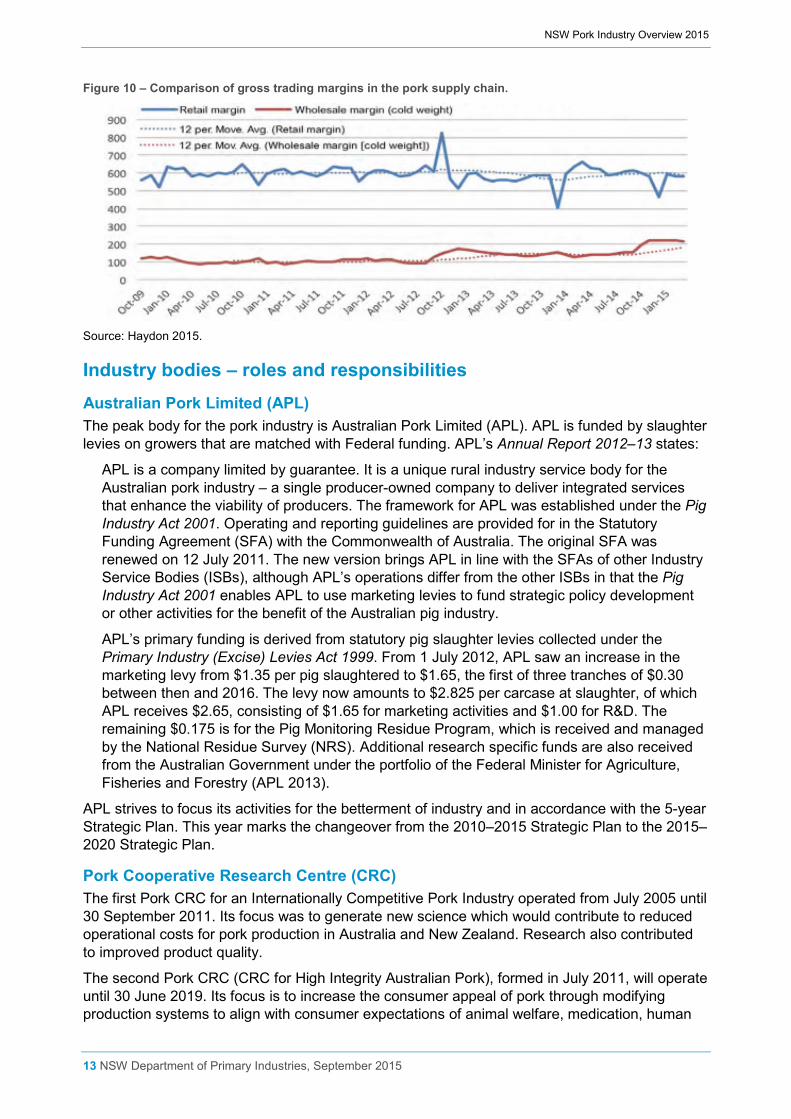
Figures 9 and 10 indicate of pork prices along the supply chain. These do not apply to niche markets, in which marketing arrangements and prices are likely to be unique to the market.
Figure 9 – Pork price comparison along the supply chain from producer to retailer.
Source: Haydon 2015.
NSW Pork Industry Overview 2015
13 NSW Department of Primary Industries, September 2015
Figure 10 – Comparison of gross trading margins in the pork supply chain.
Source: Haydon 2015.
Industry bodies – roles and responsibilities Australian Pork Limited (APL) The peak body for the pork industry is Australian Pork Limited (APL). APL is funded by slaughter levies on growers that are matched with Federal funding. APL’s Annual Report 2012–13 states:
APL is a company limited by guarantee. It is a unique rural industry service body for the Australian pork industry – a single producer-owned company to deliver integrated services that enhance the viability of producers. The framework for APL was established under the Pig Industry Act 2001. Operating and reporting guidelines are provided for in the Statutory Funding Agreement (SFA) with the Commonwealth of Australia. The original SFA was renewed on 12 July 2011. The new version brings APL in line with the SFAs of other Industry Service Bodies (ISBs), although APL’s operations differ from the other ISBs in that the Pig Industry Act 2001 enables APL to use marketing levies to fund strategic policy development or other activities for the benefit of the Australian pig industry.
APL’s primary funding is derived from statutory pig slaughter levies collected under the Primary Industry (Excise) Levies Act 1999. From 1 July 2012, APL saw an increase in the marketing levy from $1.35 per pig slaughtered to $1.65, the first of three tranches of $0.30 between then and 2016. The levy now amounts to $2.825 per carcase at slaughter, of which APL receives $2.65, consisting of $1.65 for marketing activities and $1.00 for R&D. The remaining $0.175 is for the Pig Monitoring Residue Program, which is received and managed by the National Residue Survey (NRS). Additional research specific funds are also received from the Australian Government under the portfolio of the Federal Minister for Agriculture, Fisheries and Forestry (APL 2013).
APL strives to focus its activities for the betterment of industry and in accordance with the 5-year Strategic Plan. This year marks the changeover from the 2010–2015 Strategic Plan to the 2015–2020 Strategic Plan.
Pork Cooperative Research Centre (CRC) The first Pork CRC for an Internationally Competitive Pork Industry operated from July 2005 until 30 September 2011. Its focus was to generate new science which would contribute to reduced operational costs for pork production in Australia and New Zealand. Research also contributed to improved product quality.
The second Pork CRC (CRC for High Integrity Australian Pork), formed in July 2011, will operate until 30 June 2019. Its focus is to increase the consumer appeal of pork through modifying production systems to align with consumer expectations of animal welfare, medication, human
NSW Pork Industry Overview 2015
14 NSW Department of Primary Industries, September 2015
nutrition and carbon consciousness while still remaining competitive in terms of cost structure within the industry.
The Pork CRC manages four main programs and two additional ones needed to complete earlier research that will be important to the Australian industry’s competitiveness:
1. Confinement-free sow and piglet management, focusing on innovative management and housing systems to optimise welfare while maintaining productivity and profitability.
2. Herd health management, focusing on enhancing animal health while reducing antibiotic use. Research will investigate novel diagnostic tools and will better characterise pathogens.
3. Healthy pork consumption, focusing on the High Integrity Australian Pork concept, with quality assessment and assurance tools for the Australian and export markets.
4. Carbon-conscious nutrient input and output, focusing on effluent emission reduction and researching alternative nutrient sources.
5. Improving sow reproduction efficiency. 6. Nutritional manipulations to enhance the performance and feed efficiency of growing pigs. The DPI is a participant in the Pork CRC (Pork CRC 2013).
NSW Farmers Pork Committee The NSW Farmers Pork Committee represents pork producers at a state level. They lobby government as well as providing other services such as industrial relations advice.
The Pork Committee meets usually three times a year and in various locations throughout NSW. Pork producers are encouraged to participate, and the committee hosts seminars and dinners that follow committee meetings open to all pork producers.
The committee is made up of pork producers prepared to devote some of their time to lobbying government or industry organisations on behalf of producers. The representatives are elected annually.
Other industry groups The Free Range Pastured Pork Farmers group represents some free-range pork producers that feel disenfranchised with mainstream industry. It has its own quality assurance system to verify free-range production, called PROOF (http://www.proof.net.au/).
Industry legislation The pork industry operates within various NSW State regulations and national codes of practice. Pig farms must operate within these regulations and codes of practice.
Animal welfare Prevention of Cruelty to Animals Act 1979, commonly referred to as POCTA
Prevention of Cruelty to Animals Regulation 2012
Prevention of Cruelty to Animals (Land Transport of Livestock) Standards 2013, No. 2, Part 11, Pigs
This outlines the principles that everyone involved in livestock transport must use to protect the welfare of all livestock in their care.
All people involved in the livestock transport process, from assembling livestock to handling at their final destination, are expected to conduct themselves in accordance with these Standards. Mandated under POCTA Regulation 2012, Clause 25/26
NSW Pork Industry Overview 2015
15 NSW Department of Primary Industries, September 2015
Australian Animal Welfare Standards and Guidelines Land Transport of Livestock, 2012
The provisions in the NSW Standards reflect those in the Australian Animal Welfare Standards and Guidelines, which received final endorsement by the Standing Committee on Primary Industries for national implementation into state legislation on 21 September 2012
Animal Welfare Code of Practice – Commercial Pig Production, 2009
This code of practice applies to businesses which keep pigs for commercial purposes. Mandated under POCTA Regulation 2012 Clause 25/26
Model Code of Practice for the Welfare of Animals – Pigs, 3rd edition, 2008 (national code)
The provisions in the NSW Standards reflect the national Model Code of Practice
Model Code of Practice: Animals at Saleyards, 1991 (national)
Guideline under POCTA Section 34 A (1). Currently being finalised for endorsement
Model Code of Practice: Livestock at Slaughtering Establishments, 2001
Guideline only. National abattoir standards and guidelines are under development
Animal health and biosecurity A biosecurity act to protect NSW from the adverse effects of pests, diseases, weeds and contaminants has been proposed. The Biosecurity Bill 2015 contains the legislative tools and powers to do this.
The proposed Act will wholly or partly replace 14 pieces of existing biosecurity legislation. A consistent approach to managing biosecurity threats to environmental, community and economic assets will make it easier for stakeholders and regulators to effectively manage biosecurity risks.
The proposed Act will support industry and jobs growth in NSW by helping us to maintain internationally recognised biosecurity and food quality standards, facilitating faster and more targeted government responses in emergency situations, and supporting industry-led biosecurity solutions and market access schemes.
Animal Diseases and Animal Pests (Emergency Outbreaks) Act 1991 (formerly Exotic Diseases of Animals Act) (will be replaced by the Biosecurity Act)
Provides for the detection, containment and eradication of certain diseases affecting livestock and other animals. Includes ‘duty to notify’ provisions for stock owners and veterinarians for suspicious and unusual diseases
Animal Diseases and Animal Pests (Emergency Outbreaks) Regulation 2012
Stock Diseases Act 1923 (will be replaced by the Biosecurity Act)
Stock Diseases Regulation 2009
Includes provisions for stock identification and traceability and prohibited substances when feeding pigs. Several orders under the Act pertain to identification for pigs and the need for property identification codes.
Agriculture and Veterinary Chemicals (New South Wales) Act 1994
An Act to apply certain laws of the Commonwealth relating to agricultural and veterinary chemical products as laws of NSW
Agriculture and Veterinary Chemicals (New South Wales) Regulation 2015
NSW Pork Industry Overview 2015
16 NSW Department of Primary Industries, September 2015
Stock Medicines Act 1989 (will be replaced by the Biosecurity Act)
An Act relating to medicines for stock and other animals for the purposes of enhancing the quality of agricultural production, protecting the environment and safeguarding the health of stock and other animals; and for other purposes
Stock Medicines Regulation 2010
Includes provisions for stock food that has been treated with stock medicine and records to be kept by veterinary practitioners when prescribing stock medicines
Stock Foods Act 1940 (will be replaced by the Biosecurity Act)
An Act to regulate the sale of food for stock; and for other purposes
Stock Foods Regulation 2010
Includes provisions for packaging, labelling and foreign ingredients
Stock (Chemical Residues) Act 1975 (will be replaced by the Biosecurity Act)
An Act to prevent the slaughter for human consumption of stock which contain certain concentrations of residues of chemicals or which are otherwise chemically affected; to prevent stock from becoming chemically affected; and for purposes connected therewith
Stock (Chemical Residues) Regulation 2010
Includes provisions for the handling and disposal for stock with chemical residues
Local Land Services Act 2013 (Part 10 Pests will be replaced by the Biosecurity Act)
This legislation makes NSW the only state where publicly funded biosecurity, natural resource management and agricultural advisory services are provided by a single organisation
Local Land Services Regulation 2014
This regulation includes the particulars for rate collection, animal health and biosecurity, and the control of feral animals and noxious plants.
Environment and land protection Environment Planning and Assessment Act 1979
Provides for a hierarchy of environmental planning instruments, which include State Environmental Planning Policies and Local Environment Plans.
State Environmental Planning Policy No. 30, Intensive Agriculture, requires persons wishing to keep 20 or more sows or 200 or more pigs to obtain consent from the consenting authority, usually local government. The consenting authority must consider the adequacy of the information provided in the development application in relation to the environmental impact of the operation, particularly odours, pollution of surface and ground waters, soil degradation, mitigation strategies, site suitability, applicant’s compliance with relevant industry codes of practice for animal health and welfare, and consistency of proposal with the environmental planning and assessment aspects of any published guidelines.
Local Environment Plans are linked to the local government area and include land zoning and land uses which are allowed with approval or which are prohibited.
Protection of the Environment Operations Act 1997
Piggeries (larger than 200 sows or 2000 pigs) and their operations are licensed under this act by the Environment Protection Authority of NSW.
NSW Pork Industry Overview 2015
17 NSW Department of Primary Industries, September 2015
Meat industry levy Every occupier of land liable to pay an animal health rate to Local Land Services is required also to pay a meat industry levy. How the levy is calculated is prescribed in the Meat Industry Act 1978 and the Meat Industry (Meat Industry Levy) Regulation 2006. The average meat industry levy per year is $14, and the maximum levy payable is $130. The levy is used to ensure the food safety of meat (NSW Food Authority).
Specific industry codes of practice and guidelines Model Code of Practice for the Welfare of Animals Pigs, 3rd Edition, 2008 – Primary Industries Standing Committee Report No. 92
Code of Practice for On-Farm Biogas Production and Use (Piggeries), April 2015 – APL
National Environmental Guidelines for Piggeries, 2nd Edition, 2010 – APL
National Environmental Guidelines for Rotational Outdoor Piggeries 2013 – APL
NSW Biosecurity Strategy 2013–2021 The NSW Biosecurity Strategy 2013–2021 establishes a clear vision for how NSW will manage biosecurity threats, including plant and animal pests, diseases and weeds. The most important goal is that biosecurity be recognised as a shared responsibility. The planned NSW Biosecurity Act is under development via consultation with industry.
Current issues affecting the NSW and Australian pork industries Costs of production in Australia Accurate estimates of the costs of production are difficult because not many farmers are forthcoming with their information. An article in the Australian Pork Newspaper suggested that the cost of production ranged from $2.45 to $3.20 per kg carcase weight (Campbell 2015). Some outdoor producers we asked suggested that their cost was more like $3.40 to $3.60 per kg.
Costs of production are influenced mostly by feed, labour and power or energy costs. For many farms, transport from farm to abattoir is also a significant cost.
Feed constitutes about 55% to 60% of the costs, although the quoted range is often 50% to 70%. Costs of production are affected by grain price fluctuations due to drought, the A$ and world demand, since much of Australian grain production is geared for export.
Some farms can reduce feed costs by taking advantage of by-products from the human food chain, but not all farms are set up for the removal of packaging that can be present. In addition, by-product and waste product streams can be unpredictable, and larger producers want the continuity of supply and quality that a regular feed mix provides.
If grain is $300 per tonne, the extra costs to make this a pig ration can add $50 to $100 per tonne depending on the cost of processing (grinding the grain, mixing the ration, pelleting), the cost of additives to make the ration and their relative proportions in the mix, the cost of delivery, and the individual farm’s efficiency in the conversion of feed to meat, which will determine how much feed is used to produce 1 kg of pork.
Outdoor farms tend to have 10% to 15% higher feed usage, owing partly to weather and to the form of the feed (pellets or mash) – the larger pellet size favoured by some outdoor producers is more expensive, but users of mash diets can have higher wastage, especially if pigs are fed on the ground.
Labour costs are more significant on larger farms, but this can also be a reporting bias – family farms have historically tended to underestimate their own labour contributions.
NSW Pork Industry Overview 2015
18 NSW Department of Primary Industries, September 2015
Power costs for piggery operation tend to be highest in the farrowing shed for climate control and the provision of warmth for piglets, and for the feed mixing and delivery systems. Other energy costs include water and effluent pumps.
Some larger piggeries have invested in systems to use the methane from effluent ponds to generate power for use in the piggery and for sale of the surplus. This has turned energy costs to income, but the technology has size limits.
Sow herd costs within a management system vary little between numbers of pigs weaned per sow per year – sows still have to be fed, housed, bred, farrowed, weaned and replaced. Herd health status can have a large impact, with implications for piglet survival, sow longevity and herd health costs. A healthier herd with a high health status has lower health costs and better outcomes for pigs and producers.
Larger final carcase weight allows costs to be spread over a greater number of kilograms. Carcase weights for fresh pork rarely rise above 75 kg (15 to 75 kg depending on market niche), whereas pork producers overseas are producing carcases weighing over 90 kg.
Costs of production in comparison with overseas Costs of production in other countries were recently compared in the Australian Pork Newspaper (Table 2). The Australian results are based on the Pork CRC’s benchmarking project.
The key performance indicator for Australia is based on limited numbers and varies widely across the country. Depending on feed costs and herd feed conversion values, Australia’s cost of production ranges between $2.45 and $3.20 per kg carcase weight. This makes it difficult to compete with countries such as the USA, Canada and Brazil, which have much lower input costs, cheaper feed costs, heavier carcase weights, greater volume and therefore lower overhead costs than Australia.
The Netherlands and Denmark have more piglets born alive and weaned, and heavier carcase weights, reducing overall costs per kg. The average carcase weights produced per sow per year are 49% higher in the Netherlands and 35% higher in Denmark than in Australia.
The USA has made considerable improvement in reproduction over the last 5 to 8 years, increasing from about 11 piglets per sow per year to >14.
Australia, on the other hand, has good herd feed conversion efficiency but achieves only average results in reproduction. Producers averaged around 23.5 pigs weaned per sow per year during the last 3 to 5 years, while the Danish pig industry averages closer to 30.
Three major constraints or opportunities have been identified:
Pigs born alive is a function of management (wean-to-join interval of 5 days, <10% return to service, good herd parity structure), genetics, sow capability (robust and healthy, 14 functional teats) and nutrition (proper diet and amount fed for gilt development, dry sows and lactation).
The benchmark group average is only 11.1 piglets born alive, which makes it difficult to wean 24 pigs per sow per year. Some producers achieve 13 to 14 piglets born alive, so genetics may not be an issue. If pre-weaning losses can be maintained at ≤15%, then ≥25 pigs per sow per year are possible if 2.4 litters per sow per year can be achieved.
The difference in margin for pigs weaned per sow per year between the best three herds and the average equates to 7.7¢ per kg carcase weight, or $5.85 per pig (assuming a 76-kg carcase).
NSW Pork Industry Overview 2015
19 NSW Department of Primary Industries, September 2015
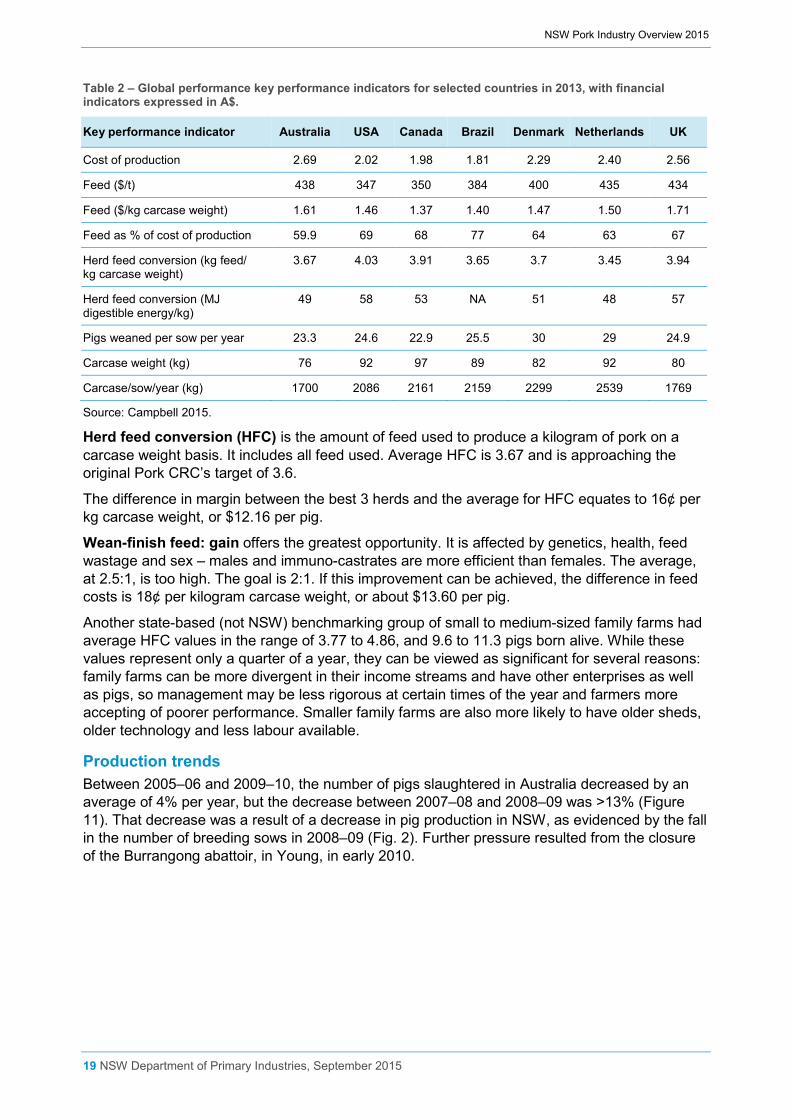
Table 2 – Global performance key performance indicators for selected countries in 2013, with financial indicators expressed in A$.
Key performance indicator Australia USA Canada Brazil Denmark Netherlands UK
Cost of production 2.69 2.02 1.98 1.81 2.29 2.40 2.56
Feed ($/t) 438 347 350 384 400 435 434
Feed ($/kg carcase weight) 1.61 1.46 1.37 1.40 1.47 1.50 1.71
Feed as % of cost of production 59.9 69 68 77 64 63 67
Herd feed conversion (kg feed/kg carcase weight)
3.67 4.03 3.91 3.65 3.7 3.45 3.94
Herd feed conversion (MJ digestible energy/kg)
49 58 53 NA 51 48 57
Pigs weaned per sow per year 23.3 24.6 22.9 25.5 30 29 24.9
Carcase weight (kg) 76 92 97 89 82 92 80
Carcase/sow/year (kg) 1700 2086 2161 2159 2299 2539 1769
Source: Campbell 2015.
Herd feed conversion (HFC) is the amount of feed used to produce a kilogram of pork on a carcase weight basis. It includes all feed used. Average HFC is 3.67 and is approaching the original Pork CRC’s target of 3.6.
The difference in margin between the best 3 herds and the average for HFC equates to 16¢ per kg carcase weight, or $12.16 per pig.
Wean-finish feed: gain offers the greatest opportunity. It is affected by genetics, health, feed wastage and sex – males and immuno-castrates are more efficient than females. The average, at 2.5:1, is too high. The goal is 2:1. If this improvement can be achieved, the difference in feed costs is 18¢ per kilogram carcase weight, or about $13.60 per pig.
Another state-based (not NSW) benchmarking group of small to medium-sized family farms had average HFC values in the range of 3.77 to 4.86, and 9.6 to 11.3 pigs born alive. While these values represent only a quarter of a year, they can be viewed as significant for several reasons: family farms can be more divergent in their income streams and have other enterprises as well as pigs, so management may be less rigorous at certain times of the year and farmers more accepting of poorer performance. Smaller family farms are also more likely to have older sheds, older technology and less labour available.
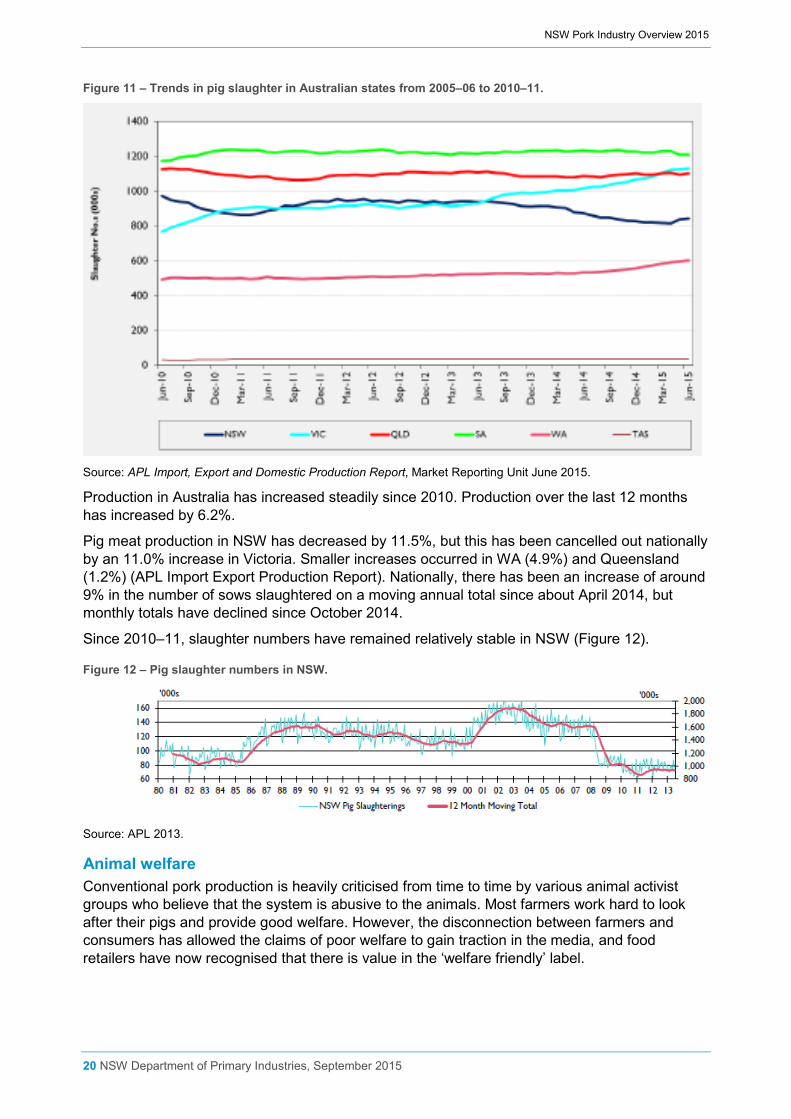
Production trends Between 2005–06 and 2009–10, the number of pigs slaughtered in Australia decreased by an average of 4% per year, but the decrease between 2007–08 and 2008–09 was >13% (Figure 11). That decrease was a result of a decrease in pig production in NSW, as evidenced by the fall in the number of breeding sows in 2008–09 (Fig. 2). Further pressure resulted from the closure of the Burrangong abattoir, in Young, in early 2010.
NSW Pork Industry Overview 2015
20 NSW Department of Primary Industries, September 2015
Figure 11 – Trends in pig slaughter in Australian states from 2005–06 to 2010–11.
Source: APL Import, Export and Domestic Production Report, Market Reporting Unit June 2015.
Production in Australia has increased steadily since 2010. Production over the last 12 months has increased by 6.2%.
Pig meat production in NSW has decreased by 11.5%, but this has been cancelled out nationally by an 11.0% increase in Victoria. Smaller increases occurred in WA (4.9%) and Queensland (1.2%) (APL Import Export Production Report). Nationally, there has been an increase of around 9% in the number of sows slaughtered on a moving annual total since about April 2014, but monthly totals have declined since October 2014.
Since 2010–11, slaughter numbers have remained relatively stable in NSW (Figure 12).
Figure 12 – Pig slaughter numbers in NSW.
Source: APL 2013.
Animal welfare Conventional pork production is heavily criticised from time to time by various animal activist groups who believe that the system is abusive to the animals. Most farmers work hard to look after their pigs and provide good welfare. However, the disconnection between farmers and consumers has allowed the claims of poor welfare to gain traction in the media, and food retailers have now recognised that there is value in the ‘welfare friendly’ label.
NSW Pork Industry Overview 2015
21 NSW Department of Primary Industries, September 2015
The pork industry in NSW has suffered many farm invasions by animal activists in the last 2 years. Unfortunately, these actions have resulted in vilification of farmers in social media. They also pose a biosecurity threat through the spread of diseases.
Biosecurity is a valuable management tool to keep pigs healthy, and its aim is to keep diseases out. Unfortunately, some people have come to view biosecurity as an excuse to hide management practices on farm.
Farmers are frustrated that there is no recourse unless raiders are caught in the act.
Free-range or indoor–outdoor production systems are perceived to be more welfare friendly, but that is not always the case. Whatever the system, the key to good pig welfare is management and well trained workers. Each system has its challenges which affect pig welfare.
Social media, supermarket marketing and the disconnection between farms and consumers are changing the balance from scientifically based animal welfare to consumer perceptions. This is a serious issue for pig farmers, as consumer demand is beginning to drive how farmers farm.
There is a need for continued education of stakeholders and more community education with regard to farming and food production. APL has created education materials for schools that have been well received (APL Education Toolkit).
The US Center for Food Integrity works to address animal activists’ criticisms of agriculture in a factual and unemotional manner. A similar organisation is needed in Australia.
To encourage greater consumption of pork and to support the local industry, APL has created a website with information about pork production and recipes: www.aussiepigfarmers.com.au
A DPI Primefact presents the merits of intensive pork production and gives links to further information: www.dpi.nsw.gov.au/agriculture/livestock/pigs/housing-environment/intensive-pork-production
A short podcast explains why pig farmers do what they do: www.dpi.nsw.gov.au/agriculture/livestock/pigs/pork-industry
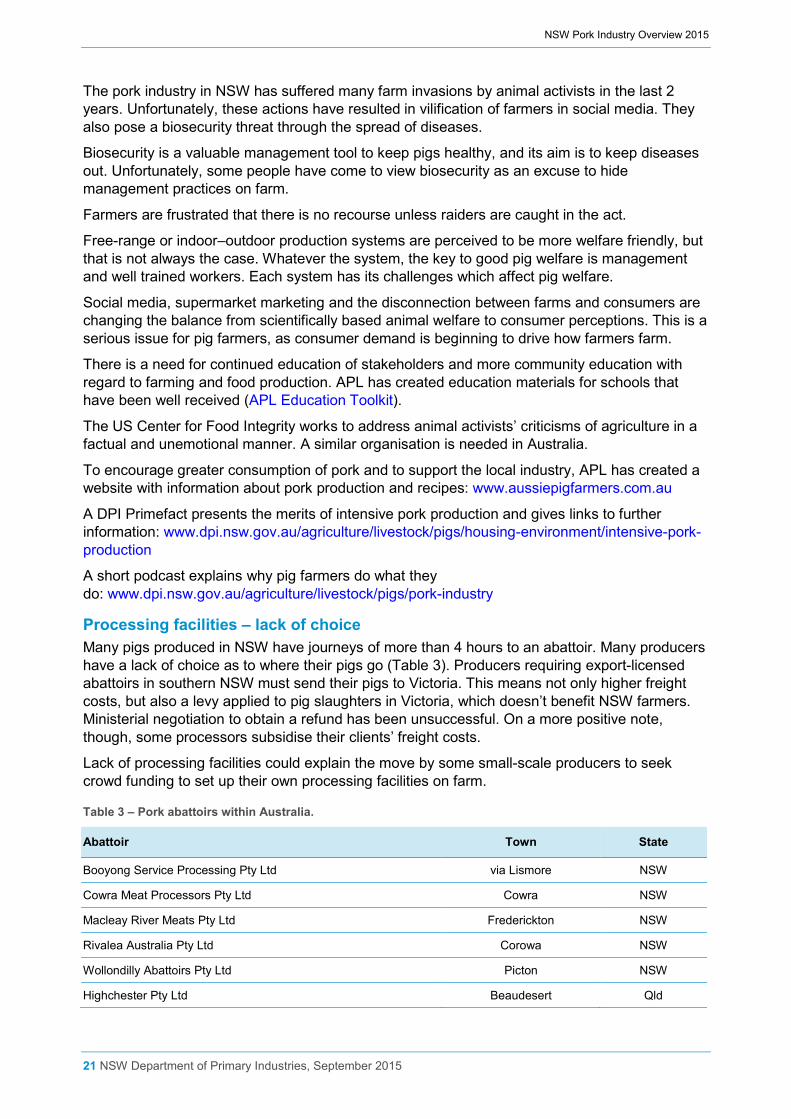
Processing facilities – lack of choice Many pigs produced in NSW have journeys of more than 4 hours to an abattoir. Many producers have a lack of choice as to where their pigs go (Table 3). Producers requiring export-licensed abattoirs in southern NSW must send their pigs to Victoria. This means not only higher freight costs, but also a levy applied to pig slaughters in Victoria, which doesn’t benefit NSW farmers. Ministerial negotiation to obtain a refund has been unsuccessful. On a more positive note, though, some processors subsidise their clients’ freight costs.
Lack of processing facilities could explain the move by some small-scale producers to seek crowd funding to set up their own processing facilities on farm.
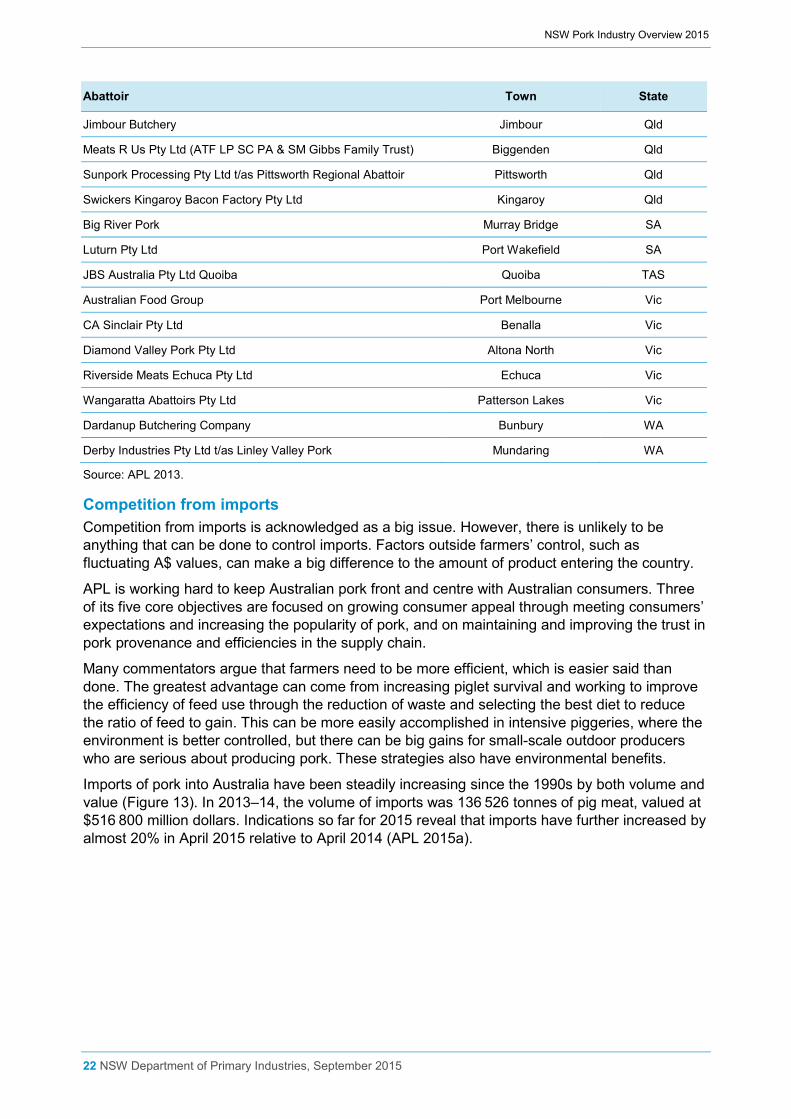
Table 3 – Pork abattoirs within Australia.
Abattoir Town State
Booyong Service Processing Pty Ltd via Lismore NSW
Cowra Meat Processors Pty Ltd Cowra NSW
Macleay River Meats Pty Ltd Frederickton NSW
Rivalea Australia Pty Ltd Corowa NSW
Wollondilly Abattoirs Pty Ltd Picton NSW
Highchester Pty Ltd Beaudesert Qld
NSW Pork Industry Overview 2015
22 NSW Department of Primary Industries, September 2015
Abattoir Town State
Jimbour Butchery Jimbour Qld
Meats R Us Pty Ltd (ATF LP SC PA & SM Gibbs Family Trust) Biggenden Qld
Sunpork Processing Pty Ltd t/as Pittsworth Regional Abattoir Pittsworth Qld
Swickers Kingaroy Bacon Factory Pty Ltd Kingaroy Qld
Big River Pork Murray Bridge SA
Luturn Pty Ltd Port Wakefield SA
JBS Australia Pty Ltd Quoiba Quoiba TAS
Australian Food Group Port Melbourne Vic
CA Sinclair Pty Ltd Benalla Vic
Diamond Valley Pork Pty Ltd Altona North Vic
Riverside Meats Echuca Pty Ltd Echuca Vic
Wangaratta Abattoirs Pty Ltd Patterson Lakes Vic
Dardanup Butchering Company Bunbury WA
Derby Industries Pty Ltd t/as Linley Valley Pork Mundaring WA
Source: APL 2013.
Competition from imports Competition from imports is acknowledged as a big issue. However, there is unlikely to be anything that can be done to control imports. Factors outside farmers’ control, such as fluctuating A$ values, can make a big difference to the amount of product entering the country.
APL is working hard to keep Australian pork front and centre with Australian consumers. Three of its five core objectives are focused on growing consumer appeal through meeting consumers’ expectations and increasing the popularity of pork, and on maintaining and improving the trust in pork provenance and efficiencies in the supply chain.
Many commentators argue that farmers need to be more efficient, which is easier said than done. The greatest advantage can come from increasing piglet survival and working to improve the efficiency of feed use through the reduction of waste and selecting the best diet to reduce the ratio of feed to gain. This can be more easily accomplished in intensive piggeries, where the environment is better controlled, but there can be big gains for small-scale outdoor producers who are serious about producing pork. These strategies also have environmental benefits.
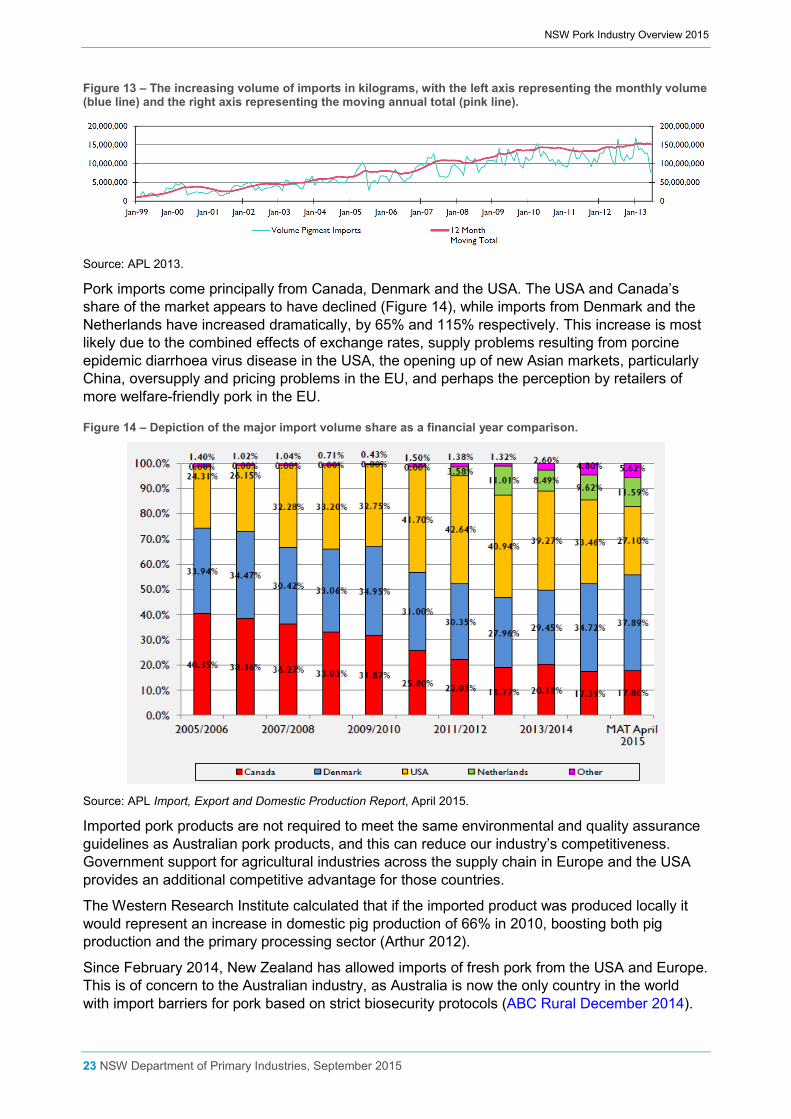
Imports of pork into Australia have been steadily increasing since the 1990s by both volume and value (Figure 13). In 2013–14, the volume of imports was 136 526 tonnes of pig meat, valued at $516 800 million dollars. Indications so far for 2015 reveal that imports have further increased by almost 20% in April 2015 relative to April 2014 (APL 2015a).
NSW Pork Industry Overview 2015
23 NSW Department of Primary Industries, September 2015
Figure 13 – The increasing volume of imports in kilograms, with the left axis representing the monthly volume (blue line) and the right axis representing the moving annual total (pink line).
Source: APL 2013.
Pork imports come principally from Canada, Denmark and the USA. The USA and Canada’s share of the market appears to have declined (Figure 14), while imports from Denmark and the Netherlands have increased dramatically, by 65% and 115% respectively. This increase is most likely due to the combined effects of exchange rates, supply problems resulting from porcine epidemic diarrhoea virus disease in the USA, the opening up of new Asian markets, particularly China, oversupply and pricing problems in the EU, and perhaps the perception by retailers of more welfare-friendly pork in the EU.
Figure 14 – Depiction of the major import volume share as a financial year comparison.
Source: APL Import, Export and Domestic Production Report, April 2015.
Imported pork products are not required to meet the same environmental and quality assurance guidelines as Australian pork products, and this can reduce our industry’s competitiveness. Government support for agricultural industries across the supply chain in Europe and the USA provides an additional competitive advantage for those countries.
The Western Research Institute calculated that if the imported product was produced locally it would represent an increase in domestic pig production of 66% in 2010, boosting both pig production and the primary processing sector (Arthur 2012).
Since February 2014, New Zealand has allowed imports of fresh pork from the USA and Europe. This is of concern to the Australian industry, as Australia is now the only country in the world with import barriers for pork based on strict biosecurity protocols (ABC Rural December 2014).
NSW Pork Industry Overview 2015
24 NSW Department of Primary Industries, September 2015
The pork industry overseas struggles with pig diseases that do not occur in Australia, such as porcine reproductive and respiratory syndrome, post-weaning multi-systemic syndrome and porcine epidemic diarrhoea virus, which have killed millions of piglets in the USA over the last couple of years. Industry is concerned that Australia’s strict biosecurity protocols will be targeted by the USA and Europe during negotiations for free trade agreements such as the Trans-Pacific Partnership. These countries benefit from government subsidies and cheaper labour costs; reportedly, Mexican labour costs are only $7 to $8 an hour in the USA.
In the short term, the volatility of the share market and the falling value of the A$ relative to the US$ and the euro means imports will be more expensive. However, the forecast El Niño event this spring could mean that the advantage for Australian pork producers will be short lived if drought takes hold.
Environmental impacts In general, the pork industry is a responsible participant in environmental management. It was the first agricultural industry to have two registered methodologies under Australia’s Emissions Reduction Fund. These relate to capturing and burning methane from covered anaerobic ponds or engineered digesters.
Despite all the available information and good news stories, environmental challenges remain, with some producers (mainly small-scale outdoor producers) facing the opprobrium of neighbours and local government. Misinterpretation of planning regulations, non-compliance with planning requirements, underestimation of the impacts of pigs outdoors and staff turnover in local government mean there is need for a coordinated approach that involves industry and local and state governments nationally.
Other issues • Terms of payment – one farmer identified the need for an industry standard or code of
practice. The Australian Competition and Consumer Commission has held enquiries into the supermarket sector, but smaller organisations can be difficult as well.
• Compliance, red tape paperwork – some farmers find the reporting aspects of EPA licensing, work health and safety, quality assurance, feed safety, and human resources management for staff (wages, superannuation and workers’ compensation) – a heavy load.
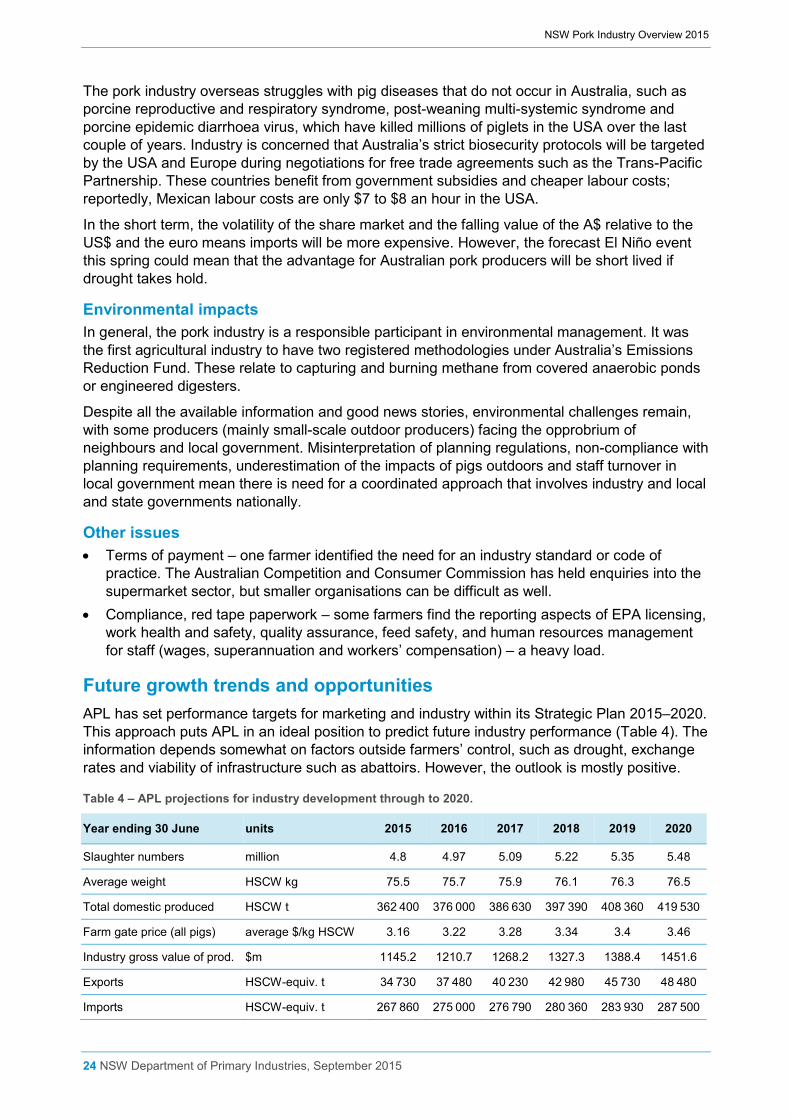
Future growth trends and opportunities APL has set performance targets for marketing and industry within its Strategic Plan 2015–2020. This approach puts APL in an ideal position to predict future industry performance (Table 4). The information depends somewhat on factors outside farmers’ control, such as drought, exchange rates and viability of infrastructure such as abattoirs. However, the outlook is mostly positive.
Table 4 – APL projections for industry development through to 2020.
Year ending 30 June units 2015 2016 2017 2018 2019 2020
Slaughter numbers million 4.8 4.97 5.09 5.22 5.35 5.48
Average weight HSCW kg 75.5 75.7 75.9 76.1 76.3 76.5
Total domestic produced HSCW t 362 400 376 000 386 630 397 390 408 360 419 530
Farm gate price (all pigs) average $/kg HSCW 3.16 3.22 3.28 3.34 3.4 3.46
Industry gross value of prod. $m 1145.2 1210.7 1268.2 1327.3 1388.4 1451.6
Exports HSCW-equiv. t 34 730 37 480 40 230 42 980 45 730 48 480
Imports HSCW-equiv. t 267 860 275 000 276 790 280 360 283 930 287 500
NSW Pork Industry Overview 2015
25 NSW Department of Primary Industries, September 2015
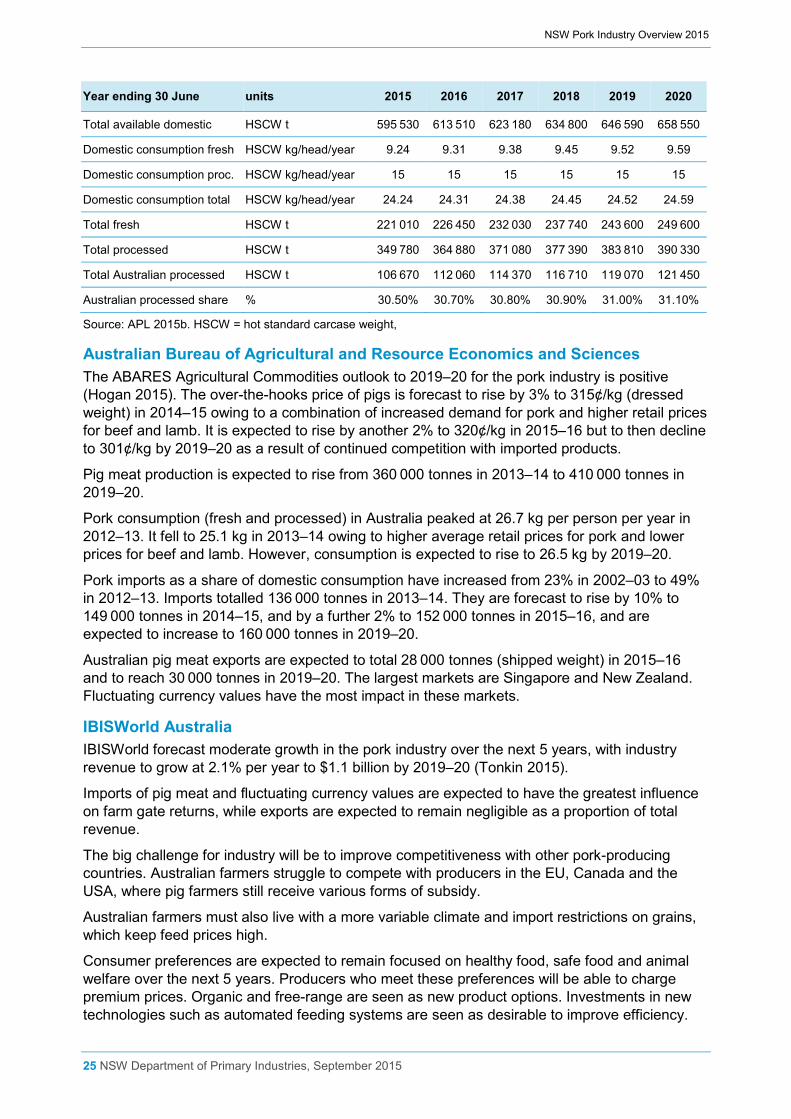
Year ending 30 June units 2015 2016 2017 2018 2019 2020
Total available domestic HSCW t 595 530 613 510 623 180 634 800 646 590 658 550
Domestic consumption fresh HSCW kg/head/year 9.24 9.31 9.38 9.45 9.52 9.59
Domestic consumption proc. HSCW kg/head/year 15 15 15 15 15 15
Domestic consumption total HSCW kg/head/year 24.24 24.31 24.38 24.45 24.52 24.59
Total fresh HSCW t 221 010 226 450 232 030 237 740 243 600 249 600
Total processed HSCW t 349 780 364 880 371 080 377 390 383 810 390 330
Total Australian processed HSCW t 106 670 112 060 114 370 116 710 119 070 121 450
Australian processed share % 30.50% 30.70% 30.80% 30.90% 31.00% 31.10%
Source: APL 2015b. HSCW = hot standard carcase weight,
Australian Bureau of Agricultural and Resource Economics and Sciences The ABARES Agricultural Commodities outlook to 2019–20 for the pork industry is positive (Hogan 2015). The over-the-hooks price of pigs is forecast to rise by 3% to 315¢/kg (dressed weight) in 2014–15 owing to a combination of increased demand for pork and higher retail prices for beef and lamb. It is expected to rise by another 2% to 320¢/kg in 2015–16 but to then decline to 301¢/kg by 2019–20 as a result of continued competition with imported products.
Pig meat production is expected to rise from 360 000 tonnes in 2013–14 to 410 000 tonnes in 2019–20.
Pork consumption (fresh and processed) in Australia peaked at 26.7 kg per person per year in 2012–13. It fell to 25.1 kg in 2013–14 owing to higher average retail prices for pork and lower prices for beef and lamb. However, consumption is expected to rise to 26.5 kg by 2019–20.
Pork imports as a share of domestic consumption have increased from 23% in 2002–03 to 49% in 2012–13. Imports totalled 136 000 tonnes in 2013–14. They are forecast to rise by 10% to 149 000 tonnes in 2014–15, and by a further 2% to 152 000 tonnes in 2015–16, and are expected to increase to 160 000 tonnes in 2019–20.
Australian pig meat exports are expected to total 28 000 tonnes (shipped weight) in 2015–16 and to reach 30 000 tonnes in 2019–20. The largest markets are Singapore and New Zealand. Fluctuating currency values have the most impact in these markets.
IBISWorld Australia IBISWorld forecast moderate growth in the pork industry over the next 5 years, with industry revenue to grow at 2.1% per year to $1.1 billion by 2019–20 (Tonkin 2015).
Imports of pig meat and fluctuating currency values are expected to have the greatest influence on farm gate returns, while exports are expected to remain negligible as a proportion of total revenue.
The big challenge for industry will be to improve competitiveness with other pork-producing countries. Australian farmers struggle to compete with producers in the EU, Canada and the USA, where pig farmers still receive various forms of subsidy.
Australian farmers must also live with a more variable climate and import restrictions on grains, which keep feed prices high.
Consumer preferences are expected to remain focused on healthy food, safe food and animal welfare over the next 5 years. Producers who meet these preferences will be able to charge premium prices. Organic and free-range are seen as new product options. Investments in new technologies such as automated feeding systems are seen as desirable to improve efficiency.

NSW Pork Industry Overview 2015
26 NSW Department of Primary Industries, September 2015
Further consolidation within industry is forecast as producers aim for more economies of scale in a bid to be more competitive. Profit margins are expected to decline, but employment within industry is expected to remain stable.
IBISWorld describes the pork industry as an industry in decline, with fewer farms producing a greater proportion of total production.
Commonwealth Bank The Commonwealth Bank highlighted the great potential in the worldwide growing demand for meat, which is led by China (Matthews 2014). China became a top 5 importer of pig meat and beef in 2013, and continued strong growth is expected: ‘Chinese beef and pig meat import dependency ratio now stands at 1.9% up from just 0.2% in 2000.’
However, the Australian pork industry is minuscule when compared with the Chinese market. Australia’s total pig production of 4.7 million head is 0.7% of Chinese production.
Despite the robust growth in global meat demand, the local pig meat industry is described as ‘struggling to compete’. Australian pig meat exports ‘collapsed [by] 49% between 2002 and 2012’. Over this same period, Australia’s total pork consumption increased by 48% to 408 000 tonnes, with the shortfall met by rising imports. ‘Australia’s pig meat import dependency ratio for pork is nearly 50% up from just 6% in 2002.’
If Australia wishes to capitalise on growing worldwide demand for pig meat, then producers and exporters will need to become more competitive.
Responses to current issues, challenges and opportunities NSW Government The NSW Government commissioned the Agriculture Industry Action Plan, which is a strategic roadmap to ensure the continued growth of the State’s $12 billion primary industries sector.
NSW DPI Under the NSW DPI Corporate Plan 2015 to 2018, our purpose is to increase the capacity of primary industries and communities to drive economic growth across NSW. Our goals are:
• productive partnerships with business, industry and community to accelerate opportunities and maximise benefits
• economic growth through innovation that improves resilience and boosts productivity • economic growth by ensuring sustainable use of and access to natural resources • mitigation and management of risks to community and industry confidence • individuals engaged and accountable, empowered to collaborate, innovate and embrace
change. Within the DPI’s Livestock Systems Team, the Dairy and Intensive Livestock group comprises dairy, poultry (eggs and meat), pigs and bee development officers. The Development Officer, Pigs, supports industry and relays industry intelligence to the Minister for Primary Industries.
The Development Officer works with APL and the NSW Farmers Pork Group, and with other NSW Government sections, including Local Land Services, State and Regional Development, the NSW Food Authority, NSW Biosecurity and Animal Welfare, and Land Use Planning.
The DPI conducts pig health research at the Elizabeth Macarthur Agricultural Institute (EMAI). Research projects are funded by APL, the Pork CRC and pharmaceutical companies through Australian Research Council grants. DPI researchers collaborate with industry, universities and other state governments to support pig health. The DPI also provides biosecure pig housing
NSW Pork Industry Overview 2015
27 NSW Department of Primary Industries, September 2015
facilities at EMAI and operates a computed tomography (CT) scanner to measure the effect of disease on muscle and fat deposition in growing pigs.
Research has focused on vaccine development, alternatives to antibiotics for the control of diseases, the development of cost-effective diagnostic assays, routine monitoring of herd health, quantifying the prevalence and economic costs of pig diseases, and identifying the cause of new pig diseases. The State Veterinary Diagnostics Laboratory at EMAI also diagnoses diseases.
Recent major outcomes of pig health research at EMAI include the development of new assays for economically important bacterial and viral pathogens. These assays can estimate disease severity and production losses associated with disease in real time, enabling producers to treat diseases before pigs are compromised. Combining these assays with pooled sampling techniques (at the pen level) will provide producers with cost-effective monitoring of herd health to avoid disease outbreaks.
The Animal Welfare Unit of NSW DPI implements government policy with respect to animal welfare and liaises with industry regarding animal welfare issues. The Unit administers the Prevention of Cruelty to Animals Act, but animal cruelty complaints are investigated by the RSPCA NSW, the Animal Welfare League NSW and the NSW Police.
Addressing the environmental impacts of the pork industry The pork industry leads the animal industries in environmental initiatives. Taking the lead in managing the environmental impacts of piggeries, APL has produced the National Environmental Sustainability Strategy for the Pork Industry 2010–2015, environmental guidelines for intensive indoor and outdoor piggeries, and a biogas code of practice. The environmental page on APL’s website includes sections on waste management, water use, greenhouse gases, renewable energy (biogas), environmental sustainability, environmental guidelines, planning and development, outdoor production and the National Agricultural Manure Management Program.
In 2010, a life cycle assessment was developed by RIRDC for APL and the Climate Change and Variability R&D program of the Rural Industries Research and Development Corporation. The assessment examined pork supply chains in southern Queensland and southern NSW for global warming potential, water use and energy use, and covered a range of management options. It showed that Australian production systems were much more efficient in water use than the world average: water use was 2753 L/kg hot standard carcase weight (HSCW) in Australian deep litter systems and 3020 L/kg HSCW in Australian conventional systems, versus a world average of 4856 L/kg HSCW.
The supply chains had a global warming potential of 3.1 to 5.5 kg CO2-e/kg HSCW. Most greenhouse gas emissions comprised waste stream methane and nitrous oxide, but nitrous oxide from upstream grain production was also significant in northern NSW.
Deep litter housing had lower shed emissions and lower energy usage than conventional housing. However, the primary energy use for the two supply chains was reportedly 10% to 54% higher than in ‘most other published studies presented in the literature’. The reasons given were the greater energy losses associated with energy supply and greater transport distances in Australian pork supply chains.
The mitigation of methane emissions could improve the environmental performance of conventional pork housing and manure treatment systems.
One recommendation from this assessment was that if the goal is to present data as a ‘carbon footprint’ of fresh pork, then the supply chains should be extended to the supermarket shelf for a range of products. The emission profile of pork as a sale product will be considerably higher than the values reported. The assessment also stressed that comparisons with other species or other suppliers be based on similar methods and analyses.
NSW Pork Industry Overview 2015
28 NSW Department of Primary Industries, September 2015
Developments since 2010 Under Australia’s Emissions Reduction Fund, the pork industry has two registered methods related to capturing and burning methane from covered anaerobic ponds or engineered digesters. Additional methods to be developed should provide pig producers with more opportunities to mitigate emissions. Examples of these opportunities include:
• changing conventional housing to deep litter • anaerobic digestion of spent litter • using small, shorter-retention-time treatment ponds • amending manure to bind nitrogen before spreading • changing land application timing and techniques. Research to develop some of these potential methods is occurring under the National Agricultural Manure Management Program, which is funded by the Department of Agriculture. APL has a role in coordinating the intensive agriculture industries.
The Pork Industry Greenhouse Gas Calculator is a recent project. This project, which was jointly funded by Ian Kruger Consulting, the Australian Government and APL, examined the gas mitigation potential on Australian piggeries through workshop participation and one-to-one farm consultation (Kruger 2015). Participants represented 24% of Australia’s pork production. The average potential to mitigate total on-farm greenhouse gas emissions across all piggeries was 54%. Some of the reduction strategies had a clear and immediate financial return to the farmer:
• Reducing feed wastage or increasing feed efficiency by 5% resulted in about a 10% reduction in greenhouse gas emissions.
• Modifying existing waste treatment and reuse systems could result in reductions of 15% to 25%.
• Housing pigs in deep litter sheds resulted in about 40% lower emissions than housing in conventional sheds.
• Conventional piggeries that treated manure in covered anaerobic ponds or tank digesters to capture and burn methane and generate electricity for farm use and sale to the grid could reduce on-farm emissions by 75% to 84%. In these cases, the emission intensities fell from 4 kg of CO2-e/kg of pork produced to below 1 kg.
More detailed information on these and other research reports are available on the APL website under the Library and Resources pages.

NSW Pork Industry Overview 2015
29 NSW Department of Primary Industries, September 2015
References APL. 2012. Australian Pig Annual 2011–12. Australian Pork Limited.
APL. 2013. Australian Pig Annual 2012–13. Australian Pork Limited: australianpork.com.au/facts-figures/market-reporting/
APL. 2014. Submission to Agricultural Competitiveness Issues Paper. Australian Pork Limited: http://australianpork.com.au/library-resources/publications/submissions-to-government/
APL. 2015a. Import, Export & Domestic Production Report. Australian Pork Limited.
APL. 2015b. Strategic Plan 2015–2020. Australian Pork Limited: australianpork.com.au/library-resources/publications/strategic-plans/
Arthur L. 2012. Economic Impact Report – Pig production and pig meat processing in Australia 2010–2011. Western Research Institute for Australian Pork Limited. 11028 APL 2011/Reports.
Australian Organic Market Report. 2014: http://austorganic.com/ao-market-report/
Campbell R. 2015. Global benchmarks – a tale of two stories for Australia. Pork CRC Initiatives Australian Pork Newspaper February 2015 vol. 19 no. 2 p. 3.
Fletcher S. 2015. Strategic Plan for Development of the Pork Industry within the Northern Rivers Region NSW. Stephen Fletcher & Associates Pty Ltd, Environmental Planning for NSW Trade and Investment Regional Development Australia Northern Rivers & Northern Co-operative Meat Company Ltd.
Haydon P. 2015. Missing cash beyond the farm gate. Marketing Matters. Australian Pork Newspaper May 2015 vol. 19 no. 5 p. 8.
Hogan J. 2015. Pig Meat Outlook to 2019–2020. Agricultural Commodities vol. 5 no. 1. ABARES.
Kruger I. 2015. Piggeries abate greenhouse gases. Australian Pork Newspaper May 2015 vol. 19 no. 5 p. 14.
Matthews L. 2014. The Global Meat Industry and Opportunities for Australian Pork. Commodities: Agri Updates. Commonwealth Bank of Australia.
Morrison R, Baxter E. 2013. Project 1A-105 Developing commercially viable confinement-free farrowing and lactation systems. Cooperative Research Centre for High Integrity Australian Pork.
PISC. 2008. Model Code of Practice for the Welfare of Animals – Pigs, 3rd ed. PISC Report No. 92. Primary Industries Standing Committee.
Pork CRC. 2013. Annual Report 2012–13. porkcrc.com.au/wp-content/uploads/2013–11/PorkCRC-AnnualReport2013-web.pdf
Tonkin B. 2015. Pig Farming in Australia IBISWorld Industry Report A0192.