nsw elections 1995
TRANSCRIPT

NSW PARLIAMENTARY LIBRARY .. ... ... .. ... . ........ . . ... ....... .. .. . .. . . ... .... .. . .... .. .. . ...
RESEARCH SERVICE
NSW Elections 1995
by
Antony Green
Background Paper 1995/4

NSW Elections 1995
by
Antony Green

NSW PARLIAMENTARY LIBRARY RESEARCH SERVICE
Dr David Clune (230 2484), Manager
Dr Gareth Griffith (230 2356) Senior Research Officer, Politics and Government
Ms Vicki Mullen (230 2768) Research Officer, Law
Ms Jan Newby (230 2483) Senior Research Officer, Statistics
Mr Stewart Smith (230 2798) Research Officer, Environment/Science
Ms Marie Swain (230 2003) Research Officer, Law
Mr John Wilkinson (230 2006) Research Officer, Economics
ISSN 1320-4521 ISBN O 7310 5921 2
<0 1995
Except to the extent of the uses permitted under the Copyright Act 1968, no part of this document may be reproduced or transmitted in any form or by any means including information storage and retrieval systems, without the prior written consent from the Librarian, NSW Parliamentary Library, other than by Members of the NSW Parliament in the course of their official duties.
July 1995
Background Paper is published by the NSW Parliamentary Library

NSW Elections 1995
CONTENTS
Introduction .................................................................................. 1
Legislative Assembly Results
Summary of Results .............................................................. 3
Detailed Results by Electoral Division ....................................... 9
Summary of Two-Party Preferred Results ................................ 27
Regional Summaries ............................................................ 33
By-elections 1991-1995 ....................................................... 37
Legislative Council Results ............................................................ 41
Referendum Results ..................................................................... 51

The Author
Antony Green is the Election Analyst for ABC-Television, and has worked for the ABC on every state and federal election coverage since 1989. He also writes regularly on electoral matters for the Sydney Morning Herald.
Antony studied at Sydney University, obtaining a Bachelor of Science in mathematics and computing, and a Bachelor of Economics with Honours in politics.
In the last parliament, Antony produced three publications for the Parliamentary Library, "NSW Elections 1984 to 1991: A Comparative Analysis", " 1991 Legislative Assembly Election: Estimated Two-Candidate Preferred Results by Polling Place", and "Electing the NSW Legislative Council 1978 to 1995: Past Results and Future Prospects".
Acknowledgments
I would like to thank NSW Electoral Commissioner, Mr Ian Dickson, and the staff of the Electoral Office, for their assistance throughout the election campaign, and in providing access to the statistical returns for the election ahead of their official publication. I must also express my appreciation for the continuing assistance of Mr David Clune from the Parliamentary Library.
While figures have been provided by the Electoral Office, all calculation of percentages, flows of preferences, totalling of votes and analysis of regional votes and trends is the responsibility of the author.

NSW Elections 1995
INTRODUCTION
This paper contains a summary of the results of the 1995 elections for the New South Wales Parliament. It contains details of voting for all Legislative Assembly districts, as well as summaries of the Legislative Council, and the two referendums conducted with the election.
Full detail of district results for the Legislative Assembly are given on pages 9 to 26. Primary and two-party preferred counts are given for each division. The following paragraphs explain the format for the results.
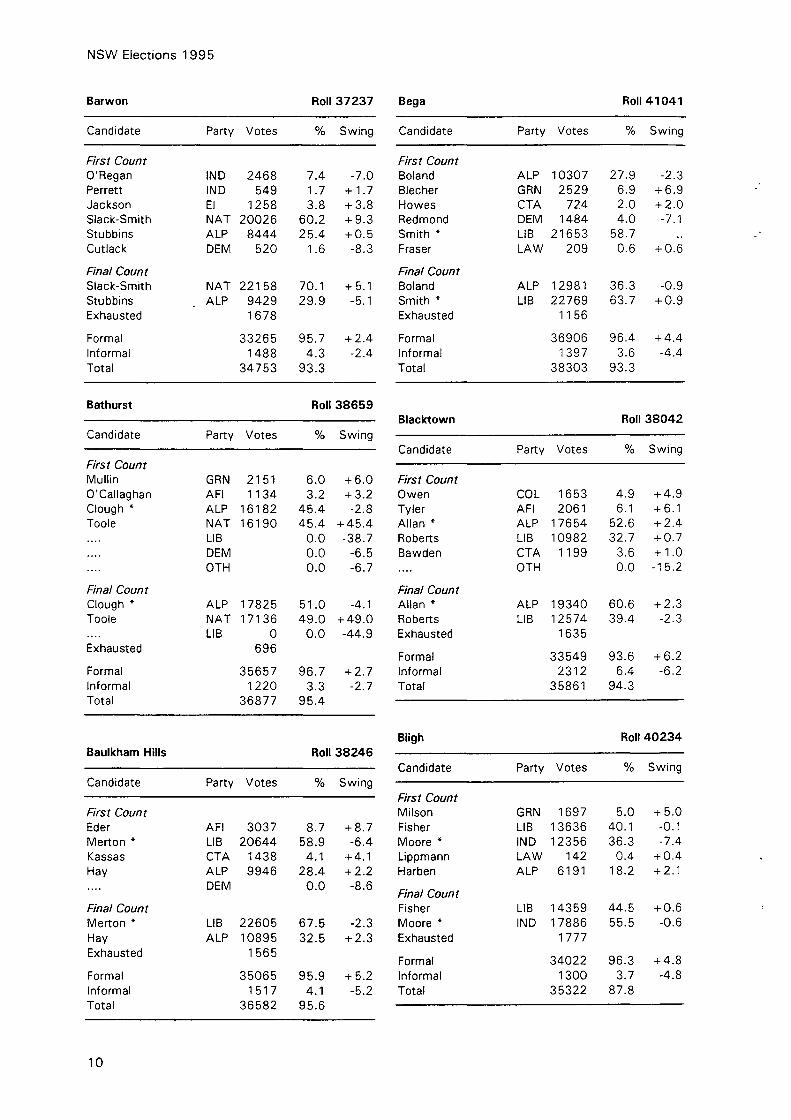
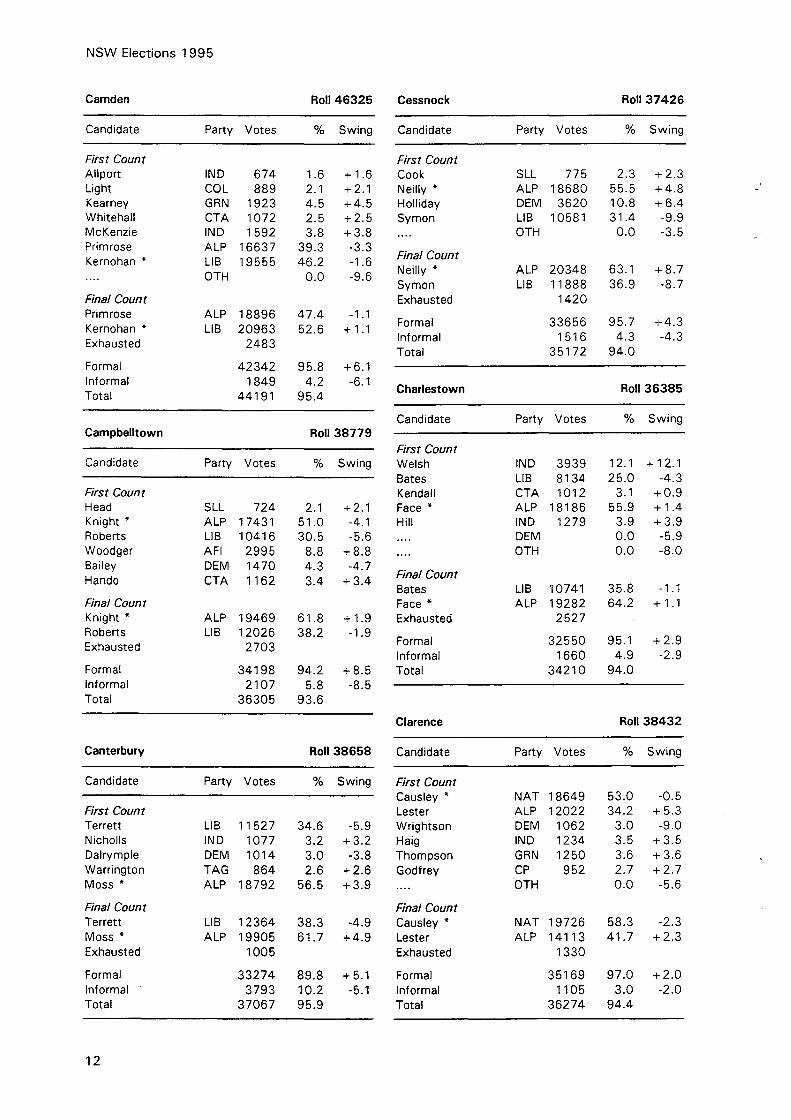
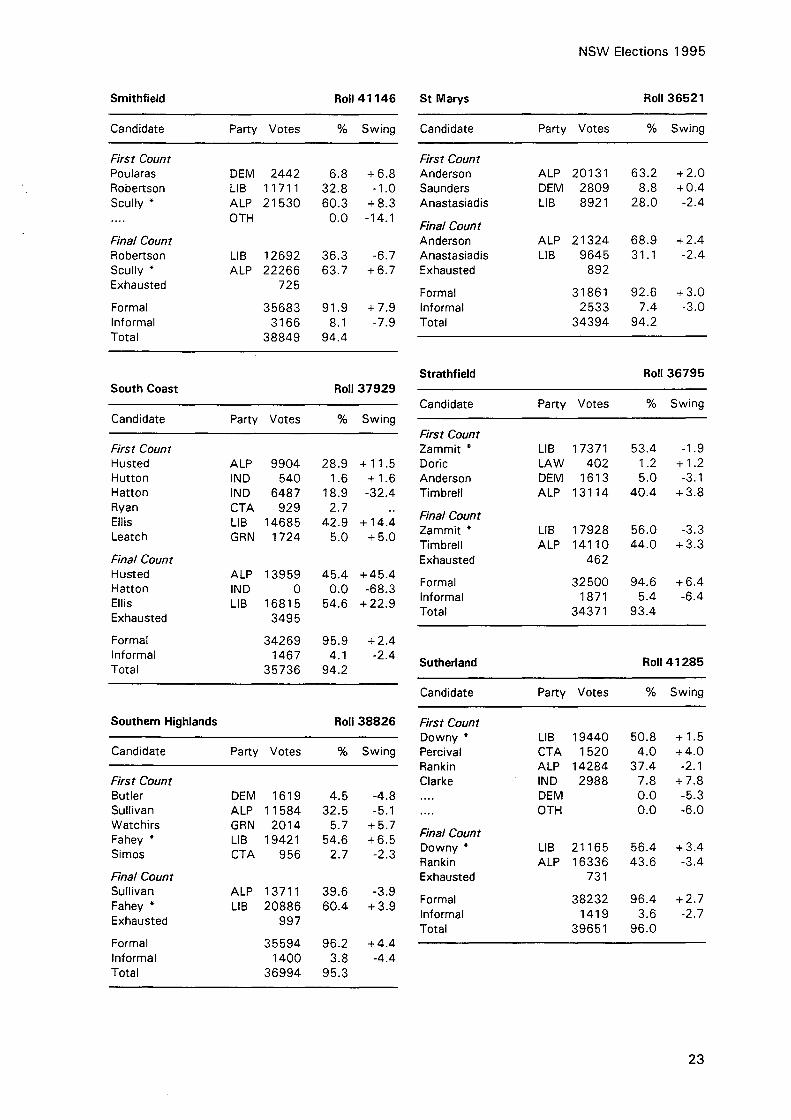
First Count: The votes shown for each candidate are the total primary votes received. Percentage votes are calculated as a percentage of the formal vote for each electorate. Swing is calculated by subtracting the percentage vote received by a party at the 1991 election from the percentage received in 1995. Where the parties contesting the district differ from 1991, ghost candidates indicated by " .... " have been included representing candidates not contesting the 1995 election. As a result, all primary swings add to zero, subject to rounding errors.
Final Count: Represents the two-candidate preferred count after the final distribution of preferences in an electorate. All votes which did not indicate a preference to the two remaining candidate are included in the total listed as Exhausted. Two-candidate preferred percentages are calculated by dividing the two-candidate preferred vote by the votes remaining in the count, that is the formal votes minus the total exhausted votes. Two-candidate preferred swings are shown compared to the 1991 election. Where the party composition of the final two candidates differs from 1991 (eg South Coast), a ghost candidate appears, and three swing figures are shown.
Note that in the detailed results, all swing figures are compared to the 1991 election. Byelections have been ignored. Details of by-elections can found on pages 37 to 39.
Results of the election for the Legislative Council are provided in the same format as in Current Issues Background Paper No 1995/2, "Electing the New South Wales Legislative Council 1978 to 1995: Past Results and Future Prospects". Details of the distribution of preferences are provided in the same format as used Section 2.8 (pp10-16) of that publication. At this stage, Council results are only preliminary. When full details of the count are available, a publication with more detailed information will be prepared.
All figures are based on information provided by the NSW State Electoral Office. However, responsibility for all calculations and omissions is taken by the author.

NSW Elections 1995
Symbols
.. Nil or rounded to zero Sitting Member 'Ghost' candidate, where party contesting in 1991 was absent in 1995
Party Abbreviations
(blank) Non-Aligned Candidates AFI Australians Against Further Immigration ALP Labor Party CAP Confederate Action Party CEC Citizens Electoral Council COL Citizens Opinion Law Order Capital Punishment CP Country Party CT A Call to Australia DEM Australian Democrats DSP Democratic Socialist Party El Environment Independents GRN Greens IND Independents LAW Natural Law Party LIB Liberal Party NAN No Aircraft Noise NAT National Party 0TH Others SDO Stop Dual Occupancy SLL Socialist Labor League SOS Save Our Shire TAG Transport Action Group Against Motorways
2

STATE-WIDE TOTALS
Candi- Change Party dates on 1991
Labor Party 99 Liberal Party 79 -2 National Party 19 -1 Independents 51 -36 Australian Democrats 55 -30 Greens 35 +27 Call to Australia 42 +4 Australians Against Further Immigration 20 +20 No Aircraft Noise 6 +6 Non-Aligned Candidates 3 +1 Natural Law 17 +17 Citz. Opinion Law Order Capital Punish. 5 +5 Environment Independents Country Party Socialist Labor League Democratic Socialist Party Transport Action Group Save Our Shire Stop Dual Occupancy Confederate Action Party Citizens Electoral Council (Others)
Formal Votes Informal Total Votes / Turnout
Seats changing hands
Labor gains from the Liberal Party
Liberal gains from Independents
5 +5 6 +6 4 +3 4 +4 2 +2 1 +1 1 +1 1 +1 1 -8
-10
456 +16
Badgerys Creek Blue Mountains Gladesville
South Coast
NSW Elections 1995
ENROLLED 3 837 102
Seats Won Votes % Vote Swing
50 1 408 616 41.26 +2.21 29 1 121 190 32.84 -1.32 17 378 878 11.10 +0.58
3 160 169 4.69 -3.61 97 166 2.85 -2.51 87 862 2.57 +2.03 49 317 1.44 +0.25 38 016 1 .11 + 1.11 32 309 0.95 +0.95
7 076 0.21 +0.15 7 053 0.21 +0.21 6 455 0.19 +0.19 5 060 0.15 +0.15 3 983 0.12 +0.12 2 252 0.07 +0.06 2 234 0.07 +0.07 2 188 0.06 +0.06 1 585 0.05 +0.05 1 102 0.03 +0.03 1 095 0.03 +0.03
156 0.00 -0.17 0.00 -0.65
99 3 413 762 94.85 +4.17 185 379 5.15 -4.17
3 599 141 93.80 +0.18
Note: Labor gained The Entrance from the Liberal Party at a by-election on 1 8 January 1992
3

NSW Elections 1 99 5
LEGISLATIVE ASS EMBLY : SUMMARY OF FIRST PREFERENCE VOTES BY ELECTORATE
Electoral First Preference Votes Informal Total District ALP LIB NAT DEM GRN Other Votes Votes Roll
Albury 9748 20443 650 1184 2876 1461 36362 39175 Ashfield 13902 7836 1202 2043 6751 2222 33956 37170 Auburn 21171 9945 1955 2765 35836 38215 Badgerys Creek 18035 17923 3217 2023 41198 43531 Ballina 8622 .. 23214 1736 3627 767 1084 39050 41994 Bankstown 21747 10875 1062 580 2660 36924 39123 Barwon 8444 .. 20026 520 4275 1488 34753 37237 Bathurst 16182 .. 16190 2151 1134 1220 36877 38659 Baulkham Hills 9946 20644 4475 1517 36582 38246 Bega 10307 21653 1484 2529 933 1397 38303 41041 Blacktown 17654 10982 4913 2312 35861 38042 Bligh 6191 13636 1697 12498 1300 35322 40234 Blue Mountains 13412 9860 2489 .. 10093 1193 37047 38047 Broken Hill 16292 .. 13236 1324 1889 32741 36360 Bulli 18137 11860 4193 1544 1421 37155 39180 Burrinjuck 13732 20487 2242 36461 38338 Cabramatta 23058 8636 1505 2058 3796 39053 41731 Camden 16637 19555 1923 4227 1849 44191 46325 Campbelltown 17431 10416 1470 4881 2107 36305 38779 Canterbury 18792 11527 1014 1941 3793 37067 38658 Cessnock 18680 10581 3620 775 1516 35172 37426 Charlestown 18186 8134 6230 1660 34210 36385 Clarence 12022 .. 18649 1062 1250 2186 1105 36274 38432 Coffs Harbour 11064 .. 19296 1979 4102 1232 37673 40112 Coogee 15002 13013 1045 3131 1509 1426 35126 38434 Cronulla 9847 16925 1077 6481 1288 35618 37926 Davidson 6523 21156 1721 1751 2580 1309 35040 37324 Drummoyne 14020 13542 2297 4387 1493 35739 37971 Dubbo 10355 .. 21980 2081 1889 36305 38702 East Hills 16732 8964 8013 1665 35374 36890 Eastwood 8981 18867 2051 2124 1859 1306 35188 37602 Ermington 11864 16762 1963 2312 1662 34563 36886 Fairfield 19748 9491 1766 1137 3485 35627 38036 Georges River 11070 16527 5715 1500 34812 36758 Gladesville 13171 14182 1960 4731 1615 35659 38076 Gordon 4174 22928 2635 2009 1958 1106 34810 37282 Gosford 14841 19293 1399 1423 1330 38286 40416 Granville 19893 10086 2869 2754 35602 38101 Hawkesbury 9122 21086 3042 3366 1871 38487 40612 Heffron 20611 9435 3105 370 2577 36098 39282 Hurstville 18771 12759 1369 2240 35139 37274 lllawarra 20893 7620 2792 2243 2450 35998 38062 Keira 18346 10010 2927 1885 1958 35126 37246 Kiama 20385 12814 4319 2275 39793 42249 Kogarah 16047 14981 1664 713 1741 35146 37425 Ku-ring-gai 7067 20271 1633 6556 1251 36778 39199 Lachlan 8578 .. 23560 1787 1843 35768 37541 Lake Macquarie 20723 10756 3020 1865 36364 38445 Lakemba 19115 8480 1644 3468 3135 35842 38613 Lane Cove 5542 18579 1882 1753 6284 1082 35122 38165 Lismore 8260 .. 19292 1163 4645 1408 34768 37047 Liverpool 24042 10733 4774 39549 42835 Londonderry 21724 10869 3398 2679 38670 41612 Maitland 15149 19008 1208 1973 1277 38615 40006
4

NSW Elections 1995
LEGISLATIVE ASSEMBLY: SUMMARY OF FIRST PREFERENCE VOTES (Continued)
Electoral First Preference Votes Informal Total District ALP LIB NAT DEM GRN Other Votes Votes Roll
Manly 4666 15343 877 .. 13608 1117 35611 37946 Maroubra 18989 11030 1015 2052 1794 34880 37945 Marrickville 15587 4346 1798 2394 8640 1962 34727 38346 Miranda 12353 17097 1257 3882 1257 35846 37861 Monaro 9339 .. 20641 1103 2657 1351 1556 36647 39437 Moorebank 20004 11267 5657 2112 39040 41676 Mount Druitt 21775 10192 3481 2665 38113 40760 Murray 7061 .. 24495 2371 33927 37845 Murrumbidgee 13384 .. 20222 2415 36021 37679 Murwillumbah 10005 .. 14701 1543 9476 1511 37236 40107 Myall Lakes 9159 .. 21213 2269 2477 1736 36854 38888 Newcastle 17360 9162 4370 736 1596 33224 35799 North Shore 6703 19756 3039 2940 1107 33545 36815 Northcott 8178 20747 3589 2034 1243 35791 38416 Northern Tablelands 8284 .. 17823 8185 1537 35829 38299 Orange 10451 .. 20971 3525 1450 36397 38306 Oxley 10065 .. 20773 2134 969 1319 35260 37571 Parramatta 18340 12089 1097 2022 1863 35411 37720 Peats 18788 13491 3401 1816 37496 39553 Penrith 15621 14287 1197 2841 1445 35391 37280 Pitt water 6631 21244 1503 3882 1602 1397 36259 38746 Port Jackson 17696 6085 1059 8164 1269 34273 37869 Port Macquarie 10898 .. 19175 1883 4468 1377 37801 39735 Port Stephens 18917 12897 1104 2281 1446 2222 38867 40521 Riverstone 20597 12675 2282 1294 2263 39111 41424 Rockdale 17827 11541 1479 1324 2477 34648 36781 Smithfield 21530 11 711 2442 3166 38849 41146 South Coast 9904 14685 1724 7956 1467 35736 37929 Southern Highlands 11584 19421 1619 2014 956 1400 36994 38826 St Marys 20131 8921 2809 2533 34394 36521 Strathfield 13114 17371 1613 402 1871 34371 36795 Sutherland 14284 19440 4508 1419 39651 41285 Swansea 18846 10977 5947 1787 37557 39570 Tamworth 4985 .. 29619 1271 35875 37839 The Entrance 16933 14369 1340 3057 1494 37193 39587 The Hills 7546 26126 2564 1590 1521 39347 41975 Upper Hunter 10521 .. 23421 2542 36484 38515 Vaucluse 8695 19576 1277 3331 212 1449 34540 38685 Wagga Wagga 12227 19566 3103 1752 36648 39097 Wakehurst 10152 18524 1880 3462 1592 35610 38079 Wallsend 21454 12881 2731 37066 38708 Waratah 20975 7222 3743 2166 34106 35765 Willoughby 7711 20775 3030 1866 1692 35074 38127 Wollongong 18610 7662 3607 1702 2710 34291 36831 Wyong 20748 14584 2433 37765 40040 TOTAL 1408616 1121190378878 97166 87862320050185379 3599141 3837102
5

NSW Elections 1995
LEGISLATIVE ASSEMBLY: SUMMARY OF PERCENTAGE VOTE BY ELECTORATE
Electoral Percentage of First Preference Votes Informal District ALP LIB NAT DEM GRN Other Votes Turnout
Albury 27.9 58.6 1.9 3.4 8.2 4.0 92.8 Ashfield 43.8 24.7 3.8 6.4 21.3 6.5 91.4 Auburn 64.0 30.1 5.9 7.7 93.8 Badgerys Creek 46.0 45.8 8.2 4.9 94.6 Ballina 22.7 61.1 4.6 9.6 2.0 2.8 93.0 Bankstown 63.5 31.7 3.1 1.7 7.2 94.4 Barwon 25.4 60.2 1.6 12.9 4.3 93.3 Bathurst 45.4 45.4 6.0 3.2 3.3 95.4 Baulkham Hills 28.4 58.9 12.8 4.1 95.6 Bega 27.9 58.7 4.0 6.9 2.5 3.6 93.3 Blacktown 52.6 32.7 14.6 6.4 94.3 Bligh 18.2 40.1 5.0 36.7 3.7 87.8 Blue Mountains 37.4 27.5 6.9 28.2 3.2 97.4 Broken Hill 52.8 42.9 4.3 5.8 90.0 Bulli 50.8 33.2 11. 7 4.3 3.8 94.8 Burrinjuck 40.1 59.9 6.1 95.1 Cabramatta 65.4 24.5 4.3 5.8 9.7 93.6 Camden 39.3 46.2 4.5 10.0 4.2 95.4 Campbelltown 51.0 30.5 4.3 14.3 5.8 93.6 Canterbury 56.5 34.6 3.0 5.8 10.2 95.9 Cessnock 55.5 31.4 10.8 2.3 4.3 94.0 Charlestown 55.9 25.0 19.1 4.9 94.0 Clarence 34.2 53.0 3.0 3.6 6.2 3.0 94.4 Coffs Harbour 30.4 53.0 5.4 11 .3 3.3 93.9 Coogee 44.5 38.6 3.1 9.3 4.5 4.1 91 .4 Cronulla 28.7 49.3 3.1 18.9 3.6 93.9 Davidson 19.3 62.7 5.1 5.2 7.6 3.7 93.9 Drummoyne 40.9 39.5 6.7 12.8 4.2 94.1 Dubbo 30.1 63.9 6.0 5.2 93.8 East Hills 49.6 26.6 23.8 4.7 95.9 Eastwood 26.5 55.7 6.1 6.3 5.5 3.7 93.6 Ermington 36.1 50.9 6.0 7.0 4.8 93.7 Fairfield 61.4 29.5 5.5 3.5 9.8 93.7 Georges River 33.2 49.6 17.2 4.3 94.7 Gladesville 38.7 41.7 5.8 13.9 4.5 93.7 Gordon 12.4 68.0 7.8 6.0 5.8 3.2 93.4 Gosford 40.2 52.2 3.8 3.9 3.5 94.7 Granville 60.6 30.7 8.7 7.7 93.4 Hawkesbury 24.9 57.6 8.3 9.2 4.9 94.8 Heffron 61.5 28.1 9.3 1 . 1 7.1 91.9 Hurstville 57.1 38.8 4.2 6.4 94.3 lllawarra 62.3 22.7 8.3 6.7 6.8 94.6 Keira 55.3 30.2 8.8 5.7 5.6 94.3 Kiama 54.3 34.2 11 .5 5.7 94.2 Kogarah 48.0 44.8 5.0 2.1 5.0 93.9 Ku-ring-gai 19.9 57.1 4.6 18.5 3.4 93.8 Lachlan 25.3 69.4 5.3 5.2 95.3 Lake Macquarie 60.1 31.2 8.8 5.1 94.6 Lakemba 58.4 25.9 5.0 10.6 8.7 92.8 Lane Cove 16.3 54.6 5.5 5.1 18.5 3.1 92.0 Lismore 24.8 57.8 3.5 13.9 4.0 93.8 Liverpool 69.1 30.9 12.1 92.3 Londonderry 60.4 30.2 9.4 6.9 92.9 Maitland 40.6 50.9 3.2 5.3 3.3 96.5
6

NSW Elections 1 995
LEGISLATIVE ASSEMBLY: SUMMARY OF PERCENTAGE VOTE BY ELECTORATE (Continued)
Electoral Percentage of First Preference Votes Informal District ALP LIB NAT DEM GRN Other Votes Turnout
Manly 13.5 44.5 2.5 39.5 3.1 93.8 Maroubra 57.4 33.3 3.1 6.2 5.1 91.9 Marrickville 47.6 13.3 5.5 7.3 26.4 5.6 90.6 Miranda 35.7 49.4 3.6 11.2 3.5 94.7 Monaro 26.6 58.8 3.1 7.6 3.8 4.2 92.9 Moorebank 54.2 30.5 15.3 5.4 93.7 Mount Druitt 61.4 28.8 9.8 7.0 93.5 Murray 22.4 77.6 7.0 89.6 Murrumbidgee 39.8 60.2 6.7 95.6 Murwillumbah 28.0 41.2 4.3 26.5 4.1 92.8 Myall Lakes 26.1 60.4 6.5 7.1 4.7 94.8 Newcastle 54.9 29.0 13.8 2.3 4.8 92.8 North Shore 20.7 60.9 9.4 9.1 3.3 91.1 Northcott 23.7 60.1 10.4 5.9 3.5 93.2 Northern Tablelands 24.2 52.0 23.9 4.3 93.6 Orange 29.9 60.0 10.1 4.0 95.0 Oxley 29.7 61.2 6.3 2.9 3.7 93.8 Parramatta 54.7 36.0 3.3 6.0 5.3 93.9 Peats 52.7 37.8 9.5 4.8 94.8 Penrith 46.0 42.1 3.5 8.4 4.1 94.9 Pittwater 19.0 60.9 4.3 11 . 1 4.6 3.9 93.6 Port Jackson 53.6 18.4 3.2 24.7 3.7 90.5 Port Macquarie 29.9 52.6 5.2 12.3 3.6 95.1 Port Stephens 51.6 35.2 3.0 6.2 3.9 5.7 95.9 Riverstone 55.9 34.4 6.2 3.5 5.8 94.4 Rockdale 55.4 35.9 4.6 4.1 7.1 94.2 Smithfield 60.3 32.8 6.8 8.1 94.4 South Coast 28.9 42.9 5.0 23.2 4.1 94.2 Southern Highlands 32.5 54.6 4.5 5.7 2.7 3.8 95.3 St Marys 63.2 28.0 8.8 7.4 94.2 Strathfield 40.4 53.4 5.0 1.2 5.4 93.4 Sutherland 37.4 50.8 11 .8 3.6 96.0 Swansea 52.7 30.7 16.6 4.8 94.9 Tamworth 14.4 85.6 3.5 94.8 The Entrance 47.4 40.3 3.8 8.6 4.0 94.0 The Hills 19.9 69.1 6.8 4.2 3.9 93.7 Upper Hunter 31.0 69.0 7.0 94.7 Vaucluse 26.3 59.2 3.9 10.1 0.6 4.2 89.3 Wagga Wagga 35.0 56.1 8.9 4.8 93.7 Wakehurst 29.8 54.5 5.5 10.2 4.5 93.5 Wallsend 62.5 37.5 7.4 95.8 Waratah 65.7 22.6 11. 7 6.4 95.4 Willoughby 23.1 62.2 9.1 5.6 4.8 92.0 Wollongong 58.9 24.3 11.4 5.4 7.9 93.1 Wyong 58.7 41.3 6.4 94.3
TOTAL 41.3 32.8 11 . 1 2.8 2.6 9.4 5.2 93.8
7

8
966 l suor1.::ia13 MSN

NSW Elections 1995
Albury Roll 39175 Badgerys Creek Roll 43531
Candidate Party Votes % Swing Candidate Party Votes % Swing
First Count First Count Cameron ALP 9748 27.9 -5.1 Cohen * LIB 17923 45.8 -3.2 Glachan * LIB 20443 58.6 -3.1 Grigg CTA 840 2. 1 +2.1 Pattinson GRN 1184 3.4 +3.4 Beamer ALP 18035 46.0 +3.3 Boardman IND 248 0.7 +0.7 Caughey COL 1012 2.6 +2.6 Strelec IND 2628 7.5 + 7.5 Thomson IND 1365 3.5 +3.5 McKenzie DEM 650 1.9 + 1.9 .... 0TH 0.0 -8.3
0TH 0.0 -5.4 Final Count
Final Count Cohen * LIB 19043 49.9 -2.6 Cameron ALP 11214 33.7 -1 .0 Beamer ALP 19150 50.1 +2.6 Glachan * LIB 22077 66.3 + 1.0 Exhausted 982 Exhausted 1610
Formal 39175 95.1 +6.9 Formal 34901 96.0 +3.2 Informal 2023 4.9 -6.9 Informal 1461 4.0 -3.2 Total 41198 94.6 Total 36362 92.8
Ashfield Roll 37170 Ballina Roll 41994
Candidate Party Votes % Swing Candidate Party Votes % Swing
First Count First Count Calvert NAN 6269 19.8 + 19.8 Black ALP 8622 22.7 -2.7 Whelan * ALP 13902 43.8 -5.4 Mafi-Williams El 767 2.0 +2.0 Mansour LIB 7836 24.7 -8.5 Page* NAT 23214 61 .1 +4.9 Collins DEM 1202 3.8 -3.9 Faulkner DEM 1736 4.6 -0.2 Wilson CTA 482 1.5 -0.2 Staples GRN 3627 9.6 +9.6 Fitzgerald GRN 2043 6.4 +6.4 .... 0TH 0.0 -13.5
0TH 0.0 -8.2 Final Count
Final Count Black ALP 11869 32.6 -4.1 Whelan* ALP 18561 65.2 +5.4 Page * NAT 24533 67.4 +4.1 Mansour LIB 9895 34.8 -5.4 Exhausted 1564 Exhausted 3278
Formal 37966 97.2 + 1.4 Formal 31734 93.5 +8.1 Informal 1084 2.8 -1.4 Informal 2222 6.5 -8.1 Total 39050 93.0 Total 33956 91.4
Auburn Roll 38215 Bankstown Roll 39123
Candidate Party Votes % Swing Candidate Party Votes % Swing
First Count First Count Harb LIB 9945 30.1 +2.1 Shedden* ALP 21747 63.5 +3.4 Nagle * ALP 21171 64.0 +2.2 Barrett LIB 10875 31. 7 -8.2 Catts LAW 805 2.4 +2.4 Meikle DEM 1062 3.1 +3.1 Morrison CTA 1150 3.5 +3.5 Smith LAW 580 1. 7 + 1.7
DEM 0.0 -5.7 Final Count 0TH 0.0 -4.5 Shedden * ALP 22350 66.2 +6.2
Final Count Barrett LIB 11394 33.8 -6.2 Harb LIB 10587 32.6 +0.7 Exhausted 520 Nagle * ALP 21887 67.4 -0.7
Formal 34264 92.8 + 16.3 Exhausted 597 Informal 2660 7.2 -16.3
Formal 33071 92.3 +6.8 Total 36924 94.4 Informal 2765 7.7 -6.8 Total 35836 93.8
9
NSW Elections 1995
Barwon Roll 37237 Bega Roll 41041
Candidate Party Votes % Swing Candidate Party Votes % Swing
First Count First Count O'Regan IND 2468 7.4 -7.0 Boland ALP 10307 27.9 -2.3 Perrett IND 549 1. 7 + 1.7 Blecher GRN 2529 6.9 +6.9 Jackson El 1258 3.8 +3.8 Howes CTA 724 2.0 +2.0 Slack-Smith NAT 20026 60.2 +9.3 Redmond DEM 1484 4.0 -7 .1 Stubbins ALP 8444 25.4 +0.5 Smith • LIB 21653 58.7 Cutlack DEM 520 1.6 -8.3 Fraser LAW 209 0.6 +0.6
Final Count Final Count Slack-Smith NAT 22158 70.1 + 5.1 Boland ALP 12981 36.3 -0.9 Stubbins ALP 9429 29.9 -5. 1 Smith * LIB 22769 63.7 +0.9 Exhausted 1678 Exhausted 11 56
Formal 33265 95.7 +2.4 Formal 36906 96.4 +4.4 Informal 1488 4.3 -2.4 Informal 1397 3.6 -4.4 Total 34753 93.3 Total 38303 93.3
Bathurst Roll 38659 Blacktown Roll 38042
Candidate Party Votes % Swing Candidate Party Votes % Swing
First Count Mullin GRN 2151 6.0 +6.0 First Count O'Callaghan AFI 1134 3.2 +3.2 Owen COL 1653 4.9 +4.9 Clough * ALP 16182 45.4 -2.8 Tyler AFI 2061 6.1 +6.1 Toole NAT 16190 45.4 +45.4 Allan• ALP 17654 52.6 +2.4
LIB 0.0 -38.7 Roberts LIB 10982 32.7 +0.7 DEM 0.0 -6.5 Bawden CTA 1199 3.6 + 1.0 0TH 0.0 -6.7 .... 0TH 0.0 -1 5.2
Final Count Final Count Clough • ALP 17825 51.0 -4.1 Allan* ALP 19340 60.6 +2.3 Toole NAT 17136 49.0 +49.0 Roberts LIB 12574 39.4 -2.3
LIB 0 0.0 -44.9 Exhausted 1635 Exhausted 696
Formal 33549 93.6 +6.2 Formal 35657 96.7 +2.7 Informal 2312 6.4 -6.2 Informal 1220 3.3 -2.7 Total 35861 94.3 Total 36877 95.4
Bligh Roll 40234 Baulkham Hills Roll 38246
Candidate Party Votes % Swing Candidate Party Votes % Swing
First Count First Count Milson GRN 1697 5.0 +5.0 Eder AFI 3037 8.7 +8.7 Fisher LIB 13636 40.1 -0.1 Merton • LIB 20644 58.9 -6.4 Moore * IND 12356 36.3 -7.4 Kassas CTA 1438 4.1 +4.1 Lippmann LAW 142 0.4 +0.4 Hay ALP 9946 28.4 +2.2 Harben ALP 6191 18.2 +2.1
DEM 0.0 -8.6 Final Count
Final Count Fisher LIB 14359 44.5 +0.6 Merton • LIB 22605 67.5 -2.3 Moore • IND 17886 55.5 -0.6 Hay ALP 10895 32.5 +2.3 Exhausted 1777 Exhausted 1565
Formal 34022 96.3 +4.8 Formal 35065 95.9 +5.2 Informal 1300 3.7 -4.8 Informal 1517 4.1 -5.2 Total 35322 87.8 Total 36582 95.6
10

NSW Elections 1 995
Blue Mountains Roll 38047 Bulli Roll 39180
-Candidate Party Votes % Swing Candidate Party Votes % Swing
First Count First Count Mulcahy IND 303 0.8 -1.5 Allen GRN 4193 11. 7 +4.0 Morris * IND 5951 16.6 + 16.6 Stanton LIB 11860 33.2 +2.2 Chambers LAW 180 0.5 +0.5 McManus * ALP 18137 50.8 -1.4 Rickard DEM 2489 6.9 -1.8 White CTA 1544 4.3 +0.9 Ackland IND 93 0.3 +0.3 .... DEM 0.0 -5.6 Scott LIB 9860 27.5 -14.4 Debus ALP 13412 37.4 + 1.1 Final Count
Kinny CTA 1430 4.0 -0.1 Stanton LIB 13263 38.7 + 1.9
Gaul IND 2136 6.0 +6.0 McManus * ALP 21006 61.3 -1.9
0TH 0.0 -6.7 Exhausted 1465
Final Count Formal 35734 96.2 +2.2
Scott LIB 15577 47.5 -5.2 Informal 1421 3.8 -2.2
Debus ALP 17227 52.5 +5.2 Total 37155 94.8
Exhausted 3050
Formal 35854 96.8 +2.4 Burrinjuck Roll 38338 Informal 1193 3.2 -2.4
Total 37047 97.4 Candidate Party Votes % Swing
First Count Broken Hill Roll 36360 McManus ALP 13732 40.1 -1.0
Schultz * LIB 20487 59.9 + 1.0 Candidate Party Votes % Swing
Final Count
First Count McManus ALP 13732 40.1 -1.0
Beckroge * ALP 16292 52.8 -0.4 Schultz * LIB 20487 59.9 +1.0
Kersten NAT 13236 42.9 + 14.1 Exhausted 0
Dansie IND 1324 4.3 +4.3 Formal 34219 93.9 + 7.8 LIB 0.0 -9.3 Informal 2242 6.1 -7.8 DEM 0.0 -3.6 Total 36461 95.1 0TH 0.0 -5.1
Final Count Beckroge * ALP 16677 54.7 -5.3 Cabramatta Roll 41731 Kersten NAT 13804 45.3 +5.3 Exhausted 371 Candidate Party Votes % Swing
Formal 30852 94.2 +3.8 Informal 1889 5.8 -3.8 First Count
Total 32741 90.0 Aiken 11 51 3.3 +3.3 Gattellari LIB 8636 24.5 +2.7 Meagher * ALP 23058 65.4 + 13.7 Horgan COL 907 2.6 +2.6 Reverberi DEM 1505 4.3 +2.6
0TH 0.0 -24.8
Final Count Gattellari LIB 9755 28.8 -5.2 Meagher * ALP 24174 71.2 +5.2 Exhausted 1328
Formal 35257 90.3 +8.1 Informal 3796 9.7 -8.1 Total 39053 93.6
11
NSW Elections 1995
Camden Roll 46325 Cessnock Roll 37426
Candidate Party Votes % Swing Candidate Party Votes % Swing
First Count First Count Allport IND 674 1.6 + 1.6 Cook SLL 775 2.3 +2.3 Light COL 889 2.1 + 2.1 Neilly* ALP 18680 55.5 +4.8 Kearney GRN 1923 4.5 +4.5 Holliday DEM 3620 10.8 +6.4 Whitehall CTA 1072 2.5 +2.5 Symon LIB 10581 31.4 -9.9 McKenzie IND 1592 3.8 +3.8 .... 0TH 0.0 -3.5 Primrose ALP 16637 39.3 -3.3
Final Count Kernohan * LIB 19555 46.2 -1 .6 Neilly * ALP 20348 63.1 +8.7 0TH 0.0 -9.6 Symon LIB 11888 36.9 -8.7
Final Count Exhausted 1420 Primrose ALP 18896 47.4 -1 . 1
Formal 33656 95.7 +4.3 Kernohan * LIB 20963 52.6 + 1.1 Exhausted 2483 Informal 1516 4.3 -4.3
Total 35172 94.0 Formal 42342 95.8 +6.1 Informal 1849 4.2 -6. 1
Charlestown Roll 36385 Total 44191 95.4
Candidate Party Votes % Swing Campbelltown Roll 38779
First Count Candidate Party Votes % Swing Welsh IND 3939 12.1 + 12.1
Bates LIB 8134 25.0 -4.3 First Count Kendall CTA 1012 3.1 +0.9 Head SLL 724 2.1 +2.1 Face * ALP 18186 55.9 + 1.4 Knight * ALP 17431 51.0 -4.1 Hill IND 1279 3.9 +3.9 Roberts LIB 10416 30.5 -5.6 .... DEM 0.0 -5.9 Woodger AFI 2995 8.8 +8.8 .... 0TH 0.0 -8.0 Bailey DEM 1470 4.3 -4.7
Final Count Hando CTA 1162 3.4 +3.4 Bates LIB 10741 35.8 -1 . 1
Final Count Face * ALP 19282 64.2 + 1.1 Knight * ALP 19469 61.8 + 1.9 Exhausted 2527 Roberts LIB 12026 38.2 -1.9
32550 95.1 +2.9 Exhausted 2703 Formal Informal 1660 4.9 -2.9
Formal 34198 94.2 +8.5 Total 34210 94.0 Informal 2107 5.8 -8.5 Total 36305 93.6
Clarence Roll 38432
Canterbury Roll 38658 Candidate Party Votes % Swing
Candidate Party Votes % Swing First Count Causley * NAT 18649 53.0 -0.5
First Count Lester ALP 12022 34.2 +5.3 Terrett LIB 11527 34.6 -5.9 Wrightson DEM 1062 3.0 -9.0 Nicholls IND 1077 3.2 +3.2 Haig IND 1234 3.5 +3.5 Dalrymple DEM 1014 3.0 -3.8 Thompson GRN 1250 3.6 +3.6 Warrington TAG 864 2.6 +2.6 Godfrey CP 952 2.7 +2.7 Moss* ALP 18792 56.5 +3.9 .... 0TH 0.0 -5.6
Final Count Final Count Terrett LIB 12364 38.3 -4.9 Causley * NAT 19726 58.3 -2.3 Moss* ALP 19905 61.7 +4.9 Lester ALP 14113 41.7 +2.3 Exhausted 1005 Exhausted 1330
Formal 33274 89.8 + 5.1 Formal 35169 97.0 +2.0 Informal 3793 10.2 -5.1 Informal 1105 3.0 -2.0 Total 37067 95.9 Total 36274 94.4
12

NSW Elections 1995
Coffs Harbour Roll 40112 Cronulla Roll 37926
Candidate Party Votes % Swing Candidate Party Votes % Swing
First Count First Count Field CP 406 1. 1 + 1.1 Kerr • LIB 16925 49.3 -8.5 Spencer GRN 1979 5.4 + 5.4 M.Smith CTA 710 2.1 +2.1 Clarke ALP 11064 30.4 -5.7 Solomon ALP 9847 28.7 -5. 1 Erglis IND 251 0.7 -0.7 P.Smith AFI 1103 3.2 +3.2 Fraser • NAT 19296 53.0 +0.5 Bush DEM 1077 3.1 -5.3 Dethridge IND 2945 8.1 +8.1 Hurst IND 4668 13.6 + 13.6 Rigby LAW 500 1.4 + 1.4
Final Count DEM 0.0 -6.7 0TH 0.0 -3.4 Kerr • LIB 18928 59.8 -1 .5
Solomon ALP 12734 40.2 + 1.5 Final Count Exhausted 2668 Clarke ALP 14326 41.3 -1.7
34330 96.4 Fraser • NAT 20361 58.7 + 1.7 Formal +4.3
Exhausted 1754 Informal 1288 3.6 -4.3 Total 35618 93.9
Formal 36441 96.7 + 1.4 Informal 1232 3.3 -1.4
Davidson Roll 37324 Total 37673 93.9
Candidate Party Votes % Swing
Coogee Roll 38434 First Count Weatherlake AFI 2393 7 .1 + 7.1
Candidate Party Votes % Swing Morthorpe ALP 6523 19.3 +0.3 Tuor GRN 1751 5.2 +5.2
First Count Harcourt-Norton DEM 1721 5.1 -10.5 Lynch LAW 240 0.7 +0.7 Hargreaves LAW 187 0.6 +0.6 Page • ALP 15002 44.5 + 1.0 Humpherson • LIB 21156 62.7 -2.7 Brown DEM 1045 3.1 -1.9 Doosey IND 472 1.4 + 1.4 Final Count
Martin LIB 13013 38.6 -2.4 Morthorpe ALP 8604 27.2 -0.1
Matson GRN 3131 9.3 +9.3 Humpherson • LIB 22983 72.8 +0.1
Scevity AFI 797 2.4 +2.4 Exhausted 2144
0TH 0.0 -10.5 Formal 33731 96.3 +4.4
Final Count Informal 1309 3.7 -4.4
Page • ALP 17924 56.1 +4.5 Total 35040 93.9
Martin LIB 14024 43.9 -4.5 Exhausted 1752
Formal 33700 95.9 +2.2 Drummoyne Roll 37971
Informal 1426 4.1 -2.2 %
Total 35126 91.4 Candidate Party Votes Swing --First Count Ryde GRN 2297 6.7 +2.3 Murray • ALP 14020 40.9 -6.2 Marotta CTA 445 1.3 + 1.3 Megna LIB 13542 39.5 -2.9 Hird NAN 3942 11.5 + 11.5
DEM 0.0 -2.4 0TH 0.0 -3.7
Final Count Murray • ALP 16680 52.2 -1.4 Megna LIB 15274 47.8 + 1.4 Exhausted 2292
Formal 34246 95.8 +3.7 Informal 1493 4.2 -3.7 Total 35739 94.1
13

NSW Elections 1 995
Dubbo Roll 38702 Ermington Roll 36886 --
Candidate Party Votes % Swing Candidate Party Votes % Swing
First Count First Count Johnstone CTA 2081 6.0 + 1.8 Endean DEM 1963 6.0 -2.7 Green ALP 10355 30.1 + 1. 1 Photios * LIB 16762 50.9 -5.0 Peacocke * NAT 21980 63.9 +3.3 Hutchinson AF! 2312 7.0 + 7.0
DEM 0.0 -6.2 Talbot ALP 11864 36.1 +0.7
Final Count Final Count Green ALP 10903 32.0 -1 . 1 Photios * LIB 18199 57.8 -1.8 Peacocke * NAT 23135 68.0 + 1.1 Talbot ALP 13271 42.2 + 1.8 Exhausted 378 Exhausted 1431
Formal 34416 94.8 +2.1 Formal 32901 95.2 +4.0 Informal 1889 5.2 -2. 1 Informal 1662 4.8 -4.0 Total 36305 93.8 Total 34563 93.7
East Hills Roll 36890 Fairfield Roll 38036
Candidate Party Votes % Swing Candidate Party Votes % Swing
First Count First Count Parker IND 5284 15. 7 + 15. 7 Tripodi ALP 19748 61.4 +6.2 Rogan * ALP 16732 49.6 -4.5 Oliveri LIB 9491 29.5 -3.0 Hughes LAW 269 0.8 +0.8 Cogger LAW 650 2.0 +2.0 Moffat AF! 2460 7.3 + 7.3 Cameron DEM 1766 5.5 +0.3 Sparkes LIB 8964 26.6 -9.5 Karadjis DSL 487 1.5 + 1.5
DEM 0.0 -3.1 .... CTA 0.0 -7.1 0TH 0.0 -6.6
Final Count Final Count Tripodi ALP 20815 67.1 +5.7 Rogan * ALP 19039 60.7 + 1.9 Oliveri LIB 10218 32.9 -5.7 Sparkes LIB 12342 39.3 -1.9 Exhausted 1109 Exhausted 2328
Formal 32142 90.2 +9.3 Formal 33709 95.3 +4.8 Informal 3485 9.8 -9.3 Informal 1665 4.7 -4.8 Total 35627 93.7 Total 35374 95.9
Georges River Roll 36758 Eastwood Roll 37602
Candidate Party Votes % Swing Candidate Party Votes % Swing
First Count First Count Justice AF! 2249 6.8 +6.8 Gurney ALP 8981 26.5 + 1.6 Dunphy IND 2370 7.1 + 7.1 Dunkerley DEM 2051 6.1 -2.7 Sansom ALP 11070 33.2 + 1.9 Lepelaar GRN 2124 6.3 +6.3 Ficarra LIB 16527 49.6 -2.9 Smith AF! 1667 4.9 +4.9 McLean CTA 1096 3.3 +3.3 Tink * LIB 18867 55.7 -6.7 .... DEM 0.0 -3.2 Carr LAW 192 0.6 +0.6 .... 0TH 0.0 -12.9
0TH 0.0 -4.0 Final Count
Final Count Sansom ALP 13156 42.0 + 3.4 Gurney ALP 11507 35.8 +4.5 Ficarra LIB 18175 58.0 -3.4 Tink * LIB 20649 64.2 -4.5 Exhausted 1981 Exhausted 1726
Formal 33312 95.7 +2.4 Formal 33882 96.3 +2.9 Informal 1500 4.3 -2.4 Informal 1306 3.7 -2.9 Total 34812 94.7 Total 35188 93.6
14

NSW Elections 1995
Glades ville Roll 38076 Granville Roll 38101
Candidate Party Votes % Swing Candidate Party Votes % Swing
First Count First Count Waddell NAN 3196 9.4 +9.4 Ananin CTA 2151 6.5 +3.8 Knight IND 582 1. 7 + 1.7 Osmond LIB 10086 30.7 -0.4 Plumb DEM 1960 5.8 -2.0 Van Oostveen LAW 718 2.2 +2.2 Watkins ALP 13171 38.7 -3.1 Yeadon * ALP 19893 60.6 +4.2 Malone AFI 953 2.8 +2.8 .... DEM 0.0 -3.4 Petch * LIB 14182 41.7 -6.3 .... 0TH 0.0 -6.4
CTA 0.0 -2.5 Final Count
Final Count Osmond LIB 11265 35.5 -2.5 Watkins ALP 16227 50.4 +3.3 Yeadon * ALP 20467 64.5 +2.5 Petch * LIB 15967 49.6 -3.3 Exhausted 1116 Exhausted 1850
Formal 32848 92.3 +4.7 Formal 34044 95.5 +4.5 Informal 2754 7.7 -4.7 Informal 1615 4.5 -4.5 Total 35602 93.4 Total 35659 93.7
Gordon Roll 37282 Hawkesbury Roll 40612
Candidate Party Votes % Swing Candidate Party Votes % Swing
First Count First Count Kinross * LIB 22928 68.0 -6.5 Philbey CAP 1095 3.0 +3.0 Hay CEC 156 0.5 +0.5 Kraus CTA 2271 6.2 +6.2 Barry DEM 2635 7.8 -2.6 Rozzoli * LIB 21086 57.6 -5.7 Wood SDO 1102 3.3 +3.3 Baczynskyj DEM 3042 8.3 + 1.1 Ratcliffe CTA 700 2.1 -1.8 Calvert ALP 9122 24.9 +4.1 Knowles GRN 2009 6.0 +6.0 .... 0TH 0.0 -8.8 Butland ALP 4174 12.4 + 1.1
Final Count Final Count Rozzoli * LIB 23765 68.5 -4.3 Kinross * LIB 25108 80.3 -3.3 Calvert ALP 10914 31.5 +4.3 Butland ALP 6171 19.7 +3.3 Exhausted 1937 Exhausted 2425
Formal 36616 95.1 +2.5 Formal 33704 96.8 +2.7 Informal 1871 4.9 -2.5 Informal 1106 3.2 -2.7 Total 38487 94.8 Total 34810 93.4
Heffron Roll 39282 Gosford Roll 40416
Candidate Party Votes % Swing Candidate Party Votes % Swing
First Count First Count Grusovin * ALP 20611 61.5 +3.4 Hartcher * LIB 19293 52.2 +3.3 Berriman GRN 3105 9.3 + 1.8 Adams IND 1423 3.9 +3.9 Bilyana SLL 370 1.1 + 1.1 Sansom ALP 14841 40.2 +8.0 Franklin LIB 9435 28.1 -2.2 Penfold DEM 1399 3.8 -0.9 .... DEM 0.0 -4.2
0TH 0.0 -14.3 Final Count
Final Count Grusovin * ALP 22194 68.8 + 3.1 Hartcher * LIB 20117 55.5 -1.3 Franklin LIB 10071 31.2 -3.1 Sansom ALP 16153 44.5 + 1.3 Exhausted 1256 Exhausted 686
Formal 33521 92.9 +8.9 Formal 36956 96.5 +2.4 Informal 2577 7.1 -8.9 Informal 1330 3.5 -2.4 Total 36098 91.9 Total 38286 94.7
15

NSW Elections 1995
Hurstville Roll 37274 Kiama Roll 42249
Candidate Party Votes % Swing Candidate Party Votes % Swing
First Count First Count Turk IND 1369 4.2 +4.2 Collins LIB 12814 34.2 + 1.4 lemma* ALP 18771 57.1 +8.3 Harrison * ALP 20385 54.3 +0.7 Frawley LIB 12759 38.8 -3.3 Sperling GRN 4319 11 .5 + 11.5
DEM 0.0 -3.7 .... DEM 0.0 -8.4 0TH 0.0 -5.5 .... CTA 0.0 -5.3
Final Count Final Count lemma* ALP 19410 59.6 +5.0 Collins LIB 13677 37.8 -0.8 Frawley LIB 13131 40.4 -5.0 Harrison * ALP 22472 62.2 +0.8 Exhausted 358 Exhausted 1369
Formal 32899 93.6 +4.9 Formal 37518 94.3 +4.0 Informal 2240 6.4 -4.9 Informal 2275 5.7 -4.0 Total 35139 94.3 Total 39793 94.2
lllawarra Roll 38062 Kogarah Roll 37425
Candidate Party Votes % Swing Candidate Party Votes % Swing
First Count First Count Hughes CTA 2243 6.7 + 1.7 Langton * ALP 16047 48.0 -1.5 Guinness LIB 7620 22.7 -1.0 Copeland CTA 713 2.1 +2.1 Rumble * ALP 20893 62.3 + 1.0 Chung DEM 1664 5.0 -0.9 Patrech DEM 2792 8.3 -1.6 Dombkins LIB 14981 44.8 +0.2
Final Count Final Count Guinness LIB 9431 29.5 -0.7 Langton * ALP 16912 51.5 -1.8 Rumble* ALP 22531 70.5 +0.7 Dombkins LIB 15935 48.5 + 1.8 Exhausted 1586 Exhausted 558
Formal 33548 93.2 -2.5 Formal 33405 95.0 +6.2 Informal 2450 6.8 +2.5 Informal 1741 5.0 -6.2 Total 35998 94.6 Total 35146 93.9
Keira Roll 37246 Ku-ring-gai Roll 39199
Candidate Party Votes % Swing Candidate Party Votes % Swing
First Count First Count Warner DEM 2927 8.8 -0.2 Priestly ALP 7067 19.9 + 1.6 O'Neill CTA 1885 5.7 +0.1 Gallagher IND 5932 16.7 +8.7 Markham * ALP 18346 55.3 + 3.1 O'Doherty * LIB 20271 57.1 -5.4 Cole LIB 10010 30.2 -3.0 Sharah CTA 624 1.8 -0.5
Final Count Ward DEM 1633 4.6 -4.5
Markham * ALP 20293 63.9 +3.4 Final Count Cole LIB 11480 36.1 -3.4 Priestly ALP 10290 31.0 +3.7 Exhausted 1395 O'Doherty * LIB 22912 69.0 -3.7
Formal 33168 94.4 +4.6 Exhausted 2325
Informal 1958 5.6 -4.6 Formal 35527 96.6 +2.9 Total 35126 94.3 Informal 1251 3.4 -2.9
Total 36778 93.8
16

NSW Elections 1995
Lachlan Roll 37541 Lane Cove Roll 38165
Candidate Party Votes % Swing Candidate Party Votes % Swing
First Count First Count Armstrong * NAT 23560 69.4 + 12.8 Longbottom IND 1626 4.8 +4.8 Cox DEM 1787 5.3 + 1.6 Little GRN 1753 5.1 + 5.1 Carney ALP 8578 25.3 -3.0 Lawrence-Rowe ALP 5542 16.3 -1.9
0TH 0.0 -11 .4 Astridge NAN 4658 13.7 + 13.7
Final Count Baird DEM 1882 5.5 -8.7
Armstrong * NAT 24303 72.4 +6.2 Chikarovski * LIB 18579 54.6 -12.9
Carney ALP 9248 27.6 -6.2 Final Count Exhausted 374 Lawrence-Rowe ALP 9396 29.8 +3.5
Formal 33925 94.8 +2.2 Chikarovski * LIB 22165 70.2 -3.5
Informal 1843 5.2 -2.2 Exhausted 2479
Total 35768 95.3 Formal 34040 96.9 +4.1 Informal 1082 3.1 -4.1 Total 35122 92.0 --
Lake Macquarie Roll 38445
Candidate Party Votes % Swing Lismore Roll 37047 -
First Count Candidate Party Votes % Swing Godfrey DEM 3020 8.8 + 1.9 Brewster LIB 10756 31.2 +3.3 First Count Hunter * ALP 20723 60.1 +6.7 Ouartly DEM 1163 3.5 -2.8
0TH 0.0 -12.0 Spence CP 605 1.8 + 1.8
Final Count End 2457 7.4 + 7.4 Maxwell ALP 8260 24.8 -3.2
Brewster LIB 11877 35.2 -2.1 Baxter IND 1583 4.7 +4.7
Hunter * ALP 21864 64.8 +2.1 Rixon * NAT 19292 57.8 +0.3 Exhausted 758 GRN 0.0 -4.6 .... Formal 34499 94.9 +3.2 .... 0TH 0.0 -3.6 Informal 1865 5. 1 -3.2
Final Count Total 36364 94.6 Maxwell ALP 11646 36.3 -1.4
Rixon * NAT 20403 63.7 + 1.4 Exhausted 1 311
Lakemba Roll 38613 Formal 33360 96.0 + 1.7
Candidate Party % Swing Informal 1408 4.0 -1. 7
Votes Total 34768 93.8 --
First Count Gorrie 3468 10.6 + 10.6 Newman DEM 1644 5.0 -3.6 Liverpool Roll 42835 Hawatt LIB 8480 25.9 -6.1 Stewart ALP 19115 58.4 +6.8 Candidate Party Votes % Swing
0TH 0.0 -7.7
Final Count First Count Lynch ALP 24042 69.1 + 11.5
Hawatt LIB 9304 31.3 -9.3 Galea LIB 10733 30.9 + 7.1
Stewart ALP 20448 68.7 +9.3 DEM 0.0 -3.2 Exhausted 2955
....
.... 0TH 0.0 -15.4 Formal 32707 91.3 + 7.1
Final Count Informal 3135 8.7 -7.1 Lynch ALP 24042 69.1 +2.6 Total 35842 92.8 Galea LIB 10733 30.9 -2.6
Exhausted 0
Formal 34775 87.9 +2.4 Informal 4774 12. 1 -2.4 Total 39549 92.3
17

NSW Elections 1995
Londonderry Roll 41612 Maroubra Roll 37945
Candidate Party Votes % Swing Candidate Party Votes % Swing
First Count First Count McKenzie LIB 10869 30.2 -5.8 Curphey GRN 2052 6.2 +6.2 Rains CTA 1404 3.9 +3.9 Larcos DEM 1015 3.1 -2.5 Smith COL 1994 5.5 +5.5 Carr * ALP 18989 57.4 +0.1 Gibson * ALP 21724 60.4 -3.7 Barber LIB 11030 33.3 -3.7
Final Count Final Count McKenzie LIB 12093 34.7 -1.3 Carr * ALP 20528 63.8 +3.0 Gibson * ALP 22754 65.3 + 1.3 Barber LIB 11646 36.2 -3.0 Exhausted 1144 Exhausted 912
Formal 35991 93.1 + 15.3 Formal 33086 94.9 +6.9 Informal 2679 6.9 -15.3 Informal 1794 5.1 -6.9 Total 38670 92.9 Total 34880 91.9
Maitland Roll 40006 Marrickville Roll 38346
Candidate Party Votes % Swing Candidate Party Votes % Swing
First Count First Count Blackmore * LIB 19008 50.9 + 14.2 Passmore DEM 1798 5.5 -1.8 Bellamy DEM 1208 3.2 -0.1 Fletcher DSL 450 1.4 + 1.4 Davis GRN 1973 5.3 +5.3 Refshauge * ALP 15587 47.6 -7.3 Keating ALP 15149 40.6 +4.1 Welch GRN 2394 7.3 -5.7
0TH 0.0 -23.5 Butler NAN 7748 23.6 +23.6
Final Count Kurfurst IND 442 1.3 + 1.3 Henderson LIB 4346 13.3 -11. 7
Blackmore * LIB 19863 54.1 +3.5 Keating ALP 16851 45.9 -3.5 Final Count Exhausted 624 Refshauge * ALP 18022 60.5 -9.4
Formal 37338 96.7 +4.2 Butler NAN 11790 39.5 + 39.5 Henderson LIB 0 0.0 -30.2
Informal 1277 3.3 -4.2 Exhausted 2953
Total 38615 96.5 Formal 32765 94.4 + 7.9 Informal 1962 5.6 -7.9
Manly Roll 37946 Total 34727 90.6
--Candidate Party Votes % Swing
Miranda Roll 37861 First Count Green ALP 4666 13.5 -2.2 Candidate Party Votes % Swing Oldfield LIB 15343 44.5 -1.2 MacDonald * IND 13092 38.0 +3.0 First Count Swan CTA 516 1.5 + 1.5 Smith ALP 12353 35.7 +0.7 Dee DEM 877 2.5 -1 . 1 Copeland CTA 921 2.7 +2.7
Final Count Phillips * LIB 17097 49.4 -7.4 Tallis sos 1585 4.6 +4.6
Oldfield LIB 16433 49.6 +0.3 Perry AFI 1376 4.0 +4.0
MacDonald * IND 16676 50.4 -0.3 Levett DEM 1257 3.6 -4.5
Exhausted 1385
Formal 34494 96.9 +3.3 Final Count Smith ALP 14239 43.3 +3.6
Informal 1117 3.1 -3.3 Phillips * LIB 18623 56.7 -3.6 Total 35611 93.8
Exhausted 1727
Formal 34589 96.5 +4.7 Informal 1257 3.5 -4.7 Total 35846 94.7
18

NSW Elections 1 995
Monaro Roll 39437 Murray Roll 37845
Candidate Party Votes % Swing Candidate Party Votes % Swing --
First Count First Count Kemp ALP 9339 26.6 -5.4 Hargreaves ALP 7061 22.4 +6.2 Tulau DEM 1103 3.1 -5.6 Small* NAT 24495 77.6 +3.2 Cochran • NAT 20641 58.8 -0.4 .... DEM 0.0 -4.0 Moore GRN 2657 7.6 + 7.6 .... 0TH 0.0 -5.4 Ferguson CTA 1351 3.9 +3.8
Final Count Final Count Hargreaves ALP 7061 22.4 +3.8 Kemp ALP 11346 33.8 -3.6 Small* NAT 24495 77.6 -3.8 Cochran • NAT 22267 66.2 +3.6 Exhausted 0 Exhausted 1478
Formal 31556 93.0 -1.6 Formal 35091 95.8 +5.8 Informal 2371 7.0 + 1.6 Informal 1556 4.2 -5.8 Total 33927 89.6 Total 36647 92.9
Murrumbidgee Roll 37679 Moorebank Roll 41676
Candidate Party Votes % Swing Candidate Party Votes % Swing
First Count First Count Cruickshank * NAT 20222 60.2 + 12.5 Knowles * ALP 20004 54.2 +9.0 Catanzariti ALP 13384 39.8 + 10.5 Woodbridge AFI 2681 7.3 + 7.3 .... DEM 0.0 -2.1 Seacy IND 1148 3.1 + 3.1 .... 0TH 0.0 -20.9 Jones CTA 977 2.6 + 1.0
Final Count Pascale LIB 11267 30.5 -2.5 Allen IND 851 2.3 +2.3
Cruickshank * NAT 20222 60.2 -1.6
DEM 0.0 -2.9 Catanzariti ALP 13384 39.8 + 1.6
0TH 0.0 -17.3 Exhausted 0
Final Count Formal 33606 93.3 +0.2
Knowles * ALP 21796 62.8 +8.4 Informal 2415 6.7 -0.2
Pascale LIB 12895 37.2 -8.4 Total 36021 95.6
Exhausted 2237
Formal 36928 94.6 +6.3 Murwillumbah Roll 40107
Informal 2112 5.4 -6.3 Total 39040 93.7
Candidate Party Votes % Swing
First Count Mount Druitt Roll 40760 Beck * NAT 14701 41.2 +4.3
Morrison CP 213 0.6 +0.6 Candidate Party Votes % Swing Leonard GRN 1543 4.3 +4.3
Diamond IND 665 1.9 + 1.9 First Count Wilson ALP 10005 28.0 -1.7 Amery * ALP 21775 61.4 +6.6 Evans IND 100 0.3 +0.3 Wyness CTA 1775 5.0 + 1.8 Hurley IND 8139 22.8 +6.4 Mackenzie LIB 10192 28.8 -0.2 Harradine AFI 359 1.0 + 1.0 Ivor F IND 1706 4.8 +2.7 .... DEM 0.0 -2.5
DEM 0.0 -2.6 .... IND 0.0 -14.6 0TH o.o -8.4
Final Count Final Count Beck * NAT 16713 52.1 -1.0 Amery * ALP 22759 66.7 +3.7 Wilson ALP 15394 47.9 + 1.0 Mackenzie LIB 11351 33.3 -3.7 Exhausted 3618 Exhausted 1338
Formal 35725 95.9 +0.6 Formal 35448 93.0 + 7.5 Informal 1511 4.1 -0.6 Informal 2665 7.0 -7.5 Total 37236 92.8 Total 38113 93.5
19

NSW Elections 1995
Myall Lakes Roll 38888 Northcott Roll 38416
Candidate Party Votes % Swing Candidate Party Votes % Swing
First Count First Count Bridge AFI 2477 7.1 + 7.1 Leigh ALP 8178 23.7 +6.4 Turner * NAT 21213 60.4 -1.0 Reddy DEM 3589 10.4 -1 .0 Gill GRN 2269 6.5 +6.5 Van Wyk AFI 2034 5.9 +5.9 Lewis ALP 9159 26.1 -1.3 O'Farrell LIB 20747 60.1 -7.9
DEM 0.0 -6.1 .... CTA 0.0 -3.5 CTA 0.0 -5.1
Final Count Final Count Leigh ALP 10358 31.4 + 7.8 Turner * NAT 22781 68.4 -0.2 O'Farrell LIB 22657 68.6 -7.8 Lewis ALP 10531 31.6 +0.2 Exhausted 1533 Exhausted 1806
Formal 34548 96.5 +3.3 Formal 35118 95.3 + 1.6 Informal 1243 3.5 -3.3 Informal 1736 4.7 -1.6 Total 35791 93.2 Total 36854 94.8
Northern Tablelands Roll 38299 Newcastle Roll 35799
Candidate Party Votes % Swing Candidate Party Votes % Swing
First Count First Count Chappell * NAT 17823 52.0 -2.6 Jacobi GRN 4370 13.8 + 13.8 Chant LAW 923 2.7 +2.7 Fleming LIB 9162 29.0 +8.3 Harrold IND 7262 21.2 + 21.2 Gaudry •- ALP 17360 54.9 +4.8 Funnell ALP 8284 24.2 -7.4 Emanuel DSL 736 2.3 +2.3 .... DEM 0.0 -4.1 .... (Keegan) IND 0.0 -21.0 .... 0TH 0.0 -9.7
DEM 0.0 -5.8 Final Count 0TH 0.0 -2.5 Chappell * NAT 20373 63.7 +2.2
Final Count Funnell ALP 11610 36.3 -2.2 Fleming LIB 10310 33.9 +33.9 Exhausted 2309 Gaudry * ALP 20107 66.1 +3.7
Formal 34292 95.7 + 1.6 .... (Keegan) IND 0 0.0 -37.6 Exhausted 1 211 Informal 1537 4.3 -1 .6
Total 35829 93.6 Formal 31628 95.2 +2.6 Informal 1596 4.8 -2.6 Total 33224 92.8
Orange Roll 38306
--North Shore Roll 36815 Candidate Party Votes % Swing
Candidate Party Votes % Swing First Count West* NAT 20971 60.0 +9.7
First Count McLean CTA 1331 3.8 + 1.5 Skinner * LIB 19756 60.9 +9.8 Cianfrano IND 997 2.9 +2.9 Wade DEM 3039 9.4 +9.4 Eldershaw El 1197 3.4 + 3.4 Voltz ALP 6703 20.7 + 12.8 Taylor ALP 10451 29.9 + 14.4 Murchie GRN 2940 9.1 + 9.1 .... (Sullivan) IND 0.0 -30.0 .... (Read) IND 0.0 -41.0 .... IND 0.0 -1 .8
Final Count Final Count Skinner * LIB 21481 69.2 + 16.7 West* NAT 22623 66.4 + 11.1 Voltz ALP 9554 30.8 +30.8 Taylor ALP 11439 33.6 +33.6 .... (Read) IND 0 0.0 -47.5 .... (Sullivan) IND 0 0.0 -44.7 Exhausted 1403 Exhausted 885
Formal 32438 96.7 +2.3 Formal 34947 96.0 + 1.4 Informal 1107 3.3 -2.3 Informal 1450 4.0 -1 .4 Total 33545 91.1 Total 36397 95.0
20

NSW Elections 1995
Oxley Roll 37571 Penrith Roll 37280 --Candidate Party Votes % Swing Candidate Party Votes % Swing
First Count First Count Jeffery * NAT 20773 61.2 +3.8 Grigg CTA 1229 3.6 +0.2 Sanders El 969 2.9 +2.9 Lo Po * ALP 15621 46.0 -1.6 Murtagh ALP 10065 29.7 -4.0 Aitken LIB 14287 42.1 + 1.7 Graham GRN 2134 6.3 +6.3 Quinn IND 1612 4.7 +4.7
DEM 0.0 -7.3 Watson DEM 1197 3.5 -0.2 0TH 0.0 -1. 7 .... 0TH 0.0 -4.9
Final Count Final Count Jeffery * NAT 21484 64.8 +3.3 Lo Po * ALP 17421 52.8 -1.8 Murtagh ALP 11674 35.2 -3.3 Aitken LIB 15578 47.2 + 1.8 Exhausted 783 Exhausted 947
Formal 33941 96.3 +2.6 Formal 33946 95.9 +3.2 Informal 1319 3.7 -2.6 Informal 1445 4.1 -3.2 Total 35260 93.8 Total 35391 94.9
Parramatta Roll 37720 Pittwater Roll 38746
Candidate Party Votes % Swing Candidate Party Votes % Swing
First Count First Count Jonsson CTA 1657 4.9 +4.9 Bristow CTA 1070 3.1 + 3.1 Beck LIB 12089 36.0 -6.6 Sargent ALP 6631 19.0 + 1.5 Cogger LAW 365 1 . 1 + 1.1 Pash IND 532 1 .5 + 1.5 Avila DEM 1097 3.3 -1.3 Longley * LIB 21244 60.9 -5.4 Harrison * ALP 18340 54.7 + 10.4 Baker DEM 1503 4.3 -11.9
0TH 0.0 -8.5 Cairns GRN 3882 11 . 1 + 11.1
Final Count Final Count Beck LIB 13285 40.8 -6.6 Sargent ALP 9631 29.2 +2.6 Harrison * ALP 19275 59.2 +6.6 Longley * LIB 23381 70.8 -2.6 Exhausted 988 Exhausted 1850
Formal 33548 94.7 +4.5 Formal 34862 96.1 +4.9 Informal 1863 5.3 -4.5 Informal 1397 3.9 -4.9 Total 35411 93.9 Total 36259 93.6
Peats Roll 39553
Candidate Party Votes % Swing
First Count Andrews ALP 18788 52.7 -2.3 Ellis IND 3401 9.5 +9.5 Bojanic LIB 13491 37.8 +5.2
DEM 0.0 -4.5 0TH 0.0 -8.0
Final Count Andrews ALP 20131 58.4 -2.6 Bojanic LIB 14329 41.6 +2.6 Exhausted 1220
Formal 35680 95.2 + 3.1 Informal 1816 4.8 -3.1 Total 37496 94.8
21

NSW Elections 1995
Port Jackson Roll 37869 Port Stephens Roll 40521
Candidate Party Votes % Swing Candidate Party Votes % Swing
First Count First Count Nori • ALP 17696 53.6 +2.9 Hellyer DEM 1104 3.0 -2.4 Piscioneri DEM 1059 3.2 +0.5 Martin • ALP 18917 51.6 -2.9 Wood CTA 281 0.9 +0.2 Dover CTA 1446 3.9 +3.9 Bourne LIB 6085 18.4 + 1.2 Burgess GRN 2281 6.2 +6.2 Doherty IND 1387 4.2 +4.2 McCormack LIB 12897 35.2 +6.5 Greenland NAN 6496 19. 7 + 19.7 .... NAT 0.0 -11.4 .... (Fraser) IND 0.0 -18.9
Final Count GRN 0.0 -7.0 0TH 0.0 -2.8 Martin * ALP 20739 59.0 -1 . 1
McCormack LIB 14440 41.0 + 1.1 Final Count Exhausted 1466 Nori • ALP 19564 63.6 -0.1
36645 94.3 Greenland NAN 11180 36.4 + 36.4 Formal + 1.4
.... (Fraser) IND 0 0.0 -36.3 Informal 2222 5.7 -1.4
Exhausted 2260 Total 38867 95.9
Formal 33004 96.3 +2.4 Informal 1269 3.7 -2.4
Riverstone Roll 41424 Total 34273 90.5
Candidate Party Votes % Swing
Port Macquarie Roll 39735 First Count Clancy DEM 2282 6.2 +3.0
Candidate Party Votes % Swing Morris LIB 12675 34.4 -1 . 1 Aquilina • ALP 20597 55.9 +4.3
First Count Bowden CTA 1294 3.5 + 1.4 Conroy El 869 2.4 +2.4 .... 0TH 0.0 -7.6 Machin * NAT 19175 52.6 -2.1 Russell GRN 1883 5.2 +5.2
Final Count
Stafford CTA 952 2.6 +0.4 Morris LIB 14070 39.4 -3.1
Lockwood IND 2026 5.6 +5.6 Aquilina * ALP 21666 60.6 + 3.1
Orr CP 621 1. 7 + 1.7 Exhausted 1112
Murphy ALP 10898 29.9 + 7.4 Formal 36848 94.2 + 5.1 IND 0.0 -17 .5 Informal 2263 5.8 -5.1 DEM 0.0 -3.0 Total 39111 94.4
-Final Count Machin * NAT 21068 61.7 -6.0 Murphy ALP 13088 38.3 +6.0 Rockdale Roll 36781 Exhausted 2268
Formal 36424 96.4 + 1.9 Candidate Party Votes % Swing
Informal 1377 3.6 -1.9 Total 37801 95.1 First Count
Taylor TAG 1324 4.1 +4.1 Thompson • ALP 17827 55.4 +4.7 Abel LIB 11541 35.9 -3.9 Murphy DEM 1479 4.6 + 1.2
0TH 0.0 -6.2
Final Count Thompson * ALP 19134 61.2 +4.4 Abel LIB 12125 38.8 -4.4 Exhausted 912
Formal 32171 92.9 +6.1 Informal 2477 7.1 -6.1 Total 34648 94.2
22
NSW Elections 1995
Smithfield Roll 41146 St Marys Roll 36521
Candidate Party Votes % Swing Candidate Party Votes % Swing
First Count First Count Poularas DEM 2442 6.8 +6.8 Anderson ALP 20131 63.2 +2.0 Robertson LIB 11 711 32.8 -1.0 Saunders DEM 2809 8.8 +0.4 Scully * ALP 21530 60.3 +8.3 Anastasiadis LIB 8921 28.0 -2.4
0TH 0.0 -14.1 Final Count
Final Count Anderson ALP 21324 68.9 +2.4 Robertson LIB 12692 36.3 -6.7 Anastasiadis LIB 9645 31.1 -2.4 Scully * ALP 22266 63.7 +6.7 Exhausted 892 Exhausted 725
Formal 31861 92.6 +3.0 Formal 35683 91.9 + 7.9 Informal 2533 7.4 -3.0 Informal 3166 8.1 -7.9 Total 34394 94.2 Total 38849 94.4
Strathfield Roll 36795 South Coast Roll 37929
Candidate Party Votes % Swing Candidate Party Votes % Swing
First Count First Count Zammit * LIB 17371 53.4 -1.9 Husted ALP 9904 28.9 + 11.5 Doric LAW 402 1.2 + 1.2 Hutton IND 540 1.6 + 1.6 Anderson DEM 1613 5.0 -3.1 Hatton IND 6487 18.9 -32.4 Timbrell ALP 13114 40.4 +3.8 Ryan CTA 929 2.7
Final Count Ellis LIB 14685 42.9 + 14.4 Leatch GRN 1724 5.0 +5.0
Zammit * LIB 17928 56.0 -3.3 Timbrell ALP 14110 44.0 +3.3
Final Count Exhausted 462 Husted ALP 13959 45.4 +45.4
94.6 Hatton IND 0 0.0 -68.3 Formal 32500 +6.4
Ellis LIB 16815 54.6 +22.9 Informal 1871 5.4 -6.4
Exhausted 3495 Total 34371 93.4
Formal 34269 95.9 +2.4 Informal 1467 4.1 -2.4
Sutherland Roll 41285 Total 35736 94.2
Candidate Party Votes % Swing
Southern Highlands Roll 38826 First Count Downy* LIB 19440 50.8 + 1.5
Candidate Party Votes % Swing Percival CTA 1520 4.0 +4.0 Rankin ALP 14284 37.4 -2.1
First Count Clarke IND 2988 7.8 + 7.8 Butler DEM 1619 4.5 -4.8 .... DEM 0.0 -5.3 Sullivan ALP 11584 32.5 -5.1 .... 0TH 0.0 -6.0 Watchirs GRN 2014 5.7 +5.7
Final Count Fahey* LIB 19421 54.6 +6.5 Simos CTA 956 2.7 -2.3
Downy* LIB 21165 56.4 +3.4 Rankin ALP 16336 43.6 -3.4
Final Count Exhausted 731 Sullivan ALP 13711 39.6 -3.9
Formal 38232 96.4 +2.7 Fahey* LIB 20886 60.4 +3.9 Exhausted 997 Informal 1419 3.6 -2.7
Total 39651 96.0 Formal 35594 96.2 +4.4 Informal 1400 3.8 -4.4 Total 36994 95.3
23

NSW Elections 1 995
Swansea Roll 39570 The Hills Roll41975
Candidate Party Votes % Swing Candidate Party Votes % Swing
First Count First Count Coghlan LIB 10977 30.7 + 12.4 Pettitt IND 1590 4.2 +4.2 Booth IND 5947 16.6 + 16.6 Baggs DEM 2564 6.8 +2.5 Hall ALP 18846 52.7 + 7.1 Richardson * LIB 26126 69.1 +6.6 .... (Welsh) IND 0.0 -24.1 Brooks ALP 7546 19.9 + 7.5
DEM 0.0 -5.0 .... (Potter} IND 0.0 -20.8 0TH 0.0 -6.9
Final Count Final Count Richardson * LIB 27564 75.3 + 7.9 Coghlan LIB 13611 39.5 +39.5 Brooks ALP 9038 24.7 +24.7 Hall ALP 20830 60.5 +4.1 .... (Potter) IND 0 0.0 -32.6 .... (Welsh) IND 0 0.0 -43.6 Exhausted 1224 Exhausted 1329
Formal 37826 96.1 +2.3 Formal 35770 95.2 +2.7 Informal 1521 3.9 -2.3 Informal 1787 4.8 -2.7 Total 39347 93.7 Total 37557 94.9
Tamworth Roll 37839 Upper Hunter Roll 38515
Candidate Party Votes % Swing Candidate Party Votes % Swing
First Count First Count Windsor * IND 28433 82.2 +45.9 Baks ALP 10521 31.0 -0.9 Robertson ALP 4985 14.4 -1.2 Souris * NAT 23421 69.0 + 10.8 Tracy CP 1186 3.4 +3.4 .... 0TH 0.0 -9.9
NAT 0.0 -31.9 Final Count .... (Evans} IND 0.0 -14.1 Baks ALP 10521 31.0 -4.3
DEM 0.0 -2.1 Souris * NAT 23421 69.0 +4.3
Final Count Exhausted 0 Windsor* IND 29088 84.8 +25.0
Formal 33942 93.0 +0.1 Robertson ALP 5215 15.2 + 15.2 NAT 0 0.0 -40.2
Informal 2542 7.0 -0.1
Exhausted 301 Total 36484 94.7
Formal 34604 96.5 +0.7 Informal 1271 3.5 -0.7
Vaucluse Roll 38685 Total 35875 94.8
Candidate Party Votes % Swing The Entrance Roll 39587
First Count Candidate Party Votes % Swing Debnam * LIB 19576 59.2 +4.1
de Merindol DEM 1277 3.9 +0.4 First Count Mcloughlin GRN 3331 10.1 + 5.1 Freemantle CTA 1158 3.2 +3.2 Armitage ALP 8695 26.3 +8.9 Whaite AFI 1899 5.3 +5.3 Boland LAW 212 0.6 +0.6 Griffiths DEM 1340 3.8 -2.1 .... (Watson} IND 0.0 -14.5 McBride * ALP 16933 47.4 +4.3 .... 0TH 0.0 -4.7 Eaton LIB 14369 40.3 -5.9
Final Count IND 0.0 -4.9 Debnam * LIB 20540 65.4 +2.4
Final Count Armitage ALP 10862 34.6 +34.6 McBride * ALP 18441 54.1 +4.3 .... (Watson} IND 0 0.0 -37.0 Eaton LIB 15642 45.9 -4.3 Exhausted 1689 Exhausted 1616
Formal 33091 95.8 + 5.1 Formal 35699 96.0 +4.2 Informal 1449 4.2 -5.1 Informal 1494 4.0 -4.2 Total 34540 89.3 Total 37193 94.0
24

NSW Elections 1995
Wagga Wagga Roll 39097 Waratah Roll 35765
Candidate Party Votes % Swing Candidate Party Votes % Swing
First Count First Count Rees IND 3103 8.9 +8.9 Rene GRN 3743 11.7 +11.7 Schipp • LIB 19566 56.1 -9.7 Price • ALP 20975 65.7 +0.6 McPherson ALP 12227 35.0 +0.9 Shoobridge LIB 7222 22.6 -1.9
Final Count .... 0TH 0.0 -10.4
Schipp • LIB 20702 60.7 -5. 1 Final Count McPherson ALP 13415 39.3 + 5.1 Price • ALP 22801 74.1 +3.1 Exhausted 779 Shoobridge LIB 7972 25.9 -3.1
Formal 34896 95.2 + 10.1 Exhausted 1167
Informal 1752 4.8 -10.1 Formal 31940 93.6 +5.4 Total 36648 93.7 Informal 2166 6.4 -5.4
Total 34106 95.4
Wakehurst Roll 38079 Willoughby Roll 38127
Candidate Party Votes % Swing Candidate Party Votes % Swing
First Count First Count Hazzard • LIB 18524 54.5 -0.9 Wiseham AFI 1866 5.6 +5.6 Webster LAW 479 1.4 + 1.4 Fraser DEM 3030 9.1 +6.2 Armstrong ALP 10152 29.8 +3.8 Collins • LIB 20775 62.2 +4.9 Adam DEM 1880 5.5 -2.0 Reiss ALP 7711 23.1 + 10.5 Kitson AFI 2163 6.4 +6.4 .... (Weingarth) IND 0.0 -25.0 Maher CTA 820 2.4 +2.4 .... CTA 0.0 -2.2
0TH 0.0 -11 . 1 Final Count
Final Count Collins • LIB 22522 70.0 +8.0 Hazzard • LIB 20188 62.9 +0.2 Reiss ALP 9654 30.0 +30.0 Armstrong ALP 11899 37.1 -0.2 .... (Weingarth) IND 0 0.0 -38.1 Exhausted 1931 Exhausted 1206
Formal 34018 95.5 +4.8 Formal 33382 95.2 + 2.1 Informal 1592 4.5 -4.8 Informal 1692 4.8 -2.1 Total 35610 93.5 Total 35074 92.0
Wollongong Roll 36831 Wallsend Roll 38708
Candidate Party Votes % Swing Candidate Party Votes % Swing
First Count First Count Douglas GRN 3607 11.4 +6.1 Nesbitt LIB 12881 37.5 + 7.7 Steel LIB 7662 24.3 + 13.7 Mills* ALP 21454 62.5 +6.5 Grijak SLL 383 1.2 + 1.2
DEM 0.0 -9.4 Sullivan • ALP 18610 58.9 +8.7 CTA 0.0 -4.8 Smidlers CTA 758 2.4 + 1.1
Final Count Pickering DSL 561 1 .8 + 1.8
Nesbitt LIB 12881 37.5 +0.7 .... (Arkell) IND 0.0 -29.7
Mills* ALP 21454 62.5 -0.7 .... DEM 0.0 -3.0
Exhausted 0 Final Count
Formal 34335 92.6 +2.8 Steel LIB 8887 29.9 +29.9 Sullivan • ALP 20823 70.1 + 11.5
Informal 2731 7.4 -2.8 .... (Arkell) IND 0 0.0 -41.4
Total 37066 95.8 Exhausted 1871
Formal 31581 92.1 +4.5 Informal 2710 7.9 -4.5 Total 34291 93.1
25

NSW Elections 1995
Wyong Roll 40040 --Candidate Party Votes % Swing
First Count Richardson LIB 14584 41.3 +4.0 Crittenden * ALP 20748 58.7 +5.6
DEM 0.0 -4.2 0TH 0.0 -5.4
Final Count Richardson LIB 14584 41.3 +0.3 Crittenden * ALP 20748 58.7 -0.3 Exhausted 0
Formal 35332 93.6 + 1.2 Informal 2433 6.4 -1 .2 Total 37765 94.3
26

NSW Elections 1995
LEGISLATIVE ASS EMBLY : SUMMARY OF TWO-PARTY RESULTS BY ELECTORATE
Electoral 2PP Votes 2PP Percentage District ALP Lib/Nat ALP Lib/Nat Swing
Albury 11214 22077 33.7 66.3 1 .0 to Lib/Nat Ashfield 18561 9895 65.2 34.8 5.4 to Labor Auburn 21887 10587 67.4 32.6 0. 7 to Lib/Nat Badgerys Creek 19150 19043 50.1 49.9 2.6 to Labor Ballina 11869 24533 32.6 67.4 4. 1 to Lib/Nat Bankstown 22350 11394 66.2 33.8 6.2 to Labor Barwon 9429 22158 29.9 70.1 5. 1 to Lib/Nat Bathurst 17825 17136 51.0 49.0 4. 1 to Lib/Nat Baulkham Hills 10895 22605 32.5 67.5 2.3 to Labor Bega 12981 22769 36.3 63.7 0.9 to Lib/Nat Blacktown 19340 12574 60.6 39.4 2.3 to Labor Bligh (1) 11766 17846 39.7 60.3 4.3 to Labor Blue Mountains 17227 15577 52.5 47.5 5.2 to Labor Broken Hill 16677 13804 54.7 45.3 5. 3 to Lib/Nat Bulli 21006 13263 61.3 38.7 1.9 to Lib/Nat Burrinjuck 13732 20487 40.1 59.9 1 .0 to Lib/Nat Cabramatta 24174 9755 71.2 28.8 5.2 to Labor Camden 18896 20963 47.4 52.6 1 . 1 to Lib/Nat Campbelltown 19469 12026 61.8 38.2 1.9 to Labor Canterbury 19905 12364 61.7 38.3 4.9 to Labor Cessnock 20348 11888 63.1 36.9 8. 7 to Labor Charlestown 19282 10741 64.2 35.8 1 .1 to Labor Clarence 14113 19726 41.7 58.3 2.3 to Labor Coffs Harbour 14326 20361 41.3 58.7 1 . 7 to Lib/Nat Coogee 17924 14024 56.1 43.9 4.5 to Labor Cronulla 12734 18928 40.2 59.8 1.5 to Labor Davidson 8604 22983 27.2 72.8 0. 1 to Lib/Nat Drummoyne 16680 15274 52.2 47.8 1 .4 to Lib/Nat Dubbo 10903 23135 32.0 68.0 1 . 1 to Lib/Nat East Hills 19039 12342 60.7 39.3 1.9 to Labor Eastwood 11507 20649 35.8 64.2 4.5 to Labor Ermington 13271 18199 42.2 57.8 1.8 to Labor Fairfield 20815 10218 67.1 32.9 5.7 to Labor Georges River 13156 18175 42.0 58.0 3.4 to Labor Gladesville 16227 15967 50.4 49.6 3.3 to Labor Gordon 6171 25108 19.7 80.3 3.3 to Labor Gosford 16153 20117 44.5 55.5 1.3 to Labor Granville 20467 11265 64.5 35.5 2.5 to Labor Hawkesbury 10914 23765 31.5 68 .. 5 4.3 to Labor Heffron 22194 10071 68.8 31.2 3.1 to Labor Hurstville 19410 13131 59.6 40.4 5.0 to Labor lllawarra 22531 9431 70.5 29.5 0. 7 to Labor Keira 20293 11480 63.9 36.1 3.4 to Labor Kiama 22472 13677 62.2 37.8 0.8 to Labor Kogarah 16912 15935 51.5 48.5 1 . 8 to Lib/Nat Ku-ring-gai 10290 22912 31.0 69.0 3.7 to Labor Lachlan 9248 24303 27.6 72.4 6.2 to Lib/Nat Lake Macquarie 21864 11877 64.8 35.2 2.1 to Labor Lakemba 20448 9304 68.7 31.3 9.3 to Labor Lane Cove 9396 22165 29.8 70.2 3.5 to Labor Lismore 11646 20403 36.3 63.7 1 .4 to Lib/Nat Liverpool 24042 10733 69.1 30.9 2.6 to Labor Londonderry 22754 12093 65.3 34.7 1.3 to Labor Maitland 16851 19863 45.9 54.1 3.5 to Lib/Nat
27

NSW Elections 1995
LEGISLATIVE ASSEMBLY: SUMMARY OF TWO-PARTY RESULTS BY ELECTORATE
Electoral 2PP Votes 2PP Percentage District ALP Lib/Nat ALP Lib/Nat Swing
Manly (1) 10284 19787 34.2 65.8 1 .8 to Labor Maroubra 20528 11646 63.8 36.2 3.0 to Labor Marrickville (3) 21220 7464 74.0 26.0 4.1 to Labor Miranda 14239 18623 43.3 56.7 3.6 to Labor Monaro 11346 22267 33.8 66.2 3.6 to Lib/Nat Moorebank 21796 12895 62.8 37.2 8.4 to Labor Mount Druitt 22759 11351 66.7 33.3 3. 7 to Labor Murray 7061 24495 22.4 77.6 3.8 to Labor Murrumbidgee 13384 20222 39.8 60.2 1.6 to Labor Murwillumbah 15394 16713 47.9 52.1 1.0 to Labor Myall Lakes 10531 22781 31.6 68.4 0.2 to Labor Newcastle (2) 20107 10310 66.1 33.9 2.2 to Labor North Shore (2) 9554 21481 30.8 69.2 3.1 to Labor Northcott 10358 22657 31.4 68.6 7 .8 to Labor Northern Tablelands 11610 20373 36.3 63.7 2.2 to Lib/Nat Orange (2) 11439 22623 33.6 66.4 2.0 to Labor Oxley 11674 21484 35.2 64.8 3.3 to Lib/Nat Parramatta 19275 13285 59.2 40.8 6.6 to Labor Peats 20131 14329 58.4 41.6 2.6 to Lib/Nat Penrith 17421 15578 52.8 47.2 1 .8 to Lib/Nat Pittwater 9631 23381 29.2 70.8 2.6 to Labor Port Jackson (1) 21669 8586 71.6 28.4 7.9 to Labor Port Macquarie 13088 21068 38.3 61.7 6.0 to Labor Port Stephens 20739 14440 59.0 41.0 1 . 1 to Lib/Nat Riverstone 21666 14070 60.6 39.4 3.1 to Labor Rockdale 19134 12125 61.2 38.8 4.4 to Labor Smithfield 22266 12692 63.7 36.3 6.7 to Labor South Coast (2) 13959 16815 45.4 54.6 5.7 to Labor Southern Highlands 13711 20886 39.6 60.4 3.9 to Lib/Nat St Marys 21324 9645 68.9 31.1 2.4 to Labor Strathfield 14110 17928 44.0 56.0 3.3 to Labor Sutherland 16336 21165 43.6 56.4 3.4 to Lib/Nat Swansea (2) 20830 13611 60.5 39.5 2. 7 to Lib/Nat Tamworth (1) 5215 29088 15.2 84.8 19.5 to Lib/Nat The Entrance 18441 15642 54.1 45.9 4.3 to Labor The Hills (2) 9038 27564 24.7 75.3 2.3 to Labor Upper Hunter 10521 23421 31.0 69.0 4.3 to Lib/Nat Vaucluse (2) 10862 20540 34.6 65.4 2.1 to Lib/Nat Wagga Wagga 13415 20702 39.3 60.7 5.1 to Labor Wakehurst 11899 20188 37.1 62.9 0.2 to Lib/Nat Wallsend 21454 12881 62.5 37.5 0. 7 to Lib/Nat Waratah 22801 7972 74.1 25.9 3.1 to Labor Willoughby (2) 9654 22522 30.0 70.0 5.5 to Labor Wollongong (2) 20823 8887 70.1 29.9 0.6 to Labor Wyong 20748 14584 58.7 41.3 0.3 to Lib/Nat
Totals 1594783 1671866 48.8 51.2 1.5 to Labor
Footnotes: (1) - Based on estimate of 2-party preferred count for both 1991 and 1995 elections. (2) - Based on estimate of 2-party preferred count for 1 991 election. (3) - Based on estimate of 2-party preferred count for 1995 election.
28
NSW Elections 1995
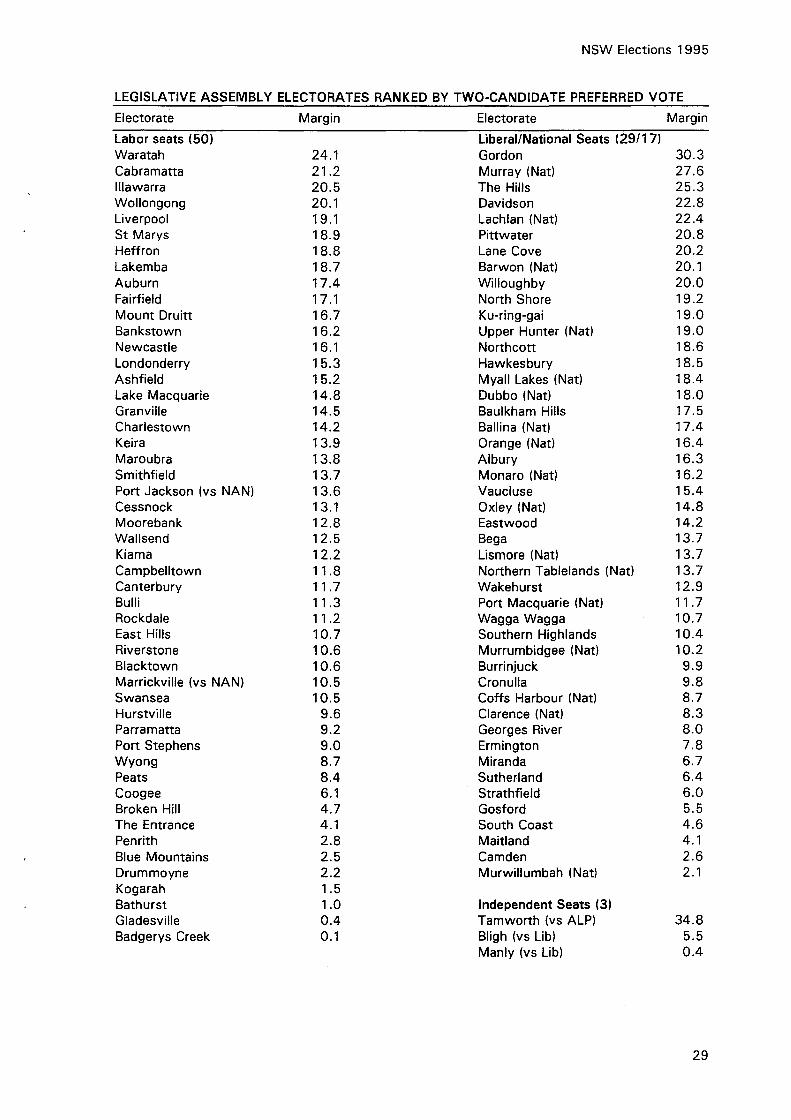
LEGISLATIVE ASSEMBLY ELECTORATES RANKED BY TWO-CANDIDATE PREFERRED VOTE
Electorate Margin Electorate Margin
Labor seats (50) Liberal/National Seats (29/17) Waratah 24.1 Gordon 30.3 Cabramatta 21.2 Murray (Natl 27.6 lllawarra 20.5 The Hills 25.3 Wollongong 20.1 Davidson 22.8 Liverpool 19.1 Lachlan (Natl 22.4 St Marys 18.9 Pittwater 20.8 Heffron 18.8 Lane Cove 20.2 Lakemba 18.7 Barwon (Nat) 20.1 Auburn 17.4 Willoughby 20.0 Fairfield 17 .1 North Shore 19.2 Mount Druitt 16.7 Ku-ring-gai 19.0 Bankstown 16.2 Upper Hunter (Nat) 19.0 Newcastle 16.1 Northcott 18.6 Londonderry 15.3 Hawkes bury 18.5 Ashfield 15.2 Myall Lakes (Nat) 18.4 Lake Macquarie 14.8 Dubbo (Natl 18.0 Granville 14.5 Baulkham Hills 17.5 Charlestown 14.2 Ballina (Nat) 17.4 Keira 13.9 Orange (Nat) 16.4 Maroubra 13.8 Albury 16.3 Smithfield 13.7 Monaro (Natl 16.2 Port Jackson (vs NAN) 13.6 Vaucluse 15.4 Cessnock 13.1 Oxley (Nat) 14.8 Moorebank 12.8 Eastwood 14.2 Wallsend 12.5 Bega 13.7 Kiama 12.2 Lismore (Natl 13.7 Campbelltown 11.8 Northern Tablelands (Natl 13.7 Canterbury 11.7 Wakehurst 12.9 Bulli 11.3 Port Macquarie (Nat) 11. 7 Rockdale 11.2 Wagga Wagga 10.7 East Hills 10.7 Southern Highlands 10.4 Riverstone 10.6 Murrumbidgee (Nat) 10.2 Blacktown 10.6 Burrinjuck 9.9 Marrickville (vs NAN) 10.5 Cronulla 9.8 Swansea 10.5 Coffs Harbour (Natl 8.7 Hurstville 9.6 Clarence (Nat) 8.3 Parramatta 9.2 Georges River 8.0 Port Stephens 9.0 Ermington 7.8 Wyong 8.7 Miranda 6.7 Peats 8.4 Sutherland 6.4 Coogee 6.1 Strathfield 6.0 Broken Hill 4.7 Gosford 5.5 The Entrance 4.1 South Coast 4.6 Penrith 2.8 Maitland 4.1 Blue Mountains 2.5 Camden 2.6 Drummoyne 2.2 Murwillumbah (Nat) 2.1 Kogarah 1.5 Bathurst 1.0 Independent Seats (3) Gladesville 0.4 Tamworth (vs ALP) 34.8 Badgerys Creek 0.1 Bligh (vs Lib) 5.5
Manly (vs Lib) 0.4
29

NSW Elections 1995
LEGISLATIVE ASSEMBLY ELECTORATES RANKED BY TWO-PARTY SWING TO LABOR
Electorate Swing Electorate Swing
Tamworth (1) -19.5 Baulkham Hills +2.3 Lachlan -6.2 Blacktown +2.3 Broken Hill -5.3 Clarence +2.3 Barwon -5.1 The Hills (2) +2.3 Upper Hunter -4.3 St Marys +2.4 Ballina -4.1 Granville +2.5 Bathurst -4.1 Badgerys Creek +2.6 Southern Highlands -3.9 Liverpool +2.6 Monaro -3.6 Pittwater +2.6 Maitland -3.5 Maroubra +3.0 Sutherland -3.4 Heffron +3.1 Oxley -3.3 North Shore (2) +3.1 Swansea (2) -2.7 Riverstone +3.1 Peats -2.6 Waratah +3.1 Northern Tablelands -2.2 Gladesville +3.3 Vaucluse (2) -2.1 Gordon +3.3 Bulli -1 .9 Strathfield +3.3 Kogarah -1.8 Georges River +3.4 Penrith -1.8 Keira +3.4 Coffs Harbour -1.7 Lane Cove +3.5 Drummoyne -1.4 Miranda +3.6 Lismore -1 .4 Ku-ring-gai +3.7 Camden -1 . 1 Mount Druitt +3.7 Dubbo -1 . 1 Murray +3.8 Port Stephens -1 . 1 Marrickville (3) +4.1 Albury -1.0 Bligh (1) +4.3 Burrinjuck -1.0 Hawkesbury +4.3 Bega -0.9 The Entrance +4.3 Auburn -0.7 Rockdale +4.4 Wallsend -0.7 Coogee +4.5 Wyong -0.3 Eastwood +4.5 Wakehurst -0.2 Canterbury +4.9 Davidson -0.1 Hurstville +5.0 Myall Lakes +0.2 Wagga Wagga + 5.1 Wollongong (2) +0.6 Blue Mountains +5.2 lllawarra +0.7 Cabramatta +5.2 Kiama +0.8 Ashfield + 5.4 Murwillumbah + 1.0 Willoughby (2) +5.5 Charlestown + 1.1 Fairfield +5.7 Gosford + 1.3 South Coast (2) +5.7 Londonderry + 1.3 Port Macquarie +6.0 Cronulla + 1.5 Bankstown +6.2 Murrumbidgee + 1.6 Parramatta +6.6 Ermington + 1.8 Smithfield +6.7 Manly (1) + 1.8 Northcott +7.8 Campbelltown + 1.9 Port Jackson ( 1 l +7.9 East Hills + 1.9 Moore bank +8.4 Orange (2) +2.0 Cessnock +8.7 Lake Macquarie +2.1 Lakemba +9.3 Newcastle (2) +2.2 Footnotes: (1) - Based on estimate of 2-party preferred count for both 1991 and 1995 elections. (2) - Based on estimate of 2-party preferred count for 1991 election. (3) - Based on estimate of 2-party preferred count for 1995 election.
'+' indicates a swing to Labor. '-' indicates a swing to the Liberal/National Parties
30

NSW Elections 1995
LEGISLATIVE ASSEMBLY: TWO-PARTY SUMMARY BY ELECTORATE PARTY STATUS
Electoral 2PP Votes 2PP Percentage District (No. of seats) ALP Lib/Nat ALP Lib/Nat Swing
Marginal Labor (9) 167 591 129 146 56.5 43.5 2. 7 to Labor Safe Labor ( 19) 385 048 234 229 62.2 37.8 2. 7 to Labor Very Safe Labor ( 1 8) 392 721 189 258 67.5 32.5 1.8 to Labor
Total Labor (46) 945 360 552 633 63.1 36.9 2.4 to Labor
Marginal Liberal (7) 123 128 128 220 49.0 51.0 0.9 to Labor Safe Liberal (8) 111 106 153 343 42.0 58.0 1.3 to Labor Very Safe Liberal (17) 176 383 384 068 31.5 68.5 2.6 to Labor
Total Liberal (32) 410 617 665 631 38.2 61.8 2.0 to Labor
Marginal National (1 l 15 394 16 713 47.9 52.1 1 .0 to Labor Safe National (5) 65 107 102 166 38.9 61.1 0.6 to Lib/Nat Very Safe National (11) 117 081 251 187 31.8 68.2 1 .2 to Lib/Nat
Total National (17) 197 582 370 066 34.8 65.2 0.9 to Lib/Nat
NOTES Seats with a margin less than 6% classified as Marginal. Seats with margins between 6% and 12% classified as Safe. Seats with margins greater than 12% classified as Very Safe. All seats classified by their margin based on 1991 election result, though 2PP results shown above are the results of the 1995 election. By-elections results have not been used. The four electorates held by independents have been excluded from the above analysis.
31
966 L SUO!l:1813 MSN

NSW Elections 1995
REGIONAL SUMMARIES
The following tables summarise the election result for different regions of the state. All electorates have been classified into three broad regions, Sydney, Hunter/lllawarra and Country. These three regions are further subdivided as follows.
Country
North Coast
Southern Country
Western Country
Hunter lllawarra
Hunter Seats
lllawarra Seats
Sydney
Central Coast
Inner City
North Shore
Southern Suburbs
Western Suburbs
Ballina, Clarence, Coffs Harbour, Lismore, Murwillumbah, Myall Lakes, Oxley, Port Macquarie (8)
Albury, Bega, Burrinjuck, Monaro, South Coast, Southern Highlands, Wagga Wagga (7)
Barwon, Bathurst, Broken Hill, Dubbo, Lachlan, Murrumbidgee, Murray, Northern Tablelands, Orange, Tamworth, Upper Hunter ( 11 )
Cessnock, Charlestown, Lake Macquarie, Maitland, Newcastle, Port Stephens, Swansea, Wallsend, Waratah (9)
Bulli, lllawarra, Keira, Kiama, Wollongong (5)
Gosford, Peats, The Entrance, Wyong (4)
Ashfield, Bligh, Coogee, Drummoyne, Heffron, Maroubra, Marrickville, Port Jackson, Strathfield, Vaucluse (10)
Baulkham Hills, Davidson, Eastwood, Ermington, Gladesville, Gordon, Hawkesbury, Ku-ring-gai, Lane Cove, Manly, Northcott, North Shore, Pittwater, The Hills, Wakehurst, Willoughby (16)
Canterbury, Cronulla, Georges River, Hurstville, Kogarah, Lakemba, Miranda, Rockdale, Sutherland (9)
Auburn, Badgerys Creek, Bankstown, Blacktown, Blue Mountains, Cabramatta, Camden, Campbelltown, East Hills, Fairfield, Granville, Liverpool, Londonderry, Mount Druitt, Moorebank, Parramatta, Penrith, Riverstone, Smithfield, St Marys (20)
33

NSW Elections 1995
COUNTRY Enrolled 1 004 711 WESTERN COUNTRY Enrolled 416 982
Seats Won Votes % Swing Seats Won Votes % Swing -
Labor 2 271 473 30.1 +0.2 Labor 2 114 537 30.9 + 1.5 Liberal 6 116 255 12.9 -0.9 Liberal 0 0.0 -4.4 National 17 378 878 42.0 + 3.1 National 8 201 924 54.4 +7.8 Democrat 11 124 1.2 -3.4 Democrat 2 307 0.6 -3.2 Green 26 944 3.0 +2.8 Green 2 151 0.6 +0.6 Others 1 96 408 10.7 -1.8 Others 1 50 143 13.5 -2.3
Labor 2PP 316 311 36.4 -1.6 Labor 2PP 123 312 33.9 -3.8 Lib/Nat 2PP 553 830 63.6 + 1.6 Lib/Nat 2PP 240 758 66.1 +3.8
Formal 901 082 95.6 +2.6 Formal 371 062 94.9 + 1.4 Informal 41 962 4.4 -2.6 Informal 19 915 5.1 -1 .4 Total Votes 943 044 93.9 Total Votes 390 977 93.8
NORTH COAST Enrolled 313 886 HUNTER/ILLA WAR RA Enrolled 536 193
Seats Won Votes % Swing Seats Won Votes % Swing -
Labor 80 095 28.2 -0.7 Labor 13 266 661 55.6 + 3.1 National 8 156 313 55.0 + 1.1 Liberal 1 151 584 31.6 +3.8 Democrat 3 961 1.4 -4.7 National 0 0.0 -0.8 Green 14 685 5.2 +4.6 Democrat 14 671 3.1 -2.8 Others 29 090 10.2 -0.3 Green 24 486 5.1 +4.2
Labor 2PP 102 641 38.1 -0.2 Others 22 508 4.7 -7.3
Lib/Nat 2PP 167 069 61.9 +0.2 Labor 2PP 291 401 63.1 +0.6
Formal 284 144 96.3 + 1.7 Lib/Nat 2PP 170 321 36.9 -0.6
Informal 10 772 3.7 -1. 7 Formal 479 910 94.6 +3.0 Total Votes 294 916 94.0 Informal 27 634 5.4 -3.0
Total Votes 507 544 94.7
SOUTHERN COUNTRY Enrolled 273 843 HUNTER SEATS Enrolled 342 625
Seats Won Votes % Swing Seats Won Votes % Swing -
Labor 76 841 31.3 -1.0 Labor 8 170 290 55.2 +3.6 Liberal 6 116 255 47.3 + 1.1 Liberal 1 101 618 33.0 +4.4 National 1 20 641 8.4 +0.2 National 0 0.0 -1 .3 Democrat 4 856 2.0 -2.2 Democrat 8 952 2.9 -2.2 Green 10 108 4.1 +4.1 Green 12 367 4.0 +4.0 Others 17 175 7.0 -2.2 Others 15 134 4.9 -8.4
Labor 2PP 90 358 38.2 Labor 2PP 184 276 61.9 +0.7 Lib/Nat 2PP 146 003 61.8 Lib/Nat 2PP 113 583 38.1 -0.7
Formal 245 876 95.6 + 5.5 Formal 308 361 94.8 +3.3 Informal 11 275 4.4 -5.5 Informal 16 820 5.2 -3.3 Total Votes 257151 93.9 Total Votes 325 181 94.9
34

NSW Elections 1995
ILLAWARRA SEATS Enrolled 193 568 INNER CITY Enrolled 382 731
Seats Won Votes % Swing Seats Won Votes % Swing
Labor 5 96 371 56.2 +2.2 Labor 7 143 807 43.4 +0.3 Liberal 49 966 29.1 +2.8 Liberal 2 115 870 34.9 -2.9 Democrat 5 719 3.3 -3.9 Democrat 9 009 2.7 -1.9 Green 12 119 7.1 +4.5 Green 20 050 6.0 +2.4 Others 7 374 4.3 -5.5 Others 1 42 933 12.9 +2.0
Labor 2PP 107 125 65.4 +0.6 Labor 2PP 175 514 56.8 +2.9 Lib/Nat 2PP 56 738 34.6 -0.6 Lib/Nat 2PP 133 274 43.2 -2.9
Formal 171 549 94.1 +2.6 Formal 331 669 95.0 +5.6 Informal 10 814 5.9 -2.6 Informal 17 363 5.0 -5.6 Total Votes 182 363 94.2 Total Votes 349 032 91.2
SYDNEY Enrolled 2 296 198 NORTH SHORE Enrolled 613 496
Seats Won Votes % Swing Seats Won Votes % Swing
Labor 35 870 482 42.8 +2.9 Labor 1 127 977 23.2 +2.9 Liberal 22 853 351 42.0 -3.0 Liberal 14 316 990 57.5 -3.2 Democrat 71 371 3.5 -2.0 Democrat 33 369 6.1 -2.5 Green 36 432 1.8 + 1.2 Green 14 459 2.6 +2.6 Others 2 201 134 9.9 +0.8 Others 1 58 283 10.6 +0.2
Labor 2PP 987 071 51.0 +3.2 Labor 2PP 167 693 32.3 +3.0 Lib/Nat 2PP 947 715 49.0 -3.2 Lib/Nat 2PP 351 933 67.7 -3.0
Formal 2 032 770 94.6 +5.1 Formal 551 078 96.1 +3.5 Informal 115 783 5.4 -5.1 Informal 22 388 3.9 -3.5 Total Votes 2 148 553 93.6 Total Votes 573 466 93.5
CENTRAL COAST Enrolled 159 596 SOUTHERN SUBURBS Enrolled 342 581
Seats Won Votes % Swing Seats Won Votes % Swing
Labor 3 71 310 49.6 +3.8 Labor 5 138 106 45.3 + 1.9 Liberal 1 61 737 43.0 + 1.8 Liberal 4 129 277 42.4 -4.1 Democrat 2 739 1.9 -2.9 Democrat 8 135 2.7 -3.3 Others 7 881 5.5 -2.7 Others 29 401 9.6 + 5.4
Labor 2PP 75 473 53.9 +0.5 Labor 2PP 152 274 52.1 +3.0 Lib/Nat 2PP 64 672 46.1 -0.5 Lib/Nat 2PP 139750 47.9 -3.0
Formal 143 667 95.3 +2.8 Formal 304 919 94.2 +4.8 Informal 7 073 4.7 -2.8 Informal 18 850 5.8 -4.8 Total Votes 150 740 94.5 Total Votes 323 769 94.5
35

NSW Elections 1995
WESTERN SUBURBS Enrolled 797 794
Seats Won Votes % Swing
Labor 19 389 282 55.5 +3.5 Liberal 1 229 477 32.7 -2.5 Democrat 18 119 2.6 -0.7 Green 1 923 0.3 +0.3 Others 62 636 8.9 -0.6
Labor 2PP 416 117 61.7 +3.2 Lib/Nat 2PP 258 086 38.3 -3.2
Formal 701 437 93.3 +6.8 Informal 50 109 6.7 -6.8 Total Votes 751 546 94.2
36

NSW Elections 1995
BY-ELECTIONS 1991-1995
The Entrance Roll 37478 Gordon Roll 37667 (18 January 19921 (22 August 19921
Candidate Party Votes % Swing Candidate Party Votes % Swing
First Count First Count James CEC 326 1.0 + 1.0 Bignold MST 1844 6.4 +6.4 Irving IND 584 1. 7 -3.1 Hay CEC 1903 6.6 +6.6 Clifford IND 625 1.9 + 1.9 Kinross LIB 19832 69.0 -5.5 McBride ALP 16642 49.6 +6.4 Barnett 4481 15.6 + 15.6 Sawyer DEM 693 2.1 -3.8 Coleman CTA 673 2.3 -1.5 Hudson GRY 391 1 .2 + 1.2 DEM 0.0 -10.4 Scott-Irving IND 92 0.3 +0.3 ALP 0.0 -11 .2 Graham * LIB 14222 42.4 -3.8
Final Count Final Count Kinross LIB 20999 77.8 -5.7 McBride ALP 17950 54.7 +4.9 Barnett IND 5975 22.2 +22.2 Graham * LIB 14857 45.3 -4.9 ALP 0.0 -16.5 Exhausted 768 Exhausted 1759
Formal 33575 98.4 +6.7 Formal 28733 95.1 +1.0 Informal 535 1.6 -6.7 Informal 1465 4.9 -1.0 Total Vote 34110 91.0 Total Vote 30198 80.2
Davidson Roll 38058 Ku-ring-gai Roll 38956 (2 May 1992) (22 August 1992)
Candidate Party Votes % Swing Candidate Party Votes % Swing
First Count First Count Vescio EFF 683 2.1 +2.1 Taylor CTA 914 3.0 +0.7 Evanian IND 852 2.7 +2.7 Roach IND 5442 17.6 +8.6 Cunningham DEM 1156 3.6 -12.0 O'Doherty Lib 14755 47.8 -14.6 Roach IND 361 1 .1 + 1.1 Gallagher IND 9725 31.5 +23.5 Begaud IND 918 2.9 +2.9 ALP 0.0 -18.3 Knowles GRN 1195 3.7 +3.7
Final Count Leney IND 190 0.6 +0.6 O'Doherty LIB 16167 55.1 -17.6
Klinger IND 157 0.5 +0.5 Sutton IND 9489 29.5 +29.5 Gallagher IND 13182 44.9 +44.9
Coleman CTA 770 2.4 +2.4 ALP 0.0 -27.3
Humpherson LIB 15852 49.3 -16.1 Exhausted 1487
Williams IND 105 0.3 +0.3 Formal 30836 95.7 +2.0 Torzsok IND 24 0.0 +0.0 Informal 1371 4.3 -2.0 Droulers IND 34 0.1 +0.1 Total Vote 32207 82.7 Fairlie-Cuninghame IND 357 1 . 1 + 1.1
ALP 0.0 -19.0
Final Count Sutton IND 11737 40.3 +40.3 Humpherson LIB 17352 59.7 -13.0
ALP 0.0 -27.3 Exhausted 3054
Formal 32143 97.0 + 5.1 Informal 1006 3.0 -5.1 Total Vote 33149 87.1
37

NSW Elections 1995
The Hills Roll 40368 Vaucluse Roll 39224 (28 August 1993) (9 April 1994)
Candidate Party Votes % Swing Candidate Party Votes % Swing
First Count First Count Pettitt IND 414 1.3 + 1.3 Matson GRN 2453 9.1 +4.2 Gallagher IND 1231 3.9 +3.9 Debnam LIB 15757 58.5 +3.4 Baggs IND 1685 5.3 +5.3 Armitage ALP 7856 29.2 + 11.8 Rothery IND 677 2.1 +2.1 Marks IND 870 3.2 +3.2 Solomons IND 313 1.0 + 1.0 ... {Watson) IND 0.0 -14.5 Potter IND 6466 20.3 -0.6 DEM 0.0 -3.4 Feiner IND 189 0.6 +0.6 0TH 0.0 -4.7 Ivor F IND 80 0.3 +0.3
Final Count Coleman CTA 1375 4.3 +4.3 Richardson LIB 19418 60.8 -1. 7 Debnam LIB 16621 63.3 +0.3
Hooper IND 75 0.2 +0.2 Armitage ALP 9645 36.7 +36.7
ALP 0.0 -12.4 ... {Watson) IND 0.0 -37.0
DEM 0.0 -4.2 Exhausted 670
Final Count Formal 26936 97.1 +6.3
Potter IND 9083 31.0 -1.6 Informal 808 2.9 -6.3
Richardson LIB 20184 69.0 + 1.6 Total Vote 27744 70.7
Exhausted 2656
Formal 31923 97.3 +3.5 Informal 886 2.7 -3.5
Parramatta Roll 39556 Total Vote 32809 81.3
(27 August 1994)
Candidate Party Votes % Swing
North Shore Roll 37354 First Count (5 February 1994) Issa IND 811 2.7 +2.7
Jones LIB 9523 31.6 -11.0 Candidate Party Votes % Swing Verheyen GRY 665 2.2 +2.2
Malkoun IND 593 2.0 +2.0 First Count Fitzgerald GRN 798 2.7 +2.7 Reid IND 787 2.8 +2.8 Cogger IND 125 0.4 +0.4 Nolan IND 878 3.1 + 3.1 Harrison ALP 16527 54.9 + 10.6 Skinner LIB 15267 54.7 +3.6 Coleman CTA 724 2.4 +2.4 Cater DEM 590 2.1 +2.1 de Govrik DSE 324 1 . 1 + 1.1 Read IND 10408 37.3 -3.8 DEM 0.0 -4.6
ALP 0.0 -7.9 0TH 0.0 -8.5
Final Count Final Count Skinner LIB 15905 58.4 +5.9 Jones LIB 11025 38.0 -9.5 Read IND 11338 41.6 -5.9 Harrison ALP 18013 62.0 +9.5 Exhausted 687 Exhausted 1052
Formal 27930 98.3 +3.9 Formal 30090 96.3 + 6.1 Informal 473 1. 7 -3.9 Informal 1169 3.7 -6.1 Total Vote 28403 76.0 Total Vote 31259 79.0
38

NSW Elections 1995
Cabramatta Roll 42632 (22 October 1994)
Candidate Party Votes % Swing
First Count Moore IND 1361 4.4 +4.4 Meagher ALP 22701 72.6 +21.0 de Govrik DSE 865 2.8 +2.8 Nguyen IND 3646 11. 7 + 11. 7 Stevens IND 680 2.2 +2.2 Grigg CTA 1498 4.8 +4.8 Oldfield 497 1.6 + 1.6
LIB 0.0 -21.8 ... {Ngo) IND 0.0 -11 .9
DEM 0.0 -1.7 0TH 0.0 -12.9
Final Count Meagher ALP 24367 83.9 + 17.9 Nguyen IND 4663 16.1 + 16.1
LIB 0.0 -34.0 Exhausted 2218
Formal 31248 90.5 +8.3 Informal 3275 9.5 -8.3 Total Vote 34523 81.0
39

017
966 L SUO!l:l913 MSN

NSW Elections 1995
Legislative Council Results
Primary Vote by Party Group
Group Party Candidates Votes % Vote Quotas Elected
A Australian Independents. Coalition 3 57 573 1.70 0.37 B Smokers Rights Party 2 32 470 0.96 0.21 C Daylight Saving Extension Party 4 43 164 1.28 0.28 D Environment Independents 2 18 263 0.54 0.12 E No Aircraft Noise 3 45 105 1.33 0.29 F Country Party 2 20 162 0.60 0.13 G Citizens Opinion Law Order 2 19 081 0.56 0.12 H A Better Future for Children 2 43 225 1.28 0.28 1 I Independent EFF 2 12 012 0.36 0.08 J Indigenous Peoples Party 2 8 457 0.25 0.06 K Citizens Electoral Council 2 2 687 0.08 0.02 L The Seniors 3 27 914 0.83 0.18 M Liberal/National Party 13 1 300 743 38.49 8.47 8 N Riders' and Motorists' Party 2 16 532 0.49 0.11 0 Democratic Socialists 2 8 303 0.25 0.05 p Public Hospital Alliance 2 12 767 0.38 0.08 Q Call to Australia 7 101 556 3.01 0.66 1 R Aust. Against Further Immigration 2 55 864 1.65 0.36 s The Greens 3 126 591 3.75 0.82 1 T Confederate Action Party 2 2 222 0.07 0.01 u Grey Power 3 9 157 0.27 0.06 V Australian Democrats 4 108 312 3.21 0.71 1 w Abolish State Government 2 7 846 0.23 0.05 X Shooters Party 7 95 943 2.84 0.62 1 y Australian Labor Party 15 1 191 177 35.25 7.76 8 z Natural Law Party 2 5 784 0.17 0.04 AB Stop Dual Occupancy 2 4 005 0.12 0.03
Ungrouped 2 2 264 0.07 0.01
Formal Votes 3 379 179 93.89 +0.31 Informal 219 960 6.11 -0.31 Total Votes I Turnout 3 599 139 93.80
41

NSW Elections 1995
Distribution of Vote within Party Groups
% of Party Vote cast for Party Ticket Votes No 1 Candidate Other Candidates
Australian Independents Coalition 77.02 18.88 4.10 Smokers Rights Party 79.46 18.75 1.79 Daylight Saving Extension Party 82.98 13.76 3.26 Environment Independents 82.54 15.74 1.72 No Aircraft Noise 73.12 24.11 2.76 Country Party 89.89 8.62 1.50 Citizens Opinion Law Order 84.57 13.34 2.09 A Better Future for Children 89.35 7.96 2.69 Independent EFF 88.05 10.96 1.00 Indigenous Peoples Party 72.53 25.21 2.26 Citizens Electoral Council 85.86 12.24 1.90 The Seniors 85.17 13.72 1 . 11 Liberal/National Party 95.75 3.65 0.60 Riders' and Motorists' Party 84.18 12.91 2.90 Democratic Socialists 86.58 11. 10 2.31 Public Hospital Alliance 88.90 9.58 1.52 Call to Australia 77.49 21.99 0.52 Aust. Against Further Immigration 83.61 15.12 1.27 The Greens 79.20 18.91 1.89 Confederate Action Party 85.15 13.95 0.90 Grey Power 84.90 13.02 2.09 Australian Democrats 78.83 19.43 1.74 Abolish State Government 75.03 23.69 1.27 Shooters Party 88.68 10.20 1. 12 Australian Labor Party 92.78 5.96 1.26 Natural Law Party 88.97 9.96 1.07 Stop Dual Occupancy 78.05 19.43 1.40 Ungrouped
Total Use 90.93 7.86 1.21
42
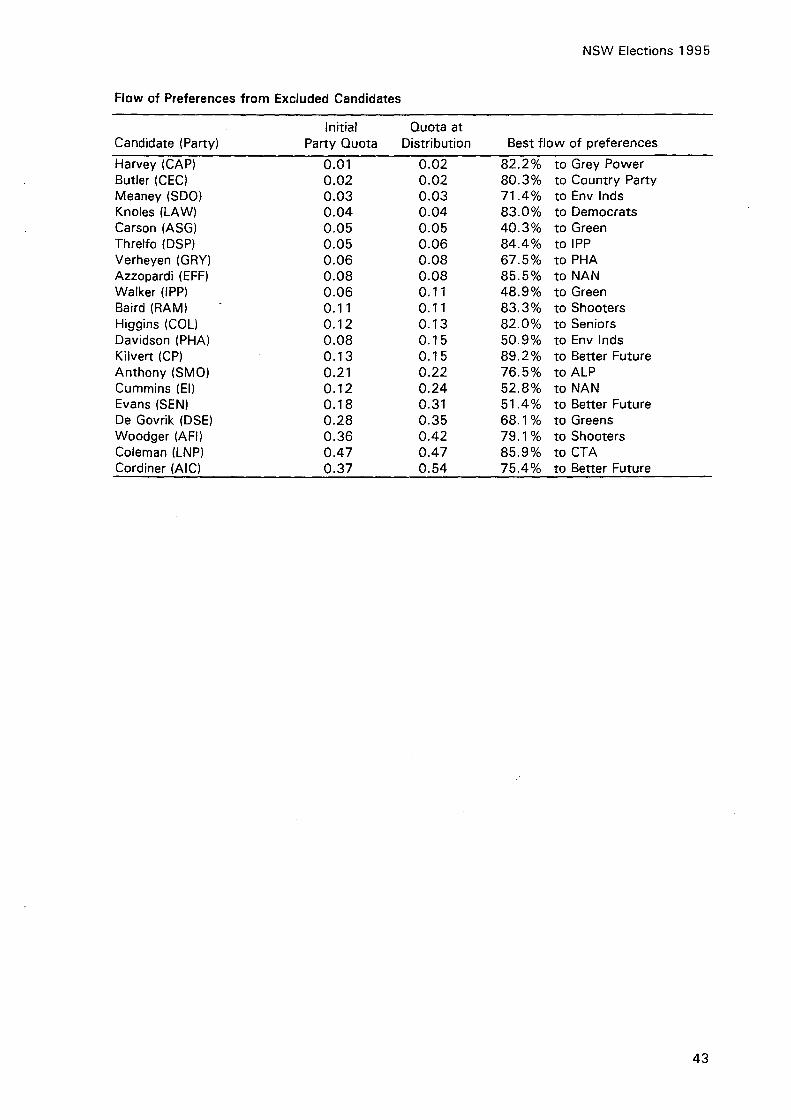
NSW Elections 1995
Flow of Preferences from Excluded Candidates
Initial Quota at Candidate (Party) Party Quota Distribution Best flow of preferences
Harvey (CAP) 0.01 0.02 82.2% to Grey Power Butler (CEC) 0.02 0.02 80.3% to Country Party Meaney (SDO) 0.03 0.03 71.4% to Env Inds Knoles (LAW) 0.04 0.04 83.0% to Democrats Carson (ASG) 0.05 0.05 40.3% to Green Threlfo (DSP) 0.05 0.06 84.4% to IPP Verheyen (GRY) 0.06 0.08 67.5% to PHA Azzopardi (EFF) 0.08 0.08 85.5% to NAN Walker (IPP) 0.06 0.11 48.9% to Green Baird (RAM) 0.11 0.11 83.3% to Shooters Higgins (COL) 0.12 0.13 82.0% to Seniors Davidson (PHA) 0.08 0.15 50.9% to Env Inds Kilvert (CP) 0.13 0.15 89.2% to Better Future Anthony (SMO) 0.21 0.22 76.5% to ALP Cummins (El) 0.12 0.24 52.8% to NAN Evans (SEN) 0.18 0.31 51.4% to Better Future De Govrik (DSE) 0.28 0.35 68.1 % to Greens Woodger (AFI) 0.36 0.42 79.1 % to Shooters Coleman (LNP) 0.47 0.47 85.9% to CTA Cordiner (AIC) 0.37 0.54 75.4% to Better Future
43

NSW Elections 1995
Detailed Distribution of Preferences at 1995 Election Based on Analysis of Ticket Voting. -
Votes Ticket Next % of Candidate Excluded Distributed Votes Original Party Preference Distribution
Count 70 Harvey (CAP) 2,343 1,892 CAP GRY 80.8%
451 (Non-ticket) 19.2%
Count 75 Butler (CEC) 2,888 2,307 CEC CP 79.9%
581 (Non-ticket) 20.1 %
Count 76 Meaney (SDO) 4,410 3,126 SDO El 70.9%
1,284 (Non-ticket) 29.1 %
Count 77 Knoles (LAW) 6,347 5,146 LAW DEM 81.1 %
1,201 (Non-ticket) 18.9%
Count 78 Carson (ASG) 8,422 2,943 ASG (Ticket 1 l GRN 34.9%
2,944 ASG (Ticket 2) DEM 35.0% 2,535 (Non-ticket) 30.1 %
Count 79 Threlfo (DSP) 8,619 7,189 DSP IPP 83.4%
1,430 (Non-ticket) 16.6%
Count 80 Verheyen (GRY) 11,641 7,774 GRY PHA 66.8%
1,892 CAP AFI 16.2% 1,975 (Non-ticket) 17.0%
Count 81 Azzopardi (EFF) 12,493 10,576 EFF NAN 84.7%
1,917 (Non-ticket) 15.3%
Count 82 Walker (IPP) 16,654 6,134 IPP DEM 36.8%
7,189 DSP GRN 43.2% 3,331 (Non-ticket) 20.0%
Count 83 Baird (RAM) 17,248 13,917 RAM SHO 80.7%
3,331 (Non-ticket) 19.3%
Count 84 Higgins (COL) 20,043 16,137 COL SEN 80.5%
3,906 (Non-ticket) 19.5%
Count 85 Davidson (PHA) 22,618 11,350 PHA El 50.2%
7,774 GRY DSE 34.4% 3,494 (Non-ticket) 15.4%
Count 86 Kilvert (CP) 23,479 18,123 CP BFC 77.2%
2,307 CEC BFC 9.8% 3,049 ( Non-ticket) 13.0%
Count 87 Anthony (SMO) 34,224 25,801 SMO ALP 75.4%
8,423 (Non-ticket) 24.6%
44

NSW Elections 1995
Votes Ticket Next % of Candidate Excluded Distributed Votes Original Party Preference Distribution
Count 88 Cummins (El) 36,105 15,074 El NAN 41.8%
11,350 PHA BFC 31.4% 3,126 SDO NAN 8.7% 6,555 (Non-ticket) 18.2%
Count 89 Evans (SEN) 47,634 23,773 SEN BFC 49.9%
16,137 COL AIC 33.9% 7,724 (Non-ticket) 16.2%
Count 90 De Govrik (DSE) 54,307 35,819 DSE GRN 66.0%
7,774 GRY AIC 19.7% 10,714 (Non-ticket) 14.3%
Count 91 Cohen (GRN) Surplus 36,982 35,819 DSE NAN 96.9%
1,163 (Non-ticket) 3.1%
Count 92 Woodger (AFI) 64,229 46,707 AFI SHO 72.7%
1,892 CAP SHO 3.0% 15,630 (Non-ticket) 24.3%
Count 93 Coleman (LNP) 71,574 60,640 LNP CTA 84.7%
10,934 (Non-ticket) 15.3%
Count 94 Cordiner (AIC) 82,935 44,342 AIC BFC 53.5%
16,137 COL BFC 19.5% 7,774 GRY Exhausted 9.4%
14,682 (Non-ticket) 17.7%
Count 95 Tingle (SHO) Surplus 50,783 46,707 AFI Exhausted 92.0%
1,892 CAP Exhausted 3.8% 2,184 (Non-ticket) 4.3%
Count 96 Nile (CTA) Surplus 61,497 60,640 LNP DEM 98.6%
857 (Non-ticket) 1.4%
Count 97 Corbett (BFC) Surplus 62,501 44,342 AIC DEM 70.9%
16,137 COL Exhausted 25.8% 2,022 (Non-ticket) 3.2%
45

NSW Elections 1995
First Count
Group Candidate Votes % Vote Quotas A Australian Independents Coalition
Ticket Votes 44342 1.31 Cordiner, Graeme 10870 0.32 Jessop, Fiona 1698 0.05 Burton, Rodney 663 0.02 Group Total 57573 1.70 0.37
B Smokers Rights Ticket Votes 25801 0.76 Anthony, Mark 6089 0.18 Mayfield, -Robert 580 0.02 Group Total 32470 0.96 0.21
C Daylight Saving Extension Ticket Votes 35819 1.06 de Govrik, T any 5939 0.18 Siskos, Dianne 516 0.02 de Govrik, Kim 269 0.01 McElveney, Vicki 621 0.02 Group Total 43164 1.28 0.28
D Environment Independents Ticket Vote 15074 0.45 Cummins, Robert 2875 0.09 Vlatko, Tony 314 0.01 Group Total 18263 0.54 0.12
E No Aircraft Noise Ticket Vote 32981 0.98 Hand, Larry 10877 0.32 Lennane, Jean 892 0.03 Archibald, Clare 355 0.01 Group Total 45105 1.33 0.29
F The Country Party Ticket Votes 18123 0.54 Kilvert, David 1737 0.05 Douglas, Tony 302 0.01 Group Total 20162 0.60 0.13
G Citizens Opinion Law Order Capital Punishment Ticket Votes 16137 0.48 Higgins, Kevin 2545 0.08 Clog her, Sandra 399 0.01 Group Total 19081 0.56 0.12
H A Better Future For Our Children Ticket Votes 38621 1 .14 Corbett, Alan (Elected) 3441 0.10 Mackenzie, Erica 1163 0.03 Group Total 43225 1.28 0.28
46

NSW Elections 1995
Independent EFF Ticket Votes 10576 0.31 Azzopardi, Eddie 1316 0.04 Noble, Alan 120 0.00 Group Total 12012 0.36 0.08
J Indigenous Peoples Party Ticket Votes 6134 0.18 Walker, Una 2132 0.06 Coffey, Essy 191 0.01 Group Total 8457 0.25 0.06
K Citizens Electoral Councils Group Ticket Votes 2307 0.07 Butler, Robert 329 0.01 Harris, Garth 51 0.00 Group Total 2687 0.08 0.02
L The Seniors Ticket Votes 23773 0.70 Evans, Beryl 3831 0.11 Welsh, Lorraine 151 0.00 Page, Warren 159 0.00 Group Total 27914 0.83 0.18
M Liberal/National Party Ticket Votes 1245467 36.86 Hannaford, John (Lib) (Elected) 47535 1.41 Gay, Duncan (Nat) (Elected) 1403 0.04 Sham-Ho, Helen (Lib) (Elected) 1098 0.03 Mutch, Stephen (Lib) (Elected) 419 0.01 Bull, Richard (Nat) (Elected) 463 0.01 Samios, James (Lib) (Elected) 406 0.01 Pezzutti, Brian (Lib) (Elected) 587 0.02 Jobling, John (Lib) (Elected) 330 0.01 Coleman, Loyd (Nat) 409 0.01 Kerr, Robyn (Lib) 1167 0.03 Robert, Len 348 0.01 Humphrey, Arch 197 0.01 Lewis, Rick (Lib) 914 0.03 Group Total 1300743 38.49 8.47
N Riders' and Motorists' Party Ticket Votes 13917 0.41 Baird, Piet 2135 0.06 Hirst, Greg 480 0.01 Group Total 16532 0.49 0.11
0 Democratic Socialists Ticket Votes 7189 0.21 Threlfo, Bruce 922 0.03 Jarvis, Helen 192 0.01 Group Total 8303 0.25 0.05
47

NSW Elections 1995
p Public Hospital Alliance Ticket Votes 11350 0.34 Davidson, Maureen 1223 0.04 Hughes, Bill 194 0.01 Group Total 12767 0.38 0.08
Q Call to Australia Ticket Votes 78694 2.33 Nile, Elaine (Elected) 22331 0.66 Coleman, Bruce 223 0.01 Hume, Kevin 92 0.00 Everingham, John 68 0.00 Grigg, Shirley 44 0.00 Helmy, Gamil 27 0.00 Lawrence, Barry 77 0.00 Group Total 101556 3.01 0.66
R Australians Against Further Immigration Ticket Votes 46707 1.38 Woodger, Edwin 8447 0.25 O'Callaghan, Vivienne 710 0.02 Group Total 55864 1.65 0.36
s The Greens Ticket Votes 100258 2.97 Cohen, Ian (Elected) 23940 0.71 Faith, Josephine 1786 0.05 Dobbie, Leeza 607 0.02 Group Total 126591 3.75 0.82
T Confederate Action Party Ticket Votes 1892 0.06 Harvey, Nick 310 0.01 Gillman, Les 20 0.00 Group Total 2222 0.07 0.01
u Grey Power Ticket Votes 7774 0.23 Verheyen, John 1192 0.04 Ross, Richard 56 0.00 Pickering, Olga 135 0.00 Group Total 9157 0.27 0.06
V Australian Democrats Ticket Votes 85382 2.53 Jones, Richard (Elected) 21049 0.62 Chesterfield-Evans, Arthur 725 0.02 Richardson, Terri 736 0.02 Disney, Simon 420 0.01 Group Total 108312 3.21 0.71
w Abolish State Government Ticket Votes 5887 0.17 Carson, Lyn 1859 0.06 White, Stuart 100 0.00 Group Total 7846 0.23 0.05
48

NSW Elections 1995
X Shooters Party Ticket Votes 85078 2.52 Tingle, John (Elected) 9788 0.29 Pirie, James 230 0.01 Orr, Ted 330 0.01 O'Connell, Suzanne 215 0.01 Galea, Raymond 110 0.00 Mitchell, Chris 84 0.00 Redfern, Daniel 108 0.00 Group Total 95943 2.84 0.62
y Australian Labor Party Ticket Votes 1152410 34.10 Egan, Michael (Elected) 23789 0.70 Symonds, Ann (Elected) 3278 0.10 Dyer, Ron (Elected) 1008 0.03 O'Grady, Paul (Elected) 2010 0.06 Johnson, Johno (Elected) 1387 0.04 Manson, Andy (Elected) 626 0.02 Staunton, Patricia (Elected) 1583 0.05 Saffin, Janelle (Elected) 667 0.02 Daly, Lawrie 885 0.03 Kelly, Tony 741 0.02 Mossfield, Frank 240 0.01 Kwok, Hatton 457 0.01 Samaras, Michael 825 0.02 Hare, Terry 250 0.01 Hatzistergos, John 1021 0.03 Group Total 1191177 35.25 7.76
z Natural Law Party Ticket Votes 5146 0.15 Knoles, Catherine 576 0.02 Eager, Elizabeth 62 0.00 Group Total 5784 0.17 0.04
AB Stop Dual Occupancy Party Ticket Votes 3126 0.09 Meaney, Anthony 823 0.02 Dowdell, Judyth 56 0.00 Group Total 4005 0.12 0.03
Ungrouped Manna, Joan 440 0.01 Arkell, Frank 1824 0.05 Group Total 2264 0.07 0.01
Formal Votes 3379179 93.89 Informal 219960 6.11 Total Votes 3599139
Quota 153600
49

09
966 L SUO!l:l813 MSN

Referendum Results
Question 1 : Independence of the Judiciary
Yes
No
Informal
2225166
1151255
222 720
Question 2: Fixed Term Parliaments
Yes
No
Informal
2 449 796
795 706
353 639
65.9%
34.1 %
6.2%
75.5%
24.5%
9.8%
NSW Elections 1995
51

List of NSW Parliamentary
To identify and fulfil the information needs of Members
of Parliament and the Parliamentary Institution. [Library Mission Statement]

( A ) BACKGROUND PAPER ( B ) Bll,LS DIGEST ( C) BRIEFING PAPER ( D) STATISTICS
( A ) BACKGROUND PAPER
TITLE
Comparisons of 1991 Census Characteristics: State Electoral Districts by Jan Newby Electing the New South Wales Legislative Council 1978 to 1995: Past ResulJs and Future Prospects by Antony Green Euthanasia by Gareth Griffith and Marie Swain NSW Elections 1995 by Antony Green
( B ) Bll,LS DIGEST
TITLE
National Environment Protection Council (New South Wales) Bill 1995 by Stewart Smith State Owned Corporations Amendment Bill 1995 by Vicki Mullen
( C ) BRIEFING PAPER
TITLE
Mari.time Services in NSW: Issues for Reform by Vicki Mullen Water Resources and Water Strategies by John Wilkinson Fixed Term Parliaments, with a commentary on the Constitution (Fixed Term Parliaments) Amendment Bill 1992 by Gareth Griffith Water Quality in NSW - An Overview by Stewart Smith Enterprise Bargaining in New South Wales: An Overview by Vicki Mullen International Treaties by Marie Swain Victim Impact Statements by Gareth Griffith Recycling in NSW by Stewart Smith The Independence of the Judiciary: commentary on the proposal to amend the NSW Constitution by Vicki Mullen and Gareth Griffith Coal Production in New South Wales by John Wilkinson The Greenhouse Effect: Ramifications for New South Wales by Stewart Smith Urban Consolidation and Dual Occupancy Development by Marie Swain
NUMBER
1995/1
1995/2 1995/3 1995/4
NUMBER
001/95 002/95
NUMBER
001/95 002/95
003/95 004/95 005/95 006/95 007/95 008/95
009/95 010/95 011/95 012/95

Selecting a Presiding Officer: methods of election and the concept of independence by Gareth Griffith The Individual's Right to Privacy: Protection of Personal lnfonnation in New South Wales by Vicki Mullen Regional Development in New South Wales by John Wilkinson Update on the Hilmer Report by Jan Newby Sydney, Transport and Ecologically Sustainable Development by Stewart Smith Domestic Violence: An Overview of the Legislative Changes in NSW by Gareth Griffith Women in Parliament by Marie Swain Commentary on the Electricity Legislation Amendment Bill 1995 by Vicki Mullen and Stewart Smith Sydney City Council: Moving Boundaries and a Changing Franchise by Gareth Griffith Forensic Samples by Marie Swain Government Debt and New South Wales: Past Development and Present Realities by John Wilkinson Air Pollution in Sydney by Stewart Smith Industrial Regulation in NSW: The Difficult Dichotomy of Judicial and Arbitral Power by Vicki Mullen Coastal Protection by Stewart Smith
( D ) STATISTICS
TITLE
Quarterly Statistical Bulletin by Jan Newby
TITLE
NUMBER
Vol 2 No 2 February 1995 Vol 2 No 3 May 1995
013/95
014/95 015/95 016/95 017/95
018/95 019/95
020/95
021/95 022/95
023/95 024/95
025/95 026/95
Electorate Profile - Murwillumbah No 001/95 ................... by Jan Newby Electorate Profile - Kogarah No 002/95 . . . . . . . . . . . . . . . . . . . . . . . by Jan Newby Electorate Profile - Drummoyne No 003/95 . . . . . . . . . . . . . . . . . . . . . by Jan Newby Electorate Profile - Moorebank No 004/95 . . . . . . . . . . . . . . . . . . . . . . by Jan Newby Electorate Profile - Cessnock No 005/95 . . . . . . . . . . . . . . . . . . . . . . . by Jan Newby Electorate Profile - Hurstville No 006/95 . . . . . . . . . . . . . . . . . . . . . . . by Jan Newby Electorate Profile - Penrith No 007/95 ........................ by Jan Newby Electorate Profile - The Entrance No 008/95 . . . . . . . . . . . . . . . . . . . . by Jan Newby Electorate Profile - Bathurst No 009/95 ....................... by Jan Newby Electorate Profile - Orange No 010/95 ........................ by Jan Newby
2

Electorate Profile - Bligh No 011/95 .......................... by Jan Newby Electorate Profile - Southern Highlands No 012/95 ................ by Jan Newby Electorate Profile - Strathfield No 013/95 ...................... by Jan Newby
3