nstream bacteria concentrations andthe influence … · 2016. 6. 15. · research question birds...
TRANSCRIPT

INSTREAM BACTERIA CONCENTRATIONS
AND THEINFLUENCE OF BIRD COLONIES AT BRIDGES
DAVID PENDERGRASS

Rese
arch
Que
stio
n
Birds poop.
Bird poop can be a major contributor to high instream E. coli concentrations.
Instream E. coli samples are often collected near bridges.
Some birds, such as cliff swallows, roost at bridges in large numbers.
Landowners in some bacteria TMDL watersheds pin blame on bird colonies at water sampling sites.

Rese
arch
Que
stio
n
Do birds roosting at bridge crossings significantly increase instream bacteria concentrations in the
vicinity of bridges?H0 = No significant increase in E. coli concentrations between
upstream and downstream samples

STUDY DESIGN

Stud
y De
sign

Stud
y De
sign
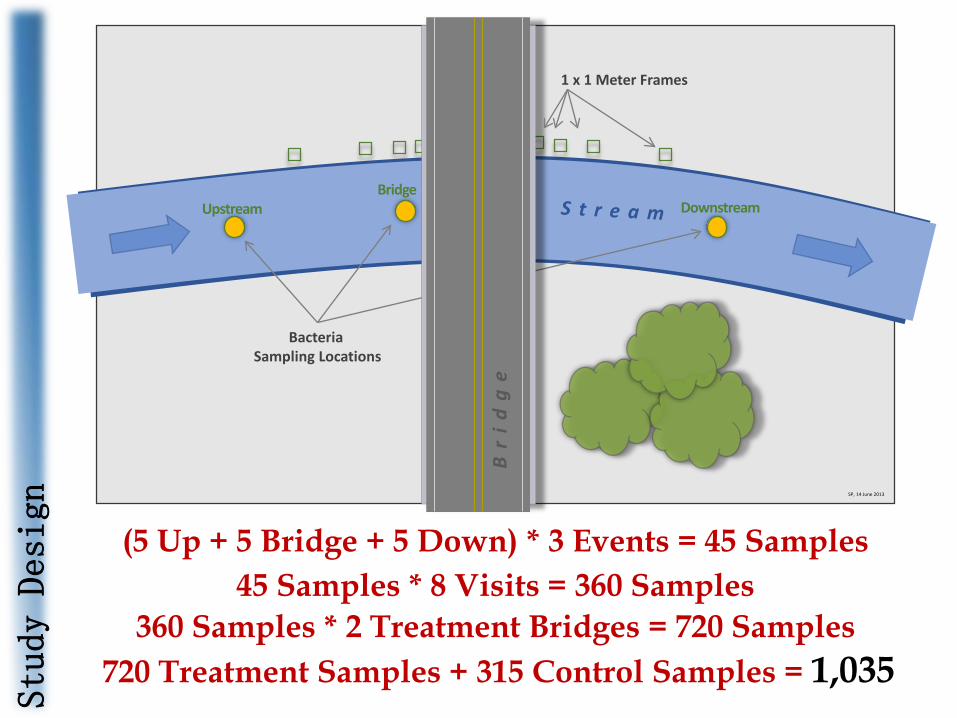
1 x 1 Meter Frames
Bacteria Sampling Locations
Upstream DownstreamBridge
Br
idg
e
SP, 14 June 2013
Assess Defecation Densities
Assess Instream Bacteria Concentrations

Stud
y De
sign
2 Treatment Bridges (16404 & 21186…swallows)
1 Spatial Control (20018…no swallows)
1 Temporal Control (16404… prior to swallow arrival)
1 x 1 Meter Frames
Bacteria Sampling Locations
Upstream DownstreamBridge
Br
idg
eSP, 14 June 2013
Stud
y De
sign
(5 Up + 5 Bridge + 5 Down) * 3 Events = 45 Samples
1 x 1 Meter Frames
Bacteria Sampling Locations
Upstream DownstreamBridge
Br
idg
eSP, 14 June 2013
45 Samples * 8 Visits = 360 Samples360 Samples * 2 Treatment Bridges = 720 Samples
720 Treatment Samples + 315 Control Samples = 1,035

NATURAL HISTORY
OF CLIFF SWALLOWS

Orni
thol
ogy
Cliff Swallow (Petrochelidon pyrrhonota)
In Texas: Arrive early March, depart mid-June
0
2
4
6
8
10
12
14
Jan Feb Mar Apr May Jun Jul Aug Sep Oct Nov Dec
Aver
age
Repo
rted
Cou
nt
P. p
yrrh
onot
a
Texas
Lampasas County
2003-2012
Data: www.ebird.org

Orni
thol
ogy
The Three Phases of Nesting
Cliff Swallow (Petrochelidon pyrrhonota)
Feeding/Nest Building
Incubation Nestling(Early)
Nestling(Late)
Fecal Deposition Frequency
Sortie Duration
Sortie Frequency

RESULTS
Resu
lts
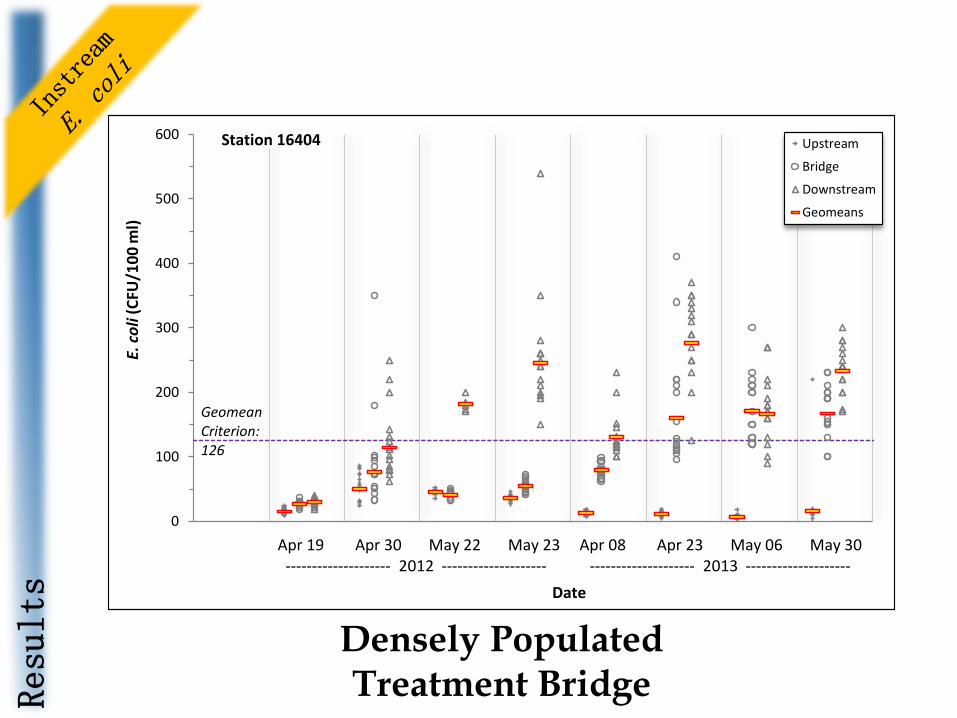
Densely Populated Treatment Bridge
0
100
200
300
400
500
600
0 1 2 3 4 5 6 7 8 9
E. co
li (C
FU/1
00 m
l)
Date
Upstream
Bridge
Downstream
Geomeans
Station 16404
Geomean Criterion: 126
Apr 19 Apr 30 May 22 May 23 Apr 08 Apr 23 May 06 May 30-------------------- 2012 -------------------- -------------------- 2013 --------------------

Resu
lts
Moderately Populated Treatment Bridge
0
100
200
300
400
500
600
700
800
0 1 2 3 4 5 6 7 8 9
E. co
li (C
FU/1
00 m
l)
Date
Upstream
Bridge
Downstream
Geomeans
Station 21186
Geomean Criterion: 126
Values of 860 and 1000 at Bridge not shown
Apr 26 May 01 May 24 May 29 Apr 09 Apr 22 May 07 May 31-------------------- 2012 -------------------- -------------------- 2013 --------------------
Resu
lts
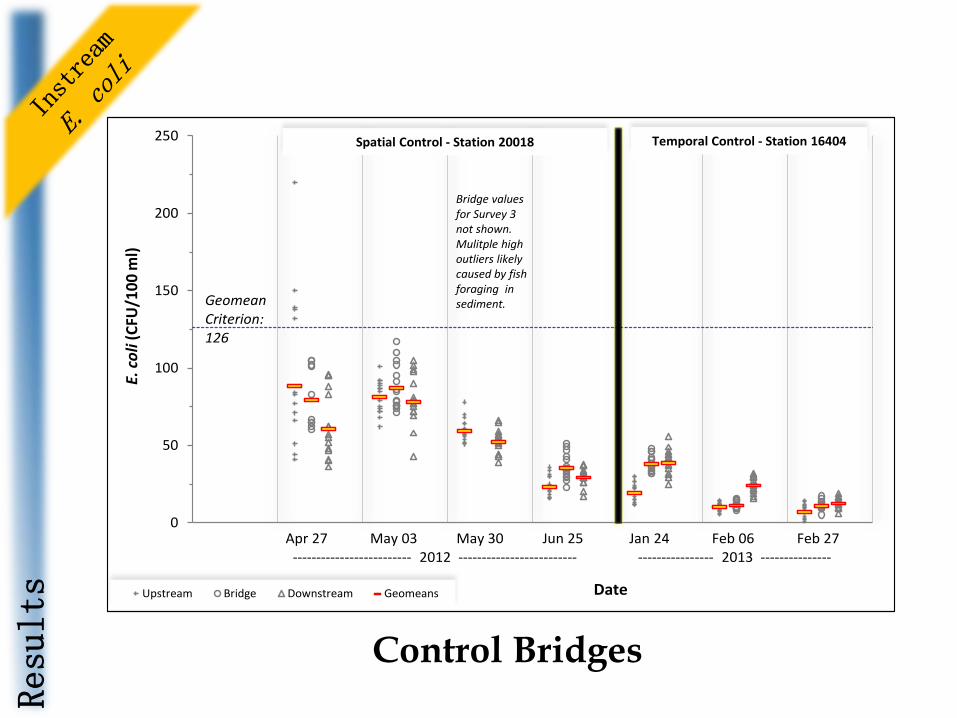
Control Bridges
0
50
100
150
200
250
0 1 2 3 4 5 6 7 8
E. co
li (C
FU/1
00 m
l)
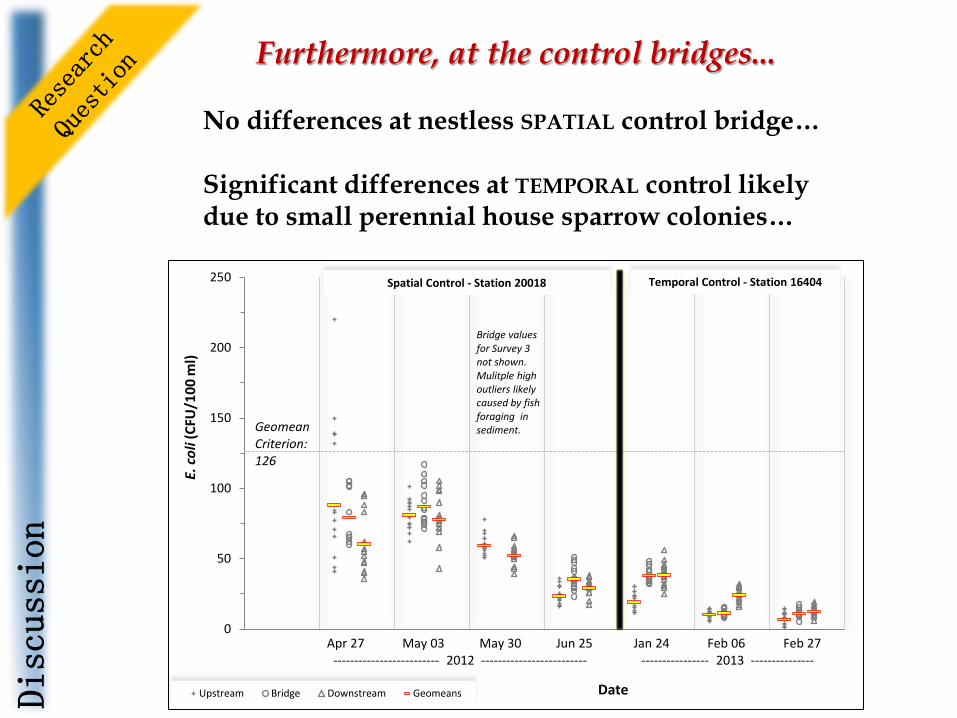
DateUpstream Bridge Downstream Geomeans
Apr 27 May 03 May 30 Jun 25 Jan 24 Feb 06 Feb 27------------------------- 2012 ------------------------- ---------------- 2013 ---------------
Geomean Criterion: 126
Bridge values for Survey 3 not shown. Mulitple high outliers likely caused by fish foraging in sediment.
Temporal Control - Station 16404Spatial Control - Station 20018

DISCUSSION

Disc
ussi
on
Do birds roosting at bridge crossings significantly increase instream bacteria concentrations in the
vicinity of bridges?
Yes…Sometimes…It Depends…

Disc
ussi
on
Yes…Sometimes…It Depends…
At the densely birded bridge……….When swallows were present…
Differences were always significant between upstream and downstream samples….....

Disc
ussi
on
Differences were less pronounced…
Differences were significant only during peak bird activity…
Meanwhile at the moderately birded bridge...
0
100
200
300
400
500
600
700
800
0 1 2 3 4 5 6 7 8 9
E. co
li (C
FU/1
00 m
l)
Date
Upstream
Bridge
Downstream
Geomeans
Station 21186
Geomean Criterion: 126
Values of 860 and 1000 at Bridge not shown
Apr 26 May 01 May 24 May 29 Apr 09 Apr 22 May 07 May 31-------------------- 2012 -------------------- -------------------- 2013 --------------------
Disc
ussi
on
No differences at nestless SPATIAL control bridge…
Significant differences at TEMPORAL control likely due to small perennial house sparrow colonies…
Furthermore, at the control bridges...
0
50
100
150
200
250
0 1 2 3 4 5 6 7 8
E. co
li (C
FU/1
00 m
l)
DateUpstream Bridge Downstream Geomeans
Apr 27 May 03 May 30 Jun 25 Jan 24 Feb 06 Feb 27------------------------- 2012 ------------------------- ---------------- 2013 ---------------
Geomean Criterion: 126
Bridge values for Survey 3 not shown. Mulitple high outliers likely caused by fish foraging in sediment.
Temporal Control - Station 16404Spatial Control - Station 20018

Feeding/Nest Building
Incubation Nestling(Early)
Nestling(Late)
Fecal Deposition Frequency
Sortie Duration
Sortie Frequency
Disc
ussi
on
E. Coli concentrations generally increased with bird activity at the nests
And the natural history…
Disc
ussi
on
More birds = more instream E. coli
Conclusion?

Disc
ussi
onImplications for
Water Quality Technicians
Assess presence of birds (and bats?).
Sample at a BPJ distance from the upstream bridge face.
Be mindful of migratory patterns (avoid nesting periods?).
Landowners in TMDL watersheds can—but probably shouldn’t—pin high E. coli concentrations on migratory swallow colonies.

ACKNOWLEDGEMENTS
FUNDING: TEXAS STATE SOIL AND WATER CONSERVATION BOARD
NABIN BASNET, CHRISTIE GOFFINET, GEORGIANA HUDSON, JOSEPH
JACKSON, UJWAL PANDEY, MATT BROWN, AND STEPHANIE PAINTER
JESUS CHRIST

QUESTIONS

Appe
ndix
0
5
10
15
20
25
-40 -20 0 20 40
Feca
l Cou
nt
Distance From Bridge Face (m)
Downstream Upstream
16404 Median Counts
0
2
4
6
8
10
-40 -20 0 20 40
Feca
l Cou
nt
Distance From Bridge Face (m)
Downstream Upstream
21186 Median Counts

Appe
ndix
0
100
200
300
400
500
600
700
800
900
0 1 2 3 4 5 6 7 8 9 10Es
timat
ed A
ctiv
e N
ests
Total Active Nests
Nests Over Water
19 Apr 30 Apr 29 May 23 Jan 08 Apr 23 Apr 08 May 31 May
ControlSample
Date
16404
2012 2013
0
200
400
600
800
1000
1200
1400
1600
1800
0 1 2 3 4 5 6 7
Estim
ated
Act
ive
Nes
ts
Total Active Nests
Nests Over Water
27 Apr 29 May 08 Apr 22 Apr 08 May 31 May
2012 2013
21186