nsse 2015 topical module learning with technology
TRANSCRIPT

NSSE 2015 Topical Module
Central Connecticut State University
IPEDS: 128771
Learning with Technology

This page intentionally left blank.
2 • NSSE 2015 TOPICAL MODULE REPORT

About This Topical Module
Comparison Group
Learning with Tech (N=98)Abilene Christian University (Abilene, TX) Goshen College (Goshen, IN)
Adelphi University (Garden City, NY) Grand Canyon University (Phoenix, AZ)
Alverno College (Milwaukee, WI) Hastings College (Hastings, NE)
Austin College (Sherman, TX)* Hofstra University (Hempstead, NY)*
Bacone College (Muskogee, OK) Hope College (Holland, MI)
Baptist Memorial College of Health Sciences (Memphis, TN) Immaculata University (Immaculata, PA)*
Bethune Cookman University (Daytona Beach, FL)* Indiana University East (Richmond, IN)
Binghamton University (State University of New York) (Binghamton, NY)* Jackson State University (Jackson, MS)
Cabrini College (Radnor, PA)* Jacksonville State University (Jacksonville, AL)
California State University-Dominguez Hills (Carson, CA) Keene State College (Keene, NH)*
California State University, Fresno (Fresno, CA) Keuka College (Keuka Park, NY)*
California State University, Northridge (Northridge, CA) Kwantlen Polytechnic University (Surrey, BC)*
Capital University (Columbus, OH) Lafayette College (Easton, PA)
Carlow University (Pittsburgh, PA)* Lake Superior State University (Sault Ste Marie, MI)*
Carroll University (Waukesha, WI)* Lewis University (Romeoville, IL)*
Central Michigan University (Mount Pleasant, MI) LIM College (New York, NY)
Centre College (Danville, KY) Lourdes University (Sylvania, OH)
Citadel, The Military College of South Carolina, The (Charleston, SC) Luther College (Decorah, IA)*
Claremont McKenna College (Claremont, CA)* Lynn University (Boca Raton, FL)
Clark University (Worcester, MA)* Mars Hill University (Mars Hill, NC)
College of Wooster, The (Wooster, OH) McDaniel College (Westminster, MD)
Colorado State University-Pueblo (Pueblo, CO)* Methodist University (Fayetteville, NC)
Columbia College Chicago (Chicago, IL)* Misericordia University (Dallas, PA)*
Concordia University (Portland, OR) Moravian College (Bethlehem, PA)
Cornerstone University (Grand Rapids, MI) Morrisville State College (Morrisville, NY)*
Culver-Stockton College (Canton, MO) Mount Mary University (Milwaukee, WI)
CUNY New York City College of Technology (Brooklyn, NY) North Carolina Central University (Durham, NC)*
CUNY Queens College (Flushing, NY)* Oklahoma City University (Oklahoma City, OK)
Eastern New Mexico University (Portales, NM) Old Dominion University (Norfolk, VA)
Gallaudet University (Washington, DC)* Otis College of Art and Design (Los Angeles, CA)
Group description All NSSE institutions administering the module "Learning with Technology" (includes current- and prior-year
administrations)
Group label Learning with Tech
Date submitted 6/10/15
How was this
comparison group
constructed?
Your institution retained the default comparison group (all module participants).
NSSE 2015 Learning with TechnologyAdministration Summary
Central Connecticut State University
Developed in partnership with EDUCAUSE, these questions examine the role of technology in student learning, focusing on usage,
contribution to learning, and perceptions of institutional support . This module complements questions on the core survey about learning with
peers, quality of interactions with others, and institutional emphasis on academic support. Complementary FSSE set available.
This section summarizes how this module's comparison group was identified, including selection criteria and whether the default option was
taken. This is followed by the resulting list of institutions represented in the 'Learning with Tech' column of this report.
*2014 participant NSSE 2015 TOPICAL MODULE REPORT • 3

Learning with Tech (N=98), continuedRamapo College of New Jersey (Mahwah, NJ)*
Rollins College (Winter Park, FL)*
Savannah College of Art and Design (Savannah, GA)
Seton Hall University (South Orange, NJ)
Shenandoah University (Winchester, VA)
Southern University and A&M College (Baton Rouge, LA)
Southwestern Christian University (Bethany, OK)
Springfield College (Springfield, MA)*
St. Lawrence University (Canton, NY)*
Texas A&M University - Central Texas (Killeen, TX)
Thompson Rivers University (Kamloops, BC)*
Tyndale University College (Toronto, ON)
Université de Moncton (Moncton, NB)*
University of Advancing Technology (Tempe, AZ)
University of Arkansas at Monticello (Monticello, AR)*
University of British Columbia (Vancouver, BC)*
University of British Columbia Okanagan (Kelowna, BC)*
University of Detroit Mercy (Detroit, MI)*
University of Hartford (West Hartford, CT)
University of Houston (Houston, TX)
University of Kentucky (Lexington, KY)
University of Maine at Fort Kent (Fort Kent, ME)*
University of Maryland-Eastern Shore (Princess Anne, MD)
University of Minnesota-Crookston (Crookston, MN)*
University of New Hampshire (Durham, NH)
University of Puerto Rico in Ponce (Ponce, PR)*
University of Saint Mary (Leavenworth, KS)
University of Southern Maine (Portland, ME)*
University of St. Thomas (Saint Paul, MN)*
University of Toledo (Toledo, OH)
University of Waterloo (Waterloo, ON)*
University of Wisconsin-Stout (Menomonie, WI)*
Valley City State University (Valley City, ND)
Washburn University (Topeka, KS)*
Wayne State College (Wayne, NE)
Westminster College (Fulton, MO)
William Jewell College (Liberty, MO)
William Paterson University of New Jersey (Wayne, NJ)*
*2014 participant
4 • NSSE 2015 TOPICAL MODULE REPORT

First-Year Students
CCSU
Item wording or description Values c Response options Count % Count % Mean
Effect
size d
a. 1 Very little 4 2 573 3
2 Some 38 16 3,201 14
3 Quite a bit 98 44 8,789 38 3.2 3.3 -.08
4 Very much 87 38 10,243 45
Total 227 100 22,806 100
b. 1 Very little 5 2 710 3
2 Some 37 16 3,904 17
3 Quite a bit 112 50 9,043 40 3.1 3.2 -.04
4 Very much 73 32 9,001 39
Total 227 100 22,658 100
c. 1 Very little 4 1 374 2
2 Some 27 12 2,242 10
3 Quite a bit 90 40 7,618 33 3.3 3.4 -.13
4 Very much 106 47 12,476 55
Total 227 100 22,710 100
d. 1 Very little 24 10 1,988 10
2 Some 59 26 5,155 23
3 Quite a bit 80 35 7,474 33 2.8 2.9 -.10
4 Very much 64 29 8,012 34
Total 227 100 22,629 100
e. 1 Very little 20 9 2,578 12
2 Some 75 32 7,128 32
3 Quite a bit 68 32 6,597 29 2.8 2.7 .05
4 Very much 61 27 6,327 28
Total 224 100 22,630 100
1 Very little 40 18 3,664 17
2 Some 69 33 7,876 35
3 Quite a bit 78 37 7,196 32 2.4 2.5 -.08
4 Very much 22 11 3,713 17
Total 209 100 22,449 100
a. 1 Never 75 30 7,665 33
2 Sometimes 60 26 6,759 30
3 Often 56 26 4,101 18 2.3 2.2 .06
4 Very often 34 16 4,055 18
— I don't know what this is 2 1 182 1
Total 227 100 22,762 100
b. 1 Never 114 49 10,049 45
2 Sometimes 38 17 5,302 24
3 Often 38 18 2,645 11 1.8 1.8 -.01
4 Very often 10 5 1,677 7
— I don't know what this is 25 11 3,004 13
Total 225 100 22,677 100
Demonstrating your understanding
of course content
TEC01b
NSSE 2015 Learning with TechnologyFrequencies and Statistical Comparisons
Central Connecticut State University
Frequency Distributionsa
Statistical Comparisonsb
CCSU
Learning with
Tech
Learning with
Tech
Variable
name Mean
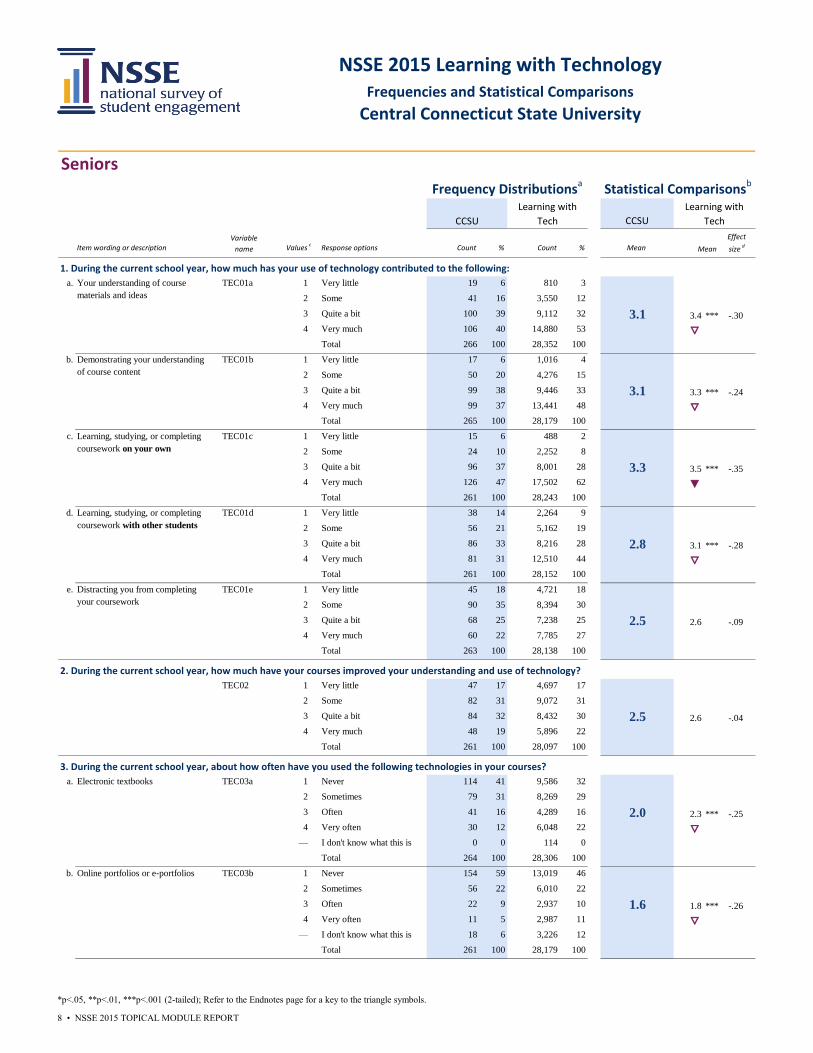
1. During the current school year, how much has your use of technology contributed to the following:
Your understanding of course
materials and ideas
TEC01a
Learning, studying, or completing
coursework on your own
TEC01c
Learning, studying, or completing
coursework with other students
TEC01d
Distracting you from completing
your coursework
TEC01e
2. During the current school year, how much have your courses improved your understanding and use of technology?
TEC02
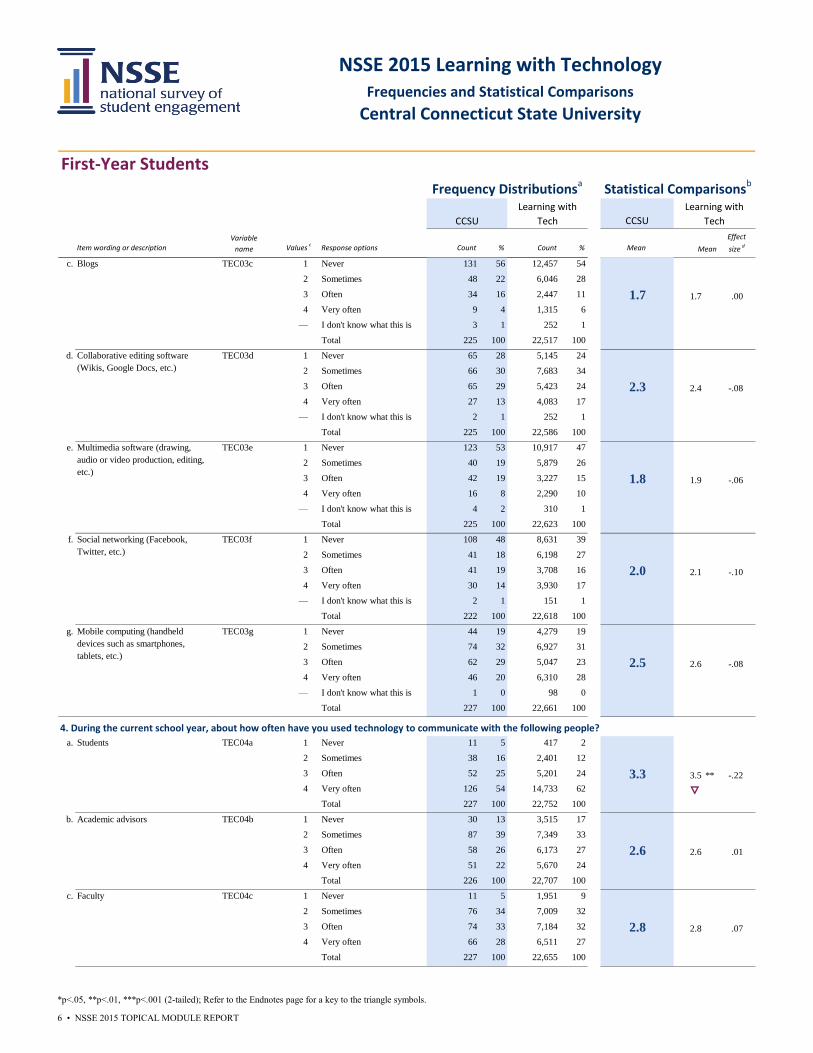
3. During the current school year, about how often have you used the following technologies in your courses?
Electronic textbooks TEC03a
Online portfolios or e‐portfolios TEC03b
*p<.05, **p<.01, ***p<.001 (2-tailed); Refer to the Endnotes page for a key to the triangle symbols. NSSE 2015 TOPICAL MODULE REPORT • 5
First-Year Students
CCSU
Item wording or description Values c Response options Count % Count % Mean
Effect
size d
NSSE 2015 Learning with TechnologyFrequencies and Statistical Comparisons
Central Connecticut State University
Frequency Distributionsa
Statistical Comparisonsb
CCSU
Learning with
Tech
Learning with
Tech
Variable
name Mean
c. 1 Never 131 56 12,457 54
2 Sometimes 48 22 6,046 28
3 Often 34 16 2,447 11 1.7 1.7 .00
4 Very often 9 4 1,315 6
— I don't know what this is 3 1 252 1
Total 225 100 22,517 100
d. 1 Never 65 28 5,145 24
2 Sometimes 66 30 7,683 34
3 Often 65 29 5,423 24 2.3 2.4 -.08
4 Very often 27 13 4,083 17
— I don't know what this is 2 1 252 1
Total 225 100 22,586 100
e. 1 Never 123 53 10,917 47
2 Sometimes 40 19 5,879 26
3 Often 42 19 3,227 15 1.8 1.9 -.06
4 Very often 16 8 2,290 10
— I don't know what this is 4 2 310 1
Total 225 100 22,623 100
f. 1 Never 108 48 8,631 39
2 Sometimes 41 18 6,198 27
3 Often 41 19 3,708 16 2.0 2.1 -.10
4 Very often 30 14 3,930 17
— I don't know what this is 2 1 151 1
Total 222 100 22,618 100
g. 1 Never 44 19 4,279 19
2 Sometimes 74 32 6,927 31
3 Often 62 29 5,047 23 2.5 2.6 -.08
4 Very often 46 20 6,310 28
— I don't know what this is 1 0 98 0
Total 227 100 22,661 100
a. 1 Never 11 5 417 2
2 Sometimes 38 16 2,401 12
3 Often 52 25 5,201 24 3.3 3.5 ** -.22
4 Very often 126 54 14,733 62 ▽Total 227 100 22,752 100
b. 1 Never 30 13 3,515 17
2 Sometimes 87 39 7,349 33
3 Often 58 26 6,173 27 2.6 2.6 .01
4 Very often 51 22 5,670 24
Total 226 100 22,707 100
c. 1 Never 11 5 1,951 9
2 Sometimes 76 34 7,009 32
3 Often 74 33 7,184 32 2.8 2.8 .07
4 Very often 66 28 6,511 27
Total 227 100 22,655 100
Blogs TEC03c
Collaborative editing software
(Wikis, Google Docs, etc.)
TEC03d
Multimedia software (drawing,
audio or video production, editing,
etc.)
TEC03e
Social networking (Facebook,
Twitter, etc.)
TEC03f
Mobile computing (handheld
devices such as smartphones,
tablets, etc.)
TEC03g
4. During the current school year, about how often have you used technology to communicate with the following people?
Students TEC04a
Academic advisors TEC04b
Faculty TEC04c
*p<.05, **p<.01, ***p<.001 (2-tailed); Refer to the Endnotes page for a key to the triangle symbols.
6 • NSSE 2015 TOPICAL MODULE REPORT

First-Year Students
CCSU
Item wording or description Values c Response options Count % Count % Mean
Effect
size d
NSSE 2015 Learning with TechnologyFrequencies and Statistical Comparisons
Central Connecticut State University
Frequency Distributionsa
Statistical Comparisonsb
CCSU
Learning with
Tech
Learning with
Tech
Variable
name Mean
d. 1 Never 66 29 6,706 31
2 Sometimes 79 35 8,022 35
3 Often 42 19 4,026 18 2.3 2.2 .06
4 Very often 40 17 3,886 16
Total 227 100 22,640 100
e. 1 Never 59 26 6,435 30
2 Sometimes 93 41 8,632 38
3 Often 39 18 3,810 17 2.2 2.2 .04
4 Very often 34 15 3,703 16
Total 225 100 22,580 100
a. 1 Very little 35 15 2,878 13
2 Some 95 40 7,976 36
3 Quite a bit 68 32 7,739 33 2.4 2.6 -.12
4 Very much 29 13 4,122 18
Total 227 100 22,715 100
b. 1 Very little 20 9 1,796 9
2 Some 75 32 6,106 27
3 Quite a bit 89 41 8,851 39 2.7 2.8 -.12
4 Very much 43 19 5,903 25
Total 227 100 22,656 100
c. 1 Very little 27 11 2,256 11
2 Some 87 38 6,616 29
3 Quite a bit 77 36 8,272 36 2.6 2.7 ** -.19
4 Very much 36 15 5,530 24 ▽Total 227 100 22,674 100
d. 1 Very little 28 12 2,560 12
2 Some 86 38 6,793 30
3 Quite a bit 73 34 7,799 34 2.6 2.7 -.13
4 Very much 39 17 5,451 23
Total 226 100 22,603 100
Teaching with new, cutting‐edge
technologies
TEC05a
Student services staff (career
services, student activities,
housing, etc.)
TEC04d
Other administrative staff and
offices (registrar, financial aid, etc.)
TEC04e
5. How much does your institution emphasize the following?
Providing technology to help you
learn, study or complete
coursework
TEC05b
Teaching you how to use available
technologies to learn, study, or
complete coursework
TEC05c
Providing support services to assist
you with your use of technology
TEC05d
*p<.05, **p<.01, ***p<.001 (2-tailed); Refer to the Endnotes page for a key to the triangle symbols. NSSE 2015 TOPICAL MODULE REPORT • 7
Seniors
CCSU
Item wording or description Values c Response options Count % Count % Mean
Effect
size d
a. 1 Very little 19 6 810 3
2 Some 41 16 3,550 12
3 Quite a bit 100 39 9,112 32 3.1 3.4 *** -.30
4 Very much 106 40 14,880 53 ▽Total 266 100 28,352 100
b. 1 Very little 17 6 1,016 4
2 Some 50 20 4,276 15
3 Quite a bit 99 38 9,446 33 3.1 3.3 *** -.24
4 Very much 99 37 13,441 48 ▽Total 265 100 28,179 100
c. 1 Very little 15 6 488 2
2 Some 24 10 2,252 8
3 Quite a bit 96 37 8,001 28 3.3 3.5 *** -.35
4 Very much 126 47 17,502 62 ▼Total 261 100 28,243 100
d. 1 Very little 38 14 2,264 9
2 Some 56 21 5,162 19
3 Quite a bit 86 33 8,216 28 2.8 3.1 *** -.28
4 Very much 81 31 12,510 44 ▽Total 261 100 28,152 100
e. 1 Very little 45 18 4,721 18
2 Some 90 35 8,394 30
3 Quite a bit 68 25 7,238 25 2.5 2.6 -.09
4 Very much 60 22 7,785 27
Total 263 100 28,138 100
1 Very little 47 17 4,697 17
2 Some 82 31 9,072 31
3 Quite a bit 84 32 8,432 30 2.5 2.6 -.04
4 Very much 48 19 5,896 22
Total 261 100 28,097 100
a. 1 Never 114 41 9,586 32
2 Sometimes 79 31 8,269 29
3 Often 41 16 4,289 16 2.0 2.3 *** -.25
4 Very often 30 12 6,048 22 ▽— I don't know what this is 0 0 114 0
Total 264 100 28,306 100
b. 1 Never 154 59 13,019 46
2 Sometimes 56 22 6,010 22
3 Often 22 9 2,937 10 1.6 1.8 *** -.26
4 Very often 11 5 2,987 11 ▽— I don't know what this is 18 6 3,226 12
Total 261 100 28,179 100
Demonstrating your understanding
of course content
TEC01b
NSSE 2015 Learning with TechnologyFrequencies and Statistical Comparisons
Central Connecticut State University
Frequency Distributionsa
Statistical Comparisonsb
CCSU
Learning with
Tech
Learning with
Tech
Variable
name Mean
1. During the current school year, how much has your use of technology contributed to the following:
Your understanding of course
materials and ideas
TEC01a
Learning, studying, or completing
coursework on your own
TEC01c
Learning, studying, or completing
coursework with other students
TEC01d
Distracting you from completing
your coursework
TEC01e
2. During the current school year, how much have your courses improved your understanding and use of technology?
TEC02
3. During the current school year, about how often have you used the following technologies in your courses?
Electronic textbooks TEC03a
Online portfolios or e‐portfolios TEC03b
*p<.05, **p<.01, ***p<.001 (2-tailed); Refer to the Endnotes page for a key to the triangle symbols.
8 • NSSE 2015 TOPICAL MODULE REPORT

Seniors
CCSU
Item wording or description Values c Response options Count % Count % Mean
Effect
size d
NSSE 2015 Learning with TechnologyFrequencies and Statistical Comparisons
Central Connecticut State University
Frequency Distributionsa
Statistical Comparisonsb
CCSU
Learning with
Tech
Learning with
Tech
Variable
name Mean
c. 1 Never 144 55 15,487 55
2 Sometimes 77 29 7,885 29
3 Often 28 11 2,524 9 1.6 1.7 -.06
4 Very often 8 3 1,777 7
— I don't know what this is 3 1 286 1
Total 260 100 27,959 100
d. 1 Never 88 34 5,865 21
2 Sometimes 89 34 8,795 31
3 Often 59 22 6,632 24 2.1 2.5 *** -.37
4 Very often 28 10 6,546 23 ▼— I don't know what this is 1 0 264 1
Total 265 100 28,102 100
e. 1 Never 109 40 12,977 45
2 Sometimes 84 33 7,572 27
3 Often 31 12 3,573 13 2.0 2.0 .05
4 Very often 37 14 3,674 14
— I don't know what this is 3 1 334 1
Total 264 100 28,130 100
f. 1 Never 142 55 11,695 42
2 Sometimes 57 21 7,858 27
3 Often 41 15 4,131 15 1.8 2.0 *** -.22
4 Very often 23 9 4,218 15 ▽— I don't know what this is 1 0 200 1
Total 264 100 28,102 100
g. 1 Never 82 30 6,251 22
2 Sometimes 73 29 7,860 27
3 Often 52 19 5,880 21 2.3 2.6 *** -.25
4 Very often 55 21 8,081 30 ▽— I don't know what this is 4 1 107 0
Total 266 100 28,179 100
a. 1 Never 9 4 444 2
2 Sometimes 47 18 2,631 10
3 Often 75 30 5,411 20 3.2 3.5 *** -.42
4 Very often 134 48 19,822 68 ▼Total 265 100 28,308 100
b. 1 Never 22 8 3,694 15
2 Sometimes 103 40 7,847 29
3 Often 70 27 6,909 24 2.7 2.7 -.04
4 Very often 69 25 9,807 32
Total 264 100 28,257 100
c. 1 Never 8 3 1,150 5
2 Sometimes 65 25 6,454 24
3 Often 102 40 8,725 31 3.0 3.1 -.07
4 Very often 86 31 11,795 40
Total 261 100 28,124 100
Blogs TEC03c
Collaborative editing software
(Wikis, Google Docs, etc.)
TEC03d
Multimedia software (drawing,
audio or video production, editing,
etc.)
TEC03e
Social networking (Facebook,
Twitter, etc.)
TEC03f
Mobile computing (handheld
devices such as smartphones,
tablets, etc.)
TEC03g
4. During the current school year, about how often have you used technology to communicate with the following people?
Students TEC04a
Academic advisors TEC04b
Faculty TEC04c
*p<.05, **p<.01, ***p<.001 (2-tailed); Refer to the Endnotes page for a key to the triangle symbols. NSSE 2015 TOPICAL MODULE REPORT • 9

Seniors
CCSU
Item wording or description Values c Response options Count % Count % Mean
Effect
size d
NSSE 2015 Learning with TechnologyFrequencies and Statistical Comparisons
Central Connecticut State University
Frequency Distributionsa
Statistical Comparisonsb
CCSU
Learning with
Tech
Learning with
Tech
Variable
name Mean
d. 1 Never 130 48 10,325 39
2 Sometimes 70 28 8,113 29
3 Often 41 16 4,104 14 1.8 2.1 *** -.24
4 Very often 23 8 5,598 19 ▽Total 264 100 28,140 100
e. 1 Never 76 28 7,740 30
2 Sometimes 122 47 10,695 37
3 Often 44 17 4,226 15 2.1 2.2 ** -.14
4 Very often 22 8 5,440 18 ▽Total 264 100 28,101 100
a. 1 Very little 47 17 4,152 15
2 Some 111 43 10,147 35
3 Quite a bit 85 33 8,968 32 2.3 2.5 *** -.23
4 Very much 21 8 5,015 18 ▽Total 264 100 28,282 100
b. 1 Very little 29 11 3,020 11
2 Some 99 38 8,265 29
3 Quite a bit 95 37 10,222 36 2.6 2.7 ** -.19
4 Very much 41 15 6,719 24 ▽Total 264 100 28,226 100
c. 1 Very little 42 16 3,792 14
2 Some 99 37 9,077 32
3 Quite a bit 92 35 9,242 33 2.4 2.6 *** -.20
4 Very much 32 12 6,120 22 ▽Total 265 100 28,231 100
d. 1 Very little 42 15 4,234 16
2 Some 103 38 9,441 33
3 Quite a bit 83 33 8,663 31 2.4 2.6 * -.12
4 Very much 36 13 5,812 21 ▽Total 264 100 28,150 100
Teaching with new, cutting‐edge
technologies
TEC05a
Student services staff (career
services, student activities,
housing, etc.)
TEC04d
Other administrative staff and
offices (registrar, financial aid, etc.)
TEC04e
5. How much does your institution emphasize the following?
Providing technology to help you
learn, study or complete
coursework
TEC05b
Teaching you how to use available
technologies to learn, study, or
complete coursework
TEC05c
Providing support services to assist
you with your use of technology
TEC05d
*p<.05, **p<.01, ***p<.001 (2-tailed); Refer to the Endnotes page for a key to the triangle symbols.
10 • NSSE 2015 TOPICAL MODULE REPORT

First-Year Students
N DFh Sig.i
Effect
sized
TEC01a 226 3.25 .05 .01 0.76 0.80 23,072 .215 -.08
TEC01b 226 3.16 .05 .01 0.74 0.82 230 .509 -.04
TEC01c 226 3.41 .05 .00 0.74 0.74 22,962 .060 -.13
TEC01d 226 2.92 .06 .01 0.97 0.98 22,897 .131 -.10
TEC01e 223 2.72 .06 .01 0.95 1.00 22,908 .453 .05
TEC02 206 2.48 .06 .01 0.91 0.96 22,675 .279 -.08
TEC03a 224 2.22 .07 .01 1.07 1.10 22,844 .390 .06
TEC03b 199 1.78 .07 .01 0.96 0.97 19,945 .885 -.01
TEC03c 220 1.69 .06 .01 0.90 0.90 22,508 .999 .00
TEC03d 222 2.35 .07 .01 1.01 1.03 22,610 .217 -.08
TEC03e 220 1.88 .07 .01 1.00 1.02 22,599 .357 -.06
TEC03f 219 2.10 .08 .01 1.11 1.10 22,697 .157 -.10
TEC03g 225 2.59 .07 .01 1.02 1.08 229 .211 -.08
TEC04a 226 3.46 .06 .01 0.90 0.79 228 .004 -.22
TEC04b 225 2.56 .07 .01 0.98 1.03 22,953 .904 .01
TEC04c 226 2.77 .06 .01 0.89 0.95 22,895 .266 .07
TEC04d 226 2.19 .07 .01 1.05 1.05 22,880 .359 .06
TEC04e 223 2.18 .07 .01 1.00 1.03 22,819 .566 .04
TEC05a 226 2.55 .06 .01 0.90 0.93 22,962 .075 -.12
TEC05b 226 2.80 .06 .01 0.88 0.91 22,915 .084 -.12
TEC05c 226 2.73 .06 .01 0.89 0.94 22,928 .005 -.19
TEC05d 225 2.68 .06 .01 0.91 0.96 22,853 .061 -.13
NSSE 2015 Learning with TechnologyDetailed Statisticse
Central Connecticut State University
Mean Standard errorf
Standard
deviationg
3.12
Variable
name CCSU CCSU Learning with Tech CCSU Learning with Tech
Comparisons with:
Learning with Tech
3.19
CCSU Learning with Tech
3.28
3.32
2.82
2.77
2.41
2.29
1.77
1.69
2.27
1.81
1.99
2.51
2.55
2.56
2.57
2.84
2.25
2.22
2.44
2.70
NSSE 2015 TOPICAL MODULE REPORT • 11

Seniors
N DFh Sig.i
Effect
sized
TEC01a 270 3.35 .05 .00 0.89 0.81 27,118 .000 -.30
TEC01b 269 3.26 .05 .01 0.89 0.85 26,944 .000 -.24
TEC01c 265 3.51 .05 .00 0.86 0.72 268 .000 -.35
TEC01d 264 3.08 .06 .01 1.03 0.98 26,929 .000 -.28
TEC01e 266 2.61 .06 .01 1.03 1.07 26,916 .164 -.09
TEC02 265 2.57 .06 .01 0.99 1.01 26,861 .537 -.04
TEC03a 268 2.28 .06 .01 1.03 1.14 273 .000 -.25
TEC03b 248 1.84 .05 .01 0.85 1.04 255 .000 -.26
TEC03c 262 1.68 .05 .01 0.82 0.90 26,461 .310 -.06
TEC03d 268 2.49 .06 .01 0.98 1.07 274 .000 -.37
TEC03e 265 1.95 .06 .01 1.05 1.07 26,575 .398 .05
TEC03f 267 2.02 .06 .01 1.01 1.08 26,684 .000 -.22
TEC03g 267 2.59 .07 .01 1.12 1.13 26,860 .000 -.25
TEC04a 269 3.54 .05 .00 0.88 0.76 273 .000 -.42
TEC04b 268 2.73 .06 .01 0.94 1.07 273 .453 -.04
TEC04c 265 3.06 .05 .01 0.84 0.91 270 .226 -.07
TEC04d 268 2.12 .06 .01 0.97 1.12 275 .000 -.24
TEC04e 268 2.21 .05 .01 0.89 1.06 274 .009 -.14
TEC05a 268 2.53 .05 .01 0.84 0.95 274 .000 -.23
TEC05b 268 2.73 .05 .01 0.87 0.95 27,018 .002 -.19
TEC05c 269 2.63 .05 .01 0.90 0.98 274 .000 -.20
TEC05d 268 2.56 .06 .01 0.91 0.99 273 .039 -.12
NSSE 2015 Learning with TechnologyDetailed Statisticse
Central Connecticut State University
Mean Standard errorf
Standard
deviationg
3.06
Variable
name CCSU CCSU Learning with Tech CCSU Learning with Tech
Comparisons with:
Learning with Tech
3.11
CCSU Learning with Tech
3.22
3.26
2.81
2.52
2.53
1.99
1.57
1.62
2.09
2.01
1.78
2.31
2.43
2.45
2.69
2.99
1.85
2.07
2.31
2.55
12 • NSSE 2015 TOPICAL MODULE REPORT

Endnotes
a.
b.
c.
d.
e.
f. The 95% confidence interval for the population mean is equal to the sample mean plus or minus 1.96 times the standard error of the mean.
g. A measure of the amount individual scores deviate from the mean of all the scores in the distribution.
h. Degrees of freedom used to compute the t -tests. Values differ from Ns due to weighting and whether equal variances were assumed.
i.
Key to symbols:
▲ Your students’ average was significantly higher (p < .05) with an effect size at least .3 in magnitude.
△ Your students’ average was significantly higher (p < .05) with an effect size less than .3 in magnitude.
▽ Your students’ average was significantly lower (p < .05) with an effect size less than .3 in magnitude.
▼ Your students’ average was significantly lower (p < .05) with an effect size at least .3 in magnitude.
NSSE 2015 Learning with TechnologyEndnotes
Central Connecticut State University
Column percentages are weighted by institution-reported sex and enrollment status (and institution size for comparison groups). Percentages may not sum to
100 due to rounding. Counts are unweighted; column percentages cannot be replicated from counts.
All statistics are weighted by institution-reported sex and enrollment status (and institution size for comparison groups). Unless otherwise noted, statistical
comparisons are two-tailed independent t -tests. Items with categorical response sets are left blank.
These are the values used to calculate means. For the majority of items, these values match the codes in the data file and codebook.
Effect size for independent t -tests uses Cohen's d.
Statistics are weighted by institution-reported sex and enrollment status (and institution size for comparison groups). Categorical items are not listed.
Statistical comparisons are two-tailed independent t -tests. Statistical significance represents the probability that the difference between your students' mean
and that of the comparison group is due to chance.
Note: It is important to interpret the direction of differences relative to item wording and your institutional context.
NSSE 2015 TOPICAL MODULE REPORT • 13