nsiad-92-218 navy contracting: cost growth … shipbuilding costs increasing we compared the july...
TRANSCRIPT

-_._---.
NAVY CONTRACTING
Cost Growth Continues on Ship Construction Contracts
II Ill 11111 147361
- I I - - - . - - . - -_ -_ . . -~ - - - ~ - - - - - (;AO/PJSIAI)-!%2 1 X


GAO United States General Accounting Office Washington, D.C. 20548
National Security and International Affairs Division
B-228619
August 31,1992
The Honorable Daniel K. Inouye Chairman, Subcommittee on Defense Committee on Appropriations United States Senate
Dear Mr. Chairman:
For the last several years, we have monitored cost growth on Navy ship construction contracts and have testified and issued several reports on the subject (see “Related GAO Products” at the end of this report). This report updates the status of the cost growth, describes trends in that growth, and discusses recent actions to finance additional costs and the implications of future cost growth.
Background About 90 percent of the dollar value of the Navy ships under construction as of July 199 1 can be accounted for in fmed-price incentive contracts with commercial shipyards. A fured-price incentive contract establishes a target cost and profit, a ceiling price, and a share formula that is used to determine the cost to the Navy and the profit earned by the shipyard. The target cost-a negotiated estimate of the ship’s actual cost-and target profit-the profit the shipyard should earn if the contract is completed at the target cost-can be adjusted by mutual agreement as work progresses, in which case the Navy is responsible for any additional expense. The target price is the sum of the target cost and the target profit.’ The ceiling price-generally 120 to 135 percent of the target cost-is the maximum amount the Navy will pay on the contract. The Navy and the shipyard share any “over-target” costs that exceed current target costs up to the ceiling price based on a formula that is negotiated as part of the contract. Generally, the Navy and the shipyard share this increase equally. However, all costs above the ceiling price are borne by the shipyard. Thus, the shipyard’s profit is determined by how well it meets the target cost. Firm fixed-price or fixed-price with escalation contracts were used for the remaining 10 percent of the remaining ships under construction in July 199 1, These contracts generally contain no provisions for adjusting the price after the award of the contracts. Contract types are discussed in more detail in appendix I.
a
‘The target cost, target profit, and target price, if ac\justed, are referred to as the current target cost, current target profit, and current target price.
Page 1 GAO/NSIALb92-218 Ship Construction Contracta

B-228619
The Navy conducts annual ship cost adjustment reviews to develop updated cost estimates for each ship under construction. The information is used to establish a financial baseline for managing ongoing shipbuilding programs and for budget preparation and is provided to all Navy management levels for those purposes. Unless otherwise noted, we used data from the ship cost adjustment review completed in July 1991 as the 1991 current data.
Results in Brief The potential total cost for completing construction of the 165 ships under the Navy’s 54 ship construction contracts that were open at the end of fiscal year 1991 was about $6.4 billion (24 percent) higher than the contracts’ initial target costs of about $27.1 billion.2 The Navy’s share of that increase is about $4 billion; the shipyards are liable for the remainder.
Cost growth has increased over the years. When we last reported on cost growth in 1990, the potential total cost for completing the 62 ship construction contracts that were open at that time was about $5.5 billion (20 percent) higher than those contracts’ initial target costs of $27.3 billion.
In the past, the Navy, with congressional approval, has made up funding shortages in individual ship construction accounts by transferring funds to those programs from other shipbuilding and procurement programs that were reduced, canceled, or were of a lower priority. However, for fiscal year 1992, in addition to the transfer of $1.5 billion among programs, Congress provided $463.6 million in new funding to make up existing funding shortages. The overall increasmg cost growth and a potential decline in the number of ships under construction will reduce the total funds available for shipbuilding. Thus, the Navy will find it increasingly difficult to make up shipbuilding funding shortfalls through transfers 6 among programs as it has done in the past.3 As a result, it may have to request additional funds from Congress, as it did in fiscal year 1992.
‘Navy Contracting: Ship Construction Contracts Could Cost Billions Over Initial Target Costs (GAO/MUD-9 l-1 8, Oct. 5,199O) discussed the reasons for cost growth on ship construction contracts. It also discussed the results of the Navy’s 1989 ship cost review.
3Moreover, recent legislation makes it more difficult to use expired funds to pay additional costs.
Page 2 GAO/NSLAD-92-218 Ship ConstructSon Contracts

B-228619
Shipbuilding Costs Increasing
We compared the July 199 1 cost growth on the Navy’s fixed-price incentive ship construction contracts to what we reported in 1990 and found that it had increased by several measures. Target costs and target profits increased from the 1989 levels discussed in our 1990 report to the July 1991 levels, and as a result, target prices also increased. While the 1989 current target costs were about $0.8 billion, or 3.5 percent, higher than the initial target costs, by 199 1 they were about $1.1 billion, or 4.4 percent, higher. The Navy is liable for these increases. Projected over-target costs also increased. In 1989, the aggregate completion estimates exceeded the aggregate current target costs by about $3.6 billion, a 14. l-percent increase. By 1991, the projected over-target increase totaled $4.4 billion, 17.2 percent higher than the current target costs. The Navy’s share and the shipyards’ share of the projected over-target costs grew from about $1.4 billion and $2.1 billion, respectively, in 1989 to about $2 billion and $2.4 billion, respectively, in 199 1. Additional details on the cost growth in 1991 are included in appendix II. Trend data are discussed in appendix III.
Budgeting for Ship Acquisition
Because of increased costs, the Navy has had to provide substantially more funds to the shipbuilding programs than were originally appropriated. Generally, the programs funded in fiscal year 1987 and earlier received more appropriations than have been needed to date and thus have served as a source of funds for other ship construction programs experiencing cost growth. Programs begun since fiscal year 1988 originally received less appropriations than have been needed and have required additional funding. The fiscal year 1992 Defense Appropriations Act redressed shipbuilding funding shortfalls by providing $463.6 million in new budget authority for increased inflation on existing contracts and by approving the Navy’s proposal to transfer about $1,496.6 million from existing Navy and Marine Corps programs to shipbuilding programs to cover the remaining cost growth.
As acknowledged by a Navy official in an April 1992 congressional testimony, the Navy will face increasing difficulty in completing its ship construction programs within the appropriated funding levels because costs continue to increase while the number of ships under construction is likely to decline. If fewer ships are built, the total available shipbuilding funds will be reduced, and funds potentially available for transfer to programs experiencing cost growth will be limited. Additional details on budgeting for ship acquisition are provided in appendix IV.
Page 2 GAO/NSIAD-92-218 Ship Construction Contracts
B-228619
Agency Comments and In written comments (see app. VI) on a draft of this report, the Department
Our Evaluation of Defense agreed with the report’s findings and conclusions. However, the Department said that recent changes in its budgeting practices-budgeting to most likely cost-should minimize the future need for funding increases.
It is true that larger initial appropriations could lessen the future need for additional funding for contract cost growth and that the additional funding required has declined from the fiscal year 1989 program to that required for the 1991 program. We have not reviewed the changes the Department told us it had made. However, we believe that, because of the long term of shipbuilding contracts, it will require several years to determine if any such change is successful in reducing the need for additional funds.
Our objectives, scope, and methodology are provided in appendix V.
We are sending copies of this report to the Chairmen, Senate Committees on Governmental Affairs and on Appropriations, House Committees on Government Operations and on Appropriations, and Senate and House Committees on Armed Services; the Director, Office of Management and Budget; and the Secretaries of Defense and the Navy. Copies will also be made available to others on request.
Please contact me at (202) 275-6504 if you or your staff have any questions concerning this report. Major contributors to this report are listed in appendix VII.
Sincerely yours,
Martin M Ferber Director, Navy Issues
Page 4 GAO/NSIAD-92-218 Ship Construction Contracts

Page 6
!“. ,( :
GAO/NSIAD-92-218 Ship Construction ContracW

Contents
Letter
Appendix I Contracts and Total ship cost
Fixed-Price Incentive Contracts Other Fixed-Price Contracts Total Ship Cost
8 8 9
10
Appendix II 11 Projected Cost Growth Cost Growth on FPI Contracts 11
in 1991 Other Contracts 13 Adjustments and Claims 13
Appendix III Shipbuilding Cost Growth Is Increasing
Total Cost Growth Trends IndividuaI Contract Trends Contracts Nearing Completion
Appendix IV Budgeting for Ship Acquisition
Funding Changes FiscaI Year 1992 Budget Actions Escalation on Shipbuilding Contracts
20 20 23 24
Appendix V Objectives, Scope, and Methodology
Appendix VI Comments From the Department of Defense
26
b 28
Appendix VII Major Contributors to This Report
29
Page 6 GAO/NSIAD-92-218 Ship Construction Contracts

Content.0
Related GAO Products 32
Tables Table II. 1: Cost Growth on F’PI ship Construction Contracts Table 11.2: Cost Growth on F’F’P and F’P-E Ship Construction
Contracts
12 13
Table III. 1: Cost Comparisons (F’PI Contracts) Table III.2: FPI Contracts Whose Completion Estimates Did
Not Exceed the Ceiling Price
16 17
Figures
Table IV. 1: Selected Ship Construction Funding Changes
Figure I. 1: Basic Construction as a Percentage of the Total ship cost
Figure II. 1: U.&S. SUPPLY Under Construction Figure III. 1: Projected Over-Target Increases of F‘PI Contracts
22
10
14 18
Abbreviations
DOD Department of Defense FTP Firm fixed-price IT-E Fixed-price with escalation FPI Fixed-price incentive
Page 7 GAO/NSLAD-92-218 Ship Conrrtruction Contracte

Appendix I
Contracts and Total Ship Cost
The Navy uses three types of fured-price contracts for ship construction: fuced-price incentive (FPI), fixed-price with escalation (FP-E), and firm fmed-price (FW) contracts. The contracts vary primarily in the degree to which the Navy and the shipyards share the financial risks associated with the contracts’ completion. Risks are shared on WI contracts but are borne entirely by the shipyards on FFP contracts. The risks to the shipyards are somewhat less on FP-E contracts than on FW contracts. The costs incurred by the Navy through these contracts are for the ships’ basic construction-fabricating the hull and installing government-furnished equipment-and are, therefore, only a portion of the total cost of the ships.
F’ixed-Price Incentive Contracts
Most Navy ships are built under F+PI contracts. About 90 percent of the total construction cost of the ships under construction at the time of our review could be accounted for in FPI contracts. The types of ships ranged from aircraft carriers and guided missile destroyers to ocean surveillance ships and mine hunters. According to a procurement regulation, FTI contracts are appropriate when the technical or cost uncertainties involved in a ship’s construction limit the contractor’s ability to reasonably estimate the cost of completing the contract.
An FW contract establishes a target cost, a target profit, a ceiling price, and a share formula, which determine the cost to the Navy and the profit earned by the shipyard. In the contract, the Navy and the shipyard agree to a target cost-a negotiated estimate of the ship’s actual cost-and a target profit-the profit the shipyard should earn if the contract is completed at the target cost. The contract’s target price is the sum of the target cost and the target profit. The target cost, target profit, and target price can be adjusted as work progresses on the contract. If adjusted, they are referred to as the current target cost, current target profit, and current target price. According to a Navy official, the Navy is responsible for the increased costs when target costs and target profits are increased.
6
The ceiling price is the maximum amount the Navy will pay on a contract. It is generally 120 to 135 percent of the target cost and is adjusted to reflect target cost changes. AI1 costs above the ceiling price are borne by the shipyard.
A key feature of an FPI contract is that the Navy and the shipyard, based on a formula negotiated as part of the contract, share any increased costs above the target cost up to the’ceiling price. Generally, the Navy and the shipyard share these increases equally.
Page 8 GAO/NSIALb92-218 Ship Construction Contracts

Appendix I Contra&# and Total Ship Cost
The Navy’s actual cost and the shipyard’s actual profit, which depends on how well the shipyard meets the target cost, are determined after all work is completed on the contract. During the course of the contract, the Navy periodically develops an estimated completion cost for the contract (estimate at completion, or MC) based on contractor-provided and Navy-developed information. These estimates are used to measure contract performance and are the basis of our discussion on cost growth.
The following contract illustrates cost sharing on a current FYI contract. The original target price was $225.4 million (the target cost of $193.8 million plus the target profit of $3 1.6 million). Because of agreed-upon contract changes, the target price increased to $244.8 million, which included a target cost of $2 10.5 million and a target profit of $34.3 million. The Navy is responsible for the $19.4 million increase-$16.7 million for the target cost and $2.7 million for the target profit.
However, the July 1991 estimated cost to complete the contract was $22 1.7 million, an $11.2 million increase over the current target cost, which the Navy and contractor will share equally. The Navy and the contractor will share any additional cost increases up to the ceiling price of $263.1 million. At that point the contractor will absorb any additional costs.
Other Fixed-price Contracts
The Navy also contracts for some ships using either FIT or FP-E contracts. W ith a few exceptions, such as contract changes, an FFP contract generally contains no provision for adjusting the price of the original work, regardless of a shipyard’s actual cost after the contract is awarded. Its use is appropriate when both the Navy and the shipyard agree that the ship’s design is definite and the costs can be reasonably estimated. Coastal survey ships and dock-landing ships are examples of vessels currently being built a under FFP contracts.
An Fp-E contract contains provisions for adjusting payments to a shipyard because of some cost changes beyond the shipyard’s control, and it therefore represents less risk to the shipyard than an m contract. Wo classes of oilers are currently being constructed under FP-E contracts.
Page 9 GAO/NSIAD-92.218 Ship Construction Contracts

Appendix I Contracta and Total Ship Cost
Total Ship Cost The costs Incurred by the Navy through its contracts with the shipyards are for the ships’ basic construction and are only a portion of the total cost of those ships. Funds budgeted for basic construction provide for shipyard contract costs of (1) labor to construct the ships, (2) material obtained by the shipyards for the ships’ construction, (3) shipboard installation of government-furnished equipment such as guns, (4) allowable shipyard overhead costs, and (5) the shipyards’ profit. Overall, basic construction accounted for about 47 percent of the total budgeted estimated cost of $76.1 billion for the ships under construction in July 199 1.
Additional costs may be incurred, for example, to (1) purchase electronics systems, weapon systems, and other government-furnished equipment installed on the ships; (2) conduct tests and provide various services related to the ships’ construction; and (3) reimburse the shipyards for subsequent changes made in the ship designs.
The cost of basic construction varies significantly depending on the type of ship and its complexity. Figure I.1 illustrates the variation in the cost of basic construction for three types of vessels-fleet oilers (TAO), amphibious assault ships (LHD), and guided missile destroyers (DDG-51).
Figure 1.1: Bask Constructton as a Percentage of the Total Shlp Cost 100 Porcont of total ohlp rtlmrto
60
30 I
70
60
SO
40
30
20
10
0
Page 10 GAO/NSIAD-92-218 Ship Construction Contra&a

Appendix II
Projected Cost Growth in 1991
We reviewed data on the Navy’s 54 ship construction contracts that were open in July 199 1 and found that the potential total cost for completing the contracts was about $6.4 billion higher than their initial costs. Target cost increases on the F’PI contracts accounted for about $1.1 billion of the total cost growth. Projected over-target increases accounted for an additional $4.4 billion. Costs have also increased for the FFP and F’P-E contracts. The 1991-reported current prices of those contracts are about $209.7 million over the contracts’ initial prices. The Navy has also agreed to settle contract acijustments and claims for about $309.8 million and is potentially liable for an additional $349.7 million for pending adjustments and claims.
The Navy is potentially liable for about $4 billion of the increased costs-the increased target costs, about $2 billion of the projected over-target increases, the cost increases on the FFP and FP-E contracts, and the costs for the contract adjustments and claims. The shipyards are potentially liable for $2.4 billion of the projected over-target increases.
Cost Growth on F’PI Contracts
We reviewed data from the Navy’s 199 1 Ship Cost Adjustment Review’ for the 45 open FPI construction contracts for 135 ships. The current target costs reported in that review-about $25.9 billion-were about $1.1 billion higher than the contracts’ initial target costs, as shown in table II. 1 .2
‘The resultv of the 1991 review were presented to the Senate and House Appropriations Committees in July 1991.
‘In addition to the target cost increase, profits increased $172.4 million.
Page 11 GAO/NSIAD-92-218 Ship Construction Contracts
Appendix II Projected Cart Growth In 1991
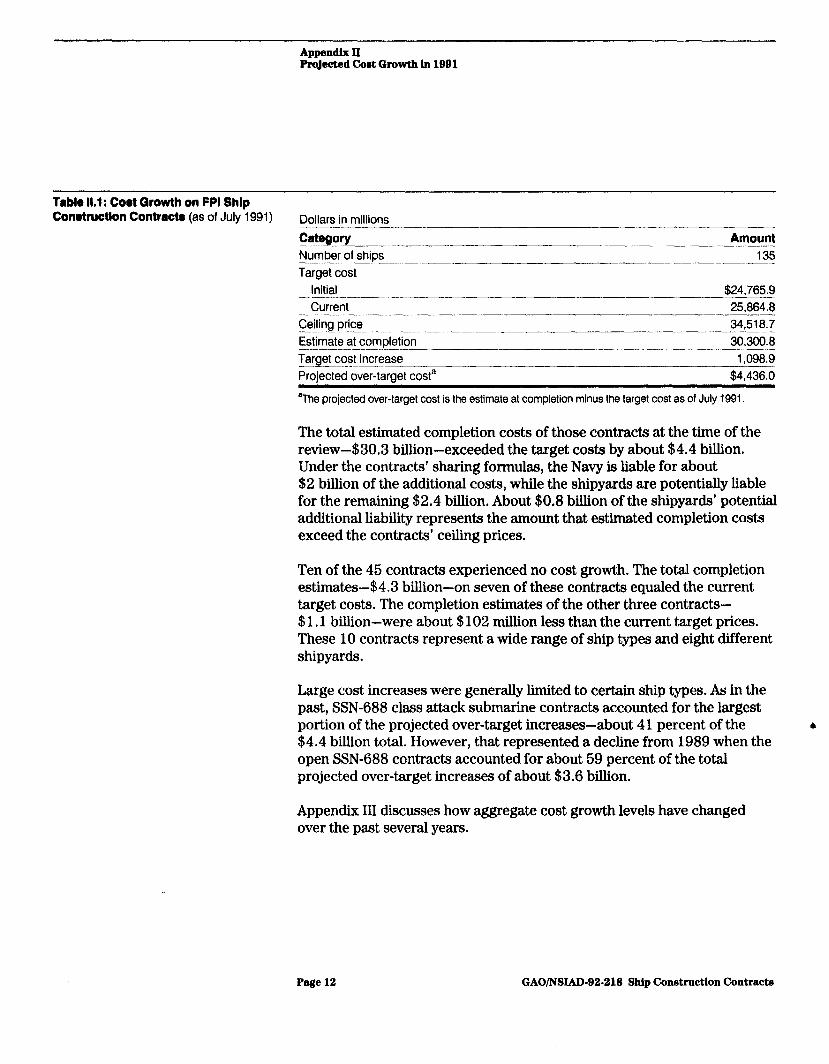
Table 11.1: Coat Qrowth on FPI Shlp Conlrtructlon Contract8 (as of July 1991) Dollars in millions
Category __-.- .._____ - __--_ .__--__.-.- Number of ships -._-~~ ..___--. Target cost
initial
Amount 135 -__
$24.765.9 Current
Ceiling price -.- -... ----.-.-.-..-~---.--. Estimate at completion --- ..-_ - . . . -~--.- -.-. Target cost increase Proiected over-target cost’
25,864.8 34,516.7 - - 30,300.8 -__--
1,098.9 - $4,436.0
‘The projected over-target cost is the estimate at completion mlnus the target cost as of July 1991.
The total estimated completion costs of those contracts at the time of the review-$30.3 bill ion-exceeded the target costs by about $4.4 billion. Under the contracts’ sharing formulas, the Navy is liable for about $2 billion of the additional costs, while the shipyards are potentially liable for the remaining $2.4 billion. About $0.8 billion of the shipyards’ potential additional liability represents the amount that estimated completion costs exceed the contracts’ ceiling prices.
Ten of the 45 contracts experienced no cost growth. The total completion estimates-$4.3 billion-on seven of these contracts equaled the current target costs. The completion estimates of the other three contracts- $1.1 billion-were about $102 million less than the current target prices. These 10 contracts represent a wide range of ship types and eight different shipyards.
Large cost increases were generally limited to certain ship types. As in the past, SSN-688 class attack submarine contracts accounted for the largest portion of the projected over-target increases-about 4 1 percent of the b $4.4 billion total. However, that represented a decline from 1989 when the open SSN-688 contracts accounted for about 59 percent of the total projected over-target increases of about $3.6 billion.
Appendix III discusses how aggregate cost growth levels have changed over the past several years.
Page 12 GAO/NSIAD-92-218 Ship Construction Contracts

bppendlx II ProJected Coot Growth in 1991
Other Contracts At the time of our review seven FFP and two W-E contracts were open. Table II.2 reflects the price increases on those contracts. The combined increases total about $209.7 million.
Table 11.2: Coat Qrowth on FFP and FP-E Ship Conrtructlon Contra- (as of May Dollars in millions 1991) -
Number of Price Price change Contract type shlpo lnltlal Current Amount Percent FFP 18 $1,458.1 $1,663.4 $205.3 14.1 FP-E 12 830.0 834.4 4.4 0.5
A dil Mm~nt.c SW ~WHL..“I.l.w - i5laims
td If a shipyard incurs additional costs, it can request that the Navy adjust the contract to recognize those costs. If the Navy agrees to an adjustment, it is liable for the additional costs. If the Navy does not agree to the request, the shipyard may file a claim against the Navy.
Since July 199 1, the Navy has agreed to settle adjustments and claims of about $309.8 million. These settlements represent about 69 percent of the amounts originally submitted. The AOE-6 fast combat support ship (see fig. II. 1) program accounted for about $239 million of the total settlements. As of February 1992, about $349.7 mllhon in additional claims and adjustments were pending resolution.
Page 13 GAO/NSIAD-92.218 Ship Construction Contra.&

Appendix II Projected Coet Growth In 1991
Figure II.1 : U.S.S. SUPPLY Under Constructlon
‘.
Source: National Steel and Shipbuilding Company.
We compared the Navy’s current liability for adjustments and claims to that we reported in our 1990 report on cost growth. At that time the Navy had settled adjustments and claims of about $181.9 million-about 57 percent of the total amount originally submitted. We also reported that adjustments and claims totaling about $367.9 million were pending resolution.
Page 14 GAOMXAD-92-218 Ship Construction Contracts

Appendix III
Shipbuilding Cost Growth Is Increasing
Over the years, the costs of completing the Navy’s FPI ship construction contracts have continued to increase. When we reported on this issue in 1989,’ total target costs had increased by $828.8 million, and the total completion cost estimates exceeded the current total target costs by about $3 billion. When we last reported on cost growth in 1990, target costs had increased by $847.2 million, and the projected over-target costs had increased by about $3.6 billion. Our current analysis, using July 1991 data-the latest available-shows that the projected over-target increase is about $4.4 billion. Both the Navy’s and the shipyards’ share increased. When measured over the life of the FPI shipbuilding contracts, projected over-target costs generally increased early in the contracts’ life and then declined somewhat as the contracts approached completion.
Navy officials cautioned that these observations reflect the numbers and types of ships under construction that were included in each of the reviews and that future shipbuilding programs could differ significantly.
Total Cost Growth Trends
We compared data for the FPI contracts that were open in 199 1 to similar data for the contracts that were open in 198g2 and found that total cost growth was greater in both absolute (dollar value) and relative (as a percentage of target costs and ceiling prices) terms for the contracts reviewed in 1991 than for those reviewed in 1989. Also, four more 199 1 -reviewed contracts had estimated completion costs that exceeded their current target costs than did the 1989~reviewed contracts. (See table III. 1 for a comparison of 1989 and 1991 costs on F’PI contracts.)
Because work was completed on some contracts, options for additional ships were exercised on other contracts, and work started on new contracts, there were some differences between the ships making up the 1989 data and those making up the 1991 data. However, similar numbers of ships were under construction at both points: 133 in 1989 and 135 in
4
199 1. These ships involved 44 and 45 contracts in 1989 and 1991, respectively. A fuller comparison of ship types and numbers is discussed in appendix V.
‘Navy Contracting: Cost Growth on Shipbuilding Contracts (GAO/NSIAD-89-189, Aug. 4,1989).
‘Our 1990 report discussed the 1989 information.
Page 15 GAO/NSIAD-92-218 Ship Construction Contracb
Appendix III ShipbuildIng Cod Growth Ir Increadng
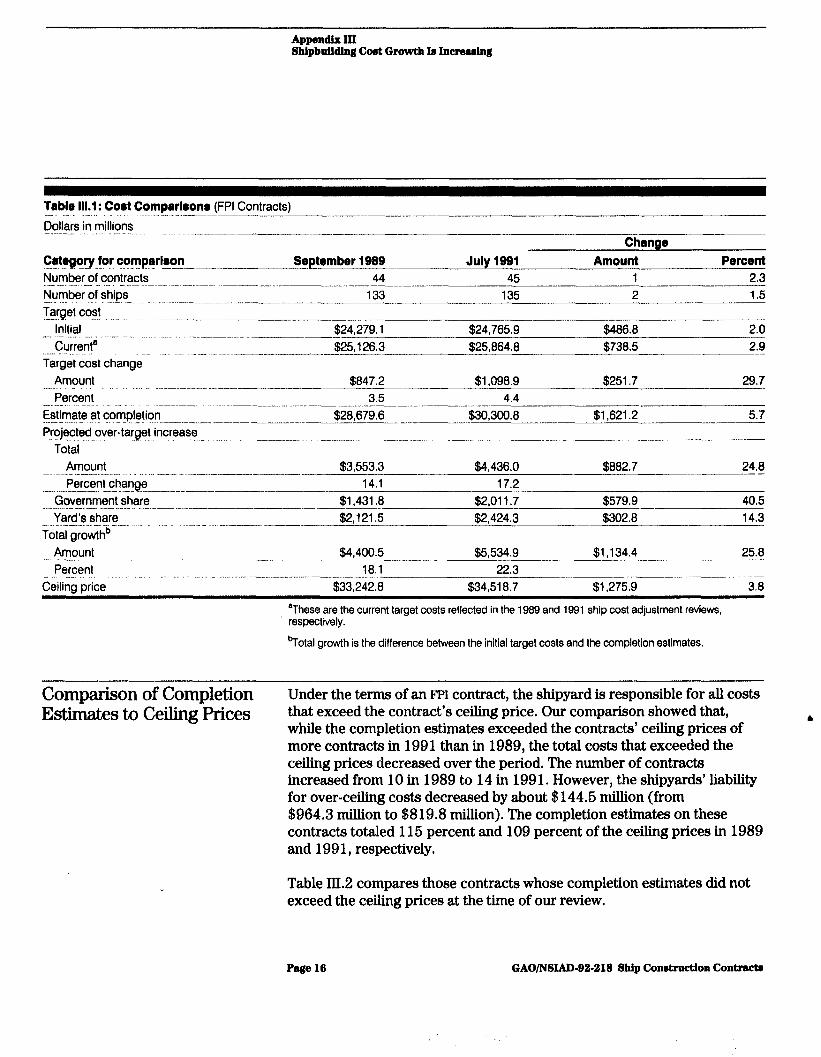
Table 111.1: Coet Comparloona (FPI Contracts) -__-- Dollars in millions _._ . ..__. ._...-. ._.-_ - ..- ~--
Change Category for comparlron September 1999 July 1991 Amount Percent - _ Number of contracts 44 45 1 2.3 _.__ ._.. .._ I -. . .._ ..~._ ~_.._ __.__. Number of ships 133 135 2 1.5 .-._ _. .._. -__. __ -_ -..-... Target cost -._-___- --
Initial $486.8 2.0 -_ ..-^ .- _-__. ..-.. --. ._-_-~ .__. $24,279.1 __- $24,765.9 Currenta $25 126.3 $25,864.8 $738.5 2.9 ..-.. ..__.......^ ~_ ._.... -.-.__ _._-___ __._______-_____ I
Target cost change Amount $847.2 $1,098.9 $251.7 29.7 -... ..~_~-~_- ._... --- Percent 3.5 4.4 --
Estimate at completion $28,679.6 $30,300.8 $1,621.2 5.7 _._.-- .._.” _.... .-- .__ .._... --..- -.-___ -_ Projected over-target increase -..-- . _ .._. .._ ._.... .-.. ._ -..-..---------.--_________
Total Amount $3,553.3 $4,436.0 $882.7 24.8 . . . . ..__ .--..-...- ..^ ---_ -..-_- -...___ --.-_- ---- Percent change 14.1 17.2 --..- ___---. -..-..-. --- _--- ~- -- ___-.
Government share $=8 $2,011.7 $579.9 40.5 --. ._ -I .._. ..__.... ____. .~ ..-- .--_-.--__-- .--___ - Yard’s share $2,121.5 $2,424.3 $302.8 14.3 - _._..-___ -..-_-.-.--... ..-..-.
Total growthb Amount f§4,406.5 $5,534.9 $1,134.4 25.8 . ..-... ~-.-- Percent 18.1 22.3 .., ..- _._ _ .._. -. _ ._ _ .^.. --_- ___
Ceilina or/c8 $33,242.8 $34,518.7 $1,275.9 3.8
‘These are the current target costs reflected in the 1989 and 1991 ship cost adjustment reviews, respectively.
?otal growth is the difference between the initial target costs and the completion estimates.
Comparison of Completion Under the terms of an F’PI contract, the shipyard is responsible for alI costs Estimates to Ceiling Prices that exceed the contract’s ceiling price. Our comparison showed that,
while the completion estimates exceeded the contracts’ ceiling prices of more contracts in 1991 than in 1989, the total costs that exceeded the ceiling prices decreased over the period. The number of contracts increased from 10 in 1989 to 14 in 199 1. However, the shipyards’ liability for over-ceiling costs decreased by about $144.5 miliion (from $964.3 miIIion to $819.8 million). The completion estimates on these contracts totaled 115 percent and 109 percent of the ceiling prices in 1989 and 199 1, respectively.
Table III.2 compares those contracts whose completion estimates did not exceed the ceiling prices at the time of our review.
Page 16 GAO/NSIAD-92-218 Ship Construction Contra&
Appendix III Shipbuilding Coot Growth b In-lug
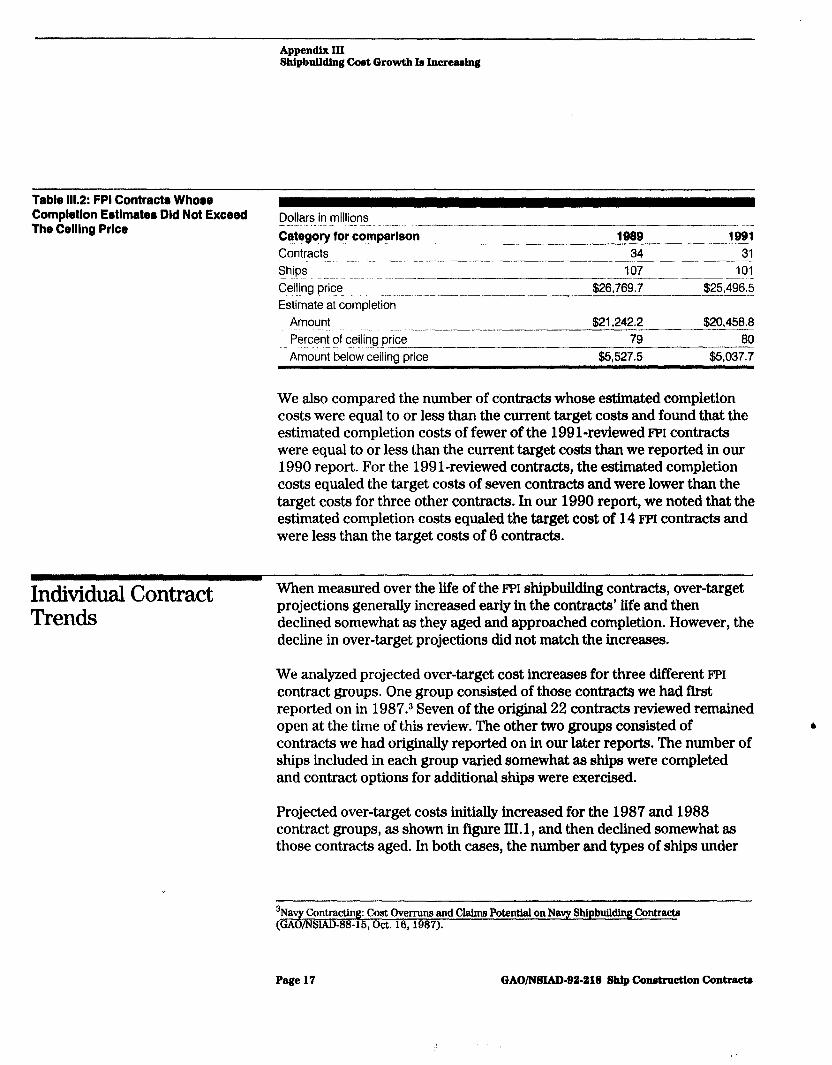
Table 111.2: FPI Contracta Whose Completion EstImatea Dld Not Exceed The Celling Price
Dollars in millions .-._--~ . . -. -_. _._ ..__ -_-_I___ Category for comparison _ _.. ..- ..- ~_. ..._~~ Contracts Ships Ceiling price Estimate at completion
Amount ~.. .~~. ~- . .._ ._._____ Percent of ceiling price Amount below ceiling price
19is 1991 -__ 34 31 __--____--_-._
107 101 $26,769.7 ~-...l!%L49s:~
$20,45&E $21,242.7 79 80
$5,527.5 $5,037.7
We also compared the number of contracts whose estimated completion costs were equal to or less than the current target costs and found that the estimated completion costs of fewer of the 1991-reviewed FPI contracts were equal to or less than the current target costs than we reported in our 1990 report. For the 199 1 -reviewed contracts, the estimated completion costs equaled the target costs of seven contracts and were lower than the target costs for three other contracts. In our 1990 report, we noted that the estimated completion costs equaled the target cost of 14 FPI contracts and were less than the target costs of 6 contracts.
Individual Contract Trends
When measured over the life of the FPI shipbuilding contracts, over-target projections generally increased early in the contracts’ iife and then declined somewhat as they aged and approached completion. However, the decline in over-target projections did not match the increases.
We analyzed projected over-target cost increases for three different FPI contract groups. One group consisted of those contracts we had first reported on in 1987.3 Seven of the original 22 contracts reviewed remained open at the time of this review. The other two groups consisted of contracts we had originaiIy reported on in our later reports. The number of ships included in each group varied somewhat as ships were completed and contract options for additional ships were exercised.
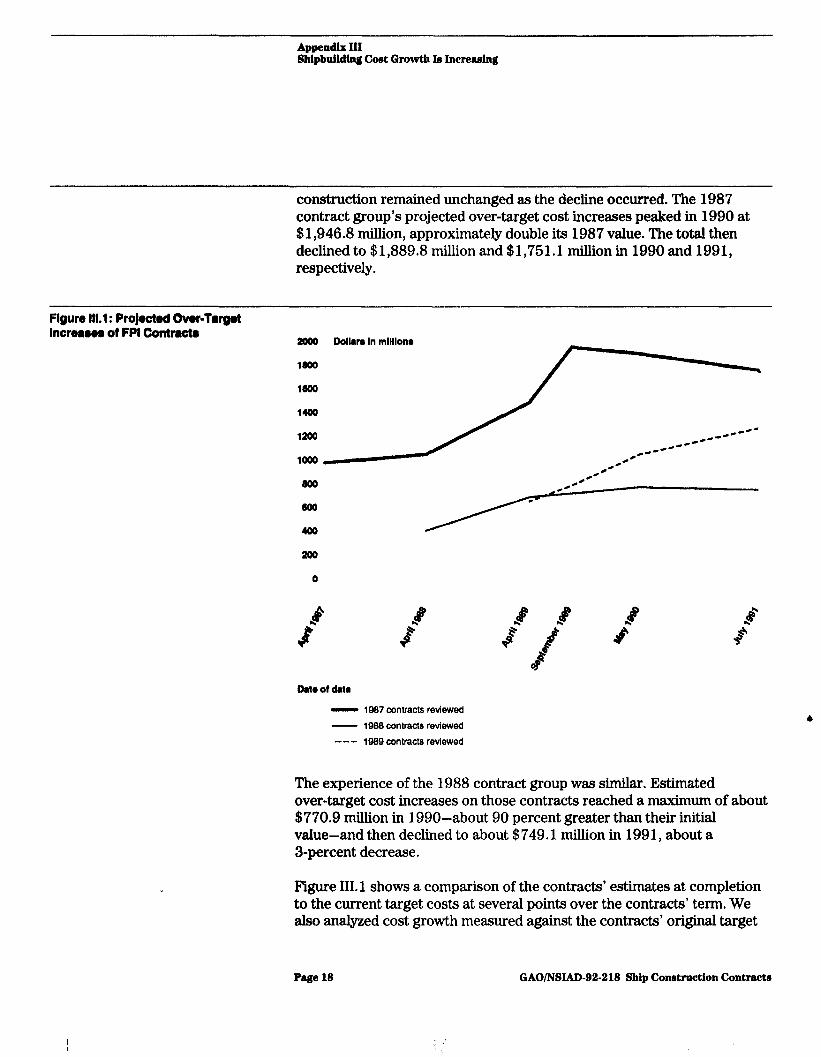
Projected over-target costs initially increased for the 1987 and 1988 contract groups, as shown in figure III. 1, and then declined somewhat as those contracts aged. In both cases, the number and types of ships under
3Navy Contracting: Cost Overruns and Claima Potential on Navy ShIpbuilding Contracts (GAO/NSIADdB-16, Oct. 16, 1987).
Page 17 GAOINSIAD-92-218 Ship Conetructlon Contracta
Appendix III Shipbuilding Cost Growth Ia Incmudng
construction remained unchanged as the decline occurred. The 1987 contract group’s projected over-target cost increases peaked in 1990 at $1,946.8 milhon, approximately double its 1987 value. The total then declined to $1,889.8 million and $1,751.1 million in 1990 and 1991, respectively.
Figure III.1 : ProJoctod Over-Twgot Increaum of FPI Contracta
#)o Dollrr~ In mlll lonr
1000
1600
1400
1200
loo0
m
600
400
200
0
Oala of data
- 1987 contracts reviewed
- 1988 contracts reviewed
--- IQ88 contract8 reviewed
The experience of the 1988 contract group was similar. Estimated over-target cost increases on those contracts reached a maximum of about $770.9 million in 1990-about 90 percent greater than their initial value-and then declined to about $749.1 mihion in 199 1, about a 3-percent decrease.
F’igure III. 1 shows a comparison of the contracts’ estimates at completion to the current target costs at several points over the contracts’ term. We also analyzed cost growth measured against the contracts’ original target
Page 16 GAOINSIAD-92-218 Ship Construction Contract6
. . ’
Appendix III ShipbuildIng Cost Growth Is Increasing
costs. Using this measure, the cost growth level for the 1987 contract group also declined from a peak of about $2,277.6 million in 1990 to about $2,220.1 million in 1991.
Projected over-target costs increased for the 1989 contract group. Prom an initial level of about $658.2 million noted in our 1989 report, these costs increased approximately 90 percent to about $1,259.5 million in 199 1. Over-target cost projections have not declined for this group. However, fewer years of data have been accumulated for this group than for the other two groups, and the ships have not reached the point where the other groups first exhibited the decline in cost growth.
Contracts Nearing Completion
We analyzed data on 14 FPI contracts for which all ships had been delivered or were 90 percent or more complete as of 1991 and found that the completion cost estimates averaged 84 percent of the ceiling prices. Both ceiling prices and target costs on the contracts increased an average of 9 percent from the initial contract award values to those reported when the contracts were over 90 percent complete. The group included contracts awarded between fiscal years 1981 and 1987.
The target costs and ceiling prices for 10 of the contracts were less than 10 percent above the original target costs and ceiling prices. The completion cost estimates for three of the contracts exceeded the current ceiling prices. The largest single target cost increase was about 35 percent, and the largest single ceiling price increase was about 47 percent.
Page 19 GAOMXAD-92-218 Ship Construction Contra&

Appendix IV
Budgeting for Ship Acquisition
While its ship construction programs were adequately funded at the beginning of fiscal year 1992, the Navy may not be able to complete the programs within current funding levels because of continuing cost growth and the prospect of fewer future ship construction programs. The total estimated costs of the more recent ship construction programs’ (fiscal year 1988 and later) have exceeded the amount that was originally appropriated for them. Moreover, costs for the ships’ basic constructior?-fabricating the hull and installing government-furnished equipment-are substantially higher than the original appropriations for all the years we reviewed. The Navy, with congressional approval, has in the past addressed funding shortfalls by redistributing funds among ship construction and other programs. To that end, the fiscal year 1992 Defense Appropriations Act transferred $1,496.6 million from existing Navy and Marine Corps programs. In addition, for the first time since fiscal year 1982, Congress provided $463.6 million in new funds to redress shipbuilding funding shortfalls. However, fewer funds may be available in the future for such transfers as the size of the fleet declines and fewer new ships are authorized.
Funding Changes The combined total estimated costs of recent ship construction programs for fiscal years 1988 and later have exceeded the funds originally appropriated. Additionally, the combined estimated costs for the ships’ basic construction have exceeded the funds originally appropriated for all the programs under way in July 199 1.
According to Navy officials, sufficient funds must be appropriated for each ship construction program to cover the anticipated total cost of the program’s ships. If a program’s total cost estimate exceeds its budgeted funds as it progresses, the Navy and the Department of Defense (DOD) must request that Congress provide additional funds. They may request that Congress transfer or reprogram funds that have already been b
appropriated for other Navy or DOD programs to the affected ship construction program. The Navy has used this process extensively over the past several years to make up funding shortfalls in many individual ship construction programs. The Navy may also request that Congress provide
‘A ship construction program includes those ships of a specific class for which construction is authorlzed and funds are appropriated in a specific year. For example, the flve guided missile destroyers for which funds were appropriated in fiscal year 1990 constitute one program.
‘Our discussion of contract cost growth in appendixes II and III addresses this category.
Page 20 GAO/NSIAD-92-218 Ship Construction Contrects
Appendix lV Budgeting for Ship Acqubitlon
additional funds. However, fiscal year 1992 was the first time the Navy had to do so since fiscal year 1982.
Funds originally appropriated for existing ship construction programs can also be reduced for a variety of reasons. Funds may be transferred because actual costs were lower than budgeted for that program. In other instances, funds may be transferred because the program is considered to be a lower priority than another program needing additional funds. Additionally, ship construction funding levels have been reduced in the past in response to budget actions such as Gramm-Rudman-Holl ings deficit reductions or other budget reductions.
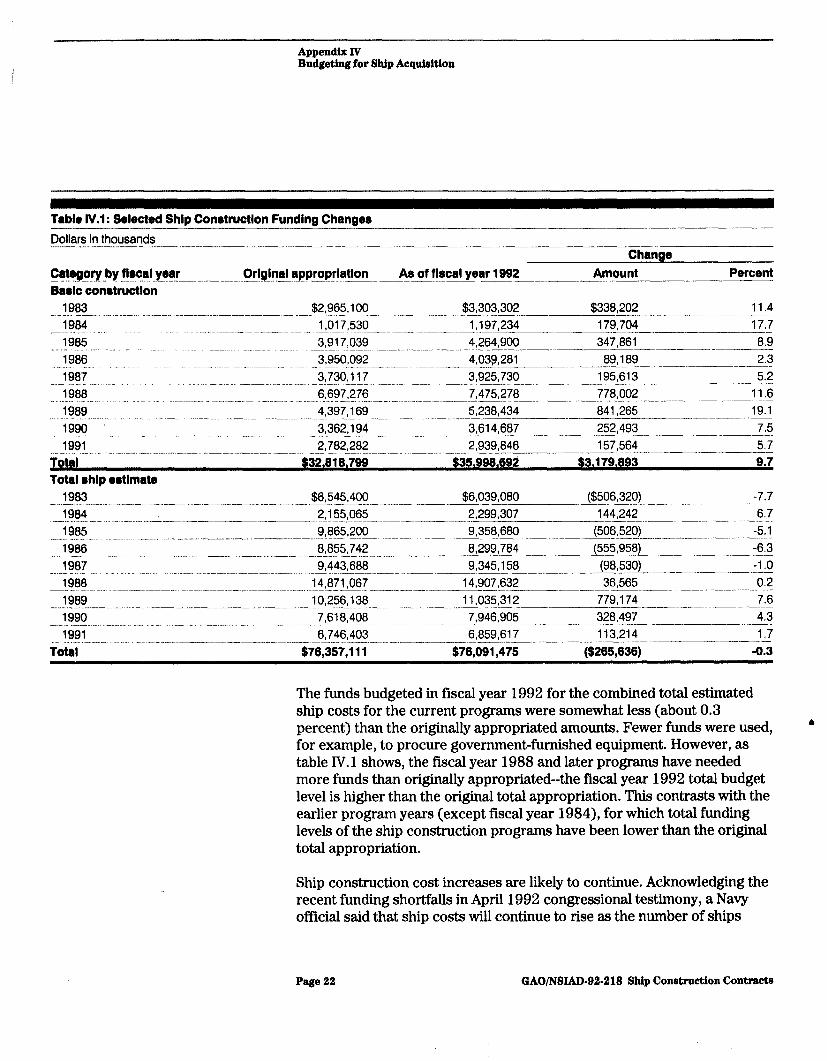
We compared the original appropriation levels for total estimated ship costs and basic ship construction costs to the levels supporting the fiscal year 1992 budget submission of the ship construction programs3 that were ongoing in July 199 1. As table IV. 1 shows, additional funds have been required for basic construction in each of the years-the fiscal year 1992 total budget level is higher than the original total appropriation for each fiscal year program. The total increase over 9 years among the programs is about 10 percent.
3These are ships under construction whose funds were appropriated in fiscal years 1983 through 199 1.
Page 2 1 GAO/NSIAD-92-218 Ship Construction Contracts
Appendix Iv Budgeting for Ship Acquieltion
Table IV.l: Selected Shlp Conrtructlon Funding Changes ---___-_---.___- --_--- Dollarsinthousands __- _...___ --..-..-----.- -.__ --. ~-_____~~~--__
Change Category by flrcal year Aa of fiscal year 1992 Amount Percent _-._-_ _.- Orlglnal approprlatlon _.-. - _.__--_-__--- .__. ~.. .-__ --..-__--__ -..___. -___ Baolc conrtructlon
1963 $2 965,100 _l__.l _.-- .._." _._-... .~ __....._ --- ._._ -.--~----.-.--~-L. $3,303,302 11.4 .-__-.. $338,202 ~-.- 1984 1,017,530 1,197,234 179,704 17.7 _- .._.. _. . -..-.-.^~_-.-.--- -- -- . -...~-.~- ..-. --_-...-~-.. .-. __-- 1965 3,917,039 4,264,900 347,861 8.9 -___ -- __.. .._..__ - ..--- -.---..-.-._ .---... _. ..--_-...---~_-. 19136 3950092 ..- _..... __. _ -.. .-. .- ~~._.... ~. _~ L.. 4038,281 89,189 ! .___ -- .._.. ~_~~- ~~..._________~ ____ ----..--~.I_---- 2.3 1987 3,730,117 3,925,730 195,613 5.2 1988 6,697,276 7475278 776002 11.6 _.. .._ .._.. -. L ---.L-. - --- _____ '989 . . . . ..___.._ --- _....__ - ..__. -- _.._____ ..#!E!!!.16_9_- ._..._ ~~..___. ..___. !t~~--.--.~-~~L- 841 265 19.1 _ _- _- .._._ ---_______-- 1990 3,362,194 252,493 7.5 __.... __ -...-- ._ _ -...-__ -.- ---.--...-_-_ __--.-_----- 3,614,687 - ._... ---...--..--- ---- --__ -..-~ 1991 2,782282 _.__, .__.._. . _.-..-__- _... - ._ -_--__-____-_---.-._.- ~___ --. L_. -...-_.-__-___. 2,939&'6 ___. 157,!64_--_~----- 5.7
TOMI $32.818.799 $35.998.592 $3,179,893 9.7 Total rhlp ootlmate
1983 $6,545,400 $6,039,080 ($506,320) -7.7 _-.- ̂ ._._.._.. - ..__ .--.-_ ___--._ -__.- ____- .____ - .._-_ --.--_._-- . .._~_~_.. __.... ~-.-.--___ .-- --.-.__ ___-_..--_-.__----~ . ..-- 1984 2,155,065 144242 ._.~ ..-..._" . ._ ._.-.. . . -..- -_-----_---.--- -. ~~-.._--------- 2,299,307 -----. ---__I_--. 6.7 1985 9 865,200 --.. ._-- _. _. __-..-... . .._.._. .^.__ _^.-.-_-.-- _.-_ ----.----.! ..~ 9,358,680 (506,520) -5.1 ____. _-.----.- ..--_.. --- 1986 8855742 8299784 (555,958) -6.3 --._- .-.. --~ . . . ~.~~. -. _--.--~ ~~-.-----~ -.-1.-- _'.-..-.--..- _..-. --.-- .-.. .'---'- ____. 1987 9,443,688 -1.0 i____..." I... _ _. . ..__-...--- . ..-. 9!3451~~~~-_(~,5301_-_--~~-~-
--3E 36,565 0.2 -~ . . -.--.-.-..-~ .-.... --.~-_----._.--- _... -.- _-.... 14~871,06'7 -- .--- - .-.----- 14,907,632_-- _______ 1989 10,256,138 11035,312 779,174 7.6 " -_.... -_--- -- .._ ._ ----. L------- ~-
_... -1990 _......____......._..._ 328497 4.3 _.- .._. .__--.-----...-___--_2,618,4_08 .-...-.- ~~.~/!Y!~go5 ---.I 1991 6,746,403 6,859,617 113,214 1.7 -__ --.__--
Total $78,357,111 $78,091,475 ($285,835) -0.3
The funds budgeted in fiscal year 1992 for the combined total estimated ship costs for the current programs were somewhat less (about 0.3 percent) than the originally appropriated amounts. Fewer funds were used, for example, to procure government-furnished equipment. However, as table IV. 1 shows, the fiscal year 1988 and later programs have needed more funds than originally appropriated--the fiscal year 1992 total budget level is higher than the original total appropriation. This contrasts with the earlier program years (except fiscal year 1984), for which total funding levels of the ship construction programs have been lower than the original total appropriation.
Ship construction cost increases are likely to continue. Acknowledging the recent funding shortfalls in April 1992 congressional testimony, a Navy official said that ship costs will continue to rise as the number of ships
Page 22 GAO/NSIAD-92-218 Ship Conetruction Contra&m

Appendix N Budgeting for Ship Acquisition
under construction decreases in the future and that the Navy’s flexibility to accommodate those cost increases has been eliminated.
Fiscal Year 1992 Budget Actions
While shipbuilding funding shortfalls have been redressed through transfers among programs in the past, the Navy requested new funding authority as well as funding transfers for fiscal year 1992 to redress the current shortfalls. The fiscal year 1992 Defense Appropriations Act transferred $1,496.6 million from other Defense programs and provided $463.6 million in new budget authority for that purpose.
Origin of Shortfall In the 1990 annual review of ship acquisition programs, the Navy identified a total shortfall of $1,22 1.7 million in its shipbuilding accounts. It noted that higher than projected inflation, cost growth on the contracts, and congressionally imposed reductions contributed to the shortfall. According to Navy officials, the Navy initially planned to request new funding authority for the entire $1.2 billion in its fiscal year 1992 budget submission. However, Navy officials told us that the Department of Defense believed it was inappropriate to request new funding authority for over-target cost growth since that growth was not totally due to factors beyond the Navy’s control. Nonetheless, DOD believed that it was appropriate to request new funding for the portion of the shortfall caused by higher than expected inflation rates as this factor is beyond the Navy’s and the shipyards’ control. As a result, the Navy requested $524.9 million in new funding for its ongoing shipbuilding programs in its fiscal year 1992 budget submission.
The Navy also requested that a total of $696.8 million be transferred among various shipbuilding programs or into the shipbuilding programs from other procurement programs. Shipbuilding accounts provided the majority of the funds ($585.1 million, or 84 percent), the bulk of which ($398.2 million) was to be made available by canceling the construction of the fiscal year 199 1 AOE-6 class fast combat support ship.J About 70 percent of the funds in the transfer request ($483.6 million) were to be designated for the SSN-688 attack and ballistic missile submarine programs-$274.6 million and $208.9 mihion, respectively.
4Congress, in the Fiscal Year 1991 Dire Supplemental Appropriation Act, directed that $237 million of these funds be reserved to pay potential claima arising from the construction of three earlier ships of this class.
Page 23 GAO/TUSIAD-92-2lS Ship Conotruction Contracts
Appendix N Budgeting for Ship Acquisition
The F’iscal Year 1992 Appropriations Act
The fiscal year 1992 Defense Appropriations Act provided $463.6 million for escalation on prior-year ship construction programs-$61.3 million less than the Navy originally requested. Navy officials said the escalation funding provided was reduced from the originally requested $524.9 million because some of the originally requested funds could not be used by the time the act was signed. After submitting its budget request, the Navy used other funds to pay the shipyards as escalation payments became due. Since the escalation funds in the budget request were requested and provided with the stipulation that they could be applied only to contract escalation, the full request was not needed. The SSN-688 attack submarine, ballistic missile submarine, and aircraft carrier programs received the bulk of the escalation funds appropriated-$378.2 million, or about 82 percent.
The act also authorized the transfer of $1,496.6 million for other ship construction cost growth, an increase of $797.8 million from the Navy’s original request. The amount transferred was increased because additional funding shortfalls were identified during the 199 1 Ship Cost Adjustment Review. The DDG-51 program received the largest amount-$236.9 million (16 percent)-of the total funds provided through transfers. That program and the SSN-688 attack and ballistic missile submarine programs received a combined total of $668.8 million, about 45 percent of the total funds transferred. Almost 60 percent ($893.5 million) of the funds transferred were made available by cancellation of the A-l 2 attack aircraft program.
Escalation on Shipbuilding Contracts
According to Navy officials, the $524.9 million requested for escalation was specifically to reimburse the shipyards, under provisions negotiated in each contract, for changes in labor and material costs over which the shipyards had little or no control. Because shipbuilding contracts have such long lives-at the time of our review ships were being built under contracts that had been awarded as long ago as fiscal year 1983-it can be 6 difficult to accurately predict future costs when bidding on a contract.
Escalation is a separate element in ship procurement budgets. The amount is determined for each ship using several factors. These include the ship’s delivery schedule, Bureau of Labor Statistics index values of actual inflation for labor and material, current target cost, the funds to be spent over the remaining life of the contract, and guidance from the Office of the Secretary of Defense and the Office of Management and Budget.
A Navy official said that the additional escalation funds were needed because the 1990 inflation indices used to estimate escalation costs were
Page 24 GAO/NSIAD-92-218 Ship Conetruction Contracts
Appendix N Budgeting for Ship Acquisltlon
generally much higher than the 1989 indices. Because the indices were higher, the projected escalation costs for the contracts increased and additional funds were needed to keep the ship construction programs fully funded.
Changes in the other factors also affect the total funds required for escalation. For example, escalation increases if a ship’s delivery is delayed because it accrues for a longer period of time. Increased target costs have a similar effect because escalation is then determined from a larger base. Increased payments to shipyard workers for fringe benefits may also increase escalation payments.
Page 26 GAO/NSIAD-92-218 Ship Construction Contracts

Appendix V
Objectives, Scope, and Methodology
This review is the latest in a series to examine cost growth on the Navy’s open ship construction contracts. Our objectives were to update the status of the cost growth, identify trends in that growth, and review Navy practices for financing additional costs.
To update the status of cost growth and identify any trends in that growth, we interviewed officials and obtained budget, financial, and other documents from Headquarters, Department of the Navy, and Headquarters, Naval Sea Systems Command. We obtained and analyzed data concerning contract cost growth that reflected the results of the Navy’s ship cost adjustment reviews for 1990 and 1991. We also compared this data to data from the 1989 review, which was the basis of our 1990 report.
Because work was completed on some contracts, options for additional ships were exercised on other contracts, and work started on new contracts, there were some differences among the ships making up the 1989 ship cost adjustment data and those making up the 1991 data. The 1989 data encompassed 44 F’PI contracts and 133 ships. The 1991 data encompassed 45 FPI contracts and 135 ships. The most significant changes in the ships considered occurred in attack submarines, cruisers, and guided missile destroyers. The 199 1 data included 2 1 SSN-688 class attack submarines-7 fewer than the 1989 data. Two SSN-21 submarines were in the 199 1 data but were not in the 1989 data. The number of cruisers decreased by 3, to 14. While actual work had started on 12 guided missile destroyers, 17 ships were included in the 1991 data compared to 8 in the 1989 data.
In analyzing funding changes among the ship construction programs, we obtained and analyzed data that showed the programs’ original appropriation levels and the funding levels reflected in the fiscal year 1992 congressional budget submission. This analysis encompassed the same ship construction programs included in the 199 1 ship cost adjustment review.
We analyzed cost growth for three different FPI contract groups to identify any long-term trends. One contract group consisted of the 7 of the original 22 contracts that we had first reported on in 1987 and that remained open at the time of this review. The other two groups consisted of contracts whose growth we had originally reported on in our later reports. We did not include any contracts first included in our latest reports because the data accumulated on those contracts were not sufficient to analyze trends.
Page 26 GAO/NSIAD-92-218 Ship Construction Contracts

Appendix V ObJectlver, Scope, and Methodology
The 7 contracts in the 1987 group included from 19 to 21 ships under construction. The number of ships under construction under the 4 contracts in the 1988 group ranged from 7 to 12. Twenty contracts were included in the 1989 group, with the ships in that group ranging from 62 to 77. Air cushion landing craft comprise about half the ships in this group. The number of ships in each group varied as contract options for additional ships were exercised. Each group included a mix of ship types. The 1989 group was the most diverse. We analyzed cost growth at up to six points for each group. These were, as appropriate, the cost growth reported in our 1987,1988,1989, and 1990 reports and the Navy’s 1990 and 1991 cost reviews.
For our analysis of completed contract costs, we reviewed cost growth data for 14 FPI contracts included in our previous reviews for which all ships were either delivered or were 90 percent or more complete as of the Navy’s 199 1 review. Navy officials said that costs for these contracts usually remain stable. The group included contracts awarded between fiscal years 198 1 through 1987 under which a variety of ships-submarines, aircraft carriers, cruisers, destroyers, oilers, and landing craft-were constructed. We analyzed the data to determine the magnitude of changes to target costs, ceiling prices, and completion estimates over the life of the contracts. We also compared each contract’s last reported completion estimate to its last reported ceiling price.
In conducting our review, we used the same accounting systems, reports, records, and statistics that the Navy uses for ship construction to make decisions, establish program budgets, and monitor contracts. Since the contracts we reviewed were open, the information we obtained does not represent their completed costs but reflects cost data and estimates derived at various points in the contracts’ life. We did not independently determine the data’s reliability.
Our review was performed from February 1991 through February 1992 in accordance with generally accepted government auditing standards.
Page 27 GAO/NSLAD-92-218 Ship Construction Contracts
Appendix VI
Comments From the Department of Defense
ACPUI8ITION
OFFICE OF THE UNDER SECRETARY OF DEFENSE
WASHINGTON, DC 20301-3000
Jul 0 8 1992
Mr. Frank C. Conahan Assistant Comptroller General National Security and International
Affairs Division United States General Accounting Office Washington, DC 20548
Dear Mr. Conahan:
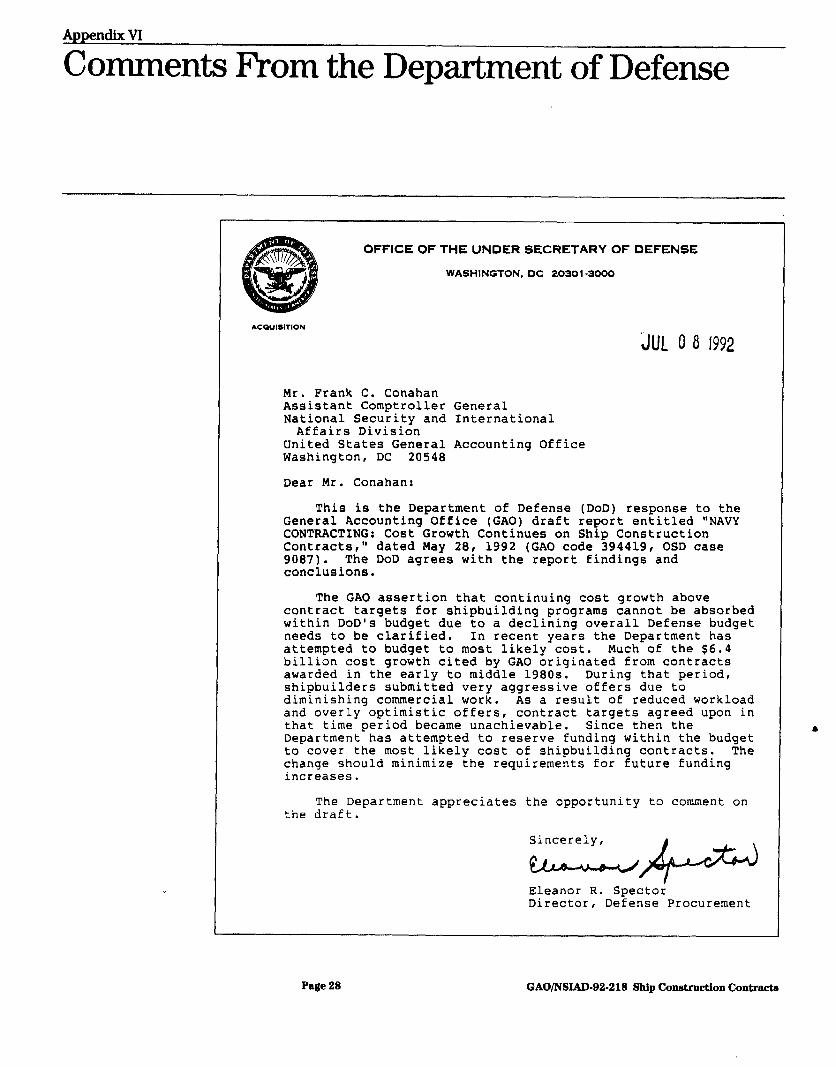
This is the Department of Defense (DOD) response to the General Accounting Office (GAO) draft report entitled "NAVY CONTRACTING: Cost Growth Continues on Ship Construction Contractsrw dated May 28, 1992 (GAO code 394419, OSD case 9087). The DOD agrees with the report findings and conclusions.
The GAO assertion that continuing cost growth above contract targets for shipbuilding programs cannot be absorbed within DOD'S budget due to a declining overall Defense budget needs to be clarified. In recent years the Department has attempted to budget to most likely cost. Much of the $6.4 billion cost growth cited by GAO originated from contracts awarded in the early to middle 1980s. During that period, shipbuilders submitted very aggressive offers due to diminishing commercial work. As a result of reduced workload and overly optimistic offers, contract targets agreed upon in that time period became unachievable. Since then the Department has attempted to reserve funding within the budget to cover the most likely cost of shipbuilding contracts. The change should minimize the requirements for future funding increases.
The Department appreciates the opportunity to comment on the draft.
Sincerely,
Eleanor R. Spector Director, Defense Procurement
Page 28 GAO/TWIAD-92-218 Ship Construction Contracts
4

Appendix VII
Major Contributors to This Report
National Security and International Afhirs Division, Washington, DC.
Norman J. Rabkin, Associate Director Richard J. Herley, Assistant Director Tim F. Stone, Evaluator-in-Charge James B. Do&d, Jr., Evaluator - Edna Thea Falk, Evaluator
4
Page 29 GAO/NSIAD-92-218 Ship Construction Contracta

GAO/NSIAD-92-218 Ship Construction Contracts Page SO

Page 3 1 GAO/NSIAD-92-218 Ship Construction Contracts

Related GAO Products
Navy Contracting: Ship Construction Contracts Could Cost Billions Over Initial Target Costs (GAO/NSIAD-91-18, Oct. 5, 1990).
Navy Shipbuilding: Cost and Schedule Problems on the DDG-51 AEGIS Destroyer Program (GAO/r-NSIAD-99-14, Jan. 24, 1990).
Navy Shipbuilding: Cost and Schedule Problems on the DDG-5 1 AEGIS Destroyer Program (GAO/NSIAD-99-84, Jan. 17, 1990).
Navy Contracting: Status of Cost Growth and Claims on Shipbuilding Contracts (GAO/NW089-189, Aug. 4, 1989).
Navy Ship Construction Contracts (GAO/l’-NSIAD-88-27, Apr. 19, 1988).
Navy Ship Construction Contracts (GAO/r-NSIAD-88-9, Dec. 8, 1987).
Navy Contracting: Cost Overruns and Claims Potential on Navy Shipbuilding Contracts (GAO/NSIAD-88-15, Oct. 16, 1987).
Navy Contracting: Fiscal Year 1986 Contract Award for Construction of SSN-688 Submarines (GAO/N&W-87-120, May 4, 1987).
Navy Ship Construction Contracts (GAO/r-NSIAD-87-30, Apr. 23,1987).
a
(saula) Page 82 GAO/NSIAD-92418 Ship Construction Contracts

~-._~ Ordering Information
The first copy of each GAO report and testimony is free. Additional copies at-r $2 each. Orders should be sent to the following address, accompanied by a check or money order made out to the Superin- tendent. of Documents, when necessary. Orders for 100 or more copies to be mailed to a single address are discounted 25 percent.
I T.S. Gt~nt*ral Accounting Office P.O. hx 6015 (;ait htlrsburg, MD 20877
Ordt~rs may also be placed by calling (202) 2756241.
