nrw annual report 2013
DESCRIPTION
ÂTRANSCRIPT

ANNUALREPORT2
013
Holdings Limited

CORPORATEREGISTRY

DIRECTORS
Dr Ian Burston
Non-Executive Chairman
Julian Pemberton
Managing Director and
Chief Executive Offi cer
Michael Arnett
Non-Executive Director
John Cooper
Non-Executive Director
COMPANY SECRETARY
Kim Hyman
REGISTERED OFFICE
181 Great Eastern Highway
BELMONT WA 6104
Telephone: +61 8 9232 4200
Facsimile: +61 8 9358 5515
Email: [email protected]
AUDITOR
Deloitte Touche Tohmatsu
Level 14 Woodside Plaza
240 St Georges Terrace
PERTH WA 6000
SHARE REGISTRY
Link Market Services Limited
Ground Floor
178 St Georges Terrace
PERTH WA 6000
Telephone: +61 1300 554 474
Facsimile: +61 2 8287 0303
ASX CODE
NWH – NRW Holdings Limited
Fully Paid Ordinary Shares
WEB PAGE
www.nrw.com.au

ANNUAL REPORT
CONTENTS
05 CHAIRMAN’S LETTER
31 CHIEF FINANCIAL OFFICER FINANCIAL YEAR IN REVIEW
07 CHIEF EXECUTIVE OFFICER YEAR IN REVIEW
11 Financial Overview
15 NRW Civil
17 NRW Mining
19 Action Drill & Blast
21 Action Mining Services
23 Human Resources
25 Indigenous Engagement
27 Health, Safety and Environment
29 Company Outlook
35 CORPORATE GOVERNANCE STATEMENT
NRW ANNUAL REPORT 20132 Contents

75 NOTES TO THE FINANCIAL STATEMENTS
43 FINANCIAL REPORT
48 Directors’ Report
72 Auditor’s Independence Declaration
73 Directors’ Declaration
74 Consolidated Statement of Comprehensive Income
75 Consolidated Statement of Financial Position
76 Consolidated Statement of Changes in Equity
77 Consolidated Statement of Cash Flows
130 INDEPENDENT AUDITOR’S REPORT
128 SHAREHOLDER INFORMATION
NRW ANNUAL REPORT 2013 3Contents
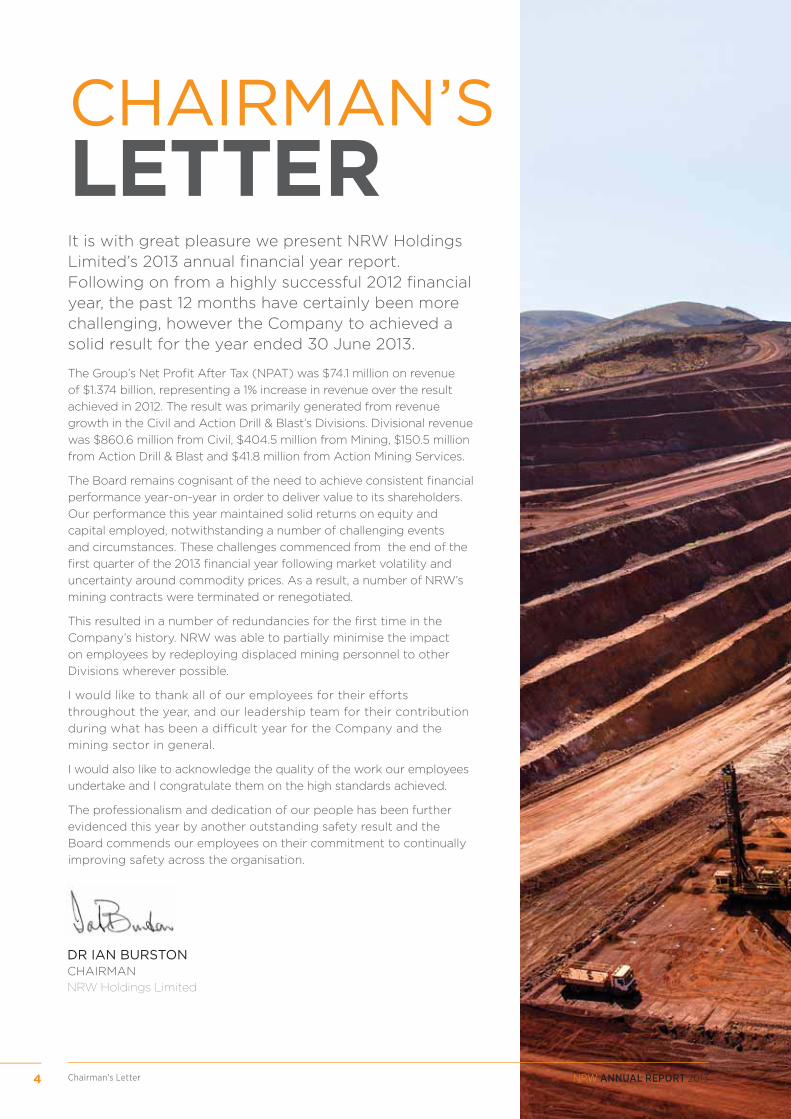
It is with great pleasure we present NRW Holdings Limited’s 2013 annual fi nancial year report. Following on from a highly successful 2012 fi nancial year, the past 12 months have certainly been more challenging, however the Company to achieved a solid result for the year ended 30 June 2013.
The Group’s Net Profi t After Tax (NPAT) was $74.1 million on revenue
of $1.374 billion, representing a 1% increase in revenue over the result
achieved in 2012. The result was primarily generated from revenue
growth in the Civil and Action Drill & Blast’s Divisions. Divisional revenue
was $860.6 million from Civil, $404.5 million from Mining, $150.5 million
from Action Drill & Blast and $41.8 million from Action Mining Services.
The Board remains cognisant of the need to achieve consistent fi nancial
performance year-on-year in order to deliver value to its shareholders.
Our performance this year maintained solid returns on equity and
capital employed, notwithstanding a number of challenging events
and circumstances. These challenges commenced from the end of the
fi rst quarter of the 2013 fi nancial year following market volatility and
uncertainty around commodity prices. As a result, a number of NRW’s
mining contracts were terminated or renegotiated.
This resulted in a number of redundancies for the fi rst time in the
Company’s history. NRW was able to partially minimise the impact
on employees by redeploying displaced mining personnel to other
Divisions wherever possible.
I would like to thank all of our employees for their efforts
throughout the year, and our leadership team for their contribution
during what has been a diffi cult year for the Company and the
mining sector in general.
I would also like to acknowledge the quality of the work our employees
undertake and I congratulate them on the high standards achieved.
The professionalism and dedication of our people has been further
evidenced this year by another outstanding safety result and the
Board commends our employees on their commitment to continually
improving safety across the organisation.
CHAIRMAN’SLETTER
DR IAN BURSTONCHAIRMAN
NRW Holdings Limited
NRW ANNUAL REPORT 20134 Chairman’s Letter

“I would like to thank all of our employees for their efforts throughout the year, and our leadership team for their contribution during what has been a diffi cult year for the Company, and the mining sector in general”
NRW ANNUAL REPORT 2013 5Chairman’s Letter

I present to both our shareholders and stakeholders the results of NRW Holdings Limited for the fi nancial year ended 30 June 2013. NRW has reported record revenue for the sixth consecutive year since listing on the Australian Securities Exchange (ASX). The fi nancial year revenue was $1.374 billion, an increase, of 1% on the prior corresponding period (FY12: $1.358 billion).
Full year 2013 Net Profi t After Tax (NPAT) declined by 23.7%
to $74.1 million, compared to the prior corresponding period’s
NPAT result of $97.1 million. Return on Capital Employed
(ROCE) was 31%, compared to the prior corresponding period
(FY12: 41%), still an excellent outcome and consistent with
NRW’s rolling fi ve year average. NRW’s Net Debt to Equity ratio
moderately increased, fi nishing the 2013 fi nancial year at 25%,
compared to the prior corresponding period (FY12: 18%).
The Company enjoyed excellent safety performance which
is refl ected in the improved Lost Time Injury Frequency Rate
(LTIFR) currently at 0.55, which represents a 18% decrease
from the previous year (FY12: 0.67). A relatively fl at line for
the Group in Total Recordable Injury Frequency Rates (TRIFR)
was experienced, and at 30 June 2013 is at 5.47, slightly higher
than the prior corresponding period (FY12: 5.2). Although the
Company’s TRIFR ended the year fl at, the Civil Division achieved
an outstanding result with a TRIFR of 2.47.
The NRW Civil Division had a very successful year and
continued strong year on year growth with record revenue
of $860.6 million representing an 18% increase on the 2012
fi nancial year ($731.7 million). Particularly pleasing for the
Civil Division was reaching a signifi cant milestone in our
diversifi cation strategy, as we completed our fi rst major project
in the oil and gas market at Wheatstone, as well as our fi rst
large scale government infrastructure works on the Great
Eastern Highway Alliance. We also attained a new key client
in the iron ore market, with the award of a bulk earthworks
contract on the Roy Hill Iron Ore Project.
CHIEF EXECUTIVE OFFICER
YEAR IN REVIEW
NRW ANNUAL REPORT 20136 CEO: Year in Review

FINANCIAL OVERVIEW:• Record revenue of $1.374 billion
• EBIT of $119.4 million
• EBIT Margin of 8.7%
• NPAT of $74.1 million
• NPAT Margin of 5.4%
• Conservative Net debt / Equity position of 25%
• Cash balance $131.0 million
• Final dividend of 5 cents fully franked, totalling 13 cents fully franked for full fi nancial year
• Order book of $1 billion.
“CIVIL DIVISION
CONTINUES STRONG
YEAR ON YEAR
GROWTH, WITH
RECORD REVENUE OF
$860.6 MILLION,
18% ON FY12”
NRW ANNUAL REPORT 2013 7CEO: Year in Review

CHIEF EXECUTIVE OFFICER
YEAR IN REVIEWThe Mining Division revenue decreased to $404.5 million
(FY12: $542.2 million). NRW’s mining operations were
impacted by contract terminations at Fortescue’s Solomon
and Christmas Creek operations, as well as NRW’s Guinean
operations at Simandou.
Action Drill & Blast experienced continued strong growth during
the 2013 fi nancial year with revenue of $150.5 million. This
represents a 33% increase on the 2012 fi nancial year revenue of
$113.1 million. Of particular note is the award of two signifi cant
multi-year contracts, at Cloudbreak and Isaac Plains bringing
longer tenure to Action Drill & Blast’s order book.
Action Mining Services experienced a 10% decrease in revenue
for the 2013 fi nancial year to $41.8 million, compared to the
previous fi nancial year ($46.6 million).
The 2013 fi nancial year provided NRW with its most challenging
year since the Global Financial Crisis, as contract terminations
and delayed award and commencement of projects resulted in a
number of one off and other costs incurred across the Business.
This included redundancy costs of $5.4 million and approximately
$13 million of holding costs for personnel and plant.
As of 30 June 2013, NRW employed a workforce (including
direct, subcontractors and apprentices) of 2,283 people, down
from our peak of 4,821 in August 2012, and a 50% reduction
compared to the close of FY12 (4,592 people). We retain a
diverse workforce with approximately 14% female personnel and
6.5% Indigenous personnel.
During the year a number of cost control and productivity
improvement initiatives were put in place to improve our overall
cost effectiveness. This past year also reinforced the need to
continue our strategy of diversifi cation across client, commodity,
location and service delivery, and how this will shape the way we
do business in the future.
NRW ANNUAL REPORT 20138 CEO: Year in Review

OPERATIONAL HIGHLIGHTS:• Successful completion of fi rst major
oil and gas project at Wheatstone
• Several project awards from key client Rio Tinto
• Secured civil earthworks contract for new client, Roy Hill Holdings
• Action Drill & Blast secure two major long term contracts
“This past year reinforced
the need to continue our
strategy of diversifi cation...
This will shape the way we
do business in the future”
33%ACTION DRILL & BLAST ACHIEVES
IN REVENUEGROWTH
NRW ANNUAL REPORT 2013 9CEO: Year in Review

FINANCIALOVERVIEWFINANCIAL PERFORMANCENRW Holdings Limited slightly increased revenue by 1% to $1.374 billion (FY12: $1.358 billion), however net
profi t after tax declined to $74.1 million. The table below summarises the results of the Group.
FINANCIAL PERFORMANCE ($M’s) 1HY 13 2HY 13 FY13 FY12 Change
SALES REVENUE
Civil 479.3 381.3 860.6 731.7 18%
Mining 272.4 132.1 404.5 542.2 (25%)
Drill & Blast 94.0 56.5 150.5 113.1 33%
Action 21.1 20.7 41.8 46.6 (10%)
Other* (56.1) (27.0) (83.1) (74.8) -
TOTAL SALES 810.7 563.7 1,374.4 1,358.8 1%
EBITDA 101.4 66.9 168.3 195.9 (14%)
EBIT 78.8 40.6 119.4 154.0 (22%)
NPAT 48.6 25.5 74.1 97.1 (24%)
EPS (basic) cents 17.8 8.8 26.6 34.8 (24%)
DPS cents 8.0 5.0 13.0 18.0 (28%)
*Other includes unallocated income and consolidations eliminations for Action Drill & Blast ($72m) and Action Mining Services ($11m).
NRW ANNUAL REPORT 201310 CEO: Year in Review

FINANCIAL POSITIONEquity attributable to shareholders increased by 7.2% to $352.9 million for the fi nancial year ending
30 June 2013, compared to the prior corresponding period (FY12: $329.2 million). NRW’s net debt to equity
levels moved to a slightly higher position of 25% compared to the 2012 fi nancial year (18%). Net working
capital increased due to a swing in tax instalments and increase in differences between accounting and tax
policies. Furthermore the settling of certain current provisions and slowing down of debtor payments have
impacted on working capital.
FINANCIAL POSITION ($M’S) FY13 FY12 FY11 FY10 FY09
Working Capital (less cash and current debt) 49.7 15.0 36.9 30.1 26.4
Non-Current Assets 420.2 391.1 293.0 178.8 156.7
Non-Current Liabilities (less debt) (28.5) (16.2) (10.2) (0.4) (0.6)
441.4 389.9 319.6 208.5 182.5
Funded by:
Cash / (overdraft) 131.0 138.0 70.6 21.4 20.6
Debt (219.6) (198.7) (123.5) (60.8) (60.8)
Net Funding (88.6) (60.8) (52.9) (39.4) (40.2)
Shareholders Equity 352.9 329.2 266.7 169.1 142.2
Return on Equity 21% 30% 15% 21% 27%
Net debt / equity 25% 18% 20% 23% 28%
NRW ANNUAL REPORT 2013 11CEO: Year in Review

FINANCIALOVERVIEWDIVIDENDOn the 21 August 2013, the Board of NRW Holdings Limited declared a fi nal dividend for the fi nancial year
ended 30 June 2013. The fi nal dividend payable is 5.0 cents per share and brings the full year dividend to
13.0 cents per share fully franked.
CASHThe cash position at the end of the fi nancial year was $131.0 million compared to the prior corresponding
period (FY12: $138.0 million). Cash from operations has been impacted by reduced margin, longer debtor
days and tax instalment payment patterns.
FUNDINGTotal secured funding is in excess of 626.3 million, of which $265.5 million is undrawn, comprising facilities
for working capital, performance bonding and asset funding.
The table below illustrates the current headroom of facilities for further growth and the acquisition of
income producing capital. NRW has successfully negotiated substantial facilities to enable the Company to
undertake projects with secured funding options.
BORROWING FACILITY ($M’s) Limit Drawn Available
Asset Funding 316.0 219.6 96.4
Working Capital 64.7 - 64.7
SUB TOTAL BORROWING 380.7 219.6 161.1
OTHER FACILITY Limit Drawn Available
Bonding 205.0 100.6 104.4
Operating Leases 8.3 8.3 -
Bank Guarantees 32.3 32.3 -
SUB TOTAL OTHER 245.6 141.2 104.4
TOTAL 626.3 360.8 265.5
ORDER BOOKThe order book is valued at $1 billion comprising $388 million in the Civil Division, $460 million in the Mining
Division and $157 million in Action Drill and Blast. Order book excludes revenue from
Action Mining Services.
NRW ANNUAL REPORT 201312 CEO: Year in Review

“Final dividend for FY13
of 5c per share, bringing
full year dividend to 13c
per share fully franked”
NRW ANNUAL REPORT 2013 13CEO: Year in Review

OVERVIEWThe Civil Division continued strong year on year growth with record revenue of $860.6 million representing a 18%
increase on the 2012 fi nancial year ($731.7 million). This was achieved despite a general industry slowdown and
signifi cant delays in contract award and commencements impacting the second half.
In the 2013 fi nancial year, the Civil Division demonstrated its capability by managing up to 15 concurrent projects
at a time. Of this, fi ve concurrent projects were in excess of $200 million, and up to $450 million in value. This
growth in capability was well managed and aligned with continued improvement in safety performance with the
Division’s Total Recordable Injury Frequency Rate (TRIFR) reducing from 4.53 (FY12) to 2.47 through a concerted
focus across all projects. In excess of 70% of civil projects recorded a TRIFR of zero for the 2013 fi nancial year.
The Division’s strategic objective of increasing the concrete component of the overall Civil revenue from 20%
(FY12) was not achieved due to the limited concrete opportunities and higher level of competitors within
the discipline relative to earthworks. However, the concrete component of the Civil Division still represents
approximately 15% of Division revenue, enhancing the diversity of service provision across resources, public works
and large scale infrastructure works.
The Civil Division experienced continued success on existing projects with its Indigenous partners, Ngarluma and
Yindjibarndi Foundation Limited (NYFL) and Eastern Guruma Pty Ltd.
NRWCIVIL
NRW ANNUAL REPORT 201314 CEO: Year in Review

OPERATIONS
OUTLOOKThe Division is focused on the successful delivery
of current projects including Rio Tinto’s Cape
Lambert Port B Project, Yandi Sustaining Project
bulk earthworks, West Angelas Access Road and the
Nammuldi Below Water Table Project; as well as BHP
Billiton Iron Ore’s Ore Car Repair Workshop and the
Roy Hill Mine Site Bulk Earthworks for Roy Hill Holdings.
Opportunities exist within NRW’s traditional and
new iron ore client base in Western Australia,
and with new clients in the Queensland coal
infrastructure and LNG sectors. NRW will continue
to pursue other civil opportunities outside of
Construct only, including Design & Construct (D&C)
and EPC, following the development of key partner
relationships. Further to this, the Civil Division will
also be exploring Maintenance style contracts as
another source of diversifi cation.
The Civil Division currently has an order book of
$388 million, with a further $2.41 billion in
active tenders.
NRW was awarded a number of new major contracts
and contract extensions during this period including:
• Cape Lambert Port B 353Mtpa Project
– Rio Tinto
• Western Turner Brockman Earthworks
(additional scope inclusive of Nanutarra Road
Conveyor Tunnel) – Rio Tinto
• Western Turner Syncline Concrete – Rio Tinto
• Port Hedland Inner Harbour Project (additional
scope) – BHP Billiton Iron Ore
• West Angelas Access Road – Rio Tinto
• Yandi Sustaining Project Bulk Earthworks
– Rio Tinto (original plus optional)
• Roy Hill mine site preliminary bulk earthworks
– Roy Hill Holdings
• Thomas Marshalling Yards
– Fortescue Metals Group
• Monakoff Haul Road – Ernest Henry Mining
• Nammuldi Below Water Table Project – Rio Tinto
Signifi cant Achievements throughout the
year included:
• Successful completion of fi rst major Oil and Gas
project on the Wheatstone Project
• Completion of fi rst metropolitan Government
infrastructure project – Great Eastern Highway
Upgrade in alliance with Main Roads, Leighton
Contractors and GHD
• Early Contractor Involvement (ECI) in future
major projects for blue chip clients
• Industry leading staff retention rates and no civil
staff redundancies despite industry downsizing
• Safety performance – in excess of 70% of civil
projects maintained a TRIFR of zero for the 2013
fi nancial year
• Launched new Graduate Engineer and
Supervisor Development programs.
NRW ANNUAL REPORT 2013 15CEO: Year in Review
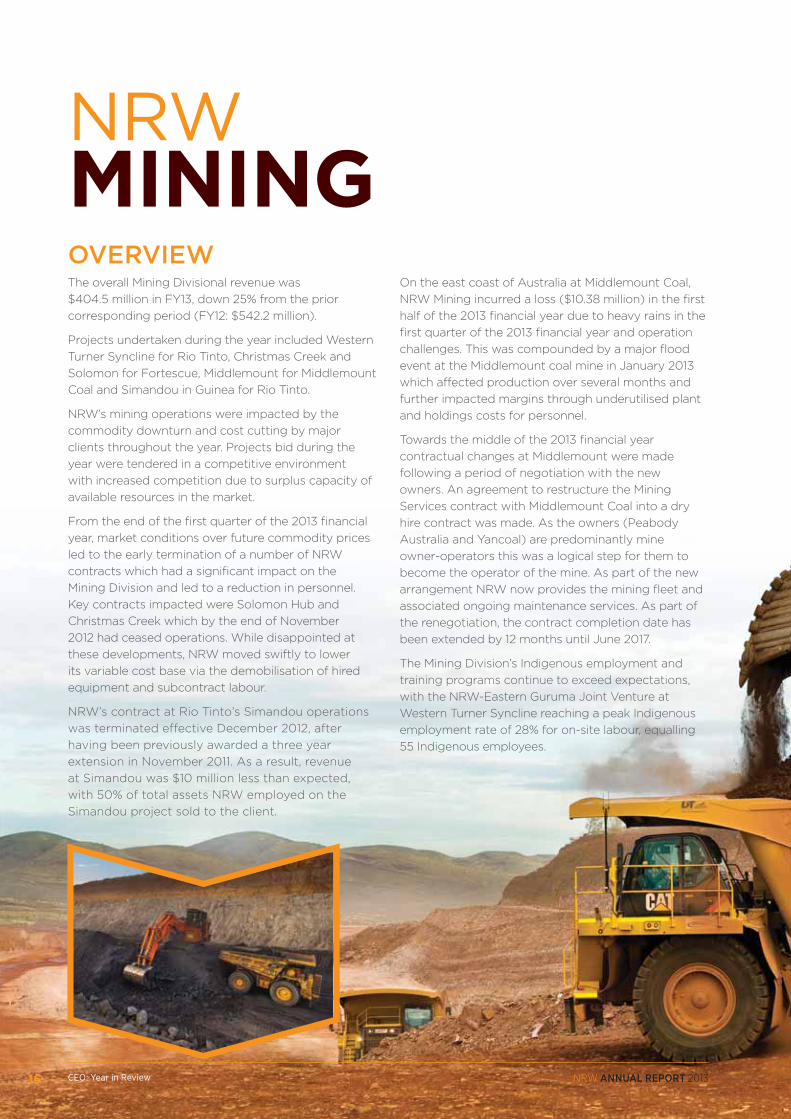
OVERVIEW
NRWMININGThe overall Mining Divisional revenue was
$404.5 million in FY13, down 25% from the prior
corresponding period (FY12: $542.2 million).
Projects undertaken during the year included Western
Turner Syncline for Rio Tinto, Christmas Creek and
Solomon for Fortescue, Middlemount for Middlemount
Coal and Simandou in Guinea for Rio Tinto.
NRW’s mining operations were impacted by the
commodity downturn and cost cutting by major
clients throughout the year. Projects bid during the
year were tendered in a competitive environment
with increased competition due to surplus capacity of
available resources in the market.
From the end of the fi rst quarter of the 2013 fi nancial
year, market conditions over future commodity prices
led to the early termination of a number of NRW
contracts which had a signifi cant impact on the
Mining Division and led to a reduction in personnel.
Key contracts impacted were Solomon Hub and
Christmas Creek which by the end of November
2012 had ceased operations. While disappointed at
these developments, NRW moved swiftly to lower
its variable cost base via the demobilisation of hired
equipment and subcontract labour.
NRW’s contract at Rio Tinto’s Simandou operations
was terminated effective December 2012, after
having been previously awarded a three year
extension in November 2011. As a result, revenue
at Simandou was $10 million less than expected,
with 50% of total assets NRW employed on the
Simandou project sold to the client.
On the east coast of Australia at Middlemount Coal,
NRW Mining incurred a loss ($10.38 million) in the fi rst
half of the 2013 fi nancial year due to heavy rains in the
fi rst quarter of the 2013 fi nancial year and operation
challenges. This was compounded by a major fl ood
event at the Middlemount coal mine in January 2013
which affected production over several months and
further impacted margins through underutilised plant
and holdings costs for personnel.
Towards the middle of the 2013 fi nancial year
contractual changes at Middlemount were made
following a period of negotiation with the new
owners. An agreement to restructure the Mining
Services contract with Middlemount Coal into a dry
hire contract was made. As the owners (Peabody
Australia and Yancoal) are predominantly mine
owner-operators this was a logical step for them to
become the operator of the mine. As part of the new
arrangement NRW now provides the mining fl eet and
associated ongoing maintenance services. As part of
the renegotiation, the contract completion date has
been extended by 12 months until June 2017.
The Mining Division’s Indigenous employment and
training programs continue to exceed expectations,
with the NRW-Eastern Guruma Joint Venture at
Western Turner Syncline reaching a peak Indigenous
employment rate of 28% for on-site labour, equalling
55 Indigenous employees.
NRW ANNUAL REPORT 201316 CEO: Year in Review

NRW’s mining joint venture relationships with
Indigenous organisations - Eastern Guruma Pty
Limited at Western Turner Syncline and Solomon; and
Ngarluma and Yindjibarndi Foundation Limited (NYFL)
at Solomon - continued to provide a positive outcome
to the business.
Contracts awarded and extensions during the
period include:
• Middlemount Coal – Dry Hire and Maintenance
– Middlemount Coal JV
• Christmas Creek Vasse Tailings Storage Facility
– Fortescue
• Bulk Earthworks Services Solomon Construction
– Fortescue
• Bootu Creek Equipment and Labour Hire
– OM Holdings
Safety performance across the Division was satisfactory
during the 2013 fi nancial year. An increased focus on
lead indicators had a positive impact, although the
Division performance when measured in relation to
TRIFR deteriorated, with 2013 fi nancial year TRIFR at 7.59
compared to the prior corresponding period (FY12: 5.82).
OUTLOOKMarket conditions will continue to be diffi cult during
the remainder of calendar year 2013, however
the Division’s strategy remains to diversify into
other commodities and clients, with a number of
opportunities identifi ed. Geographical diversifi cation
will also take place as the Division pursues
international opportunities with selected clients.
The mining fl eet in Western Australia has been
underutilised during the second half. However with a
rampup in current civil projects, many of the mining
assets are directly transferable into these larger
greenfi eld bulk earthworks projects.
The Mining Division currently has an order book of
$460 million, with a further $1.41 billion in submitted tenders.
“NRW’s mining
operations were
impacted by the
commodity downturn
and cost cutting by
major clients through
the year”
NRW ANNUAL REPORT 2013 17CEO: Year in Review

OVERVIEWAction Drill & Blast experienced continued strong
growth during the 2013 fi nancial year with revenue
of $150.5 million, representing a 33% increase on
the 2012 fi nancial year revenue of $113.1 million.
After three years of operations Action Drill &
Blast has experienced signifi cant success across
Australia and is recognised as a provider of quality
and professional drilling and blasting contract
services. Particularly pleasing for the 2013 fi nancial
year was the award of a four year (plus two year
option to extend) $140 million drilling services
contract direct to Fortescue for operations at the
Cloudbreak iron ore mine. The other signifi cant
contract awarded during the fi nancial year was
for blasting services at the Isaac Plains coal mine
which was awarded as a three year contract with a
two year option to extend.
However, the second half performance for 2013 was
not as strong as the fi rst. The downturn experienced
in the mining sector from the fi rst half of the 2013
fi nancial year, in conjunction with specifi c events
detailed below, reduced overall margin in the second
half of the F2013 fi nancial year:
• The termination of contracts on Fortescue’s
Solomon and Christmas Creek operations
resulted in a large number of highly skilled
personnel being displaced. Action Drill & Blast
incurred holding costs for labour by retaining
this experienced skill base and providing
off-site work and training opportunities
pending the anticipated award of the
signifi cantly sized Cloudbreak drilling contract.
• Severe weather events throughout the Bowen
Basin signifi cantly affected production on coal
operations over several months, including a
major fl ood event at the Middlemount coal
mine in January 2013.
• Start-up costs incurred in relation to mobilisation
for Action Drill & Blast’s largest contract to date at
Cloudbreak were incurred during the second half
of the fi nancial year, and included holding costs for
assets not utilised until the commencement of the
Cloudbreak contract in April.
Action Drill & Blast’s external client list for the 2013
fi nancial year included Fortescue, Rio Tinto, John
Holland, Talison Lithium, Brierty, Macmahon, Downer
EDI, BMA and Peabody
NRW ANNUAL REPORT 2013CEO: Year in Review18

OPERATIONSAt the end of the 2013 fi nancial year Action
Drill & Blast had six contracts in Western
Australia and two in Queensland. The largest
contract is at Fortescue’s Cloudbreak
Project. The Business currently employs 275
people and utilises a fl eet of 49 drills.
External projects awarded during the 2013
fi nancial year included:
• Drilling Services at Cloudbreak Mine
– Fortescue
• Blasting Services at Isaac Plains Coal
Mine – Isaac Plains Coal Management Pty
Limited (originally contracted to John
Holland Queensland Pty Limited and
then novated to IPCM)
• Drilling and Dewatering Services at Hail
Creek Mine – Rio Tinto Coal
• Blasting Labour at Christmas Creek Mine
– Macmahon Holdings
• Supplementary Drilling Services at Karara
Iron Ore Project – Brierty Limited
• 12 month extension at Greenbushes for
Talison Lithium
• Relief Hole Drilling at West Angelas Mine
– Westforce Construction
• Drilling Services at Daunia Coal Mine
– Downer EDI Mining Pty Limited
Signifi cant Achievements
• Award of two multi-year projects with
options to extend, providing longer term
tenure and order book stability
• Strong growth in revenue of 33% for the
year despite market downturn
• Achieved LITFR of zero in March 2013.
Action Drill & Blast began the fi nancial year
well from a safety performance point of
view, with a TRIFR in July 2012 of 1.59 before
experiencing some fl uctuations during the
year. In March 2013, Action Drill & Blast
achieved a LTIFR of zero, with a TRIFR of
6.86, before declining safety performance
led to a fi nancial year end TRIFR result of
12.68. Despite this decrease in TRIFR, Action
Drill & Blast fi nished the 2013 fi nancial year
with a LTIFR of zero.
OUTLOOKAction Drill & Blast currently has an order book of
$157 million, with a further $143 million in active tenders.
The downturn in the mining sector will create challenges
for all service contractors in the industry as client focus
has shifted from being ‘volume’ driven to being ‘cost
focused’. Action Drill & Blast has excellent systems,
people and equipment which will enable it to assist
clients achieve their need to become more cost effi cient
and improve their productivity. A concerted effort of
improving safety performance will also be maintained
and reinforced through the business at all levels.
Financial performance is expected to return to more
consistent levels during the 2013/2014 fi nancial year as:
• Displaced site personnel have returned to
operational roles.
• The Cloudbreak contract realised full potential in
June allowing more effective recovery of the start-
up costs.
• Improved production on the Middlemount and Isaac
Plains coal contracts.
In addition to the above stabilisation of contracts Action
Drill & Blast will also focus on improving performance
through renegotiation of pricing with suppliers and
optimisation of asset management and utilisation.
Action Drill & Blast sees this next phase in the mining
cycle as an opportunity to demonstrate its specialist
skills and believe it is a great opportunity to continue to
grow the business through increased market share and
capitalisation of new prospects.
The Mining unit’s drill fl eet grew considerably in the last
12 months to accommodate the growing requirement
from Action Drill & Blast clients to provide a large fl eet of
60,000-75,000lb rotary drills. As the market moves from
establishment of infrastructure to production mining a
downturn in the Civil units’ projects is expected, however
the specialist skills of this unit are easily transferable to
other markets. In particular, we are looking to pursue
opportunities on civil LNG projects in Eastern Australia and
gold operations in Western Australia. Action Drill & Blast’s
Coal unit has been recognised as an effi cient and extremely
capable provider of explosive services including supply,
storage and, of course, blasting. Our drill fl eet of large
rotary drills is still the newest in the industry and provides
signifi cant performance and safety benefi ts for our clients.
Action Drill & Blast has increased its business
development focus and are actively seeking opportunities
in markets other than those currently operating in, such
as gold, oil and gas, and Action Drill & Blast has also
commenced a review of international prospects.
NRW ANNUAL REPORT 2013CEO: Year in Review 19

OVERVIEWAction Mining Services experienced a 10% decrease in revenue to $41.8 million for the 2013 fi nancial
year representing a 10% decrease on FY12 ($46.6 million). This was predominately due to the sector
downturn in mining and civil projects at the end of the fi rst quarter of FY13, and lower margins due to
the subsequent slowing of demand for products and services.
Major external clients include Dampier Salt, Jones Mining, Leighton Contractors, Komatsu, Alliance
Contracting, Titan Plant Hire, and Onsite Hire.
An overall restructure of the Business was undertaken to reduce overheads and improve effi ciencies on
the shop fl oor. The restructure included the alignment of the manufacturing division (support vehicles)
with the service divisions to increase capabilities and improve effi ciencies.
Key achievements in the 2013 fi nancial year included:
• The successful expansion of the AMS range of
Support Vehicles with the release of the new,
high tech, AMS 15,000lt ‘Viper Series’ Service
Module and the AMS 12,000lt Service Module
(the AMS 12,000 is an extension of the popular
AMS 6,700lt Service Module).
• The expansion of AMS’s capabilities with
the set-up of a Field Service Division, a
Component Overhaul Division and an Asset
Refurbishment Division.
• The successful expansion of the customer base
to attract new work including the successful
completion of the fi rst salt spec machine
(Caterpillar D10 Bulldozer) for Dampier Salt.
• Continued ongoing support and commitment
with a work placement program and
apprenticeship training program – AMS
currently employ 27 apprentices.
• More than three years (1,095 days) Lost Time
Injury (LTI) free in the workplace.
NRW ANNUAL REPORT 2013CEO: Year in Review20

OUTLOOKAs per previous years, the level of growth and
opportunities within the services unit will be
infl uenced by the level of investment in the
resources and infrastructure sectors. However the
strategy by AMS to expand its service capabilities
in calendar year 2013 places the Division in an
excellent position to take advantage of the mining
industry moving from a construction phase to an
operations phase with an anticipated increase in
demand for repair and maintenance services of
operational equipment.
Due to delays in project awards, we anticipate
reduced demand in the 2014 fi nancial year for
support vehicles. However the introduction of a
number of new strategies will see AMS targeting
a broader customer base across a more diverse
product and service range, resulting in an expected
improved level of total revenue for the period.
Improving effi ciencies will be a key focus, to reduce
production and material costs, allowing unit prices
to be reduced whist retaining budgeted margins
for price sensitive markets such as the hire market.
Efforts will also be concentrated on developing
innovative new safety features and inclusions on the
AMS product range to establish AMS as the industry
leader in manufacturing with a safety focus.
AMS will continue to look for new products and
services within its fi eld to take advantage of the
AMS skill base and group customer relationships.
Increased resources will be placed on marketing
the company’s capabilities to industry with the
objective of increasing market share through an
expanded client base, and to ensure AMS is in a
position to take advantage of changing conditions.
The introduction of a new Enterprise Resource
Planning (ERP) system in the fi rst half of the 2014
fi nancial year will improve management, recording
and reporting effi ciencies resulting in a further
reduction in overheads and operating costs. The
system will assist to maximise resource utilisation and
improve the quality of service provided to customers.
AMS will continue to focus on developing
apprentices through its unique Apprentice Program
in which apprentices are rotated through various
NRW Civil and Mining sites to gain practical site
experience after completing the fi rst two years at
Action Mining Services.
NRW ANNUAL REPORT 2013CEO: Year in Review 21
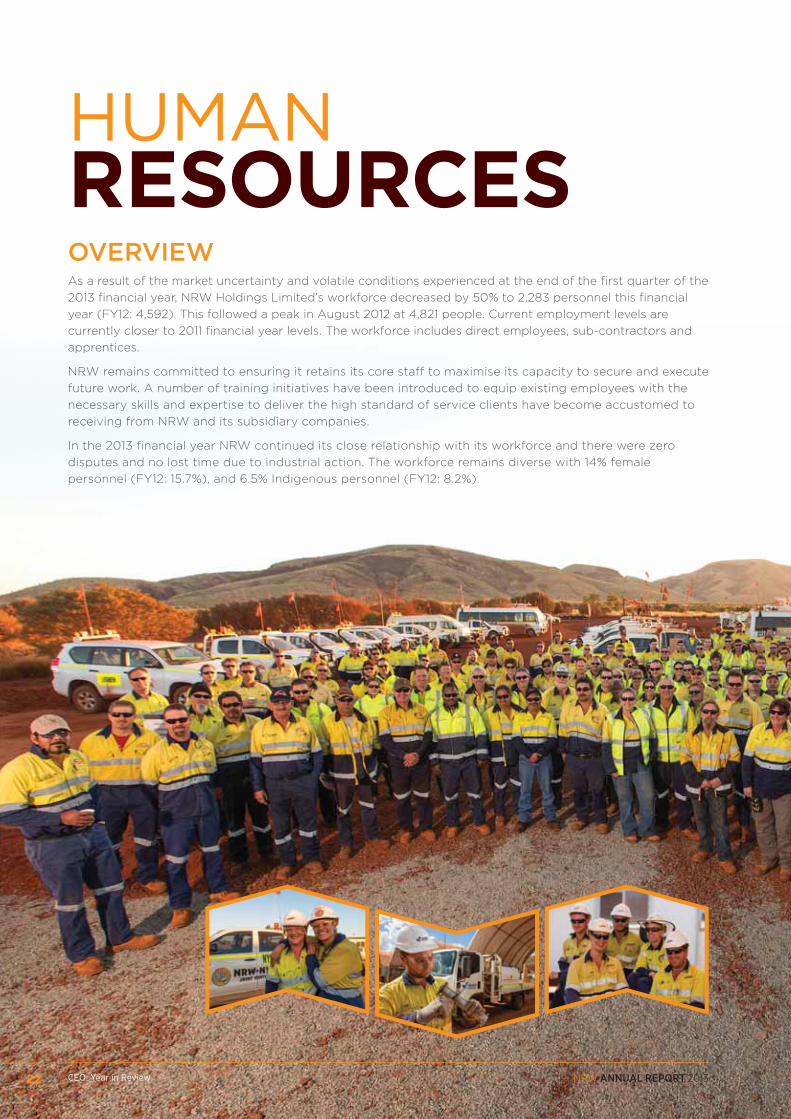
OVERVIEWAs a result of the market uncertainty and volatile conditions experienced at the end of the fi rst quarter of the
2013 fi nancial year, NRW Holdings Limited’s workforce decreased by 50% to 2,283 personnel this fi nancial
year (FY12: 4,592). This followed a peak in August 2012 at 4,821 people. Current employment levels are
currently closer to 2011 fi nancial year levels. The workforce includes direct employees, sub-contractors and
apprentices.
NRW remains committed to ensuring it retains its core staff to maximise its capacity to secure and execute
future work. A number of training initiatives have been introduced to equip existing employees with the
necessary skills and expertise to deliver the high standard of service clients have become accustomed to
receiving from NRW and its subsidiary companies.
In the 2013 fi nancial year NRW continued its close relationship with its workforce and there were zero
disputes and no lost time due to industrial action. The workforce remains diverse with 14% female
personnel (FY12: 15.7%), and 6.5% Indigenous personnel (FY12: 8.2%).
HUMANRESOURCES
NRW ANNUAL REPORT 201322 CEO: Year in Review

GRADUATE PROGRAM Our engineering graduates undertake a three
year NRW Graduate Program, which aims to
develop them into future leaders of our industry.
Through diverse training and development,
NRW graduates are exposed to various projects,
clients, markets, commodities and infrastructures.
NRW’s Graduate Program comprises an
orientation week that involves: induction sessions
with every department, two days at Neerabup
outside of Perth on machinery; a team building
day with other graduates including those in
different stages of the Program; and a networking
dinner with senior management. Importantly,
each graduate is assigned a senior mentor and
offered a structured pathway to chartership
through Engineers Australia.
NRW ANNUAL REPORT 2013 23CEO: Year in Review

OVERVIEWNRW recognises that its long-term success
depends on the well-being and sustainable
development of the communities in which it
operates, comprising local communities as well as
the traditional owners of the land.
We respect the importance of Indigenous Australian
culture and value its diversity. We have successfully
employed and supported Indigenous people within
our Civil and Mining operations since the forming of
the Company in 1994, and this continued with the
acquisition of Action Mining Services in 2007, and
the forming of Action Drill & Blast in 2010. Increasing
Indigenous representation in employment on our
projects and within our organisations’ is an integral
part of the NRW philosophy.
48 Cultural Awareness workshops were conducted
during the 2013 fi nancial year for 528 participants.
JOINT VENTURESBesides Indigenous employment targets and the
successful Powerup Program, NRW also joint
venture with a number of Indigenous organisations
to provide sustainable business opportunities to
these groups and the communities they represent.
The NRW-Eastern Guruma Joint Venture has
undertaken or been awarded the following
contracts in the 2013 fi nancial year:
• Western Turner Syncline Mining – Rio Tinto
• Western Turner Syncline Civil / Concrete Works
– Rio Tinto
• Western Turner Brockman – Rio Tinto
• Boolgeeda Aerodrome – Rio Tinto
• Nammuldi Below Water Table Bulk Earthworks
– Rio Tinto
INDIGENOUS ENGAGEMENT
The NRW-NYFL Joint Venture undertook signifi cant
works on Rio Tinto’s Cape Lambert Port B Project
including the following contracts and variations:
• Cape Lambert Car Dumpers & Stockyards Bulk
Earthworks – Car dumpers 6 and 7 and Phase
B stockyards
• Tail track and tail track extensions
• Sam’s Creek Pipe jacking
• Crushing contract
• A fencing contract and various small works
packages.
NRW ANNUAL REPORT 201324 CEO: Year in Review

POWERUPPowerup is NRW’s intensive three week
pre-employment work ready program, run in
conjunction with the Department of Education,
Employment and Workplace Relations, and
continues to attract strong support from the
Indigenous community.
Powerup provides opportunities for Indigenous
candidates lacking entry level skills to break into
the civil and mining industry. Involving RII20209
Certifi cate II: Surface Extraction Operations,
Powerup exposes participants to a simulator and
hands-on activities in a controlled ‘real life mining
pit’ in haul truck and roller operations. During
the innovative three week program, trainees are
mentored by experienced professional trainers and
human resources staff - consisting of 40 hours of
classroom activities in Canning Vale, 80 hours at
Neerabup quarry north of Perth.
This year NRW held two Powerup programs, a
decrease compared to previous years due to the
reduced employment opportunities for graduates.
It continues to be well subscribed amongst
potential applicants, and well regarded by clients
and industry alike.
NRW ANNUAL REPORT 2013 25CEO: Year in Review

HEALTH SAFETY & ENVIRONMENTHEALTH & SAFETYNRW is committed to achieving the highest possible
performance in occupational health and safety
across all business operations. NRW’s Health, Safety
and Environmental (HSE) Management Systems are
accredited to AS4801:2001, the applicable Australian
Standard and subject to continuous audit — NRW
was re-certifi ed in January 2012.
The Company manages risk through hazard
identifi cation, minimisation, monitoring and control
procedures, and by reviewing safety performance.
NRW ensures that all employees, including
subcontractor employees, are fully HSE inducted,
trained and assessed in the tasks each will be
required to perform, plus deemed competent via a
Registered Training Organisation (RTO) process in
the operation of plant and equipment.
In early 2012, NRW rolled out and launched a revitalised
company wide safety culture program, ‘A safe day,
every day’. The Program contains elements of reward
and recognition to reinforce the efforts of employees,
as well as to raise awareness of safety issues across all
sites. It also increases the key performance indicators
used to measure and record progress of projects,
making the individual projects more accountable.
The 2013 fi nancial year has seen signifi cant
re-structuring of the HSE department within NRW
and the new structure will provide stronger support
for projects, whilst enabling NRW to improve
outcomes as it continues to grow.
During the year we continued to focus on the area
of hazard identifi cation and hazard removal from
work processes, coupled with a renewed focus on
documentation at hand for our employees. One
such implementation of this focus was the creation,
development and launch of a pocket booklet titled
‘My HSE Kit’ which contains all the required mini-forms
employees need to complete as part of their duties.
The success of the overarching Program has been
refl ected in the consistent safety performance
which is refl ected in the improved Lost Time Injury
Frequency Rate (LTIFR) currently at 0.55, which
represents a 18% improvement from the previous
year (FY12: 0.67). A relatively fl at line for the Group in
Total Recordable Injury Frequency Rates (TRIFR) was
experienced, and is currently at 5.47, slightly down on
the prior corresponding period (FY12: 5.2).
NRW ANNUAL REPORT 201326 CEO: Year in Review

ENVIRONMENTNRW maintained certifi cation to
AS/NZS ISO 14001: 2004 Environmental
Management Systems which covers
Environmental Management Systems in the
civil engineering and mining industries. This
certifi cation reinforces NRW’s commitment
to maintaining strict environmental protocols
on all projects undertaken. This certifi cation
is subject to continuing audit by external
agencies and NRW was re-certifi ed in
January 2012.
CASE STUDY: Support for the Environment
The Pilbara Wildlife Carers Association
(PWCA) was the recipient of a $20,000
donation from the NRW-NYFL Joint Venture
crew at Rio Tinto’s Cape Lambert Port B
Project. PWCA provides a vital emergency
service to the Pilbara community by
responding to calls regarding sick, injured
or orphaned wildlife. Many calls are received
from mining and construction companies
who have impacted fauna whilst undertaking
their work. The extensive network of
registered volunteer wildlife carers in the
Pilbara foster and rehabilitate sick and
injured wildlife, until they’re able to be
released back into the environment. NRW’s
donation will signifi cantly assist with PWCA’s
on-going service to the Pilbara community.
0
5
10
15
20
25
30
35
40
0
1,000,000
2,000,000
3,000,000
4,000,000
5,000,000
6,000,000
7,000,000
8,000,000
Man Hours
FY09 FY10 FY11 FY12 FY13
LTIFR (Lost Time Injury Frequency Rate)
TRIFR (Total Recordable Injury Frequency Rate)
Man hours
QUALITY ASSURANCE NRW maintained certifi cation to ISO standard 9001:
2008 and AS/NZS 4801 (achieved in May 2009) for its
Quality Management System. NRW was re-certifi ed in
January 2012.
SAFETY PERFORMANCE
NRW ANNUAL REPORT 2013 27CEO: Year in Review

COMPANYOUTLOOKDespite the signifi cant downturn across the
resources industry, NRW retains a positive outlook
over the short to medium term with a steady
pipeline of tenders and a clear strategy to further
diversify our client base and client offering.
The Company will continue to maintain focus on
its core domestic markets of iron ore and coal with
expansions and related infrastructure works still
underway and a number of new projects in the
planning stage. We are also working on growing
our exposure to markets such as LNG and CSG.
With current work in hand of $1 billion and tender
activity still strong with over $3.96 billion in active
tenders across the Business, we remain confi dent
of securing work across all our Division’s to further
strengthen our order book.
The Group’s balance sheet, funding facilities and
solid cash position provide a strong foundation for
future organic growth and potential acquisitions.
The Group will continue to assess acquisition
opportunities both domestically and internationally
to add value to NRW’s service delivery model.
We will also continue to focus on cost
management programs, efficiencies and
continuous improvement processes. These
practises will contribute to NRW’s overall cost
effectiveness in project delivery and assist in
maintaining our market competitiveness.
NRW expects revenue between $1-1.2 billion for
the 2014 financial year, of which approximately
60% is currently secured. This is subject to timely
award and commencement of new projects.
NRW ANNUAL REPORT 201328 CEO: Year in Review

“With current work in hand of $1 billion and tender activity still strong with over $3.96 billion in active tenders, we remain confi dent of securing work across all our divisions to further strengthen our order book”
NRW ANNUAL REPORT 2013 29CEO: Year in Review

CHIEF FINANCIAL OFFICER
FINANCIAL YEAR IN REVIEWFY13 REVIEWThe Group increased revenue predominantly from the
contribution of the Civil and Drill and blast Divisions.
The Group’s earnings and returns on capital employed
decreased due to the Mining Divisions performance as
a result of economic conditions and commodity price
pressures. Gearing ratios remained conservative and a
strong cash balance has been maintained.
INVESTMENT RETURNSEarnings per share were 26.6 cents which was a 24%
decrease compared to prior corresponding period. The
dividend payout ratio as a percentage of NPAT in FY13 is
49% compared to 52% (FY12).
The Group continued to achieve satisfactory returns on
average capital employed with 31% achieved for the 2013
fi nancial year.
0
50
100
150
200
250
300
350
400
450
FY13FY12FY11FY10FY09
$M’s
0%
5%
10%
15%
20%
25%
30%
35%
40%
45%
%
Return on Avge Capital EmployedNet Fixed Assets
DIVISIONALPERFORMANCE ($M’s)
NRW Civil Contracting
NRW Mining Services
Action Drill & Blast
Action Mining Services
FY2013
Revenue 860.6 404.5 150.5 41.8
Segment Profi t 92.0 17.9 16.8 3.3
Return on revenue 11% 4% 11% 8%
FY2012
Revenue 731.7 542.2 113.1 46.6
Segment Profi t 81.6 64.0 18.7 4.6
Return on revenue 11% 12% 17% 10%
Revenue Growth 18% (25%) 33% (10%)
Segment Profi t Growth 13% (72%) (10%) (28%)
NRW ANNUAL REPORT 201330 CFO: Financial Year in Review

CAPITAL EXPENDITURECapital expenditure was predominantly allocated to the
Mining Division relating to the Middlemount project.
Capital Expenditure ($M’s) FY13 FY12 FY11
NRW Civil Division 11.8 16.6 6.9
NRW Mining Division 51.6 105.5 120.4
Drill & Blast 15.9 15.1 7.5
Action Mining Services 1.8 0.6 0.6
Miscellaneous 12.0 6.7 14.8
TOTAL $93.1 $144.4 $150.2
Action Drill & Blast added seven rigs comprising of $11.1
million of their $15.9 million capital expenditure for the
2013 fi nancial year. Future commitments to Action Drill &
Blast capital expenditure will see a further fi ve rigs added
in the 2014 fi nancial year at an estimated $17.5 million,
although this is subject to securing new projects.
The Miscellaneous category of expenditure relates to
investment in information infrastructure and system
upgrades ($10.5 million), land and buildings ($1.1 million)
and other ($0.4 million).
CASH FLOWNRW’s operating cash fl ow in FY13 was $118.0 million.
The decrease in operating cash was a result of reduced
operating margins and a slightly slower collection cycle.
Tax instalment payments were remitted under the prior
year withholding rates which also dragged operating
cash down.
The decrease in EBITDA and lower returns of average
capital employed has resulted in Group cash reserves
being less than previous years, with $131.0 million at 30
June 2013 (FY12: $138.0 million).
0
40
20
60
80
100
120
140
160
180
200
FY13FY12FY11FY10FY09
$M’s
Operating Cash Flow
OPERATING CASH FLOW ($M’S)
NRW ANNUAL REPORT 2013 31
FOR THE YEAR ENDED 30 JUNE 2013
CHIEF FINANCIAL OFFICER
CFO: Financial Year in Review

BALANCE SHEET AND FUNDINGThe Group Balance Sheet refl ects the continued
conservative management of debt levels and
cash. Due to the strength of the balance sheet, the
Company has suffi cient fl exibility for future project
funding and/or acquisitions.
The Structured Debt Facility (ANZ lead arranger),
was successfully reviewed and maintained during
the FY13 year. Other funders included insurance
providers as required, operating lease providers and
asset fi nanciers outside the clubbing arrangement.
Currently the Group has total funding capacity
(inclusive of fi nanced and operating facilities)
totalling over $626 million. Of this just over $265
million remain undrawn and new facilities for
bonds have been agreed and in place post FY13
totalling $50 million.
$0
$10
$20
$30
$40
$50
$60
$70
$80
$90
$10028%
23%
20%18%
25%
FY13FY12FY11FY10FY09
$M’s
Net Debt/EquityNet Debt ($m’s)
NET DEBT POSITION
NRW ANNUAL REPORT 201332
FOR THE YEAR ENDED 30 JUNE 2013
CHIEF FINANCIAL OFFICER
CFO: Financial Year in Review

BORROWING FACILITY ($M’s) Limit Drawn Available
Asset Funding 316.0 219.6 96.4
Working Capital 64.7 - 64.7
SUB TOTAL BORROWING 380.7 219.6 161.1
OTHER FACILITY Limit Drawn Available
Bonding 205.0 100.6 104.4
Operating Leases 8.3 8.3 -
Bank Guarantees 32.3 32.3 -
SUB TOTAL OTHER 245.6 141.2 104.4
TOTAL 626.3 360.8 265.5
SYSTEMSNRW continues to develop and improve its management information systems. Particularly this includes the
staged implementation of Microsoft Dynamics AX (MinePoint), network improvement and asset management.
Further work will be undertaken to integrate and allow effi cient use of data, reporting and improve further
the project management systems. Ongoing review will continue to target the appropriate priorities.
The objectives of the systems are to provide a sound base for effi cient and accurate decision making in
both production and strategic management. This will continue to cut across the entire Group including all
operating segments.
TONY RASCHELLA
ACTING CHIEF FINANCIAL OFFICER
NRW ANNUAL REPORT 2013 33
FOR THE YEAR ENDED 30 JUNE 2013
CHIEF FINANCIAL OFFICER
CFO: Financial Year in Review

CORPORATE GOVERNANCE
STATEMENT
NRW ANNUAL REPORT 201334 Corporate Governance Statement
ASX GOVERNANCE PRINCIPLES AND ASX RECOMMENDATIONS
The Australian Securities Exchange Corporate Governance Council sets out best practice recommendations, including corporate governance practices and suggested disclosures. ASX Listing Rule 4.10.3 requires companies to disclose the extent to which they have complied with the ASX recommendations and to give reasons for not following them.
Unless otherwise indicated the best practice recommendations of the ASX Corporate Governance Council,
including corporate governance practices and suggested disclosures, have been adopted by the Company
for the full year ended 30 June 2013.
In addition, the Company has a Corporate Governance section on its website: www.nrw.com.au which
includes the relevant documentation suggested by the ASX Recommendations.
The extent to which NRW has complied with the ASX Recommendations during the year ended 30 June
2013, and the main corporate governance practices in place are set out below.

NRW ANNUAL REPORT 2013 35Corporate Governance Statement

NRW ANNUAL REPORT 2013Corporate Governance Statement36
CORPORATE GOVERNANCE STATEMENTFOR THE YEAR ENDED 30 JUNE 2013
PRINCIPLE 1: LAY SOLID FOUNDATION FOR MANAGEMENT AND OVERSIGHT
The Board has implemented a Board Charter that
details its functions and responsibilities together
with those of the Chairman and individual Directors.
Key responsibilities of the Board include:
• approving the strategic objectives of the Group and
establishing goals to promote their achievement;
• monitoring the operational and fi nancial position
and performance of the Group;
• ensuring the Directors inform themselves of the
Group’s business and fi nancial status;
• establishing investment criteria including
acquisitions and divestments, approving
investments, and implementing ongoing
evaluations of investments against such criteria;
• providing oversight of the Company, including its
control and accountability systems;
• exercising due care and diligence and sound
business judgment in the performance of those
functions and responsibilities;
• considering and approving the Group’s budgets;
• reviewing and ratifying systems of risk
management and internal compliance and
control, codes of conduct and legal compliance;
• monitoring senior management’s performance
and implementation of strategy and ensuring
appropriate resources are available;
• ensuring that business risks facing the Group are,
where possible, identifi ed and that appropriate
monitoring and reporting internal controls are in
place to manage such risks;
• approving and monitoring fi nancial and other
reporting; and
• ensuring the Company complies with its
responsibilities under the Corporations Act, the
ASX Listing Rules, the Company’s Constitution
and other relevant laws and regulations.
PRINCIPLE 2: STRUCTURE OF THE BOARD TO ADD VALUE
BOARD COMPOSITION
Details of the Directors in offi ce at the date of this
report, including their qualifi cations, experience,
date of appointment and their status as Non-
Executive, independent or executive Directors are
set out in the Director’s Report.
The Board Charter (a copy of which has been
published on the Company’s website) currently
provides that at least one third of its Directors will
be independent Non-Executive Directors and that
the Chairman must also be an independent Non-
Executive Director.
The Board currently has four Directors, three of
whom are Non-Executive. The three Non-Executive
Directors, including the Chairman, are considered to
be independent.
The roles of the Chair and Managing Director are
exercised by different individuals.
INDEPENDENT DECISION-MAKING
The Board agrees that all Directors should bring an
independent judgement to bear in decision-making.
Accordingly, the Board:
• has adopted a procedure for Directors to take
independent professional advice if necessary at the
Company’s expense (with the prior approval of the
Chairman, which will not be unreasonably withheld);
• as much as is reasonably practicable within the
constraints of its current Board size and structure,
sets aside sessions at its scheduled meetings to
confer without management present;
• has described in the Board Charter the
considerations it takes into account when
determining independence.
DIRECTOR INDEPENDENCE
The Board’s Charter lists relationships it takes into
account when determining the independent status
of Directors.
Criteria that the Board takes into account when
determining Director independence include that
the Director:
• is not a substantial shareholder of the Company
or an offi cer of, or otherwise associated directly

NRW ANNUAL REPORT 2013Corporate Governance Statement 37
CORPORATE GOVERNANCE STATEMENTFOR THE YEAR ENDED 30 JUNE 2013
with a substantial shareholder of the Company (as
defi ned in section 9 of the Corporations Act 2001);
• has not, within the last three years, been
employed in an executive capacity by a member
of the Group, or been a director after ceasing to
hold any such employment;
• has not, within the last three years, been a
principal of a material professional adviser or a
material consultant to the Group, or an employee
materially associated with the service provided;
• is not a material supplier or customer of the Group,
or an offi cer of or otherwise associated, directly or
indirectly, with a material supplier or customer;
• has no material contractual relationship with the
Group other than as a director of the Company;
• has not served on the Board for a period which
could, or could reasonably be perceived to,
materially interfere with the director’s ability to
act in the best interests of the Company; and
• is free from any interest and any business
or other relationship which could, or could
reasonably be perceived to, materially interfere
with the director’s ability to act in the best
interests of the Company.
The Board has reviewed the independence status
of its Directors and has determined the following
Directors to be “independent” (in accordance with
the criteria listed above):
• Dr Ian Burston (Chairman)
• Mr Michael Arnett
• Mr John Cooper
The period of offi ce held by each Director in offi ce is
as follows:
Director Date Appointed Period in offi ce Due for
Re-election
Dr Ian Burston 27 July 2007 6 years 2013 AGM
Mr Julian Pemberton
1 July 2006 7 years Not Applicable
Mr Michael Arnett
27 July 2007 6 years Not Applicable
Mr John Cooper
29 March 2011 2 years 2013 AGM
CONFLICTS OF INTEREST
A Director’s obligations to avoid a confl ict of
interest are set out in the Board Charter and
reinforced in the Code of Conduct – The Company’s
Obligations to Stakeholders.
Directors and employees of the Company are
expected to act at all times in the Company’s best
interests and to exercise sound judgment unclouded
by personal interests or divided loyalties. They must
avoid the appearance of, as well as actual, confl icts
of interest both in their performance of duties for
the Company and in their outside activities.
The Charter states that Directors must comply
strictly with Corporations Act requirements and the
Board Charter for the avoidance of confl icts.
NOMINATION AND REMUNERATION COMMITTEE
The Board has established a Nomination and
Remuneration Committee and adopted a Charter
that sets out the committee’s role and responsibilities,
composition and membership requirements.
Nomination responsibilities:
The role of the Nomination and Remuneration
Committee when carrying out its Nomination
responsibilities includes:
• identifying nominees for directorships and other
key executive appointments;
• the composition of the Board;
• ensuring that effective induction and education
procedures exist for new Board appointees and
key executives; and
• ensuring that appropriate procedures exist to
assess and review the performance of the Chair,
Executive and Non-Executive Directors, senior
management, Board committees and the Board
as a whole.
The responsibilities of this Committee with respect
to remuneration are set out under Principle 8.
Composition of the Committee
The Committee Charter states that the composition
should include:
• a minimum of three members, the majority of
whom must be independent, and
• a Chairman who is an independent Director.

NRW ANNUAL REPORT 2013Corporate Governance Statement38
CORPORATE GOVERNANCE STATEMENTFOR THE YEAR ENDED 30 JUNE 2013
Committee membership is disclosed in the
Directors Report included as part of the
Annual Report along with details of meetings
attended. Membership is consistent with the
composition requirements of the Charter and the
recommendations of the ASXCGC Principles.
During the 2013 fi nancial year two meetings of
the Nomination & Remuneration Committee were
held. Certain responsibilities of the Nomination and
Remuneration Committee were also considered at
Board meetings by the full Board as required.
SELECTION, APPOINTMENT, INDUCTION AND
CONTINUING DEVELOPMENT PROCESSES
Directors must retire at the third AGM following
their election or most recent re-election. At least
one third of Directors must stand for election at
each AGM. Any Director appointed to fi ll a casual
vacancy since the date of the previous AGM must
submit themselves to shareholders for election
at the next AGM. Re-appointment of Directors by
rotation is not automatic (the above retirement
and re-election provisions do not apply to the
Managing Director).
All notices of meeting at which a Director is
standing for election or re-election are accompanied
by information to enable shareholders to make an
informed decision.
As part of the induction process, meetings will
be arranged with other Board members and key
executives prior to the Director’s appointment.
All Directors are expected to maintain the skills
required to discharge their obligations to the
Company. Directors are encouraged to undertake
continuing professional education and where
this involves industry seminars and approved
education courses, to be paid for by the Company
where appropriate.
The skills, experience and expertise relevant to the
position of director held by each director in offi ce
at the date of the Annual Report is set out in the
Directors Report included in the Annual Report.
The Board will undertake an annual performance
evaluation that reviews:
• performance of the Board against the
requirements of the Board Charter;
• performance of Board Committees against the
requirements of their respective Charters;
• individual performances of the Chair, Managing
Director, Directors, and Chief Executive Offi cer and
• The Board Charter, the Committee Charters
and the procedures of the Board with a view to
continuous improvement.
COMPANY SECRETARY
The Company Secretary plays an important role
in supporting the effectiveness of the Board by
monitoring that Board policy and procedures are
followed, and co-ordinating the timely completion
and despatch of board agenda and briefi ng material.
The responsibilities of the Company Secretary are
stated in the Board Charter.
All Directors have access to the Company Secretary.
The appointment and removal of the Company
Secretary is a matter for decision by the Board.
PRINCIPLE 3: PROMOTE ETHICAL AND RESPONSIBLE DECISION MAKING
CODE OF BUSINESS ETHICS AND CONDUCT
NRW has adopted a Code of Business Ethics and
Conduct that applies to its Directors, management
and employees and which seeks to establish the
minimum standards the Board believes are necessary
to maintain the highest level of confi dence for all
stakeholders in the integrity of the NRW group. This
Code is published on the Company’s website.
DIVERSITY POLICY
The Committee is also required to assess the skills,
experience and personal qualities of any candidate
in line with the principles and objectives of the
Company’s Diversity Policy which is available on the
Company website.
NRW currently has no women Directors although
the Company is actively seeking suitable candidates.
The percentage of females in the workforce is
approximately 15.4% and 10% of senior management
are women.
SECURITIES DEALING POLICY
The Board has adopted a Securities Dealing Policy
that is binding on all Directors, employees, contractors,
consultants and advisers to NRW. The Policy is
intended to assist in maintaining market confi dence in
the integrity of dealings in the Company’s securities.

NRW ANNUAL REPORT 2013Corporate Governance Statement 39
CORPORATE GOVERNANCE STATEMENTFOR THE YEAR ENDED 30 JUNE 2013
This Policy is provided to all new employees at
induction. The Company will obtain a periodic
acknowledgement from members of the management
team of their compliance with this policy.
PRINCIPLE 4: SAFEGUARD INTEGRITY IN FINANCIAL REPORTING
AUDIT AND RISK MANAGEMENT COMMITTEE
The Board has established an Audit and Risk
Management Committee to assist the Board in
discharging its oversight responsibilities and
has adopted a formal Charter that sets out the
Committee’s role and responsibilities, composition
and membership requirements.
The role of the Audit and Risk Management
Committee includes:
• reviewing the integrity of management’s
presentation of the Company’s fi nancial position;
• reviewing the integrity of management
reporting on Company performance in all other
key operational compliance areas subject to
external audit; and
• ensuring the independence and competence of
the Company’s external auditors.
In order to assist the Audit and Risk Management
Committee, chartered accountants and business
advisors Grant Thornton have been engaged to
conduct internal audit of systems and processes for
the NRW Holdings Limited Group of companies.
COMPOSITION OF THE COMMITTEE
The Board has determined that the Audit and Risk
Management Committee should comprise:
• at least three members
• a majority of independent Non-Executive Directors
• an independent chair who is not the Chair of the
Board.
In addition, the Audit and Risk Management
Committee should include:
• members who are fi nancially literate
• at least one member with relevant qualifi cations
and experience
• at least one member with an understanding of
the industry in which the entity operates.
Committee membership is disclosed in the
Directors’ Report included as part of the Annual
Report along with details of meetings attended.
Membership is consistent with the composition
requirements of the Charter and the ASX Principles.
The Charter is published on the Company’s
website. The website also contains information on
the procedures for the selection and appointment
of the external auditor and for the rotation of
external audit partners.
PRINCIPLE 5: MAKE TIMELY AND BALANCED DISCLOSURE
The Company is committed to ensuring that:
• all investors have equal and timely access to
material information concerning the Company
– including its fi nancial situation, performance,
ownership and governance
• Company announcements are factual and
presented in a clear and balanced way.
The Board has adopted a Continuous Disclosure
Policy that complies with ASX and other statutory
obligations with the Company Secretary responsible
for external communications.
PRINCIPLE 6: RESPECT THE RIGHTS OF SHAREHOLDERS
The Company is committed to effective
communications with its shareholders, providing
them with understandable and accessible
information about the Company and facilitating
shareholder participation at general meetings.
The Board has established a Shareholder
Communications Policy, its purpose being to set out in
conjunction with the Continuous Disclosure obligations:
• Company strategy;
• strategy implementation; and
• fi nancial results fl owing from the implementation
of Company strategy.
The full Shareholder Communications Policy is
published on the Company website.
ELECTRONIC COMMUNICATIONS
The Company maintains an up-to-date website
on which all ASX and media announcements are
posted. Prior to the AGM shareholders are also

NRW ANNUAL REPORT 2013Corporate Governance Statement40
CORPORATE GOVERNANCE STATEMENTFOR THE YEAR ENDED 30 JUNE 2013
invited to submit questions to the Company through
the offi ce of the Company Secretary.
EXTERNAL AUDITOR’S AGM ATTENDANCE
The external auditor is required to attend the
Company’s AGM and to respond to questions from
shareholders about the conduct of the audit and the
preparation and content of the auditor’s report.
PRINCIPLE 7: RECOGNISE AND MANAGE RISK
RISK MANAGEMENT POLICY
The Company has adopted a Risk Management
Policy, the primary objective of which is to ensure
that the Company maintains an up-to-date
understanding of areas where the Company may
be exposed to risk and compliance issues and
implement effective management of those issues.
This Policy is published on the Company’s website
under the Charter of Audit and Risk Management.
Oversight of Risk Management is undertaken by the
amalgamated Audit and Risk Management Committee.
This Committee assists the Board in its oversight
role by:
• the implementation and review of risk
management and related internal compliance
and control systems;
• monitoring the Company’s policies, programs and
procedures to ensure compliance with relevant
laws, the Company’s Code of Conduct; and,
• the establishment and ongoing review of the
Company’s corporate governance policies,
procedures and practices.
The Board require management to report to it,
directly, or through the Audit and Risk Management
Committee, as to the effectiveness of the Company’s
management of its material business risks.
The Managing Director is required to report to
the Board on the progress of, and on all matters
associated with, risk management. The Managing
Director is to report to the Board as to the
effectiveness of the Company’s material business
risks at least annually.
NRW has established a risk management foundation
that will be developed and enhanced over time to
meet best practice standards including the recent
appointment of an internal auditor.
The Board has received an assurance from the
Managing Director and Chief Financial Offi cer that
there is a sound system of risk management and
internal control and that the system is operating
effectively in all material respects in relation to the
fi nancial reporting risks.
PRINCIPLE 8: REMUNERATE FAIRLY AND RESPONSIBLY
NOMINATION AND REMUNERATION COMMITTEE
The Board has established a Nomination and
Remuneration Committee and adopted a Charter that
sets out the Committee’s role and responsibilities,
composition and membership requirements.
Remuneration responsibilities:
The role of the Nomination and Remuneration
Committee when carrying out its Remuneration
responsibilities includes responsibility for providing
the Board with advice and recommendations
regarding the ongoing development of an executive
remuneration policy that:
• is designed to attract, maintain and motivate
directors and senior management with the aim
of enhancing the performance and long-term
growth of the Company; and
• clearly sets out the relationship between the
individual’s performance and remuneration.
• complies with the reporting requirements
relating to the remuneration of directors and
key executives as required by ASX Listing Rules,
Accounting Standards and the Corporations Act.
The Committee must review the remuneration policy
and other relevant policies on an ongoing basis and
recommend any necessary changes to the Board.
The composition requirements for and membership
of this Committee is consistent with the Charter and
with ASXCGC Principles.
Committee membership is disclosed in the
Directors’ Report included as part of the Annual
Report along with details of meetings attended.
A copy of this Committee’s Charter is on the
Company’s website.

NRW ANNUAL REPORT 2013Corporate Governance Statement 41
CORPORATE GOVERNANCE STATEMENTFOR THE YEAR ENDED 30 JUNE 2013
EXECUTIVE REMUNERATION
The Board periodically reviews executive
remuneration practices with a view to ensuring
there is an appropriate balance between fi xed and
incentive pay, and that the balance refl ects short
and long term performance objectives appropriate
to the Company’s circumstances and goals.
Executive remuneration will be published in the
Remuneration Report in the Company’s Annual
Report each year (including the Remuneration
Report contained in this Annual Report).
NON-EXECUTIVE DIRECTOR REMUNERATION
ASX guidelines for appropriate practice in
Non-Executive director remuneration are that
Non-Executive directors should:
• normally be remunerated by way of fees (in the
form of cash, non-cash benefi ts, superannuation
contributions or salary sacrifi ce into equity)
• not normally participate in schemes designed for
the remuneration of executives
• not receive options or bonus payments
• not be provided with retirement benefi ts other
than superannuation.
The Company’s current practice for remunerating
Non-Executive Directors is consistent with
these guidelines.
The details of Directors’ remuneration are set out in the
Remuneration Report contained in the Annual Report.
REMUNERATION POLICY DISCLOSURES
Disclosure of the Company’s remuneration
policies is best served through a transparent and
readily understandable framework for executive
remuneration that details the costs and benefi ts.
The Company intends to meet its transparency
obligations in the following manner:
• publishing a detailed Remuneration Report in the
Annual Report each year
• continuous disclosure of employment
agreements with key executives where those
agreements, or obligations falling due under
those agreements, may trigger a continuous
disclosure obligation under ASX Listing Rule 3.1.
• presentation of the Remuneration Report to
shareholders for their consideration and non-
binding vote at the Company’s AGM
• taking into account the outcome of the non-
binding shareholder vote when determining
future remuneration policy and,
• providing a response to shareholder questions
on policy where appropriate.

FINANCIAL REPORT
CONTENTS PAGEFINANCIAL REPORT 43
DIRECTORS’ REPORT 45
AUDITOR’S INDEPENDENCE DECLARATION 69
DIRECTORS’ DECLARATION 70
CONSOLIDATED STATEMENT OF PROFIT AND LOSS 71
AND OTHER COMPREHENSIVE INCOME
CONSOLIDATED STATEMENT OF FINANCIAL POSITION 72
CONSOLIDATED STATEMENT OF CHANGES OF EQUITY 73
CONSOLIDATED STATEMENT OF CASH FLOWS 74
NOTES TO THE FINANCIAL STATEMENTS 75
SHAREHOLDER INFORMATION 128
INDEPENDENT AUDITOR REPORT 130
NRW ANNUAL REPORT 201342 Financial Report

NRW ANNUAL REPORT 2013 43Financial Report

NRW ANNUAL REPORT 2013Financial Report44
DIRECTORS’ REPORTFOR THE YEAR ENDED 30 JUNE 2013
The Directors present their report together with the fi nancial report of NRW Holdings Limited (“the
Company”) and of the Consolidated Group (also referred to as “the Group”), comprising the Company and
its subsidiaries, for the fi nancial year ended 30 June 2013.
DIRECTORS
The following persons held offi ce as Directors of NRW Holdings Limited during the fi nancial year and up to
the date of this report:
Name Status Qualifi cations, special responsibilities and other Directorships
Dr Ian
Burston
Chairman
Independent
Non-Executive
Director
Dr Ian Burston was appointed as a Director and Chairman on 27 July 2007.
His career includes former positions as Managing Director of Portman
Limited, Managing Director and Chief Executive Offi cer of Aurora Gold Ltd,
Chief Executive Offi cer of Kalgoorlie Consolidated Gold Mines Pty Ltd, Vice
President – WA Business Development of CRA Ltd and Managing Director of
Hamersley Iron Pty Ltd. He was a Non-Executive Director of the Esperance
Port Authority for ten years, Chairman of the Broome Port Authority and
Executive Chairman of Cape Lambert Iron Ore Ltd.
Dr Burston is currently a Non-Executive Director of Mincor Resources NL,
Kansai Mining Corporation and Kogi Iron Limited.
Dr Burston has a Bachelor of Engineering (Mech) degree from Melbourne
University and a Diploma in Aeronautical Engineering from Royal Melbourne
Institute of Technology. He has completed the Insead Management Course in
Paris and the Harvard Advanced Management Program in Boston.
He was awarded the Western Australian Citizen of the Year (category of
Industry and Commerce) in 1992, the Order of Australia (General Division) in
1993 and an Honorary Doctor of Science (Curtin) in 1995.
Dr Burston has held the following directorships of listed companies in the
three years immediately before the end of the fi nancial year:
• Non-Executive Director, Mincor Resources NL (Current)
• Non-Executive Director, Kogi Iron Limited (Current)
• Non-Executive Director, Kansai Mining Corporation (Current)
• Non-Executive Director, Fortescue Metals Group (Resigned 2011)
Julian
Pemberton
Chief
Executive
Offi cer and
Managing
Director
Mr Pemberton was appointed as a Director on 1 July 2006. Appointed as
Chief Executive Offi cer and Managing Director 7 July 2010.
He has over 25 years of experience in business, sales and management in
both Australia and the United Kingdom. Mr Pemberton joined NRW in 1997
and initially worked on site before progressing into the sales and hire area. He
has held roles as Operations Manager, General Manager and Chief Operating
Offi cer for NRW prior to his current role.

NRW ANNUAL REPORT 2013Financial Report 45
DIRECTORS’ REPORTFOR THE YEAR ENDED 30 JUNE 2013
Name Status Qualifi cations, special responsibilities and other Directorships
Michael
Arnett
Non-Executive
Director
Mr Arnett was appointed as a Director on 27 July 2007.
Mr Arnett is a former partner of and member of the Board of Directors and
national head of the Natural Resources Business Unit of the law fi rm Norton
Rose (formally Deacons). Michael has been involved in signifi cant corporate and
commercial legal work for the resource industry for over 20 years.
Mr Arnett is currently Chairman and a Non-Executive Director of New Guinea
Energy NL.
Mr Arnett has held the following directorships of listed companies in the three
years immediately before the end of the fi nancial year:
• Chairman, New Guinea Energy NL (Current)
• Non-Executive Director, Nexus Energy Limited (Resigned 2012)
• Non-Executive Director, Global Resources Corporation Limited (Resigned 2011)
John Cooper Non-Executive
Director
Mr Cooper was appointed as a Director on 29 March 2011.
Mr Cooper has held a range of very senior executive management and Board
roles associated with development of major capital works throughout Australia
and internationally.
In 21 years with Concrete Constructions, Mr Cooper project managed major
construction projects and was in charge of the group’s South East Asian and
Australian operations. He also headed CMPS&F, a design engineering and
project management organisation specialising in oil and gas pipelines and
compressor stations, mining and mine design, infrastructure and environmental
contracts in Australia and South East Asia.
Mr Cooper held a role with the Sydney Olympic Games Organising Committee,
responsible for all contingency planning and technology/Games management.
In August 2006, Mr Cooper was appointed by the South African conglomerate,
Murray and Roberts Ltd, as its representative and Deputy Chairman on the
Clough Limited Board, formulating overall strategy for the business and taking
on an interim CEO position until a new management team was put in place in
the restructured organisation.
In 2007 Mr Cooper was appointed to Murray and Roberts’ international board
which was responsible for group operations outside of South Africa, including
the Middle East, Canada, Australia and the United Kingdom. After retiring from
the Murray and Roberts Group in 2010 he was subsequently appointed to the
advisory council to the Bilfi nger Berger Services group to assist in strategy and
management development and planning.
Mr Cooper has held the following directorships of listed companies in the three
years immediately before the end of the fi nancial year:
• Non-Executive Director and Chairman, Southern Cross Electrical
Enigineering Limited (Current)
• Non-Executive Director, Aurizon Holdings Limited (Current)
• Non-Executive Director, Flinders Mines Limited (Resigned 2012)
• Non-Executive Director, Neptune Marine Limited (Resigned 2013)

NRW ANNUAL REPORT 2013Financial Report46
DIRECTORS’ REPORTFOR THE YEAR ENDED 30 JUNE 2013
COMPANY SECRETARY
Mr Kim Hyman was appointed to the position of
company secretary on 10 July 2007. Mr Hyman has
responsibility for company secretarial services and
coordination of general legal services, as well as the
risk management portfolio.
DIRECTORS’ MEETINGS
The number of Directors’ meetings and number of
meetings attended by each of the Directors of the
Company during the fi nancial year are:
Director Directors’ Meetings Attended
Directors’ Meetings Held
Ian Burston 8 8
Julian Pemberton 8 8
Michael Arnett 8 8
John Cooper 8 8
During the 2013 fi nancial year two meetings of
the Nomination & Remuneration Committee were
held. Certain responsibilities of the Nomination and
Remuneration Committee were also considered at
Board meetings by the full Board as required.
The Audit and Risk Management Committee met
in conjunction with each Board Meeting held. The
members of this Committee are Michael Arnett
(Chairman), Ian Burston and John Cooper
PRINCIPAL ACTIVITIES
The principal continuing activities of the Group,
comprising the Company and the entities that it
controlled during the fi nancial year, were:
• civil contracting services
• mining services
• equipment sales
• fabrication, quarantine and repair services
• drilling and blasting services.
REVIEW OF OPERATIONS AND RESULTS
The net profi t after tax of the consolidate entity for
the year was $74.11 million (2012: $97.1 million).
A review of the operations and results for the Group
for the fi nancial year to 30 June 2013, as well as
information on the fi nancial position of the Group, is
set out in the Year in Review on pages 7 to 30 in this
Annual Financial Report.
STATE OF AFFAIRS
There were no signifi cant changes in the state of
affairs of the Company or the Group during the
fi nancial year.
SIGNIFICANT EVENTS AFTER YEAR END
No matter or circumstance has arisen since the end
of the fi nancial year that has signifi cantly affected,
or may signifi cantly affect, the Group’s operations,
the results of those operations, or its state of affairs
in future fi nancial years.
LIKELY DEVELOPMENTS
Likely developments in the Group’s operations
in future fi nancial years and the expected results
of those operations are reported, as appropriate,
in the Year in Review on 7 to 30 in this Annual
Financial Report.
ENVIRONMENTAL REGULATIONS
The Group holds various licenses and is subject
to various environmental regulations. No known
environmental breaches have occurred in relation to
the Group’s operations.
DIVIDENDS
A fully franked interim dividend of $0.08 per ordinary
share was paid during the fi nancial year ended
30 June 2013 (2012: $0.08 per ordinary share).
The Directors have declared a fully franked fi nal
dividend of $0.05 per ordinary share, in relation to
30 June 2013, payable on 29 October 2013 (2012:
$0.10 per ordinary share).

NRW ANNUAL REPORT 2013Financial Report 47
DIRECTORS’ REPORTFOR THE YEAR ENDED 30 JUNE 2013
DIRECTORS’ INTERESTS
As at the date of this report, the relevant interest
of each Director in the ordinary share capital of the
Company was:
Director Ordinary Shares (NWH)
Julian Pemberton 2,936,583
Ian Burston 329,492
John Cooper 55,000
Michael Arnett 280,474
Transactions between entities within the Group and
Director-related entities are set out in Note 36 to
the fi nancial statements.
OPTIONS OVER UNISSUED SHARES OR INTERESTS
Other than those mentioned in the remuneration
policy, there were no options for ordinary shares on
issue during the fi nancial year, and none had been
granted or were on issue as at the date of this report.
PERFORMANCE RIGHTS OVER UNISSUED SHARES
OR INTERESTS
As at the date of this report, there are 1,807,552
Performance Rights on issue by the company. During
the year 96,849 (2012: 1,710,703) Performance
Rights were issued to Key Management Personnel
(KMP) under the terms of the Company’s Long-Term
Incentive (LTI) Plan as approved by shareholders
on 23 November 2011 and since the end of the
fi nancial period, no performance rights were
forfeited or cancelled.
Performance Rights have no exercise price on
vesting and upon exercise result in the issuance
of ordinary shares. No performance rights holder
has any right under the terms of the performance
rights to participate in any other share issue of the
Company.
Details of Performance Rights granted to Executives
as part of their remuneration are set out in the
Remuneration Report on pages 51 to 68.
AUDITOR
The Company’s auditor is Deloitte Touche
Tohmatsu who was appointed at the AGM held on
November 28, 2007.
During the fi nancial year there were no offi cers
of the Company who were former partners or
directors of Deloitte.
AUDITOR’S INDEPENDENCE AND NON-AUDIT
SERVICES
The Directors received the Auditor’s Independence
Declaration from the auditor of the Company, which
is included on page 69 of this report.
Details of amounts paid or payable to the auditor
for non-audit services provided during the
year are outlined in Note 38 page 125 to the
fi nancial statements.
The Directors are satisfi ed that the provision of
non-audit services, during the year, by the auditor
(or by another person or fi rm on the auditor’s
behalf) is compatible with the general standard
of independence for auditors imposed by the
Corporations Act 2001.
The Directors are of the opinion that the services
as disclosed in Note 38 (page 125) to the fi nancial
statements do not compromise the external
auditors’ independence, based on advice received
from the Audit and Risk Management Committee,
for the following reasons:
• All non-audit services have been reviewed and
approved to ensure that they do not impact the
integrity and objectivity of the auditor; and
• None of the services undermine the general
principles relating to auditor independence as
set out in Code of Conduct APES 110 Code of
Ethics for Professional Accountants issued by
the Accounting Professional & Ethical Standards
Board, including reviewing or auditing the
auditor’s own work, acting in a management
or decision making capacity for the Company,
acting as advocate for the Company or jointly
sharing economic risks and rewards.

NRW ANNUAL REPORT 2013Financial Report48
DIRECTORS’ REPORTFOR THE YEAR ENDED 30 JUNE 2013
INDEMNIFICATION AND INSURANCE OF OFFICERS AND AUDITORS
The Company has executed a deed of access, indemnity and insurance in favour of each Director. The indemnity
requires the Company to indemnify each Director for liability incurred by the Director as an offi cer of the
Company subject to the restrictions prescribed in the Corporations Act 2001. The deed also gives each Director a
right of access to Board papers and requires the Company to maintain insurance cover for the Directors.
The Company has also executed an indemnity and insurance deed in favour of certain executives of the
Company. The deed requires the Company to indemnify each of these executives for liability incurred by
them as executives of NRW subject to the restrictions prescribed in the Corporations Act 2001. The deed
also requires the Company to maintain insurance cover for these executives. The total amount of insurance
premiums paid during the fi nancial year was $252,546 (2012: $259,208.).
The Company has not otherwise, during or since the end of the fi nancial year, except to the extent permitted
by law, indemnifi ed or agreed to indemnify an offi cer or auditor of the Company or of any related body
corporate against a liability incurred as such an offi cer or auditor.

NRW PTY LTD
ABN: 69 828 799 317 181 Great Eastern Highway, Belmont, Western Australia 6104 PO Box 592, Welshpool, Western Australia 6986
Tel +61 (0)8 9232 4200 Fax +61 (0)8 9232 4234 Web www.nrw.com.au
Holdings Limited
Civil & Mining 181 Great Eastern Highway, Belmont, Western Australia 6104 PO Box 592, Welshpool, Western Australia 6986
Tel +61 (0)8 9232 4200 Fax +61 (0)8 9232 4234
50 Belgravia Street, Belmont, Western Australia 6104 PO Box 692, Belmont, Western Australia 6984
Tel +61 (0)8 9232 4306 Fax +61 (0)8 9232 4432
103 Stirling Crescent, Hazelmere, Western Australia 6055 Po Box 1189, Midland, Western Australia, 6936
Tel +61 (0)8 9274 1736 Fax +61 (0)8 9274 5684
21 August 2013
Dear Shareholders,
Yours sincerely,
Michael ArnettChairmanNomination & Remuneration Committee
The NRW Nomination and Remuneration Committee (N&RC) and NRW Board are pleased to present the 2013 Remuneration Report. This report explains the remuneration programme that NRW has applied over the last 12 months. These programmes ensure NRW can maintain and extend our competitive position through retaining its key executives and attracting best-in-market executives to our Company. We have developed these programmes to ensure a strong link between executive key management personnel (Executive KMP) incentives and three core components of shareholder value – NRW maintaining its competitive position and strength, growth in earnings and ensuring that capital utilised to grow earnings achieves an attractive Return on Capital Employed (ROCE).
For the 2013 year, key remuneration outcomes can be summarised as follows:
Fixed remuneration for Executive KMP was reviewed and it was determined that no changes would be made, however the level of fixed remuneration will be reviewed at the interim result. Performance based remuneration was significantly diminished in light of outcomes relating to key
measures including Earnings Per Share Growth and relative Total Shareholder Return. The number of Long Term Incentive (LTI) awards and Short Term Incentive (STI) awards granted has been reduced in respect of NRW’s performance in FY13. The Non-Executive Director fee pool is unchanged following the increase at the 2012 AGM.
Further detail regarding the components and outcomes of NRW’s remuneration programme are set out in the Remuneration Report.
NRW is committed to ensuring the remuneration programme we have in place supports our growth profile and business strategy, takes into account the characteristics and conditions of the markets we work in and takes into account the views of our shareholders.
NRW ANNUAL REPORT 2013Financial Report 49
DIRECTORS’ REPORTFOR THE YEAR ENDED 30 JUNE 2013
LETTER FROM THE NOMINATION & REMUNERATION COMMITTEE CHAIR - UNAUDITED

NRW ANNUAL REPORT 2013Financial Report50
DIRECTORS’ REPORTFOR THE YEAR ENDED 30 JUNE 2013
REMUNERATION REPORT (AUDITED)
The information provided in this report has been prepared based on the requirements of the Corporations
Act 2001 and the applicable accounting standards. The report has been audited. The report outlines the
remuneration arrangements for the company for the period to 30 June 2013 for the following individuals,
who are the Key Management Personal (KMP) of the company:
Name Position held Resigned/Appointed
Non-Executive Directors
Dr I Burston Chairman and Non-Executive Director Appointed as Non-Executive Director, 27 July 2007
Mr J Cooper Non-Executive Director Appointed as Non-Executive Director, 29 March 2011
Mr M Arnett Non-Executive Director Appointed as Non-Executive Director, 27 July 2007
Executive Director
Mr J Pemberton Managing Director and Chief Executive Offi cerAppointed as a Director of the Company 1 July 2006 and as Chief Executive Offi cer 7 July 2010.
Executives
Mr W Rooney Managing Director – NRW Civil & Mining Appointed 1 October 2008
Mr M Stewart General Manager – NRW Civil Appointed 1 July 2008
Mr T Cook General Manager – NRW Mining – WA, NT and Overseas Appointed 30 May 2011 - Resigned 7 December 2012
Mr T Raschella Acting Chief Financial Offi cer Acting appointment 7 August 2013.
Mr W Fair General Manager – Action Drill & Blast Pty Limited Appointed 1 March 2012
Mr M Wallace Chief Financial Offi cer Appointed 8 December 2008 - Left on 7 August 2013
Mr K Hyman Company Secretary, Risk Management & Legal Appointed 10 July 2007
The report refers to both Non-Executive Directors and Executive KMP. Unless noted Executive Directors are
included in discussion of Executive KMP.
The Remuneration Report is divided into the following sections:
Section Page
1. Remuneration Governance 52
2. Five Year Snapshot 53
3. Executive KMP Remuneration Arrangements 53
4. Executive KMP Remuneration Outcomes 58
5. Non-Executive Director Remuneration 65
6. Other Statutory Disclosures 66

NRW ANNUAL REPORT 2013Financial Report 51
DIRECTORS’ REPORTFOR THE YEAR ENDED 30 JUNE 2013
GLOSSARY
The following terms used throughout our Remuneration Report are defi ned here:
ASX Australian Securities Exchange
EPS Earnings Per Share
Executive KMP Executive full time employees of NRW that are Key Management Personnel, i.e. KMP excluding Non-Executive Directors
FY12 The fi nancial year ending 30 June 2012
FY13 The fi nancial year ending 30 June 2013
FY14 The fi nancial year ending 30 June 2014
KMP Key Management Personnel according to the defi nition of that term in the Corporations Act 2001 (Cth), including Non-Executive Directors
LTI Long Term Incentive
N&RC Nomination and Remuneration Committee
NRW NRW Holdings Limited
NRW Performance Rights Plan The Performance Rights plan of NRW approved by shareholders in general meeting on 23 November 2011
Performance Right A right that converts into one ordinary share in NRW on the meeting of the specifi ed Vesting Conditions on the specifi ed vesting dates
Relative TSR Relative Total Shareholder Return
ROCE Return on Capital Employed
STI Short Term Incentive
Vesting Conditions The Vesting Conditions that apply to the vesting of Performance Rights granted by NRW to its Executive KMP under the NRW Performance Rights Plan
VWAP Volume Weighted Average Price of NRW ordinary shares quoted on the ASX
1. REMUNERATION GOVERNANCE
NRW has established a Nomination and Remuneration Committee (N&RC) consisting of Michael Arnett, Ian
Burston and John Cooper, being all of NRW’s independent Non-Executive Directors. The N&RC is responsible
for making recommendations to the Board on the remuneration arrangements for Non-Executive Directors
and Executive KMP as set out in the N&RC Charter. The N&RC provides advice, recommendation and
assistance to the Board with respect to:
• The remuneration of Non-Executive Directors, including the Chair of the Board;
• The remuneration policies which are designed to attract and retain Executives with the expertise to
enhance the competitive advantage, performance and growth of NRW;
• Ensuring that the level and composition of Executive remuneration packages are fair, reasonable and adequate,
and display a clear relationship between the performance of the individual and performance of NRW;
• Termination and redundancy policies and the payments made to outgoing Executives;
• Disclosures to be included in the corporate governance section of NRW’s annual report which relate to
NRW’s remuneration policies and procedures.
The N&RC is mandated to engage external and independent remuneration advisors who do not have a
relationship with or advise NRW management. During the reporting period the N&RC did not engage any
such advisors. However during this period the N&RC took an active role in meeting and liaising with some of

NRW ANNUAL REPORT 2013Financial Report52
DIRECTORS’ REPORTFOR THE YEAR ENDED 30 JUNE 2013
NRW’s shareholders as well as shareholder proxy groups to discuss directly their views in respect of market
remuneration practices, NRW’s remuneration programme and how the market practices can be best applied
to NRW’s remuneration programme.
The N&RC met twice during the reporting period.
2. FIVE YEAR SNAPSHOT
Measure 2013 2012 2011 2010 2009
Market Capitalisation (30 June) $ 253.8 million $842.2 million $778.1 million $246.2 million $238.7 million
Share Price at end of year $0.91 $3.02 $2.79 $0.98 $0.95
Share Price at beginning of year $3.02 $2.79 $0.98 $0.95 $1.95
Total Revenue $ 1,374.4 million $1,360.8 million $751.2 million $615.6 million $519.0 million
EBITDA $168.3 million $195.9 million $95.5 million $87.5 million $81.2 million
EPS 26.6 cents 34.8 cents 16.1 cents 14 cents 15 cents
EPS Growth (23.3%) 116% 15% (7%) 10%
Net Profi t After Tax $ 74.1 million $97.1 million $41.2 million $35.1 million $37.1 million
Return on Capital Employed 30.9% 44.6% 29.6% 31.4% 32.3%
Interim Dividend paid $0.08 $0.08 $0.04 $0.03 $0.01
Final Dividend declared in respect of the year $0.05 $0.10 $0.05 $0.03 $0.01
Annual Total Shareholder Return (%) (67%) 15% 194% 9% (50%)
3. EXECUTIVE KMP REMUNERATION ARRANGEMENTS
3.1 EXECUTIVE KMP REMUNERATION STRATEGY & MIX
NRW’s executive remuneration programme has the following over-arching principles:
• Set remuneration policy and positioning to maintain and extend NRW’s competitive advantage and
positioning: NRW believes that its fi xed and at-risk remuneration must be in the top quartile of competitive
benchmarking in order to attract and retain best-in-market individuals as its Executive KMP. The Board
believes that this approach is also required given the relatively small pool of experienced executive talent
that exists in the industry and markets in which NRW competes. NRW’s view is that this positioning is
fundamental to maintaining NRW’s competitiveness, fi nancial performance leadership relative to peers and
leadership in customer satisfaction with projects that NRW delivers.
• Adapt market practice, benchmark to direct competitors, relate to the risk and competitive
environment: The industry and markets that NRW competes in have signifi cantly different operating risks
and a signifi cantly smaller pool of experienced talent compared to companies with a market capitalisation
similar to NRW’s market capitalisation (+/- 50%). Accordingly whilst NRW’s remuneration programme
takes account of relevant market practices, benchmarking of individual positions are weighted heavily
to directly comparable companies and competitors, as opposed to the data of similar sized companies.
Remuneration policies in general are overlaid with and take account of the risks in and competitive nature
of NRW’s operating environment.
• Ensure at-risk remuneration is set against demanding levels that themselves are balanced to the long
term stability of the Company: NRW’s approach to at-risk remuneration for both STI and LTI awards is that
achievement of budgeted levels of performance result in only modest incentive awards and that demanding
levels of performance are required to deliver what would be a top-quartile remuneration outcome for a

NRW ANNUAL REPORT 2013Financial Report 53
DIRECTORS’ REPORTFOR THE YEAR ENDED 30 JUNE 2013
given KMP member. Whilst the demanding levels
of performance are predominantly quantitative /
fi nancial in nature, the targets take into account
the quality of fi nancial outcomes. That is, they
are structured to ensure that executives pursue
growth in a way that does not compromise the
value of NRW in the medium to long term. For
example, NRW pays attention to ROCE metrics
to ensure that EPS Growth is pursued with a keen
eye to minimising the amount of capital that must
be utilised to generate EPS Growth.
• Proportions of fi xed and variable remuneration
should weight toward variable as performance
levels increase: Maximum award levels are
structured to ensure that at the maximum level of
remuneration there is a signifi cant weighting to
variable (STI and LTI) components of remuneration.
This weighting is increased the more senior the role
and the higher the level of responsibility that the
individual has for earnings, personnel and strategy.
The relative mix of STI to LTI is also considered in
the context of the nature and level of responsibility
of the individual’s role, the desire of the Company
to have its Executive KMP owning NRW shares and
also succession planning requirements.
3.2 STRUCTURE OF EXECUTIVE KMP
REMUNERATION
The NRW remuneration programme and
consequently the remuneration components for
each Executive KMP member comprise:
• Fixed remuneration: comprising salary, benefi ts
that the individual elects, superannuation and
applicable taxes. Fixed remuneration is set with
reference to role, market and relevant experience,
which is reviewed annually and upon promotion. In
determining the appropriate remuneration quantum,
the N&RC reviews information from databases to
which NRW subscribes: Aon Hewitt McDonald
Australia, CRA Plan Advisors, available market data
for direct competitors, companies of a similar size to
NRW (based on market capitalisation) and similar
industry (i.e. Capital Goods, Energy and Materials,
Metals and Mining, Oil, Gas and Consumable Fuels
industry group companies). This comparator
group is deemed to be appropriate as it represents
the companies from whom talent is likely to be
recruited, and to whom talent may be lost, and
therefore competitive remuneration against these
groups is assessed in setting fi xed remuneration
levels for NRW’s key management personnel.
• Short term incentive (STI): determination of an
STI award is made against annual performance
criteria established at the beginning of each
fi nancial year. STI awards are typically payable in
cash. At the election of the N&RC, the after tax
amount of a portion of an STI award might in some
circumstances be paid in ordinary NRW shares.
This may occur, for example, where an individual
has achieved a high nominal STI award, or where
the balance of an overall award (inclusive of fi xed
remuneration, STI and LTI) is overweight in STI. Any
portion of an STI can be deferred by the N&RC in
its discretion with or without conditions extending
beyond continued employment. Performance
thresholds relating to STI awards are discussed
further in Section 4 (page 58)
• Long term incentive (LTI): An award of LTI is
granted via Performance Rights under the NRW
Performance Rights Plan. Any Performance
Rights granted are subject to Vesting Conditions
and vesting periods – these are discussed further
below in Section 4. The 2012 fi nancial year award
was intended as a transitionary award that
provided for vesting in three tranches over three
successive years. From the 2013 fi nancial year
onwards the LTI award vests over a three-year
performance period in one tranche. Executive
KMP are not eligible to participate in dividends
during the vesting period.
Determination of an LTI award quantum is
made against the same annual performance
criteria that apply to STI awards – these are
discussed further in Section 4. An LTI award
quantum is then converted into a number of
Performance Rights determined by dividing
the quantum of the LTI award by the 60-day
VWAP of the NRW share price as of the day that
NRW announced its prior fi nancial year full-year
result. For example, to determine the number
of awards for the 2013 fi nancial year LTI, the LTI
quantum will be divided by the 60-day VWAP
of the NRW share price on the day on which
NRW announced its FY12 result to the ASX (i.e.
on 24 August 2012 using VWAP of $2.9605),
Performance Rights granted are then subjected
to Vesting Conditions that are tested on the
applicable vesting date.

NRW ANNUAL REPORT 2013Financial Report54
DIRECTORS’ REPORTFOR THE YEAR ENDED 30 JUNE 2013
As noted above STI and LTI awards are determined with reference to achievement against annual
performance criteria and are based on a percentage of fi xed remuneration.
3.3 AWARD LEVELS RELATIVE TO FIXED REMUNERATION
The following table sets out the range of award that Executive KMP were eligible for in FY13 under the STI
and LTI components of NRW’s remuneration structure:
STI Award as % Fixed Remuneration LTI Award as % Fixed Remuneration
Maximum Award at Target level of
Performance
Maximum Award at Demanding level of
Performance
Maximum Award at Target level of
Performance
Maximum Award at Demanding level of
Performance
Chief Executive Offi cer 20% 55% 50% 150%
Managing Director – NRW Civil & Mining 20% 70% 30% 80%
Divisional General Managers, CFO 20% 70% 10% 60%
Any determination of an award following the completion of a fi nancial year is based on:
1. The performance of an individual according to annual performance criteria set by the N&RC before
the end of the fi rst quarter of a fi nancial year and measured against NRW’s audited results for that
fi nancial year (where available);
2. Recommendations made to the N&RC by the CEO in respect of Executive KMP reporting to the CEO;
3. The N&RC’s consideration and recommendation to the Board of NRW;
4. The Board of NRW exercising its discretion in respect of STI and LTI awards within the boundaries of
the maximum payment levels and the terms and conditions of the NRW Performance Rights Plan.
3.4 DETAILS OF INCENTIVE PLANS
STI and LTI Awards
Annual STI and LTI awards are determined against the same performance criteria. There is no automatic eligibility
for the LTI. The initial performance criteria sets the quantum of the LTI award, which is then further subject to
certain performance conditions (EPS growth, ROCE and relative TSR). The specifi cs and detail of the criteria
are set by the N&RC before the end of the fi rst quarter in each fi nancial year and are shaped for each Executive
KMP member according to their specifi c role and responsibilities. The criteria comprise the following types of
measures and indicative weightings:
• Financial measures – 80% weighting: Within this limb of the criteria targets are set at group and business
unit levels. Typically, for a divisional General Manager, the Group target will be weighted as to 20-30%,
and the business unit targets will be weighted as to 50-60%. The annual criteria will be set according
to the overall Group targets and strategy, business unit targets and strategy and specifi c areas within
each division that the Group executive determine require focus in that year. The criteria are revenue,
contribution margin, net profi t after tax (Group), asset utilisation, cost ratios, order book quantum and
tenure and capital expenditure management.
• Safety measures – 10% weighting: Safety targets, and in particular NRW’s Lost Time Injury Frequency
Rate (LTIFR) are set according to NRW’s Group safety targets, which in turn play a key part in NRW’s
ability to maintain and secure demand for NRW’s services.
• Personal measures – 10% weighting: Personal criteria relate to targets that are specifi c to an individual’s
non-fi nancial performance, career development and leadership qualities. Whilst these targets are personal
to the individual, they may include such measures focusing on areas required for leadership development,

NRW ANNUAL REPORT 2013Financial Report 55
DIRECTORS’ REPORTFOR THE YEAR ENDED 30 JUNE 2013
staff turnover, succession planning requirements, strategic planning goals and outcomes.
3.5 LTI VESTING CONDITIONS
NRW has two LTI awards in place, being awards granted in FY12 and awards granted in the current reporting
period (FY13).
The vesting criteria applicable to both LTI awards and the subsequent granting of Performance Rights under the
NRW Performance Rights Plan are as follows:
• EPS Growth – 40% weighting: EPS is a primary determinant of shareholder value in a listed company
context. As such NRW views EPS Growth as an important metric for NRW KMP to focus on. EPS Growth
is measured over the period that the vesting applies to. For example, an LTI award made in respect of
FY13 will be measured as to growth in NRW’s EPS at the beginning of FY13 (end of FY12) to NRW’s EPS
at the end of FY15.
• ROCE – 30% weighting: As NRW’s business necessarily involves capital expenditures, in order to balance
EPS Growth, NRW has adopted a ROCE measure to ensure that EPS and EPS Growth are being pursued
with a keen eye on the amount of capital employed in generating net profi t after tax and thereby EPS.
ROCE is determined according to the following formula:
Earnings before interest tax and abnormals / (Average Net Assets – Average Cash + Average Debt – Average Intangibles)
• Relative TSR – 30% weighting: NRW benchmarks its Total Shareholder Return (TSR) to ten direct competitors.
Where insuffi cient competitors are listed on the ASX, NRW will assess companies that have similar degrees of
complexity, personnel management, risk, revenue and turnover to NRW. The companies that NRW measures its
Relative TSR against in respect of the FY12 LTI Award are; Ausenco Limited, Clough Limited, Macmahon Holdings
Limited, Ausdrill Limited, Downer EDI Limited, Sedgman Limited, Decmil Group Limited, Brierty Limited, Maca
Limited and Watpac Limited (FY12 Comparator Group). For FY13 NRW has used a comparator group that is the
same as the FY12 Comparator Group except that Brierty Limited and Watpac Limited have been removed. The
size and comparative strength of these companies warranted their removal and substitution by Bradken Limited
and Transpacifi c Industries Limited, which the Board felt better represented comparator companies, given their
market capitalisation, service delivery, capital goods utilisation and employee numbers.
The following table sets out the vesting period cut-in and scaling of each of the vesting hurdles for the FY12
and FY13 awards:
LTI Vesting Condition, Weighting
FY12 LTI Award FY13 LTI Award
Cut-in level Maximum vestingachieved at
Cut-in level Maximum vestingachieved at
EPS Growth, Weighting 40%
0% vesting at 4% EPSgrowth between last
vesting date and currentvesting date
100% of the EPS Growthlimb vesting at 10% EPS
growth between lastvesting date and current
vesting date
0% vesting at 4% EPSgrowth between last
vesting date and currentvesting date
100% of the EPS Growthlimb vesting at 12% EPS
growth
ROCE, Weighting 30%
0% vesting at 17%ROCE for most recently
completed fi nancial year date
100% of the ROCE limbvesting at 25% ROCE for
most recently completed fi nancial
year date
0% vesting at less than 19.99% ROCE for most
recently completed fi nancial year date
100% of the ROCE limbvesting at 30% ROCE
Relative TSR, Weighting 30%
A TSR ranking 6th position or worse will result in 0% vesting,
A TSR ranking 3rd position or better = 100% of the Relative
TSR limb vests,
A TSR ranking 6th position or worse will result in 0% vesting,
A TSR ranking 3rd position or better = 100% of the Relative
TSR limb vests,

NRW ANNUAL REPORT 2013Financial Report56
DIRECTORS’ REPORTFOR THE YEAR ENDED 30 JUNE 2013
NRW has selected the three Vesting Conditions
discussed above on the following basis:
• EPS Growth is a fundamental measure of growth
in shareholder value;
• However, to ensure that EPS growth is pursued
with a focus on the amount of capital required
to generate EPS or NPAT, Return on Capital
Employed (ROCE) is measured to ensure that
the growth in EPS is achieved at or above NRW’s
targeted levels of ROCE;
• Relative Total Shareholder Return, whilst in
NRW’s view is something that is infl uenced by
the investing methodologies of investors that
invest in shares of companies listed on the
Australian Securities Exchange as opposed to
the performance of NRW and its executives
per se, NRW believes that it is important for
the performance of its management to be
measured against the total shareholder return
that is achieved by direct competitor and
peer companies that face a similar operating
environment, opportunities and risks as NRW.
3.6 LTI VESTING PERIOD
Performance Rights granted under the FY12 LTI
award are eligible to vest in three tranches as follows:
• 34% on 15 September 2012,
• 33% on 15 September 2013, and
• 33% on 15 September 2014, subject to the
performance of and testing against the
Vesting Conditions.
The Performance Rights granted under the FY13 LTI
awards will be eligible to vest in a single tranche on
15 September 2015, subject to the performance of
and testing against the Vesting Conditions.
Any Performance Rights that are eligible to vest
on a vesting date that do not meet the Vesting
Conditions, lapse on that date and thereby are not
eligible to vest at any subsequent date.
3.7 OTHER CONSIDERATIONS APPLICABLE TO LTI
AWARDS & PERFORMANCE RIGHTS
If a KMP’s employment with NRW ceases for
reasons other than death or permanent disability,
any unvested Performance Rights will lapse
and expire. Where a KMP has died or becomes
permanently disabled, or where the Board of NRW
considers it appropriate in the circumstances to
consider the vesting of any unvested shares, the
Board may determine that the Performance Rights
will not lapse and will be tested against the Vesting
Conditions on the applicable vesting dates.
Upon change of control occurring in respect of
NRW, the number of Performance Rights that can
vest will be reduced to refl ect the period of time
elapsed. For example if a takeover of NRW becomes
unconditional two years after a grant of Performance
Rights was made and that award was eligible for
vesting at the third anniversary of it being granted,
then two-thirds of the Performance Rights that were
eligible to vest under that grant would be assessed
against the Vesting Conditions up to the date of
the takeover becoming effective. The Performance
Rights which do not meet the Vesting Conditions at
that point will lapse and expire.
3.8 EXECUTIVE SERVICE AGREEMENTS
The Executive Service Agreements in place in respect
of NRW’s KMP can be summarised as follows:
• Are not fi xed term agreements and continue on
an ongoing basis until terminated;
• Contain non-compete provisions restraining the
executives from operating or being associated
with an entity that competes with the business
of NRW in Western Australia for 12 months
after termination;
• Provide for remuneration to be reviewed annually
by NRW;
All Executive KMP as listed in the remuneration
table, are employed on standard letters of
appointment that provide for annual reviews of
base salary and between four and 12 weeks notice
of termination by either party. The appointments
are not for any fi xed term and carry no termination
payments other than statutory entitlements.
Remuneration for all KMP listed is determined by
the N&RC under the guidelines contained in this
remuneration report.

NRW ANNUAL REPORT 2013Financial Report 57
DIRECTORS’ REPORTFOR THE YEAR ENDED 30 JUNE 2013
4. EXECUTIVE KMP REMUNERATION OUTCOMES
4.1 EXECUTIVE KMP TOTAL EARNINGS IN 2013
The following table shows the earned remuneration for NRW’s Executive KMP for the year ending
30 June 2013. The table includes fi xed remuneration, short term incentive earned for FY13 performance
and vesting of the second tranche of the FY12 LTI grant. The value attributed to the equity amounts (ie. LTI
grant) is based on the number of shares that were issued multiplied by the closing share price at the last
trading day of FY13. Note the value actually received by individuals differs from the remuneration outlined on
page 63 (which is based on accounting values).
Name Fixed remuneration(1) FY 13 STI Cash Paid FY12 LTI Shares Awarded
Total Actual Remuneration Earned in 2013
Mr J Pemberton 1,415,371 37,125 75,800 1,528,296
Mr M Wallace 525,773 - - 525,773
Mr M Stewart 818,706 151,656 19,060 989,422
Mr W Rooney 998,502 17,337 31,391 1,047,230
Mr K Hyman(2) 403,165 - - 403,165
Mr T Cook 453,177 - - 453,177
Mr W Fair 450,521 48,233 6,619 505,373
(1) Fixed remuneration includes cash salary, movement in annual leave, superannuation, and non-monetary benefi ts
(2) Mr Hyman, whilst being a KMP, is not eligible for LTI awards due to his role carrying no responsibility for revenue, earnings and earnings quality results
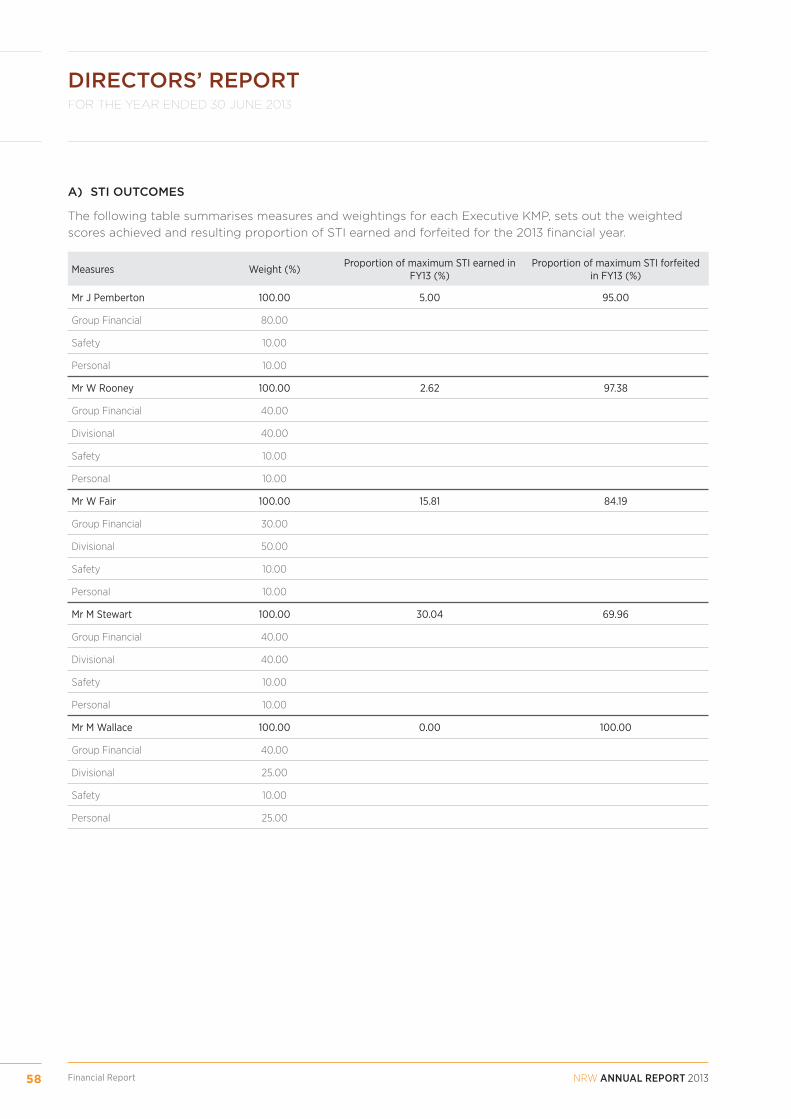
NRW ANNUAL REPORT 2013Financial Report58
DIRECTORS’ REPORTFOR THE YEAR ENDED 30 JUNE 2013
A) STI OUTCOMES
The following table summarises measures and weightings for each Executive KMP, sets out the weighted
scores achieved and resulting proportion of STI earned and forfeited for the 2013 fi nancial year.
Measures Weight (%) Proportion of maximum STI earned in FY13 (%)
Proportion of maximum STI forfeited in FY13 (%)
Mr J Pemberton 100.00 5.00 95.00
Group Financial 80.00
Safety 10.00
Personal 10.00
Mr W Rooney 100.00 2.62 97.38
Group Financial 40.00
Divisional 40.00
Safety 10.00
Personal 10.00
Mr W Fair 100.00 15.81 84.19
Group Financial 30.00
Divisional 50.00
Safety 10.00
Personal 10.00
Mr M Stewart 100.00 30.04 69.96
Group Financial 40.00
Divisional 40.00
Safety 10.00
Personal 10.00
Mr M Wallace 100.00 0.00 100.00
Group Financial 40.00
Divisional 25.00
Safety 10.00
Personal 25.00

NRW ANNUAL REPORT 2013Financial Report 59
DIRECTORS’ REPORTFOR THE YEAR ENDED 30 JUNE 2013
B) LTI OUTCOMES
The following table summarises measures and weightings for each Executive KMP, sets out the weighted
scores achieved and resulting proportion of LTI earned and forfeited for the 2013 fi nancial year.
Measures Weight (%) Proportion of maximum LTI earned in FY13 (%)
Proportion of maximum LTI forfeited in FY13 (%)
Mr J Pemberton 100.00 5.00 95.00
Group Financial 80.00
Safety 10.00
Personal 10.00
Mr W Rooney 100.00 2.88 97.12
Group Financial 40.00
Divisional 40.00
Safety 10.00
Personal 10.00
Mr W Fair 100.00 13.17 86.83
Group Financial 30.00
Divisional 50.00
Safety 10.00
Personal 10.00
Mr M Stewart 100.00 29.88 70.12
Group Financial 40.00
Divisional 40.00
Safety 10.00
Personal 10.00
Mr M Wallace 100.00 0.00 100.00
Group Financial 40.00
Divisional 25.00
Safety 10.00
Personal 25.00

NRW ANNUAL REPORT 2013Financial Report60
DIRECTORS’ REPORTFOR THE YEAR ENDED 30 JUNE 2013
FY12 Awards
In respect of the LTI component of the FY12 Awards, the following table shows the total number of
Performance Rights granted to NRW’s KMP. The Vesting Conditions noted above at Section 3 were applied
against the fi rst tranche of those Performance Rights (34% of Performance Rights granted) in FY12 and
against the second tranche of those Performance Rights (33% of Performance Rights granted) in FY13. The
number of Performance Rights that vested and converted into ordinary shares in NRW on 15 September 2012
and are due to vest on 15 September 2013, respectively, are shown alongside each Executive KMP member
in the table below. The table also sets out the number of Performance Rights that will be eligible to vest,
subject to application of the Vesting Conditions on each subsequent vesting date.
Total Number of Performance Rights Granted
under the FY12 Award
Tranche 1 Performance Rights that vested on 15
September 2012^
Tranche 2 Performance Rights eligible to vest on 15
September 2013
Tranche 3 Performance Rights eligible to vest on 15
September 2014
Mr J Pemberton 841,377 286,068 83,296 277,654
Mr W Rooney 348,448 118,472 34,496 114,988
Mr M Stewart 211,570 71,934 20,945 69,818
Mr T Cook 76,015 25,845 - -
Mr W Fair 73,479 24,983 7,274 24,248
Mr K Bounsell 85,165 28,957 - -
Mr M Wallace 74,649 25,381 - -
Total 1,710,703 581,640 146,011 486,708
^In respect of the Performance Rights that were eligible to vest on 15 September 2012, through the
application of the Vesting Conditions, all (100%) of the Performance Rights that were eligible to vest to each
Executive KMP under the First Tranche of the FY12 Award (34% of all Performance Rights granted under
the FY12 Award) vested. The applicable outcomes of the Vesting Conditions tested in respect of the First
Tranche of the FY12 LTI Award are as follows:
FY12 LTI Award – Performance RightsApplication of Vesting Conditions to Rights that vested on 15 September 2012
LTI Vesting Condition,Weighting
Maximum vestingachieved at Basis of Measurement Result Achieved Vesting
EPS Growth,Weighting 40%
EPS Growth of 10% Audited resultEPS Growth
of 116%
100% x 40% weighting=
40% vesting
ROCE,Weighting 30%
ROCE of 25% Audited resultROCE of
45%
100% x 30% weighting=
30% vesting
Relative TSR,Weighting 30%
NRW’s Relative TSR being3rd or better
Link Market Services /Miraqle Metrics provided
independent calculation of NRW Relative TSR
NRW’s Relative TSRPerformance of
1st out of 11
100% x 30% weighting=
30% vesting
TOTAL VESTING 100%
In respect of the Performance Rights that are eligible to vest on 15 September 2013, through the application
of the Vesting Conditions, only the awards relating to the ROCE Vesting Condition (30%) vested. None (0%)
of the awards relating to the EPS (40%) or RTSR (30%) Vesting Conditions vested.

NRW ANNUAL REPORT 2013Financial Report 61
DIRECTORS’ REPORTFOR THE YEAR ENDED 30 JUNE 2013
The applicable outcomes of the Vesting Conditions tested in respect of the Second Tranche of the FY12 LTI
Award are as follows:
FY12 LTI Award – Performance RightsApplication of Vesting Conditions to Rights that due to vest on 15 September 2013
LTI Vesting Condition,Weighting
Maximum vestingachieved at
Basis of Measurement Result Achieved Vesting
EPS Growth,Weighting 40%
EPS Growth of 10% Audited resultEPS Growth
of (23%)*
0% x 40% weighting=
0% vesting
ROCE,Weighting 30%
ROCE of 25% Audited resultROCE of
31%
100% x 30% weighting=
30% vesting
Relative TSR,Weighting 30%
NRW’s Relative TSR being
3rd or better
Orient Capital Pty Ltd provided independent
calculation ofNRW Relative TSR
NRW’s Relative TSRPerformance of
8th out of 11
100% x 30% weighting=
0% vesting
TOTAL VESTING 30%
FY13 Awards
In respect of the LTI component of the FY13 Awards, the following table shows the total number of
Performance Rights granted to NRW’s KMP. The table sets out the number of Performance Rights that will
be eligible to vest, subject to application of the Vesting Conditions on 15 September 2015.
No. Rights expected to vest on 15 Sept 2015
Maximum potential number of Performance Rights for FY13 Award
Total number of Performance Rights granted under the FY13 Award
Mr J Pemberton 10,260 684,006 34,200
Mr W Rooney 2,204 255,362 7,345
Mr M Stewart 13,102 146,186 43,673
Mr W Fair 3,489 88,317 11,631
Mr M Wallace - 101,081 -
Total 29,055 1,274,952 96,849

NRW ANNUAL REPORT 2013Financial Report62
DIRECTORS’ REPORTFOR THE YEAR ENDED 30 JUNE 2013
EXECUTIVE DIRECTORS’ AND EXECUTIVE KMP REMUNERATION (COMPANY AND GROUP)
The table below sets out the remuneration outcomes for each of NRW’s Executive KMP for the fi nancial year
ending 30 June 2013.
IN AUD $ 2013 Short Term Benefi ts
Post Employment
Benefi ts
Other Long Term
Benefi tsShare Based Payments Total
Key Management Personnel
Salary & fees
TerminationPayment
STI cash bonus FY13
Non cash benefi t (1)
Annual Leave (2) Superannuation Other (3) Equity (4) In substance
options
EXECUTIVEDIRECTORS
Mr J Pemberton 1,295,127 - 37,125 1,258 102,516 16,470 21,353 388,952 - 1,862,801
EXECUTIVES
Mr M Wallace (6) 468,504 - - - 41,246 16,023 - 75,356 - 601,129
Mr M Stewart 665,863 - 151,656 39,202 57,488 56,154 - 213,657 - 1,184,020
Mr W Rooney 895,507 - 17,337 5,106 72,889 25,000 - 351,763 - 1,367,602
Mr K Hyman 325,444 - - - 56,896 20,824 15,001 - - 418,166
Mr T Cook (5) 294,883 105,593 - 22,348 16,270 14,084 - 17,950 - 471,127
Mr W Fair 371,745 - 48,233 - 32,244 46,532 - 74,197 - 572,951
Total Compensated (Consolidated)
4,317,073 105,593 254,351 67,914 379,549 195,087 36,354 1,121,875 - 6,477,796
(1) The non-cash benefi ts comprised mostly motor vehicle benefi ts offered to the key management personnel, including the applicable grossed up fringe benefi ts tax.
(2) Represents the movement in accrued leave.
(3) Represents the movement in accrued long service leave.
(4) Represents the expensing of the FY12 and FY13 award and consequent grant of Performance Rights in accordance with AASB 2 – Share based payments.
(5) Trevor Cook resigned employment 7 December 2012.
(6) M Wallace left the Company on 7 August 2013. Shares relating to tranche 2 of FY12 and FY13 will lapse and be reversed in FY14.

NRW ANNUAL REPORT 2013Financial Report 63
DIRECTORS’ REPORTFOR THE YEAR ENDED 30 JUNE 2013
EXECUTIVE DIRECTORS’ AND EXECUTIVE KMP REMUNERATION (COMPANY AND GROUP)
The table below sets out the remuneration outcomes for each of NRW’s Executive KMP for the fi nancial year
ending 30 June 2012.
IN AUD $ 2012 Short Term Benefi ts
Post Employment
Benefi ts
Other Long Term
Benefi tsShare Based Payments Total (6)
Key Management Personnel
Salary & fees
STI cash bonus FY12
STI cash bonus FY11 (1)
Non cash benefi t (2)
Annual Leave (3) Superannuation Other (4) Equity (5)
In substance
options
EXECUTIVEDIRECTORS
Mr J Pemberton 1,298,289 384,750 100,000 6,012 153,451 15,489 54,586 749,579 - 2,762,156
EXECUTIVES
Mr K Bounsell 541,105 40,000 - 21,373 53,432 12,952 21,962 80,946 - 771,769
Mr M Wallace 370,801 119,476 - 44,999 36,055 15,471 - 70,951 - 657,754
Mr M Stewart 635,088 169,309 50,000 39,202 53,328 60,582 - 201,089 - 1,208,597
Mr W Rooney 833,886 232,372 75,000 6,603 70,325 32,948 - 331,186 - 1,582,320
Mr K Hyman 310,021 60,000 25,000 1,927 29,206 26,046 7,015 - - 459,215
Mr T Cook 369,488 121,662 - 10,796 34,116 42,251 - 72,249 - 650,563
Mr W Fair 329,172 117,604 - - 30,113 30,912 - 69,839 - 577,640
Mr S Lucas(7) 418,250 - - 81,603 - 37,101 - - - 536,954
Total Compensated (Consolidated)
5,106,100 1,245,173 250,000 212,515 460,026 273,752 83,563 1,575,839 - 9,206,968
(1) A short term incentive payment was approved by the R&NC after determination of NRW’s FY11 audited result. Whilst applicable to performance in the fi nancial year ended 30 June 2011, it is reported here as a payment made during the fi nancial year ended 30 June 2012.
(2) The non-cash benefi ts comprised mostly motor vehicle benefi ts offered to the key management personnel, including the applicable grossed up fringe benefi ts tax.
(3) Represents the movement in accrued leave.
(4) Represents the movement in accrued long service leave.
(5) Represents the expensing of the FY12 LTI award and consequent grant of Performance Rights in accordance with AASB 2 – Share based payments
(6) No termination payments were made during FY12
(7) S Lucas resigned employment 18 May 2012

NRW ANNUAL REPORT 2013Financial Report64
DIRECTORS’ REPORTFOR THE YEAR ENDED 30 JUNE 2013
5. NON-EXECUTIVE DIRECTOR REMUNERATION
Non-Executive Directors received a fi xed fee for Board and Committee duties and are not entitled to
any performance related remuneration. The NRW constitution provides that Non-Executive Directors’
remuneration must not exceed the maximum aggregate sum determined by the Company in a general
meeting. At present, the maximum sum is fi xed at $750,000 in aggregate, per annum. This maximum sum
cannot be increased without member’s approval by ordinary resolution at a general meeting.
Non-Executive Director fees (excluding superannuation and non-cash benefi ts) to be paid by the Company
are as follows:
Director Fee per annum AUD
Dr I Burston 125,000
Mr J Cooper 98,462
Mr M Arnett 100,000
Non-Executive Directors are also entitled to receive reimbursement for travelling and other expenses that they
properly incur in attending Board meetings, attending any general meetings of the Company or in connection
with the Company’s business.
The table below sets out the remuneration outcomes for each of NRW’s Non-Executive Directors for the
fi nancial years ended 30 June 2013 and 30 June 2012.
IN AUD $ Short Term Benefi tsPost
Employment Benefi ts
Total
NON-EXECUTIVE DIRECTORS Financial year Salary & fees Non cash benefi t Superannuation
Mr I Burston 2013 125,000 9,087 8,438 142,525
2012 125,000 6,497 11,250 142,747
Mr J Cooper 2013 98,462 3,675 8,862 110,999
2012 101,999 9,180 111,179
Mr M Arnett 2013 100,000 7,368 9,000 116,368
2012 100,000 3,036 9,000 112,036
FY13 NON-EXECUTIVE DIRECTORS TOTAL 323,462 20,130 26,300 369,892
FY12 NON-EXECUTIVE DIRECTORS TOTAL 326,999 9,533 29,430 365,962

NRW ANNUAL REPORT 2013Financial Report 65
DIRECTORS’ REPORTFOR THE YEAR ENDED 30 JUNE 2013
6. ADDITIONAL STATUTORY DISCLOSURES
This section sets out the additional disclosures required under the Corporations Act 2001.
Performance Rights Fair Value
The following table sets out the independently assessed fair value of the Performance Rights granted to
each Executive KMP member as at the date on which the grant of Performance Rights was made to the
individual concerned (Grant Date) for the FY12 and FY13 LTI awards. Within each tranche the Performance
Rights are ascribed a fair value according to the Vesting Condition limb against which they are tested,
namely EPS Growth (40% weighting), ROCE (30% weighting) and Relative TSR (30% weighting).
FY13 AWARDS
Grant Date Performance Rights that are eligible to vest on 15 September 2015
EPS Growth ($) ROCE ($) RTSR ($)
Mr J Pemberton 28/11/2012 1.13 1.13 0.36
Mr W Rooney 18/06/2013 0.76 0.76 0.11
Mr M Stewart 18/06/2013 0.76 0.76 0.11
Mr W Fair 18/06/2013 0.76 0.76 0.11
FY12 AWARDS
GrantDate
Tranche 1Performance Rights that
vested on 15 September 2012
Tranche 2Performance Rights thatare eligible to vest on 15
September 2013
Tranche 3Performance Rights thatare eligible to vest on 15
September 2014
EPSGrowth
($)ROCE ($) RTSR ($)
EPSGrowth
($)ROCE ($) RTSR ($)
EPSGrowth
($)ROCE ($) RTSR ($)
Mr J Pemberton 23/11/2011 2.65 2.65 1.70 2.49 2.65 1.70 2.35 2.35 1.61
Mr W Rooney 12/03/2012 3.73 3.73 2.93 3.52 3.52 2.64 3.31 3.31 2.50
Mr M Stewart 12/03/2012 3.73 3.73 2.93 3.52 3.52 2.64 3.31 3.31 2.50
Mr T Cook 12/03/2012 3.73 3.73 2.93 - - - - - -
Mr W Fair 12/03/2012 3.73 3.73 2.93 3.52 3.52 2.64 3.31 3.31 2.50
Mr M Wallace 12/03/2012 3.73 3.73 2.93 - - - - - -
The estimation of the fair value of share-based payment awards requires judgement with respect to the
appropriate valuation methodology. The choice of valuation methodology is determined by the structure of
the awards, particularly the Vesting Conditions. The table below shows the valuation methodology used for
each award.

NRW ANNUAL REPORT 2013Financial Report66
DIRECTORS’ REPORTFOR THE YEAR ENDED 30 JUNE 2013
Award Type Grant Date Vesting Conditions Valuation methodology
Performance Rights23 November 2011 and
12 March 2012
Relative TSREPS Growth
ROCE
Monte-Carlo simulationBinomial TreeBinomial Tree
Performance Rights28 November 2012 and
18 June 2013
Relative TSREPS Growth
ROCE
Monte-Carlo simulationBinomial TreeBinomial Tree
Each valuation methodology we have used has been chosen from those available to us to incorporate an
appropriate amount of fl exibility with respect to the particular performance and Vesting Conditions of the award.
Valuation assumptions
The following tables summarise the key assumptions adopted for valuation of the awards.
For all awards, the volatility assumption is representative of the level of uncertainty expected in the movements
of the company’s share price over the life of the award. The assessment of volatility includes the historic
volatility of the market price of the company’s share and the mean reversion tendency of volatilities. The
expected volatility of each company in the peer group is determined based on the historic volatility of the
companies’ share prices. In making this assumption, two years of historic volatility was used where available.
Key assumptions for the awards granted on 23 November 2011
Award type Performance Rights
Vesting Conditions Relative TSR, ROCE and EPS
Share price at the grant date $2.78
Tranche 1 2 3
Vesting date 15 September 2012 15 September 2013 15 September 2014
Expected life 0.8 years 1.8 years 2.8 years
Risk free interest rate 3.40% 3.09% 3.07%
Volatility 50% 50% 50%
Dividend yield 6.0% 6.0% 6.0%
Key assumptions for the awards granted on 12 March 2012
Award type Performance Rights
Vesting Conditions Relative TSR, ROCE and EPS
Share price at the grant date $2.78
Tranche 1 2 3
Vesting date 15 September 2012 15 September 2013 15 September 2014
Expected life 0.8 years 1.8 years 2.8 years
Risk free interest rate 3.40% 3.09% 3.07%
Volatility 50% 50% 50%
Dividend yield 6.0% 6.0% 6.0%

NRW ANNUAL REPORT 2013Financial Report 67
DIRECTORS’ REPORTFOR THE YEAR ENDED 30 JUNE 2013
Julian Pemberton
Chief Executive Offi cer
Dr Ian Burston
Chairman
Key assumptions for the awards granted on 28 November 2012
Award type Performance Rights
Vesting Conditions Relative TSR, ROCE and EPS
Share price at the grant date $1.48
Vesting date 15 September 2015
Expected life 3 years
Risk free interest rate 2.66%
Volatility 50%
Dividend yield 9.0%
Key assumptions for the awards granted on 18 June 2013
Award type Performance Rights
Vesting Conditions Relative TSR, ROCE and EPS
Share price at the grant date $0.925
Vesting date 15 September 2015
Expected life 2.2 years
Risk free interest rate 2.49
Volatility 55%
Dividend yield 8.5
END OF REMUNERATION REPORT (AUDITED)
ROUNDING OF AMOUNTS
The amounts contained in this report and the fi nancial report have been rounded to the nearest $1,000
(where rounding is applicable) under the option available to the Company under ASIC Class Order 98/0100.
The Company is an entity to which the Class Order applies.
This report has been made in accordance with a resolution of the Directors of the Company.
Perth, 21 August 2013

NRW ANNUAL REPORT 2013Financial Report68
FOR THE YEAR ENDED 30 JUNE 2013
AUDITOR’S INDEPENDENCE DECLARATION
AUDITOR’S INDEPENDENCE DECLARATION

NRW ANNUAL REPORT 2013Financial Report 69
DIRECTORS’ REPORTFOR THE YEAR ENDED 30 JUNE 2013
DIRECTORS’ DECLARATION
The Directors declare that:
(a) in the Directors’ opinion, there are reasonable grounds to believe that the Company will be able to pay its
debts as and when they become due and payable;
(b) in the Directors’ opinion, the attached fi nancial statements are in compliance with International Financial
Reporting Standards, as stated in Note 2 to the fi nancial statements;
(c) in the Directors’ opinion, the attached fi nancial statements and notes thereto are in accordance with the
Corporations Act 2001, including compliance with accounting standards and giving a true and fair view
of the fi nancial position and performance of the consolidated entity, and
(d) the Directors have been given the declarations required by s.295A of the Corporations Act 2001.
At the date of this declaration, the Company is within the class of companies affected by ASIC Class
Order 98/1418. The nature of the deed of cross guarantee is such that each company which is party
to the deed guarantees to each creditor payment in full of any debt in accordance with the deed of
cross guarantee.
In the Directors’ opinion, there are reasonable grounds to believe that the Company and the companies to which
the ASIC Class Order applies, as detailed in Note 17 to the fi nancial statements will, as a Group, be able to meet
any obligations or liabilities to which they are, or may become, subject by virtue of the deed of cross guarantee.
Signed in accordance with a resolution of the Directors made pursuant to s.295(5) of the Corporations Act 2001.
On behalf of the Directors
Perth, 21 August 2013
Julian Pemberton
Chief Executive Offi cer
Dr Ian Burston
Chairman

NRW ANNUAL REPORT 201370 Financial Report
FOR THE YEAR ENDED 30 JUNE 2013
CONSOLIDATED STATEMENT OF PROFIT AND LOSS AND OTHER COMPREHENSIVE INCOME
Consolidated
NOTES 2013 2012
$’000 $’000
REVENUE 6 1,374,403 1,358,776
Other income / (loss) 7 (2,975) 2,063
Finance income 786 1,498
Finance costs 8 (15,462) (14,358)
Materials and consumables used (204,551) (176,779)
Employee benefi ts expense 9(a) (426,805) (395,823)
Subcontractor costs (297,538) (283,767)
Depreciation and amortisation expenses 9(a) (48,885) (41,894)
Plant and equipment costs 9(a) (226,169) (268,604)
Travel and accommodation (38,792) (31,855)
Other expenses (9,249) (8,123)
PROFIT BEFORE INCOME TAX 104,763 141,134
Income tax expense 10(a) (30,656) (43,992)
PROFIT FOR THE YEAR 74,107 97,142
Other comprehensive income (expense)
Items that may be reclassifi ed subsequently to profi t and loss:
Exchange diff erences arising on translation of foreign operations 28 6
OTHER COMPREHENSIVE INCOME (EXPENSE) FOR THE YEAR, NET OF TAX 28 6
TOTAL COMPREHENSIVE INCOME 74,135 97,148
PROFIT ATTRIBUTABLE TO:
Equity holders of the Company 74,107 97,142
TOTAL COMPREHENSIVE INCOME ATTRIBUTABLE TO:
Equity holders of the Company 74,135 97,148
CENTS CENTS
EARNINGS PER SHARE 11
Basic earnings per share 26.6 34.8
Diluted earnings per share 26.5 34.7
The consolidated statement of profi t and loss and other comprehensive income should be read in conjunction with the
accompanying notes.

NRW ANNUAL REPORT 2013 71Financial Report
CONSOLIDATED STATEMENT OF FINANCIAL POSITIONFOR THE YEAR ENDED 30 JUNE 2013
CONSOLIDATED
NOTES 2013 2012
$’000 $’000
ASSETS
CURRENT ASSETS
Cash and cash equivalents 12 130,994 137,955
Receivables 13 205,052 280,438
Inventories 14 48,547 33,374
Current tax assets 10(d) 3,773 -
Other current assets 15 5,400 4,149
TOTAL CURRENT ASSETS 393,766 455,916
NON-CURRENT ASSETS
Property, plant and equipment 16 387,696 366,179
Other intangible assets 17 8,126 526
Goodwill 20 24,417 24,417
TOTAL NON-CURRENT ASSETS 420,239 391,122
TOTAL ASSETS 814,005 847,038
LIABILITIES
CURRENT LIABILITIES
Payables 22 196,939 250,418
Borrowings 23 52,379 49,592
Current tax liabilities 10(d) - 22,913
Provisions 24 16,139 29,576
TOTAL CURRENT LIABILITIES 265,457 352,499
NON-CURRENT LIABILITIES
Borrowings 23 167,191 149,178
Provisions 24 1,201 26
Deferred tax liabilities 10(e) 27,286 16,157
TOTAL NON-CURRENT LIABILITIES 195,677 165,361
TOTAL LIABILITIES 461,135 517,860
NET ASSETS 352,870 329,178
EQUITY
Contributed equity 25 156,432 156,456
Reserves 26 2,777 2,969
Retained earnings 27 193,661 169,753
TOTAL EQUITY 352,870 329,178
The consolidated statement of fi nancial position should be read in conjunction with the accompanying notes

NRW ANNUAL REPORT 201372 Financial Report
CONSOLIDATED STATEMENT OF CHANGES OF EQUITY
CONTRIBUTED EQUITY
FOREIGN CURRENCY
TRANSLATION RESERVE
SHARE BASED
PAYMENT RESERVE
TOTAL RESERVES
RETAINED EARNINGS
TOTAL EQUITY
NOTES $’000 $’000 $’000 $’000 $’000 $’000
Balance at 30 June 2011 156,456 (248) 1,635 1,387 108,866 266,709
Profi t for the year 27 - - - - 97,142 97,142
Exchange diff erences arising on translation of foreign operations
26 - 6 - 6 - 6
TOTAL COMPREHENSIVE INCOME FOR THE YEAR - 6 - 6 97,142 97,148
Payment of dividends 28 - - - - (36,255) (36,255)
Issue of ordinary shares under institutional share placement
25(a) - - - - - -
Issue of ordinary shares under Share Purchase Plan
25(a) - - - - - -
Share issue costs 25(a) - - - - - -
Income tax relating to share issue costs 25(a) - - - - - -
Share based payments - - 1,576 1,576 - 1,576
BALANCE AT 30 JUNE 2012 156,456 (242) 3,211 2,969 169,753 329,178
Balance at 1 July 2012 156,456 (242) 3,211 2,969 169,753 329,178
Profi t for the year 27 - - - - 74,107 74,107
Exchange diff erences arising on translation of foreign operations
26 - 28 - 28 - 28
TOTAL COMPREHENSIVE INCOME FOR THE YEAR - 28 - 28 74,107 74,135
Payment of dividends 28 - - - - (50,199) (50,199)
Share based payments 26(a) - - 1,042 1,042 - 1,042
Transfer to issued capital 25(a) 1,261 - (1,261) (1,261) - -
Acquisition of treasury shares 25(a) (1,285) - - - - (1,285)
- - - - - -
BALANCE AT 30 JUNE 2013 156,432 (214) 2,991 2,777 193,661 352,870
The consolidated statement of changes in equity should be read in conjunction with the accompanying notes.
FOR THE YEAR ENDED 30 JUNE 2013

NRW ANNUAL REPORT 2013 73
CONSOLIDATED STATEMENT OF CASH FLOWS
Financial Report
CONSOLIDATED
NOTES 2013 2012
$’000 $’000
CASH FLOWS FROM OPERATING ACTIVITIES
Receipts from customers 1,618,858 1,236,684
Payments to suppliers and employees (1,439,951) (1,035,468)
Interest paid (15,462) (14,358)
Interest received 786 1,498
Income tax paid (46,213) (15,173)
NET CASH FLOW FROM OPERATING ACTIVITIES 29(a) 118,017 173,183
CASH FLOWS FROM INVESTING ACTIVITIES
Proceeds from the sale of property, plant and equipment 12,326 3,478
Acquisition of property, plant and equipment (50,234) (38,143)
Proceeds from related parties - -
NET CASH FLOW FROM IN INVESTING ACTIVITIES (37,908) (34,665)
CASH FLOWS FROM FINANCING ACTIVITIES
Proceeds from the issue of share capital (net of share issue costs) - -
Proceeds from borrowings 6,303 15,664
Repayment of borrowings and fi nance/hire purchase liabilities (41,889) (50,600)
Payment of dividends to shareholders (50,198) (36,255)
Acquisition of treasury shares (1,285) -
NET CASH FLOW FROM FINANCING ACTIVITIES (87,070) (71,191)
NET INCREASE IN CASH AND CASH EQUIVALENTS (6,961) 67,327
Cash and cash equivalents at beginning of the year 137,955 70,628
CASH AND CASH EQUIVALENTS AT THE END OF THE YEAR 12 130,994 137,955
The consolidated statement of cash fl ows should be read in conjunction with the accompanying notes.
FOR THE YEAR ENDED 30 JUNE 2013

NRW ANNUAL REPORT 2013Notes to the Financial Statements74
NOTES TO THE FINANCIAL STATEMENTSFOR THE YEAR ENDED 30 JUNE 2013
1. GENERAL INFORMATION
NRW Holdings Limited (the ‘Company’) is a
public company listed on the Australian Securities
Exchange and incorporated and domiciled in
Australia. The address of the Company’s registered
offi ce is 181 Great Eastern Highway, Belmont,
Western Australia. The consolidated fi nancial
statements of the Company for the year ended
30 June 2013 comprises the Company and its
subsidiaries (together referred to as ‘Consolidated’,
the ‘Consolidated Group’ or the ‘Group’). The Group
is primarily involved in civil and mining contracting,
the fabrication of, and repairs to, plant and drilling
and blasting activities.
2. SUMMARY OF SIGNIFICANT ACCOUNTING POLICIES
The principal accounting policies adopted in the
preparation of the fi nancial report are set out below.
These policies have been consistently applied to all
the years presented, unless otherwise stated.
2.1 STATEMENT OF COMPLIANCE
The fi nancial statements are general purpose
fi nancial statements which have been prepared
in accordance with the Corporations Act 2001,
Australian Accounting Standards and other
authoritative pronouncements of the Australian
Accounting Standards Board and Interpretations.
The fi nancial statements comprise the consolidated
fi nancial statements of the Group. For the purposes
of preparing the consolidated fi nancial statements,
the Company is a for-profi t entity. Accounting
Standards include Australian Accounting Standards.
Compliance with Australian Accounting Standards
ensures that the fi nancial statements and notes
of the company and the Group comply with
International Financial Reporting Standards (‘IFRS’).
The consolidated fi nancial statements of the Group
also comply with International Financial Reporting
Standards (‘IFRS’) as issued by the International
Accounting Standards Board. These fi nancial
statements were authorised for issue by the
Directors on 21 August 2013.
2.2 BASIS OF PREPARATION
The consolidated fi nancial statements have been
prepared on the historical cost basis, except for
certain non-current assets and fi nancial instruments
that are measured at revalued amounts or fair value,
as explained in the accounting policies below where
applicable. Historical cost is generally based on the
fair values of the consideration given in exchange
for assets. All amounts are presented in Australian
dollars, unless otherwise noted.
The Company is a company of the kind referred
to in ASIC Class Order 98/100, dated 10 July 1998,
and in accordance with that Class Order amounts in
the fi nancial report are rounded off to the nearest
thousand dollars, unless otherwise indicated.
2.3 BASIS OF CONSOLIDATION
The consolidated fi nancial statements incorporate
the fi nancial statements of the Company and entities
(including special purpose entities) controlled by the
Company (its subsidiaries). Control is achieved where
the Company has the power to govern the fi nancial
and operating policies of an entity so as to obtain
benefi ts from its activities.
Income and expense of subsidiaries acquired or
disposed of during the year are included in the
consolidated statement of comprehensive income
from the effective date of acquisition and up to
the effective date of disposal, as appropriate. Total
comprehensive income of subsidiaries is attributed
to the owners of the Company and to the non-
controlling interests even if this results in the non-
controlling interests having a defi cit balance.
Where necessary, adjustments are made to the
fi nancial statements of subsidiaries to bring their
accounting policies into line with those used by
other members of the Group.
All intra-group transactions, balances, income and
expenses are eliminated in full on consolidation.
Changes in the Group’s ownership interests in
subsidiaries that do not result in the Group losing
control are accounted for as equity transactions.
The carrying amounts of the Group’s interests
and the non-controlling interests are adjusted to
refl ect the changes in their relative interests in the
subsidiaries. Any difference between the amount by
which the non-controlling interests are adjusted and
the fair value of the consideration paid or received

NRW ANNUAL REPORT 2013Notes to the Financial Statements 75
NOTES TO THE FINANCIAL STATEMENTSFOR THE YEAR ENDED 30 JUNE 2013
is recognised directly in equity and attributed to
owners of the Company.
When the Group loses control of a subsidiary, a gain
or loss is recognised in profi t or loss and is calculated
as the difference between (i) the aggregate of the
fair value of the consideration received and the fair
value of any retained interest and (ii) the previous
carrying amount of the assets (including goodwill),
and liabilities of the subsidiary and any
non-controlling interests. When assets of the
subsidiary are carried at revalued amounts or fair
values and the related cumulative gain or loss has
been recognised in other comprehensive income and
accumulated in equity, it is accounted for as if the
Group had directly disposed of the relevant assets (ie.
reclassifi ed to profi t or loss or transferred directly to
retained earnings as specifi ed by applicable Standards).
2.4 BUSINESS COMBINATIONS
Acquisitions of businesses are accounted for
using the acquisition method. The consideration
transferred in a business combination is measured
at fair value which is calculated as the sum of the
acquisition-date fair values of assets transferred
by the Group, liabilities incurred by the Group to
the former owners of the acquiree and the equity
instruments issued by the Group in exchange for
control of the acquiree. Acquisition-related costs are
recognised in profi t or loss as incurred.
At the acquisition date, the identifi able assets
acquired and the liabilities assumed are recognised
at their fair value at the acquisition date, except that:
• deferred tax assets or liabilities and liabilities or
assets related to employee benefi t arrangements
are recognised and measured in accordance with
AASB 112 ‘Income Taxes’ and AASB 119 ‘Employee
Benefi ts’ respectively;
• liabilities or equity instruments related to share-
based payment arrangements of the acquiree
or share-based payment arrangements of the
Group entered into to replace share-based
payment arrangements of the acquiree are
measured in accordance with AASB 2 ‘Share-
based Payment’ at the acquisition date; and
• assets (or disposal groups) that are classifi ed
as held for sale in accordance with AASB
5 ‘Noncurrent Assets Held for Sale and
Discontinued Operations’ are measured in
accordance with that Standard.
Goodwill is measured as the excess of the sum of the
consideration transferred, the amount of any
non-controlling interests in the acquiree, and the fair
value of the acquirer’s previously held equity interest
in the acquiree (if any) over the net of the acquisition-
date amounts of the identifi able assets acquired and
the liabilities assumed. If, after reassessment, the net of
the acquisition-date amounts of the identifi able assets
acquired and liabilities assumed exceeds the sum
of the consideration transferred, the amount of any
non-controlling interests in the acquiree and the fair
value of the acquirer’s previously held interest in the
acquiree (if any), the excess is recognised immediately
in profi t or loss as a bargain purchase gain.
Non-controlling interests that are present ownership
interests and entitle their holders to a proportionate
share of the entity’s net assets in the event of
liquidation may be initially measured either at fair
value or at the non-controlling interests’ proportionate
share of the recognised amounts of the acquiree’s
identifi able net assets. The choice of measurement
basis is made on a transaction-by-transaction basis.
Other types of non-controlling interests are measured
at fair value or, when applicable, on the basis specifi ed
in another Standard.
Where the consideration transferred by the Group
in a business combination includes assets or
liabilities resulting from a contingent consideration
arrangement, the contingent consideration is
measured at its acquisition-date fair value. Changes
in the fair value of the contingent consideration
that qualify as measurement period adjustments
are adjusted retrospectively, with corresponding
adjustments against goodwill. Measurement
period adjustments are adjustments that arise
from additional information obtained during the
‘measurement period’ (which cannot exceed one
year from the acquisition date) about facts and
circumstances that existed at the acquisition date.
The subsequent accounting for changes in the
fair value of contingent consideration that do
not qualify as measurement period adjustments
depends on how the contingent consideration is
classifi ed. Contingent consideration that is classifi ed
as equity is not remeasured at subsequent reporting
dates and its subsequent settlement is accounted
for within equity. Contingent consideration that is
classifi ed as an asset or liability is remeasured at
subsequent reporting dates in accordance with

NRW ANNUAL REPORT 2013Notes to the Financial Statements76
NOTES TO THE FINANCIAL STATEMENTSFOR THE YEAR ENDED 30 JUNE 2013
AASB 139, or AASB 137 ‘Provisions, Contingent
Liabilities and Contingent Assets’, as appropriate,
with the corresponding gain or loss being
recognised in profi t or loss.
Where a business combination is achieved in
stages, the Group’s previously held equity interest
in the acquiree is remeasured to fair value at the
acquisition date (i.e. the date when the Group
attains control) and the resulting gain or loss, if any,
is recognised in profi t or loss. Amounts arising from
interests in the acquiree prior to the acquisition
date that have previously been recognised in other
comprehensive income are reclassifi ed to profi t or
loss where such treatment would be appropriate if
that interest were disposed of.
If the initial accounting for a business combination
is incomplete by the end of the reporting period in
which the combination occurs, the Group reports
provisional amounts for the items for which the
accounting is incomplete. Those provisional
amounts are adjusted during the measurement
period (see above), or additional assets or liabilities
are recognised, to refl ect new information obtained
about facts and circumstances that existed as of the
acquisition date that, if known, would have affected
the amounts recognised as of that date.
2.5 GOODWILL
Goodwill arising on an acquisition of a business
is carried at cost as established at the date of
the acquisition of the business (see note 2.4) less
accumulated impairment losses, if any. For the
purposes of impairment testing, goodwill is allocated
to each of the Group’s cash-generating units (or
groups of cash-generating units) that is expected to
benefi t from the synergies of the combination.
A cash-generating unit to which goodwill has been
allocated is tested for impairment annually, or
more frequently when there is indication that the
unit may be impaired. If the recoverable amount
of the cash-generating unit is less than its carrying
amount, the impairment loss is allocated fi rst
to reduce the carrying amount of any goodwill
allocated to the unit and then to the other assets
of the unit pro rata based on the carrying amount
of each asset in the unit. Any impairment loss for
goodwill is recognised directly in profi t or loss in the
consolidated statement of comprehensive income/
income statement. An impairment loss recognised
for goodwill is not reversed in subsequent periods.
On disposal of the relevant cash-generating unit, the
attributable amount of goodwill is included in the
determination of the profi t or loss on disposal.
2.6 INTERESTS IN JOINT VENTURES
A joint venture is a contractual arrangement whereby
the Group and other parties undertake an economic
activity that is subject to joint control (i.e. when the
strategic fi nancial and operating policy decisions
relating to the activities of the joint venture require the
unanimous consent of the parties sharing control).
When a Group entity undertakes its activities under
joint venture arrangements directly, the Group’s
share of jointly controlled assets and any liabilities
incurred jointly with other venturers are recognised
in the fi nancial statements of the relevant entity and
classifi ed according to their nature.
Liabilities and expenses incurred directly in respect
of interests in jointly controlled assets are accounted
for on an accrual basis. Income from the sale or
use of the Group’s share of the output of jointly
controlled assets, and its share of joint venture
expenses, are recognised when it is probable
that the economic benefi ts associated with the
transactions will fl ow to/from the Group and their
amount can be measured reliably.
The Group’s interests in assets where the Group does
not have joint control are accounted for in accordance
with the substance of the Group’s interest. Where
such arrangements give rise to an undivided interest in
the individual assets and liabilities of the joint venture,
the Group recognises its undivided interest in each
asset and liability and classifi es and presents those
items according to their nature.
The Group reports its interests in jointly controlled
entities using proportionate consolidation. The
Group’s share of the assets, liabilities, income and
expenses of jointly controlled entities is combined
with the equivalent items in the consolidated
fi nancial statements on a line-by-line basis.
When a Group entity transacts with a jointly
controlled entity of the Group, unrealised profi ts
and losses resulting from the transactions with
the jointly controlled entity are recognised in the
Group’s consolidated fi nancial statements only to
the extent of interests in the jointly controlled entity
that are not related to the Group.

NRW ANNUAL REPORT 2013Notes to the Financial Statements 77
NOTES TO THE FINANCIAL STATEMENTSFOR THE YEAR ENDED 30 JUNE 2013
2.7 REVENUE RECOGNITION
Revenue is measured at the fair value of the
consideration received or receivable. Revenue is
reduced for estimated customer returns, rebates
and other similar allowances if applicable.
2.7.1 Sale of goods
Revenue from the sale of goods is recognised when
the goods are delivered and titles have passed, at
which time all the following conditions are satisfi ed:
• the Group has transferred to the buyer the
signifi cant risks and rewards of ownership of
the goods;
• the Group retains neither continuing managerial
involvement to the degree usually associated
with ownership nor effective control over the
goods sold;
• the amount of revenue can be measured reliably;
• it is probable that the economic benefi ts
associated with the transaction will fl ow to the
Group; and
• the costs incurred or to be incurred in respect of
the transaction can be measured reliably.
2.7.2 Rendering of services
Revenue from the rendering of a service is
recognised in profi t or loss in proportion to the
stage of completion of the transaction at the
reporting date. The stage of completion is assessed
by reference to surveys of work performed.
2.7.3 Interest income
Interest income is accrued on a time basis, by
reference to the principal amount outstanding and
at the effective interest rate applicable, which is the
rate that exactly discounts estimated future cash
receipts through the expected life of the fi nancial
asset of that asset’s net carrying amount.
The Group’s policy for recognition of revenue from
construction contracts is described at 2.8 below.
2.8 CONSTRUCTION CONTRACTS
When the outcome of a construction contract
can be estimated reliably, revenue and costs are
recognised by reference to the stage of completion
of the contract activity at the end of the reporting
period, measured based on the proportion of
contract costs incurred for work performed to date
relative to the estimated total contract costs, except
where this would not be representative of the stage
of completion. Variations in contract work, claims
and incentive payments are included to the extent
that the amount can be measured reliably and its
receipt is considered probable.
When the outcome of a construction contract
cannot be estimated reliably, contract revenue is
recognised to the extent of contract costs incurred
that it is probable will be recoverable. Contract costs
are recognised as expenses in the period in which
they are incurred.
When it is probable that total contract costs will
exceed total contract revenue, the expected loss is
recognised as an expense immediately.
When contract costs incurred to date plus
recognised profi ts less recognised losses exceed
progress billings, the surplus is shown as amounts
due from customers for contract work or
construction work in progress. For contracts where
progress billings exceed contract costs incurred
to date plus recognised profi ts less recognised
losses, the surplus is shown as the amounts due to
customers for contract work.
Amounts received before the related work is
performed are included in the consolidated
statement of fi nancial position, as a liability, as
advances received. Amounts billed for work
performed but not yet paid by the customer are
included in the consolidated statement of fi nancial
position under trade and other receivables.
2.9 LEASES
Leases are classifi ed as fi nance leases whenever the
terms of the lease transfer substantially all the risks
and rewards of ownership to the lessee. All other
leases are classifi ed as operating leases.
Where the Group is the lessee, assets held under
fi nance leases are initially recognised as assets
of the Group at their fair value at the inception
of the lease or, if lower, at the present value of

NRW ANNUAL REPORT 2013Notes to the Financial Statements78
NOTES TO THE FINANCIAL STATEMENTSFOR THE YEAR ENDED 30 JUNE 2013
the minimum lease payments. The corresponding
liability to the lessor is included in the statement of
fi nancial position as a fi nance lease obligation.
Lease payments are apportioned between fi nance
expenses and reduction of the lease obligation
so as to achieve a constant rate of interest on the
remaining balance of the liability. Finance expenses
are recognised immediately in profi t or loss, unless
they are directly attributable to qualifying assets,
in which case they are capitalised in accordance
with the Group’s general policy on borrowing costs.
Contingent rentals are recognised as expenses in
the periods in which they are incurred.
Operating lease payments are recognised as an
expense on a straight-line basis over the lease
term, except where another systematic basis
is more representative of the time pattern in
which economic benefi ts from the leased asset
are consumed. Contingent rentals arising under
operating leases are recognised as an expense in
the period in which they are incurred.
2.10 FOREIGN CURRENCY TRANSLATION
2.10.1 Functional and presentation currency
The individual fi nancial statements of each group
entity are presented in the currency of the primary
economic environment in which the entity operates
(its functional currency). For the purpose of the
consolidated fi nancial statements, the results and
fi nancial position of each group entity are expressed
in Australian dollars (‘$’), which is the functional
currency of the Company and the presentation
currency for the consolidated fi nancial statements.
2.10.2 Transactions and balances
Foreign currency transactions are translated
into the functional currency using the exchange
rates prevailing at the dates of the transactions.
Foreign exchange gains and losses resulting from
the settlement of such transactions and from the
translation at year-end exchange rates of monetary
assets and liabilities denominated in foreign
currencies are recognised in profi t or loss, except
when deferred in equity as qualifying cash fl ow
hedges and qualifying net investment hedges or
are attributable to part of the net investment in a
foreign operation.
Non-monetary items carried at fair value that are
denominated in foreign currencies are retranslated
at the rates prevailing at the date when the fair
value was determined. Non-monetary items that
are measured in terms of historical cost in a foreign
currency are not retranslated.
2.10.3 Foreign operations
For the purpose of presenting consolidated fi nancial
statements, the assets and liabilities of the Group’s
foreign operations are translated into Australian
dollars using exchange rates prevailing at the
end of the reporting period. Income and expense
items are translated at the average exchange rates
for the period, unless exchange rates fl uctuated
signifi cantly during that period, in which case the
exchange rates at the dates of the transactions
are used. Exchange differences arising, if any, are
recognised in the foreign currency translation
reserve in other comprehensive income and
accumulated in equity (attributed to non-controlling
interests as appropriate).
On the disposal of a foreign operation, all of the
accumulated exchange differences in respect of that
operation attributable to the Group are reclassifi ed
to profi t or loss.
Goodwill and fair value adjustments arising on the
acquisition of a foreign operation are treated as
assets and liabilities of the foreign operation and
translated at the rate of exchange prevailing at the
end of each reporting period. Exchange differences
arising are recognised in equity.
2.11 BORROWING COSTS
Borrowing costs directly attributable to the
acquisition, construction or production of qualifying
assets, which are assets that necessarily take a
substantial period of time to get ready for their
intended use or sale, are added to the cost of those
assets, until such time as the assets are substantially
ready for their intended use or sale.
All other borrowing costs are recognised in profi t or
loss in the period in which they are incurred.
2.12 GOVERNMENT GRANTS
Government grants are not recognised until there
is reasonable assurance that the Group will comply
with the conditions attaching to them and that the
grants will be received.
Government grants that are receivable as
compensation for expenses or losses already

NRW ANNUAL REPORT 2013Notes to the Financial Statements 79
NOTES TO THE FINANCIAL STATEMENTSFOR THE YEAR ENDED 30 JUNE 2013
incurred or for the purpose of giving immediate
fi nancial support to the Group with no future related
costs are recognised in profi t or loss in the period in
which they become receivable.
Government assistance which does not have
conditions attached specifi cally relating to the
operating activities of the entity is recognised in
accordance with the accounting policies above.
2.13 EMPLOYEE BENEFITS
A liability is recognised for benefi ts accruing to
employees in respect of wages and salaries, annual
leave, long service leave, and sick leave when it is
probable that settlement will be required and they
are capable of being measured reliably.
Liabilities recognised in respect of short-term
employee benefi ts, are measured at their nominal
values using the remuneration rate expected to
apply at the time of settlement.
Liabilities recognised in respect of long term
employee benefi ts are measured as the present
value of the estimated future cash outfl ows to be
made by the Group in respect of services provided
by employees up to reporting date.
Payments to defi ned contribution retirement
benefi t plans are recognised as an expense when
employees have rendered service entitling them to
the contributions.
2.14 TAXATION
Income tax expense represents the sum of the tax
currently payable and deferred tax.
2.14.1 Current tax
The tax currently payable is based on taxable
profi t for the year. Taxable profi t differs from profi t
as reported in the consolidated statement of
comprehensive income because of items of income
or expense that are taxable or deductible in other
years and items that are never taxable or deductible.
The Group’s liability for current tax is calculated using
tax rates that have been enacted or substantively
enacted by the end of the reporting period.
2.14.2 Deferred tax
Deferred tax is recognised on temporary differences
between the carrying amounts of assets and
liabilities in the consolidated fi nancial statements
and the corresponding tax bases used in the
computation of taxable profi t. Deferred tax liabilities
are generally recognised for all taxable temporary
differences. Deferred tax assets are generally
recognised for all deductible temporary differences
to the extent that it is probable that taxable profi ts
will be available against which those deductible
temporary differences can be utilised. Such deferred
tax assets and liabilities are not recognised if the
temporary difference arises from goodwill or from
the initial recognition (other than in a business
combination) of other assets and liabilities in a
transaction that affects neither the taxable profi t
nor the accounting profi t.
Deferred tax liabilities are recognised for taxable
temporary differences associated with investments
in subsidiaries and associates, and interests in joint
ventures, except where the Group is able to control
the reversal of the temporary difference and it is
probable that the temporary difference will not
reverse in the foreseeable future. Deferred tax assets
arising from deductible temporary differences
associated with such investments and interests are
only recognised to the extent that it is probable that
there will be suffi cient taxable profi ts against which to
utilise the benefi ts of the temporary differences and
they are expected to reverse in the foreseeable future.
The carrying amount of deferred tax assets is
reviewed at the end of each reporting period and
reduced to the extent that it is no longer probable
that suffi cient taxable profi ts will be available to
allow all or part of the asset to be recovered.
Deferred tax assets and liabilities are measured
at the tax rates that are expected to apply in the
period in which the liability is settled or the asset
realised, based on tax rates (and tax laws) that
have been enacted or substantively enacted by the
end of the reporting period. The measurement of
deferred tax liabilities and assets refl ects the tax
consequences that would follow from the manner
in which the Group expects, at the end of the
reporting period, to recover or settle the carrying
amount of its assets and liabilities.
Deferred tax assets and liabilities are offset when
there is a legally enforceable right to set off current
tax assets against current tax liabilities and when
they relate to income taxes levied by the same
taxation authority and the Group intends to settle
its current tax assets and liabilities on a net basis.

NRW ANNUAL REPORT 2013Notes to the Financial Statements80
NOTES TO THE FINANCIAL STATEMENTSFOR THE YEAR ENDED 30 JUNE 2013
2.14.3 Current and deferred tax for the year
Current and deferred tax are recognised in profi t
or loss, except when they relate to items that are
recognised in other comprehensive income or directly
in equity, in which case the current and deferred tax
are also recognised in other comprehensive income or
directly in equity, respectively.
Where current tax or deferred tax arises from the
initial accounting for a business combination, the
tax effect is included in the accounting for the
business combination.
2.15 PROPERTY, PLANT AND EQUIPMENT
Properties in the course of construction for
production, supply or administrative purposes, or
for purposes not yet determined, are carried at
cost, less any recognised impairment loss. Cost
includes professional fees and, for qualifying
assets, borrowing costs capitalised in accordance
with the Group’s accounting policy. Depreciation of
these assets, on the same basis as other property
assets, commences when the assets are ready for
their intended use.
All property, plant and equipment, other than
freehold land, is depreciated or amortised at rates
appropriate to the estimated useful life of the assets
or in the case of certain leased plant and equipment,
the shorter lease term or hours (usage) refl ecting
the effective lives. The expected useful lives bands
are as follows:
Buildings 20 to 40 years
Leasehold improvements 2 to 5 years
Plant and equipment 2 to 20 years
Offi ce Equipment 2 to 8 years
Furniture and Fittings 5 to 20 years
Motor Vehicles 5 to 10 years
The above bands provide a range of effective lives
regardless of methodology used in the depreciation
process (either hours, diminishing or straight line).
The hours method is a consumption based method
and refl ects utilisation within the business and is
supported in the effective lives of each plant and
equipment group, where applicable.
Depreciation rates and methods shall be reviewed at
least annually. Where depreciation rates or methods
are changed, the net written down value of the
asset is depreciated from the date of the change
in accordance with the new depreciation rate or
method. Depreciation recognised in prior fi nancial
years shall not be changed, that is, the change in
depreciation rate or method shall be accounted for
on a ‘prospective’ basis.
An asset’s carrying amount is written down
immediately to its recoverable amount if the asset’s
carrying amount is greater than its estimated
recoverable amount.
An item of property, plant and equipment is
derecognised upon disposal or when no future
economic benefi ts are expected to arise from the
continued use of the asset. Any gain or loss arising
on the disposal or retirement of an item of property,
plant and equipment is determined as the difference
between the sales proceeds and the carrying amount
of the asset and is recognised in profi t or loss.
2.16 INTANGIBLE ASSETS
2.16.1 Intangible assets acquired separately
Intangible assets with finite lives that are
acquired separately are carried at cost less
accumulated amortisation and accumulated
impairment losses. Amortisation is recognised on
a straight-line basis over their estimated useful
lives. The estimated useful life and amortisation
method are reviewed at the end of each
reporting period, with the effect of any changes
in estimate being accounted for on a prospective
basis. Intangible assets with indefinite useful lives
that are acquired separately are carried at cost
less accumulated impairment losses.
2.16.2 Internally-generated intangible assets -
research and development expenditure
Expenditure on research activities is recognised as
an expense in the period in which it is incurred. An
internally-generated intangible asset arising from
development (or from the development phase of an
internal project) is recognised if, and only if, all of
the following have been demonstrated:
• the technical feasibility of completing the
intangible asset so that it will be available for
use or sale;
• the intention to complete the intangible asset
and use or sell it;
• the ability to use or sell the intangible asset;

NRW ANNUAL REPORT 2013Notes to the Financial Statements 81
NOTES TO THE FINANCIAL STATEMENTSFOR THE YEAR ENDED 30 JUNE 2013
• how the intangible asset will generate probable
future economic benefi ts;
• the availability of adequate technical,
fi nancial and other resources to complete the
development and to use or sell the intangible
asset; and
• the ability to measure reliably the expenditure
attributable to the intangible asset during
its development.
The amount initially recognised for internally-
generated intangible assets is the sum of the
expenditure incurred from the date when the
intangible asset fi rst meets the recognition criteria
listed above. Where no internally-generated
intangible asset can be recognised, development
expenditure is recognised in profi t or loss in the
period in which it is incurred.
Subsequent to initial recognition,
internally-generated intangible assets are reported
at cost less accumulated amortisation and
accumulated impairment losses, on the same basis
as intangible assets that are acquired separately.
2.16.3 Derecognition of intangible assets
An intangible asset is derecognised on disposal, or
when no future economic benefi ts are expected
from use or disposal. Gains or losses arising from
derecognition of an intangible asset, measured as
the difference between the net disposal proceeds
and the carrying amount of the asset are recognised
in profi t or loss when the asset is derecognised.
2.17 IMPAIRMENT OF TANGIBLE AND INTANGIBLE
ASSETS OTHER THAN GOODWILL
At the end of each reporting period, the Group
reviews the carrying amounts of its tangible and
intangible assets to determine whether there is
any indication that those assets have suffered an
impairment loss. If any such indication exists, the
recoverable amount of the asset is estimated in
order to determine the extent of the impairment
loss (if any). When it is not possible to estimate
the recoverable amount of an individual asset, the
Group estimates the recoverable amount of the cash
generating unit to which the asset belongs. When
a reasonable and consistent basis of allocation can
be identifi ed, corporate assets are also allocated to
individual cash-generating units, or otherwise they
are allocated to the smallest group of
cash-generating units for which a reasonable and
consistent allocation basis can be identifi ed.
Intangible assets with indefi nite useful lives and
intangible assets not yet available for use are tested
for impairment at least annually, and whenever there
is an indication that the asset may be impaired.
Recoverable amount is the higher of fair value less
costs to sell and value in use. In assessing value in
use, the estimated future cash fl ows are discounted
to their present value using a pre-tax discount rate
that refl ects current market assessments of the time
value of money and the risks specifi c to the asset
for which the estimates of future cash fl ows have
not been adjusted.
If the recoverable amount of an asset (or
cash-generating unit) is estimated to be less
than its carrying amount, the carrying amount
of the asset (or cash-generating unit) is reduced
to its recoverable amount. An impairment loss is
recognised immediately in profi t or loss, unless
the relevant asset is carried at a revalued amount,
in which case the impairment loss is treated as a
revaluation decrease (see 2.15 above).
2.18 INVENTORIES
Inventories are stated at the lower of cost and net
realisable value. Costs of inventories are determined
on a fi rst-in-fi rst-out basis. Net realisable value
represents the estimated selling price for inventories
less all estimated costs of completion and costs
necessary to make the sale.
2.19 PROVISIONS
Provisions are recognised when the Group has a
present obligation (legal or constructive) as a result
of a past event, it is probable that the Group will
be required to settle the obligation, and a reliable
estimate can be made of the amount of the obligation.
The amount recognised as a provision is the best
estimate of the consideration required to settle the
present obligation at the end of the reporting period,
taking into account the risks and uncertainties
surrounding the obligation. When a provision is
measured using the cash fl ows estimated to settle
the present obligation, its carrying amount is the
present value of those cash fl ows (where the effect
of the time value of money is material).
When some or all of the economic benefi ts required
to settle a provision are expected to be recovered

NRW ANNUAL REPORT 2013Notes to the Financial Statements82
NOTES TO THE FINANCIAL STATEMENTSFOR THE YEAR ENDED 30 JUNE 2013
from a third party, a receivable is recognised as an
asset if it is virtually certain that reimbursement will
be received and the amount of the receivable can
be measured reliably.
2.19.1 Provision for warranties
Provisions are made for the expected cost
of warranty obligations in relation to specifi c
construction contracts at reporting date. The
provision is measure as the present value of future
cash fl ows estimated to be required to settle the
warranty obligation. The future cash fl ows has been
estimated at the Directors’ best estimate of the
expenditure required to settle the Group’s obligation
and history of warranty claims.
2.20 FINANCIAL INSTRUMENTS
Financial assets and fi nancial liabilities are
recognised when a Group entity becomes a party to
the contractual provisions of the instrument.
Financial assets and fi nancial liabilities are initially
measured at fair value. Transaction costs that are
directly attributable to the acquisition or issue of
fi nancial assets and fi nancial liabilities (other than
fi nancial assets and fi nancial liabilities at fair value
through profi t or loss) are added to or deducted
from the fair value of the fi nancial assets or fi nancial
liabilities, as appropriate, on initial recognition.
Transaction costs directly attributable to the
acquisition of fi nancial assets or fi nancial liabilities
at fair value through profi t or loss are recognised
immediately in profi t or loss.
2.21 FINANCIAL ASSETS
Financial assets are classifi ed into the following
specifi ed categories: fi nancial assets ‘at fair value
through profi t or loss’ (FVTPL), ‘held-to-maturity’
investments, ‘available-for-sale’ (AFS) fi nancial
assets and ‘loans and receivables’. The classifi cation
depends on the nature and purpose for which
the investments were acquired. Management
determines the classifi cation of its investments at
initial recognition.
All regular way purchases or sales of fi nancial assets
are recognised and derecognised on a trade date
basis. Regular way purchases or sales are purchases
or sales of fi nancial assets that require delivery
of assets within the time frame established by
regulation or convention in the marketplace.
2.21.1 Effective interest method
The effective interest method is a method of
calculating the amortised cost of a debt instrument
and of allocating interest income over the relevant
period. The effective interest rate is the rate that
exactly discounts estimated future cash receipts
(including all fees on points paid or received that
form an integral part of the effective interest rate,
transaction costs and other premiums or discounts)
through the expected life of the debt instrument,
or (where appropriate) a shorter period, to the net
carrying amount on initial recognition.
Income is recognised on an effective interest basis
for debt instruments other than those fi nancial
assets classifi ed as at FVTPL.
2.21.2 Fair value
The fair values of quoted investments are based
on current bid prices. If the market for a fi nancial
asset is not active (and for unlisted securities),
the Group establishes fair value by using valuation
techniques. These include the use of recent arm’s
length transactions, reference to other instruments
that are substantially the same, discounted cash
fl ow analysis, and option pricing models making
maximum use of market inputs and relying as little
as possible on entity-specifi c inputs.
2.21.3 Financial assets at FVTPL
Financial assets are classifi ed as at FVTPL when
the fi nancial asset is either held for trading or it is
designated as at FVTPL.
A fi nancial asset is classifi ed as held for trading if:
• it has been acquired principally for the purpose
of selling it in the near term; or
• on initial recognition it is part of a portfolio of
identifi ed fi nancial instruments that the Group
manages together and has a recent actual
pattern of short-term profi t-taking; or
• it is a derivative that is not designated and
effective as a hedging instrument.
A fi nancial asset other than a fi nancial asset held for
trading may be designated as at FVTPL upon initial
recognition if:
• such designation eliminates or signifi cantly
reduces a measurement or recognition
inconsistency that would otherwise arise; or

NRW ANNUAL REPORT 2013Notes to the Financial Statements 83
NOTES TO THE FINANCIAL STATEMENTSFOR THE YEAR ENDED 30 JUNE 2013
• the fi nancial asset forms part of a group of
fi nancial assets or fi nancial liabilities or both, which
is managed and its performance is evaluated on
a fair value basis, in accordance with the Group’s
documented risk management or investment
strategy, and information about the grouping is
provided internally on that basis; or
• it forms part of a contract containing one or more
embedded derivatives, and AASB 139 ‘Financial
Instruments: Recognition and Measurement’
permits the entire combined contract (asset or
liability) to be designated as at FVTPL.
Financial assets at FVTPL are stated at fair value,
with any gains or losses arising on remeasurement
recognised in profi t or loss. The net gain or loss
recognised in profi t or loss incorporates any
dividend or interest earned on the fi nancial asset and
is included in the ‘other gains and losses’ line item in
the statement of comprehensive income.
2.21.4 Held-to-maturity investments
Bills of exchange and debentures with fi xed or
determinable payments and fi xed maturity dates
that the Group has the positive intent and ability to
hold to maturity are classifi ed as held-to-maturity
investments. Held-to-maturity investments are
measured at amortised cost using the effective
interest method less any impairment.
2.21.5 Loans and receivables
Trade receivables, loans, and other receivables
that have fi xed or determinable payments that are
not quoted in an active market are classifi ed as
‘loans and receivables’. Loans and receivables are
measured at amortised cost using the effective
interest method, less any impairment. Interest
income is recognised by applying the effective
interest rate, except for short-term receivables when
the recognition of interest would be immaterial.
2.21.6 Impairment of fi nancial assets
Financial assets, other than those at FVTPL, are
assessed for indicators of impairment at the end
of each reporting period. Financial assets are
considered to be impaired when there is objective
evidence that, as a result of one or more events
that occurred after the initial recognition of the
fi nancial asset, the estimated future cash fl ows of the
investment have been affected.
For certain categories of fi nancial asset, such as
trade receivables, assets that are assessed not to be
impaired individually are, in addition, assessed for
impairment on a collective basis.
For fi nancial assets carried at cost, the amount of
the impairment loss is measured as the difference
between the asset’s carrying amount and the
present value of the estimated future cash fl ows
discounted at the current market rate of return for a
similar fi nancial asset. Such impairment loss will not
be reversed in subsequent periods.
The carrying amount of the fi nancial asset is reduced
by the impairment loss directly for all fi nancial assets
with the exception of trade receivables, where the
carrying amount is reduced through the use of
an allowance account. When a trade receivable is
considered uncollectible, it is written off against
the allowance account. Subsequent recoveries of
amounts previously written off are credited against
the allowance account. Changes in the carrying
amount of the allowance account are recognised in
profi t or loss.
2.22 FINANCIAL LIABILITIES AND EQUITY
INSTRUMENTS
2.22.1 Classifi cation as debt or equity
Debt and equity instruments are classifi ed as either
fi nancial liabilities or as equity in accordance with
the substance of the contractual arrangement.
2.22.2 Equity instruments
An equity instrument is any contract that evidences
a residual interest in the assets of an entity after
deducting all of its liabilities. Equity instruments
issued by the Group are recognised at the proceeds
received, net of direct issue costs.
Repurchase of the Company’s own equity
instruments is recognised and deducted directly in
equity. No gain or loss is recognised in profi t or loss
on the purchase, sale, issue or cancellation of the
Company’s own equity instruments.
2.22.3 Other fi nancial liabilities
Other fi nancial liabilities, including borrowings, are
initially measured at fair value, net of transaction costs.
Other fi nancial liabilities are subsequently measured
at amortised cost using the effective interest
method, with interest expense recognised on an
effective yield basis.

NRW ANNUAL REPORT 2013Notes to the Financial Statements84
NOTES TO THE FINANCIAL STATEMENTSFOR THE YEAR ENDED 30 JUNE 2013
The effective interest method is a method of
calculating the amortised cost of a fi nancial liability
and of allocating interest expense over the relevant
period. The effective interest rate is the rate that
exactly discounts estimated future cash payments
through the expected life of the fi nancial liability,
or (where appropriate) a shorter period, to the net
carrying amount on initial recognition.
2.22.4 Derecognition of fi nancial liabilities
The Group derecognises fi nancial liabilities when,
and only when, the Group’s obligations are
discharged, cancelled or they expire. The difference
between the carrying amount of the fi nancial
liability derecognised and the consideration paid
and payable is recognised in profi t or loss.
2.23 TRADE AND OTHER PAYABLES
These amounts represent liabilities for goods and
services provided to the Group prior to the end
of fi nancial year which are unpaid. The amounts
are unsecured and are usually paid within 45 to 75
days of recognition. Trade and other payables are
presented as current liabilities unless payment is not
due within 12 months from the reporting date.
2.24 GOODS AND SERVICES TAX
Revenues, expenses and assets are recognised net of
the amount of goods and services tax (GST), except:
• where the amount of GST incurred is not
recoverable from the taxation authority, it is
recognised as part of the cost of acquisition of
an asset or as part of an item of expense; or
• for receivables and payables which are
recognised inclusive of GST.
The net amount of GST recoverable from, or payable
to, the taxation authority is included as part of
receivables or payables.
Cash fl ows are included in the statement of cash
fl ows on a gross basis. The GST component of cash
fl ows arising from investing and fi nancing activities
which is recoverable from, or payable to, the taxation
authority is classifi ed within operating cash fl ows.
2. 25 CASH AND CASH EQUIVALENTS
Cash and cash equivalents include cash on hand,
deposits held at call with banks, other short-term
highly liquid investments with original maturities
of three months or less. Bank overdrafts are shown
within short-term borrowings in current liabilities on
the statement of fi nancial position.
2.26 DIVIDENDS
Provision is made for the amount of any dividend
declared, being appropriately authorised and no
longer at the discretion of the entity, on or before
the end of the fi nancial year but not distributed at
balance date.
2.27 EARNINGS PER SHARE
2.27.1 Basic earnings per share
Basic earnings per share is calculated by dividing
the profi t attributable to equity holders of the
Company, excluding any costs of servicing equity
other than ordinary shares, by the weighted average
number of ordinary shares outstanding during
the fi nancial year, adjusted for bonus elements in
ordinary shares issued during the year.
2.27.2 Diluted earnings per share
Diluted earnings per share adjusts the fi gures used
in the determination of basic earnings per share
to take into account the after income tax effect of
interest and other fi nancing costs associated with
dilutive potential ordinary shares and the weighted
average number of shares assumed to have been
issued for no consideration in relation to dilutive
potential ordinary shares.
2.28 SHARE-BASED PAYMENTS
Share based compensation payments are provided
to employees in accordance to the Company’s
Employee Share Plan (‘ESP’) and Long Term
Incentive Plan (‘LTIP’) detailed in Note 31. The
Employee Share Plan (‘ESP’) is accounted for as
an “in-substance” option plan due to the limited
recourse nature of the loan between the employees
and the Company to fi nance the purchase of
ordinary shares.
Share based compensation payments are measured
at the fair value of the equity instruments at
the grant date. The fair value at grant date is
independently determined using the valuation
methods detailed in Note 31. The fair value of
the options granted is adjusted to refl ect market
Vesting Conditions, but excludes the impact of any
non-market Vesting Conditions.
The fair value determined at the grant date of the
equity-settled share based payments is expensed on
NRW ANNUAL REPORT 2013Notes to the Financial Statements 85
NOTES TO THE FINANCIAL STATEMENTSFOR THE YEAR ENDED 30 JUNE 2013
a straight-line basis over the vesting period, based
on the Company’s estimate of equity instruments
that will eventually vest. At the end of each
reporting period, the Company revises its estimate
of the number of equity instruments expected
to vest. The impact of the revision of the original
estimates, if any, is recognised in profi t or loss such
that the cumulative expense refl ects the revised
estimate, with a corresponding adjustment to the
equity-settled employee benefi ts reserve.
Upon the exercise of options / performance rights,
the balance of the share-based payments reserve
relating to those options / performance rights is
transferred to issued capital and the proceeds
received, net of any directly attributable transaction
costs, are credited to issued capital.
3. CRITICAL ACCOUNTING JUDGMENTS AND KEY SOURCES OF ESTIMATION UNCERTAINTY
In the application of the Group’s accounting policies,
which are described in Note 2, the Directors are
required to make judgements, estimates and
assumptions about the carrying amounts of
assets and liabilities. The estimates and associated
assumptions are based on historical experience and
other factors that are considered to be relevant.
Actual results may differ from these estimates.
The estimates and underlying assumptions are
reviewed on an ongoing basis. Revisions to
accounting estimates are recognised in the period in
which the estimate is revised if the revision affects
only that period, or in the period of the revision and
future periods if the revision affects both current
and future periods.
3.1 CRITICAL JUDGEMENTS IN APPLYING
ACCOUNTING POLICIES
The following are the critical judgements, apart
from those involving estimations (see Section 3.2
below), that the Directors have made in the process
of applying the Group’s accounting policies and that
have the most signifi cant effect on the amounts
recognised in the consolidated fi nancial statements.
3.1.1 Revenue recognition
Construction contract revenue is recognised in profi t
or loss when the outcome of a construction contract
can be measured reliably, in proportion to the stage
of completion of the contract. Contract revenue
includes the initial amount agreed in the contract
plus any variations in contract work, claims and
incentive payments to the extent that it is probable
that they will result in revenue and can be measured
reliably. The stage of completion is assessed by
reference to surveys of work performed. When
the outcome of a construction contract cannot be
measured reliably, contract revenue is recognised
only to the extent of contract costs incurred that
are likely to be recoverable. An expected loss on a
contract is recognised immediately in profi t or loss.
3.1.2 Share based payments
The Group measures the cost of equity settled
transactions with key management personnel at the
fair value of the equity instruments at the date at
which they are granted. The fair value is determined
using a valuation methods detailed in Note 31.
One of the inputs into the valuation model is
volatility of the underlying share price which is
estimated on the two year history of the share
price and has been estimated at 50%. The share
price used in the valuation model is based on
the Company’s share price at grant date of each
performance right.
The fair value determined at the grant date of the
equity-settled share-based payments is expensed
on a straight-line basis over the vesting period,
based on the Group’s estimate of equity instruments
that will eventually vest, with a corresponding
increase in equity. At the end of each reporting
period, the Group revises its estimate of the
number of equity instruments expected to vest.
The impact of the revision of the original estimates,
if any, is recognised in profi t or loss such that the
cumulative expense refl ects the revised estimate,
with a corresponding adjustment to the share based
payment reserve.
3.2 KEY SOURCES OF ESTIMATION UNCERTAINTY
The following are the key assumptions concerning
the future, and other key sources of estimation
uncertainty at the end of the reporting period,
that have a signifi cant risk of causing a material
adjustment to the carrying amounts of assets and
liabilities within the next fi nancial year.
The preparation of fi nancial statements requires
management to make judgements, estimates
and assumptions that affect the application of

NRW ANNUAL REPORT 2013Notes to the Financial Statements86
NOTES TO THE FINANCIAL STATEMENTSFOR THE YEAR ENDED 30 JUNE 2013
accounting policies and the reported amounts of assets, liabilities, income and expenses. Actual results may
differ from these estimates.
Estimates and underlying assumptions are reviewed on an ongoing basis. Revisions to accounting estimates
are recognised in the period in which the estimate is revised and in any future periods affected.
3.2.1 Construction contracts
The Group accounts for construction contracts in accordance with AASB 111 Construction Contracts.
Accounting for construction contracts involves the continuous use of assessed estimates based on a number
of detailed assumptions consistent with the project scope and schedule, contract and risk management
processes. These contracts may span several accounting periods requiring estimates and assumptions to be
updated on a regular basis.
Details of the estimation procedures followed in accounting for the Group’s construction contracts are
detailed below.
(i) Forecast costs to completion: Regularly management update forecast costs at completion in accordance
with upon agreed work scope and variations. Forecast costs are based on rates expected to be applied
to the related activity to be undertaken.
(ii) Revenues: Revenues refl ect the contract price agreed in the contract and variations where it is probable
that the client will approve those variations or where negotiations are at fi nal stages with the client.
3.2.2 Goodwill impairment
Determining whether goodwill is impaired requires an estimation of the inputs of the value in use of the cash-
generating units to which goodwill has been allocated. The value in use calculation requires the entity to estimate
the future cash fl ows expected to arise from the cash-generating unit and a suitable discount rate in order to
calculate present value. In this regard the future cash fl ows are estimated based on approved budgets relating to
the cash-generating units.
The carrying amount of goodwill at 30 June 2013 was $24.4 million (30 June 2012: $24.4 million). The
Directors determined no impairment of goodwill during the current year (2012: Nil). Details of the goodwill
carrying amount can be found at Note 20.
3.2.3 Employee entitlements
Management judgement is applied in determining the following key assumptions used in the calculation of
long service leave at balance date:
(i) future increases in wages and salaries;
(ii) future on cost rates; and
(iii) employee departures and period of service.
3.2.4 Useful lives of property, plant and equipment
As described at Section 2.15 above, the Group reviews the estimated useful lives of property, plant and
equipment at the end of each reporting period. The effective lives are based on intended utilisation and
working conditions. Also demand for specifi c plant and equipment will affect the plant modelling giving
rise to a certain degree of fl uctuations and subjectiveness.
3.2.5 Provision for warranties
As described in 2.19.1, the Group recognises provisions for warranties for obligations in relation to specifi c
construction contracts. The future outfl ow of cash has been estimated at the Directors’ best estimate of the
expenditure required to settle the Group’s obligation and history of warranty claims.

NRW ANNUAL REPORT 2013Notes to the Financial Statements 87
NOTES TO THE FINANCIAL STATEMENTSFOR THE YEAR ENDED 30 JUNE 2013
4. APPLICATION OF NEW AND REVISED ACCOUNTING STANDARDS
4.1 STANDARDS AND INTERPRETATIONS ADOPTED IN THE CURRENT YEAR
The following new and revised Standards and Interpretations have been adopted in the current year and
have affected the amounts reported in these fi nancial statements.
Standards affecting presentation and disclosure
Amendments to AASB 101 ‘Presentation of Financial Statements’
The amendment (part of AASB 2011-9 ‘Amendments to Australian Accounting Standards - Presentation of Items of Other Comprehensive Income’ introduce new terminology for the statement of comprehensive income and income statement. Under the amendments to AASB 101, the statement of comprehensive income is renamed as a statement of profi t or loss and other comprehensive income and the income statement is renamed as a statement of profi t or loss. The amendments to AASB 101 retain the option to present profi t or loss and other comprehensive income in either a single statement or in two separate but consecutive statements. However, the amendments to AASB 101 require items of other comprehensive income to be grouped into two categories in the other comprehensive income section: (a) items that will not be reclassifi ed subsequently to profi t or loss and (b) items that may be reclassifi ed subsequently to profi t or loss when specifi c conditions are met. Income tax on items of other comprehensive income is required to be allocated on the same basis – the amendments do not change the option to present items of other comprehensive income either before tax or net of tax. The amendments have been applied retrospectively, and hence the presentation of items of other comprehensive income has been modifi ed to refl ect the changes. Other than the above mentioned presentation changes, the application of the amendments to AASB 101 does not result in any impact on profi t or loss, other comprehensive income and total comprehensive income.
The amendments (part of AASB 2012-5 ‘Further Amendments to Australian Accounting Standards arising from Annual Improvements 2009-2011 Cycle’) requires an entity that changes accounting policies retrospectively, or makes a retrospective restatement or reclassifi cation to present a statement of fi nancial position as at the beginning of the preceding period (third statement of fi nancial position), when the retrospective application, restatement or reclassifi cation has a material eff ect on the information in the third statement of fi nancial position. The related notes to the third statement of fi nancial position are not required to be disclosed.
Standards and Interpretations affecting the reported results or fi nancial position
There are no new and revised Standards and Interpretations adopted in these fi nancial statements affecting
the reporting results or fi nancial position.
4.2 Standards and Interpretations in issue not yet adopted
At the date of authorisation of the fi nancial statements, the Standards and Interpretations listed below were
in issue but not yet effective.

NRW ANNUAL REPORT 2013Notes to the Financial Statements88
NOTES TO THE FINANCIAL STATEMENTSFOR THE YEAR ENDED 30 JUNE 2013
Standard/InterpretationEff ective for annual reporting periods
beginning on or after
Expected to be initially applied in the fi nancial
year ending
AASB 9 ‘Financial Instruments’, and the relevant amending standards1 1 January 2015 30 June 2016
AASB 10 ‘Consolidated Financial Statements’ and AASB 2011-7 ‘Amendments to Australian Accounting Standards arising from the consolidation and Joint Arrangements standards’
1 January 2013 30 June 2014
AASB 11 ‘Joint Arrangements’ and AASB 2011-7 ‘Amendments to Australian Accounting Standards arising from the consolidation and Joint Arrangements standards’
1 January 2013 30 June 2014
AASB 12 ‘Disclosure of Interests in Other Entities’ and AASB 2011-7 ‘Amendments to Australian Accounting Standards arising from the consolidation and Joint Arrangements standards’
1 January 2013 30 June 2014
AASB 127 ‘Separate Financial Statements’ (2011) and AASB 2011-7 ‘Amendments to Australian Accounting Standards arising from the consolidation and Joint Arrangements standards’
1 January 2013 30 June 2014
AASB 128 ‘Investments in Associates and Joint Ventures’ (2011) and AASB 2011-7 ‘Amendments to Australian Accounting Standards arising from the consolidation and Joint Arrangements standards’
1 January 2013 30 June 2014
AASB 13 ‘Fair Value Measurement’ and AASB 2011-8 ‘Amendments to Australian Accounting Standards arising from AASB 13’
1 January 2013 30 June 2014
AASB 119 ‘Employee Benefi ts’ (2011) and AASB 2011-10 ‘Amendments to Australian Accounting Standards arising from AASB 119 (2011)’
1 January 2013 30 June 2014
AASB 2011-4 ‘Amendments to Australian Accounting Standards to Remove Individual Key Management Personnel Disclosure Requirements’
1 July 2013 30 June 2014
AASB 2012-2 ‘Amendments to Australian Accounting Standards – Disclosures – Off setting Financial Assets and Financial Liabilities’
1 January 2013 30 June 2014
AASB 2012-3 ‘Amendments to Australian Accounting Standards – Off setting Financial Assets and Financial Liabilities’
1 January 2014 30 June 2015
AASB 2012-5 ‘Amendments to Australian Accounting Standards arising from Annual Improvements 2009–2011 Cycle’
1 January 2013 30 June 2014
AASB 2012-10 ‘Amendments to Australian Accounting Standards – Transition Guidance and Other Amendments’
1 January 2013 30 June 2014
Interpretation 20 ‘Stripping Costs in the Production Phase of a Surface Mine’ and AASB 2011-12 ‘Amendments to Australian Accounting Standards arising from Interpretation 20’
1 January 2013 30 June 2014
1 The AASB has issued the following versions of AASB 9 and the relevant amending standards;
• AASB 9 ‘Financial Instruments’ (December 2009), AASB 2009-11 ‘Amendments to Australian Accounting
Standards arising from AASB 9’, AASB 2012-6 ‘Amendments to Australian Accounting Standards –
Mandatory Effective Date of AASB 9 and Transition Disclosures’
• AASB 9 ‘Financial Instruments’ (December 2010), AASB 2010-7 ‘Amendments to Australian Accounting
Standards arising from AASB 9 (December 2010)’, AASB 2012-6 ‘Amendments to Australian Accounting
Standards – Mandatory Effective Date of AASB 9 and Transition Disclosure’.
For annual reporting periods beginning before 1 January 2015, an entity may early adopt either AASB 9

NRW ANNUAL REPORT 2013Notes to the Financial Statements 89
NOTES TO THE FINANCIAL STATEMENTSFOR THE YEAR ENDED 30 JUNE 2013
(December 2009) or AASB 9 (December 2010) and the relevant amending standards.
At the date of authorisation of the fi nancial statements, the following IASB Standards and IFRIC
Interpretations were also in issue but not yet effective, although Australian equivalent Standards and
Interpretations have not yet been issued.
Standard/Interpretation Eff ective for annual reporting periods beginning on or after
Expected to be initially applied in the fi nancial year ending
None.
The impact of these recently issued or amended standards and interpretations have not been determined as
yet by the Company.
5. SEGMENT REPORTING
The Group’s operating segments are based on the information that is available to the chief operating
decision maker and the Board of Directors.
Segment results are reviewed regularly by the chief operating decision maker and the Board of Directors.
The segment results and segment assets include all items directly attributable to each of the segments and
any transaction, asset or liability that can be allocated on a reasonable basis. Unallocated items comprise
predominantly of expenses that are not specifi c to the performance of an individual operating segment.
All intercompany and related transactions are made at arm’s length at what is considered by management to
be commercial rates as outlined in the related party Note 36.
The operating segments remain unchanged from prior years and represent core activity of the group. The
following are the reportable segments:
A) REPORTABLE SEGMENTS
• Civil Contracting. The provision of civil infrastructure and other construction services including rail
formation, concrete installation, bulk earthworks and detailed road and tunnel construction.
• Mining Services. This segment continues to operate in mining contracting services including earth
moving, waste stripping, ore haulage and related ancillary services.
• Drilling and Blasting. To provide services to internal and external requirements regarding drilling and
blasting activities, commencing in Australia.
• Equipment Sales. The activity historically comprised predominantly of plant and equipment sales and
earth moving tyres and no longer forms part of operating activities.
• Fabrication and Repair Services. The provision of equipment repairs, sandblasting and painting services,
service truck and water tanker fabrication and import services, including quarantine cleaning.
B) GEOGRAPHICAL INFORMATION
As with prior years the predominantly core geographic regions comprise of Australia and West Africa –
Guinea. The Guinea operation has been completed during FY13 and the Group continues to pursue other
international projects for its core segments above.

NRW ANNUAL REPORT 2013Notes to the Financial Statements90
NOTES TO THE FINANCIAL STATEMENTSFOR THE YEAR ENDED 30 JUNE 2013
Revenue volumes and total assets achieved in the two geographical segments comprise of:
REVENUE FROM EXTERNAL CUSTOMERS TOTAL CURRENT AND NON-CURRENT ASSETS
2013 2012 2013 2012
$’000 $’000 $’000 $’000
Australia 1,352,275 1,322,004 807,652 832,811
West Africa – Guinea 22,128 36,772 6,353 14,227
TOTAL 1,374,403 1,358,776 814,005 847,038
C) REPORTABLE SEGMENT REVENUES AND RESULTS
SEGMENT REVENUE SEGMENT PROFIT (LOSS)
2013 2012 2013 2012
$’000 $’000 $’000 $’000
Civil Contracting 860,641 731,691 92,034 81,639
Mining Services 404,526 542,161 17,938 63,957
Drilling & Blasting Services 150,533 113,135 16,819 18,744
Equipment Sales - 547 - (1,045)
Fabrication & Repair Services 41,804 46,591 3,308 4,610
Eliminations (83,102) (75,349) - -
Total for continuing operations 1,374,402 1,358,776 130,099 167,905
Other unallocated expenses (10,659) (13,911)
Net fi nance costs (14,677) (12,860)
Income tax expense (30,656) (43,992)
PROFIT FOR THE PERIOD 74,107 97,142
D) SEGMENT ASSETS AND LIABILITIES
SEGMENT ASSETS
2013 2012
$’000 $’000
Civil Contracting 291,422 274,221
Mining Services 395,788 477,661
Drilling & Blasting Services 52,782 39,082
Equipment Sales - 26
Fabrication & Repair Services 41,720 39,817
Other unallocated assets 32,292 16,231
CONSOLIDATED ASSETS 814,005 847,038

NRW ANNUAL REPORT 2013Notes to the Financial Statements 91
NOTES TO THE FINANCIAL STATEMENTSFOR THE YEAR ENDED 30 JUNE 2013
SEGMENT LIABILITIES
2013 2012
$’000 $’000
Civil Contracting (172,930) (171,567)
Mining Services (213,400) (288,694)
Drilling & Blasting Services (37,009) (35,159)
Equipment Sales - (68)
Fabrication & Repair Services (7,464) (6,305)
Other unallocated liabilities (30,332) (16,067)
CONSOLIDATED LIABILITIES (461,135) (517,860)
E) INFORMATION ABOUT MAJOR CUSTOMERS
Revenue derived from each of the segment’s major customers are calculated as $420.496 million (2012: $256.802
million) in the civil division relating to one customer, $161.800 million (2012: $261.404 million) in the mining
division relating to one customer, $96.571 million (2012: $67.88 million) in the drilling and blasting division relating
to one customer, $0 million (2012: $0.31 million) in the equipment sales division relating to one customer and
$3.534 million (2012: $9.36 million) in the fabrication and repair division relating to one customer.
F) OTHER SEGMENT INFORMATION
Depreciation and amortisation Additions to non-current assets
2013 2012 2013 2012
$’000 $’000 $’000 $’000
Civil Contracting 11,198 11,516 11,825 16,571
Mining Services 32,187 27,002 51,581 105,526
Drilling & Blasting Services 3,996 1,880 15,924 15,110
Equipment Sales - 26 - -
Fabrication & Repair Services 425 346 1,815 559
Other 1,078 1,124 12,003 6,657
TOTAL FOR CONTINUING OPERATIONS 48,885 41,894 93,148 144,423
6. REVENUE
CONSOLIDATED
2013 2012
$’000 $’000
Revenue from the sale of goods 18,834 26,108
Revenue from the rendering of services 1,355,569 1,332,668
TOTAL REVENUE 1,374,403 1,358,776

NRW ANNUAL REPORT 2013Notes to the Financial Statements92
NOTES TO THE FINANCIAL STATEMENTSFOR THE YEAR ENDED 30 JUNE 2013
7. OTHER INCOME (LOSS)
CONSOLIDATED
2013 2012
$’000 $’000
Net (loss) on sale of property plant and equipment (2,811) (887)
Other income (164) 2,950
TOTAL (2,975) 2,063
8. FINANCE COSTS
CONSOLIDATED
2013 2012
$’000 $’000
Interest Income 786 1,498
TOTAL FINANCE INCOME 786 1,498
Interest on obligations under fi nance leases (15,450) (14,209)
Interest on bank overdrafts and loans (13) (149)
TOTAL FINANCE EXPENSES (15,462) (14,358)
NET FINANCE EXPENSE (14,677) (12,860)
9. PROFIT FOR THE YEAR FROM CONTINUING OPERATIONS
A) OTHER EXPENSES
Profi t for the year from continuing operations has been arrived at after charging:
CONSOLIDATED
2013 2012
$’000 $’000
Depreciation of non-current assets (43,930) (41,568)
Amortisation (4,955) (326)
(48,885) (41,894)
Operating lease payments (12,928) (5,141)
Rental hire payments (156,096) (198,086)
Other (57,145) (65,377)
(226,169) (268,604)
Employee benefi ts expense:
Wages and salaries (396,984) (366,794)
Superannuation contributions (28,779) (27,453)
Share based payments (1,042) (1,576)
(426,805) (395,823)

NRW ANNUAL REPORT 2013Notes to the Financial Statements 93
NOTES TO THE FINANCIAL STATEMENTSFOR THE YEAR ENDED 30 JUNE 2013
10. INCOME TAXES RELATING TO CONTINUING OPERATIONS
A) RECOGNISED IN PROFIT OR LOSS
CONSOLIDATED
2013 2012
$’000 $’000
CURRENT TAX EXPENSE
Current year income tax 19,002 37,897
Adjustments for prior years income tax 524 1,385
19,526 39,282
DEFERRED TAX EXPENSE
Origination and reversal of temporary diff erences 11,130 4,710
TOTAL TAX EXPENSE 30,656 43,992
B) RECONCILIATION OF EFFECTIVE TAX RATE
CONSOLIDATED
2013 2012
$’000 $’000
Profi t for the period 104,763 141,134
INCOME TAX USING THE COMPANY’S DOMESTIC TAX RATE OF 30% 31,429 42,340
Changes in income tax expense due to:
Non-allowable expenses 161 551
Tax losses 2 1,165
Over provision for prior years (504) (67)
Over provision for prior years – Research & Development Claim (435) -
Eff ect of diff erent income tax rates for subsidiaries operating in a diff erent tax jurisdiction 4 3
TOTAL INCOME TAX EXPENSE 30,656 43,992
Eff ective tax rate 29.26% 31.17%

NRW ANNUAL REPORT 2013Notes to the Financial Statements94
NOTES TO THE FINANCIAL STATEMENTSFOR THE YEAR ENDED 30 JUNE 2013
C) RECOGNISED DIRECTLY IN EQUITY
CONSOLIDATED
2013 2012
$’000 $’000
Share issue costs (30%) - -
TOTAL - -
D) CURRENT TAX ASSETS AND LIABILITIES
CONSOLIDATED
2013 2012
$’000 $’000
CURRENT TAX ASSETS AND LIABILITIES
Income tax receivable 3,773 -
Income tax payable - 22,913
The Group is not part of a tax consolidated group.
E) DEFERRED TAX BALANCES
ASSETS LIABILITIES NET
2013 2012 2013 2012 2013 2012
$’000 $’000 $’000 $’000 $’000 $’000
Share based payments 313 - - - 313 (1)
Costs of equity raising FY2011 267 401 - - 267 401
Provisions 5,202 8,577 - - 5,202 8,577
Work in progress (construction) - - (10,313) (14,376) (10,313) (14,375)
Inventories - 15 (9,098) (6,590) (9,098) (6,575)
PP&E 171 93 (14,237) (6,960) (14,067) (6,867)
Other creditors and accruals 3,169 4,383 - - 3,169 4,383
Other assets 17 72 (2,775) (1,772) (2,758) (1,700)
DEFERRED TAX ASSETS / (LIABILITIES) 9,138 13,541 (36,424) (29,698) (27,286) (16,157)

NRW ANNUAL REPORT 2013Notes to the Financial Statements 95
NOTES TO THE FINANCIAL STATEMENTSFOR THE YEAR ENDED 30 JUNE 2013
11. EARNINGS PER SHARE
CONSOLIDATED
2013 2012
CENTS PER SHARE CENTS PER SHARE
Basic earnings per share 26.6 34.8
Diluted earnings per share 26.5 34.7
A) BASIC EARNINGS PER SHARE
The earnings and weighted average number of ordinary shares used in the calculation of basic earnings per
share are as follows:
CONSOLIDATED
2013 2012
$‘000 $‘000
Profi t for the year 74,107 97,142
Weighted average number of shares for the purposes of basic earnings per share (No.) 278,877 278,888
B) DILUTED EARNINGS PER SHARE
The earnings used in the calculation of diluted earnings per share is as follows:
CONSOLIDATED
2013 2012
$‘000 $‘000
Profi t for the year 74,107 97,142
The weighted average number of ordinary shares used in the calculation of diluted earnings per share is as follows:
CONSOLIDATED
2013 2012
#No. ‘000 #No. ‘000
Weighted average number of shares for the purposes of basic earnings per share 278,877 278,888
Shares deemed to be issued for no consideration in respect of:
- Options - -
- Performance rights 271 765
Weighted average number of shares used for the purposes of diluted earnings per share 279,148 279,653

NRW ANNUAL REPORT 2013Notes to the Financial Statements96
NOTES TO THE FINANCIAL STATEMENTSFOR THE YEAR ENDED 30 JUNE 2013
12. CASH AND CASH EQUIVALENTS
CONSOLIDATED
2013 2012
$’000 $’000
Cash and cash equivalents 130,994 137,955
130,994 137,955
Cash and cash equivalents includes cash on hand and in banks.
13. RECEIVABLES
A) TRADE AND OTHER RECEIVABLES
CONSOLIDATED
2013 2012
$’000 $’000
Current receivables
Trade Receivables 67,096 134,038
Other Receivables 434 311
Retentions 4,324 164
Securities (property bonds) 80 83
SUBTOTAL 71,934 134,596
Construction Work in Progress (Note 21) 133,118 145,842
TOTAL TRADE & OTHER RECEIVABLES 205,052 280,438
The average credit period on sales of goods is 45 days. Allowances for doubtful debts are recognised against
trade receivables between 60 days and 120 days based on estimated irrecoverable amounts determined
by reference to past default experience of the counterparty and an analysis of the counterparty’s current
fi nancial position.
B) MOVEMENT IN THE ALLOWANCE FOR DOUBTFUL DEBTS
CONSOLIDATED
2013 2012
$’000 $’000
Balance at the beginning of the year - (56)
Impairment losses recognised on receivables - -
Amounts written off during the year as uncollectible - -
Amounts recovered during the year - 56
BALANCE AT END OF YEAR - -

NRW ANNUAL REPORT 2013Notes to the Financial Statements 97
NOTES TO THE FINANCIAL STATEMENTSFOR THE YEAR ENDED 30 JUNE 2013
C) AGEING OF IMPAIRED TRADE RECEIVABLES
CONSOLIDATED
2013 2012
$’000 $’000
60-90 days - -
90-120 days - -
120+ days - -
BALANCE AT END OF YEAR - -
In determining the recoverability of a trade receivable, the Group considers any change in the credit quality
of the trade receivable from the date credit was initially granted up to the end of the reporting period. The
Directors believe that there is no further allowance required in excess of the allowance for doubtful debts.
D) AGE OF RECEIVABLES THAT ARE PAST DUE BUT NOT IMPAIRED
CONSOLIDATED
2013 2012
$’000 $’000
60-90 days 3,112 4,073
90-120 days 159 294
120+ days 3,124 2,505
TOTAL 6,395 6,872
These relate to a number of trade receivable balances where for various reasons the payment terms have not
been met. These receivables have been assessed to be fully recoverable.
14. INVENTORIES
CONSOLIDATED
2013 2012
$’000 $’000
Raw materials and consumables 42,953 28,356
Work in progress 5,594 5,018
BALANCE AT 30 JUNE 48,547 33,374
15. OTHER CURRENT ASSETS
CONSOLIDATED
2013 2012
$’000 $’000
Prepayments 5,400 4,149
TOTAL 5,400 4,149

NRW ANNUAL REPORT 2013Notes to the Financial Statements98
NOTES TO THE FINANCIAL STATEMENTSFOR THE YEAR ENDED 30 JUNE 2013
16. PROPERTY, PLANT AND EQUIPMENT
Property, plant and equipment held by the consolidated entity include:
LAND BUILDINGS LEASEHOLD IMPROVEMENTS
PLANT AND EQUIPMENT TOTAL
$’000 $’000 $’000 $’000 $’000
COST
Balance at 30 June 2011 - 1,959 1,083 385,479 388,521
Eff ect of foreign currency exchange diff erences
- - - 2 2
Additions - 4,290 122 140,011 144,423
Disposals - (2) - (7,466) (7,468)
BALANCE AS AT 30 JUNE 2012 6,246 1,205 518,026 525,478
Eff ect of foreign currency exchange diff erences
- - - 9 9
Additions 3,218 1,201 34 76,090 80,544
Disposals - - - (36,771) (36,771)
BALANCE AS AT 30 JUNE 2013 3,218 7,447 1,239 557,355 569,260
DEPRECIATION
Balance at 30 June 2011 - 385 339 120,110 120,835
Depreciation - 545 121 40,901 41,568
Eff ect of foreign currency exchange diff erences
- - - 1 1
Disposals - (2) - (3,102) (3,104)
BALANCE AS AT 30 JUNE 2012 - 928 461 157,910 159,299
Depreciation - 1,052 131 42,747 43,930
Eff ect of foreign currency exchange diff erences
- - - 5 5
Disposals - - (21,669) (21,669)
BALANCE AS AT 30 JUNE 2013 - 1980 592 178,993 181,565
CARRYING AMOUNTS
At 30 June 2012 - 5,318 745 360,116 366,179
At 30 June 2013 3,218 5,467 647 378,363 387,695

NRW ANNUAL REPORT 2013Notes to the Financial Statements 99
NOTES TO THE FINANCIAL STATEMENTSFOR THE YEAR ENDED 30 JUNE 2013
17. OTHER INTANGIBLE ASSETS
CONSOLIDATED
CARRYING AMOUNTS OF: 2013 2012
$’000 $’000
Capital Development of Information Systems 7,198 526
Software Licenses 928 -
TOTAL 8,126 526
INTANGIBLES – CAPITALISED DEVELOPMENT
INTANGIBLES – LICENCES TOTAL
$’000 $’000 $’000
COST
Balance at 30 June 2011 1,005 - 1,005
Disposals - - -
BALANCE AS AT 30 JUNE 2012 1,005 - 1,005
Additions 11,165 1,429 12,595
Disposals (51) - (51)
BALANCE AS AT 30 JUNE 2013 12,119 1,429 13,549
AMORTISATION
Balance at 30 June 2011 153 - 153
Amortisation expense 326 - 326
BALANCE AS AT 30 JUNE 2012 479 - 479
Amortisation expense 4,453 502 4,955
Disposals (11) - (11)
BALANCE AS AT 30 JUNE 2013 4,921 502 5,423
CARRYING AMOUNTS
At 30 June 2012 526 - 526
At 30 June 2013 7,198 928 8,126
The intangibles comprise of capital development of information systems and software licenses. The effective
useful lives of the intangibles has been identifi ed as three years for the general network development and
four years for software development costs and amortised accordingly. The carrying value will be assessed at
least annually ongoing by the Directors.

NRW ANNUAL REPORT 2013Notes to the Financial Statements100
NOTES TO THE FINANCIAL STATEMENTSFOR THE YEAR ENDED 30 JUNE 2013
18. CONSOLIDATED ENTITIES
PRINCIPLE ACTIVITIES COUNTRY OF INCORPORATION OWNERSHIP INTEREST
2013 2012
PARENT ENTITY
NRW Holdings Limited Holding Company Australia - -
WHOLLY OWNED SUBSIDIARIES
NRW Pty Ltd as trustee for NRW Unit Trust Civil and Mining Australia 100% 100%
Action Mining Services Pty Ltd (formerly Actionblast Pty Ltd)Repairs and Fabrication
Australia 100% 100%
NRW Mining Pty Ltd Investment Shell Australia 100% 100%
NRW Intermediate Holdings Pty Ltd Intermediary Australia 100% 100%
ACN 107724274 Pty Ltd Plant and Tyre Sales Australia 100% 100%
NRW Guinea SARL Contract Services Guinea 100% 100%
Indigenous Mining & Exploration Company Pty Ltd Investment Shell Australia 100% 100%
NRW International Holdings Pty Ltd Investment Shell Australia 100% 100%
Action Drill and Blast Pty Ltd (formerly NRW Drill & Blast Pty Ltd ) Drilling and Blasting Australia 100% 100%
All of the wholly-owned subsidiaries in Australia have entered into a deed of cross guarantee with NRW
Holdings Limited pursuant to the ASIC Class Order 98/1418 and are relieved from the requirement to prepare
and lodge an audited fi nancial report.
NRW Guinea SARL is a wholly owned subsidiary of NRW Holdings Limited and is incorporated in the
Republique of Guinea (West Africa) and not part of the above deed of cross guarantee arrangements.

NRW ANNUAL REPORT 2013Notes to the Financial Statements 101
NOTES TO THE FINANCIAL STATEMENTSFOR THE YEAR ENDED 30 JUNE 2013
The consolidated statement of comprehensive income of the entities party to the deed of cross guarantees are:
CONSOLIDATED
2013 2012
$’000 $’000
STATEMENT OF COMPREHENSIVE INCOME
Revenue 1,374,333 1,358,690
Other income (3,020) 1,927
Finance income 786 1,498
Finance costs (15,462) (14,358)
Materials and consumables used (204,530) (176,754)
Employee benefi ts expense (426,147) (394,608)
Subcontractor costs (298,751) (283,767)
Depreciation and amortisation expenses (48,871) (41,887)
Plant and equipment costs (226,067) (268,365)
Travel and accommodation (38,792) (31,855)
Other expenses (8,799) (9,447)
PROFIT BEFORE INCOME TAX 104,680 141,074
Income tax expense (30,627) (43,971)
PROFIT FOR THE YEAR 74,053 97,103
CONSOLIDATED
2013 2012
$’000 $’000
OTHER COMPREHENSIVE INCOME
Exchange diff erences arising on translation of foreign operations - -
TOTAL COMPREHENSIVE INCOME FOR THE YEAR 74,053 97,103

NRW ANNUAL REPORT 2013Notes to the Financial Statements102
NOTES TO THE FINANCIAL STATEMENTSFOR THE YEAR ENDED 30 JUNE 2013
The consolidated statement of fi nancial position of the entities party to the deed of cross guarantees are:
CONSOLIDATED
2013 2012
$’000 $’000
STATEMENT OF FINANCIAL POSITION
ASSETS
CURRENT ASSETS
Cash and cash equivalents 131,029 137,676
Trade and other receivables 205,052 280,436
Inventories 48,547 33,374
Current tax assets 3,733 -
Other current assets 5,388 4,089
TOTAL CURRENT ASSETS 393,750 455,575
NON-CURRENT ASSETS
Property, plant and equipment 392,544 366,278
Intangibles 3,236 389
Goodwill 24,417 24,417
Financial assets 3 3
TOTAL NON-CURRENT ASSETS 420,199 391,087
TOTAL ASSETS 813,949 846,662
LIABILITIES
CURRENT LIABILITIES
Trade and other payables 193,390 250,195
Borrowings 52,379 49,592
Current tax liabilities - 22,956
Provisions 19,910 29,576
TOTAL CURRENT LIABILITIES 265,679 352,318
NON-CURRENT LIABILITIES
Borrowings 167,191 149,178
Provisions 1,201 26
Deferred tax liabilities 27,286 16,157
TOTAL NON-CURRENT LIABILITIES 195,677 165,361
TOTAL LIABILITIES 461,356 517,679
NET ASSETS 352,593 328,983
EQUITY
Issued capital 156,432 156,456
Reserves 2,991 3,211
Retained earnings 193,170 169,316
TOTAL EQUITY 352,593 328,983

NRW ANNUAL REPORT 2013Notes to the Financial Statements 103
NOTES TO THE FINANCIAL STATEMENTSFOR THE YEAR ENDED 30 JUNE 2013
19. UNINCORPORATED JOINT OPERATIONS
The Group has the following signifi cant interests in the following jointly controlled operations:
NAME OF OPERATION PRINCIPAL ACTIVITY GROUP INTEREST
2013 2012
NRW VDM Joint VentureMine Asset Development (earthworks) and Breakwater Construction. Now completed.
50% 50%
LJN Consortium Asset Development Projects (camps rail etc). 33% 33%
NRW-NYFL Joint Venture Car Dumper and Bulk Earthworks at Cape Lambert Port B Project. 50% 50%
NRW-Eastern Guruma Joint VentureMining and haulage of Section 10 iron ore deposit and Western Turner Brockman Bulk Earthworks.
50% 50%
NRW-Ocean to Outback Joint Venture Hope Downs Village construction. 50% 50%
Midwest Rail Joint VentureBulk earthworks and rail upgrade of existing 92km rail, from Mullewa to Tilley Siding, for ore haulage.
50% 50%
City East Alliance Upgrade of Great Eastern Highway. 15% 15%
NRW, Eastern Guruma and NYFL Joint Venture
Provision of Early Mining Services – Solomon Phase 1 for Fortescue Metals Group Limited.
50% 50%
Other than the winding up of the NRW VDM Joint Arrangement, there has been no change in the Group’s
ownership or voting interests in these joint arrangements for the reported years.
The following amounts are included in the Groups consolidated fi nancial statements as a result of the
proportionate consolidation of the above interests in Joint Operations.
FINANCIAL INFORMATION CONSOLIDATED
2013 2012
$’000 $’000
STATEMENT OF FINANCIAL PERFORMANCE
Income 320,817 339,652
Expenses 308,950 334,955
STATEMENT OF FINANCIAL POSITION
Current assets 69,176 74,708
Non-current assets 387 656
Current liabilities 61,961 76,543
Non-current liabilities - -

NRW ANNUAL REPORT 2013Notes to the Financial Statements104
NOTES TO THE FINANCIAL STATEMENTSFOR THE YEAR ENDED 30 JUNE 2013
20. GOODWILL
CONSOLIDATED
2013 2012
$’000 $’000
Cost 24,417 24,417
24,417 24,417
The carrying amount of goodwill is tested for impairment annually at 30 June or whenever there is an indicator
that the asset may be impaired. The Group assesses the recoverable amount of the cash-generating unit based
on the value-in-use calculation. Key assumptions made in determining “value-in-use” are as follows:
Projected cash fl ows
The assets recoverable amount or “value in use” is calculated using the Board approved budget for the year
ending 30 June 2014 plus cash fl ow projections up to and including the year ended 30 June 2018.
Estimated rate of growth
The estimated growth rate of 5% has been agreed as the appropriate growth rate given estimate sales and
forecast of future projects.
Weighted average cost of capital
The weighted average cost of capital including a risk margin has been set at a pre-tax discount rate of 18.0% (2012:
16.43%). The Directors assess there is no impairment of the goodwill as at 30 June 2013 (30 June 2012: nil).
Sensitivities
The Board has also performed a sensitivity assessment on the value-in-use calculation on the 5% growth
rate used. The sensitivity assessment was performed at both 3% and 7%, with all other key assumptions
remaining the same, neither of which resulted in an impairment to goodwill.
E) COST
CONSOLIDATED
2013 2012
$’000 $’000
Balance at beginning of fi nancial year 27,127 27,127
BALANCE AT END OF FINANCIAL YEAR 27,127 27,127
F) ACCUMULATED IMPAIRMENT
CONSOLIDATED
2013 2012
$’000 $’000
Balance at beginning of fi nancial year (2,710) (2,710)
Impairment losses recognised during the year - -
BALANCE AT END OF FINANCIAL YEAR (2,710) (2,710)

NRW ANNUAL REPORT 2013Notes to the Financial Statements 105
NOTES TO THE FINANCIAL STATEMENTSFOR THE YEAR ENDED 30 JUNE 2013
21. AMOUNTS DUE FROM (TO) CUSTOMERS UNDER CONSTRUCTION CONTRACTS
CONSOLIDATED
2013 2012
$’000 $’000
CONTRACTS IN PROGRESS
Construction costs incurred plus recognised profi ts less recognised losses to date 1,343,617 1,205,514
Less: progress billings 1,210,499 1,059,672
133,118 145,842
Recognised and included in the consolidated fi nancial statements as amounts due:
- from customers under construction contracts 139,191 153,845
- to customers under construction contracts (6,073) (8,003)
133,118 145,842
22. PAYABLES
CONSOLIDATED
2013 2012
$’000 $’000
CURRENT PAYABLES
Trade Payables 115,671 167,777
Goods and service tax 936 1,823
Non trade payables and accruals 80,332 80,818
196,939 250,418
The Group has fi nancial risk management policies in place to ensure that all payables are paid within the pre-
agreed credit terms. All payables are expected to be settled within the next 12 months.

NRW ANNUAL REPORT 2013Notes to the Financial Statements106
NOTES TO THE FINANCIAL STATEMENTSFOR THE YEAR ENDED 30 JUNE 2013
23. BORROWINGS
A) THE GROUP BORROWINGS IS COMPRISED OF
CONSOLIDATED
2013 2012
$’000 $’000
SECURED AT AMORTISED COST
Current
Finance lease liability 52,379 49,492
Insurance funding - 100
TOTAL CURRENT 52,379 49,592
Non-Current
Finance lease liability 167,191 149,178
TOTAL NON-CURRENT 167,191 149,178
GROUP TOTAL 219,570 198,770
B) FINANCE FACILITIES
Consolidated fi nance facilities as at 30 June 2013
FINANCE DESCRIPTION FACE VALUE (LIMIT)$’000
CARRYING AMOUNT (UTILISED)$’000
UNUTILISED AMOUNT (UTILISED)
$’000
Asset Financing(1) 315,982 219,570 96,412
Working Capital 64,716 - 64,716
Consolidated fi nance facilities as at 30 June 2012
FINANCE DESCRIPTION FACE VALUE (LIMIT)$’000
CARRYING AMOUNT (UTILISED)$’000
UNUTILISED AMOUNT (UTILISED)
$’000
Asset Financing(1) 465,217 198,670 266,547
Working Capital 50,000 - 50,000
Other 100 100 -
(1) Terms range from 3 to 5 years
SECURITY
The main fi nance provider is the ANZ Banking Group which provides overdraft, trade fi nance, performance
guarantees, asset fi nancing etc. Annual and periodic reviews take place as necessary subject to bank
covenants and conditions as set in the agreement between the parties. As such the ANZ Banking Group
has in place security by way of a fi xed and fl oating charge over all the Group’s present and future assets,
undertaking (including goodwill) and unpaid/uncalled capital of the Company excluding security attaching
to other asset fi nanciers.

NRW ANNUAL REPORT 2013Notes to the Financial Statements 107
NOTES TO THE FINANCIAL STATEMENTSFOR THE YEAR ENDED 30 JUNE 2013
24. PROVISIONS
CONSOLIDATED
2013 2012
$’000 $’000
Current
Employee benefi ts 14,220 22,653
Warranty 1,919 6,923
TOTAL CURRENT PROVISIONS 16,139 29,576
Non-current
Employee benefi ts 1,201 26
TOTAL NON-CURRENT PROVISIONS 1,201 26
TOTAL CURRENT AND NON-CURRENT PROVISIONS 17,340 29,602
CONSOLIDATED
WARRANTY PROVISION EMPLOYEE BENEFITS TOTAL
$’000 $’000 $’000
Balance at 1 July 2012 6,923 22,679 29,602
Provisions made during the year 3,286 13,549 16,835
Reductions arising from payments (826) (20,807) (21,633)
Reductions resulting from re-measurement (7,464) - (7,464)
BALANCE AT 30 JUNE 2013 1,919 15,421 17,340
Short-term provisions 1,919 14,220 16,139
Long-term provisions - 1,201 1,201
TOTAL BALANCE AT 30 JUNE 2013 1,919 15,421 17,340
(i) The warranty provisions relates to the present value of the Directors’ best estimate of the future
outfl ow of economic benefi ts that will be required under the Groups obligations for warranties arising
from specifi c construction contracts at reporting date. The future cash fl ows has been estimated at
the Directors’ best estimate of the expenditure required to settle the Group’s obligation and history of
warranty claims.
(ii) The provision for employee benefi ts represents annual leave and vested long service leave entitlements
accrued and compensation claims made by employees.

NRW ANNUAL REPORT 2013Notes to the Financial Statements108
NOTES TO THE FINANCIAL STATEMENTSFOR THE YEAR ENDED 30 JUNE 2013
25. CONTRIBUTED EQUITY
A) FULLY PAID ORDINARY SHARES
CONSOLIDATED
2013 2012
$’000 $’000
Ordinary shares
278,877,219 fully paid ordinary shares (2012: 278,888,011) 156,432 156,456
The Company does not have authorised capital or par value in respect of its issued shares. All issued shares
are fully paid. All shares rank equally.
Fully paid ordinary shares carry one vote per share and carry a right to dividends.
CONSOLIDATED CONSOLIDATED
2013 2012 2013 2012
# NO. ‘000 # NO. ‘000 $’000 $’000
FULLY PAID ORDINARY SHARES
BALANCE AT THE BEGINNING OF THE FINANCIAL YEAR 278,888 278,888 156,456 156,456
Acquisition of treasury shares (587) - (1,285) -
Transfer to contributed equity 576 - 1,261 -
Share issue costs - - - -
BALANCE AT THE END OF THE PERIOD 278,877 278,888 156,432 156,456
B) SHARE OPTIONS AND PERFORMANCE RIGHTS GRANTED
Information relating to the Group’s options and performance rights, including details of issued, exercised and
lapsed during the fi nancial year and outstanding at the end of the fi nancial year, is set out in Note 31.
26. RESERVES
CONSOLIDATED
2013 2012
$’000 $’000
Share based payment reserve 2,991 3,211
Foreign currency reserve (214) (242)
TOTAL RESERVES 2,777 2,969

NRW ANNUAL REPORT 2013Notes to the Financial Statements 109
NOTES TO THE FINANCIAL STATEMENTSFOR THE YEAR ENDED 30 JUNE 2013
CONSOLIDATED
2013 2012
$’000 $’000
SHARE BASED PAYMENT RESERVE
Balance at the beginning of the fi nancial year 3,211 1,635
Equity compensation - 1,576
Shares issued for vested rights (1,261) -
Share based payments 1,042 -
BALANCE AT THE END OF THE FINANCIAL YEAR 2,991 3,211
CONSOLIDATED
2013 2012
FOREIGN CURRENCY TRANSLATION RESERVE
Balance at the beginning of the fi nancial year (242) (248)
Exchange diff erences arising on translation of foreign operations 28 6
BALANCE AT THE END OF THE FINANCIAL YEAR (214) (242)
TOTAL RESERVES 2,777 2,969
Exchange differences arising on translation of the foreign controlled entity are taken to the foreign currency
translation reserve. The reserve is recognised in the income statement when the foreign operation is
disposed of.
27. RETAINED EARNINGS
CONSOLIDATED
2013 2012
$’000 $’000
Balance at the beginning of the fi nancial year 169,753 108,866
Net profi t attributable to members of the parent entity 74,107 97,142
Dividends paid (Note 28) (50,199) (36,255)
BALANCE AT THE END OF THE FINANCIAL YEAR 193,661 169,753

NRW ANNUAL REPORT 2013Notes to the Financial Statements110
NOTES TO THE FINANCIAL STATEMENTSFOR THE YEAR ENDED 30 JUNE 2013
28. DIVIDENDS
A) DIVIDENDS PAID
2013 2012
CENTS PER SHARE TOTAL CENTS PER SHARE TOTAL
$’000 $’000
Recognised amounts paid:
Fully paid ordinary shares, fully franked
Final dividend to 30 June 2011 5.00 13,944
Interim dividend to 31 December 2011 8.00 22,311
Final dividend to 30 June 2012 10.00 27,888
Interim dividend to 31 December 2012 8.00 22,311
50,199 36,255
Unrecognised amounts:
Fully paid ordinary shares, fully franked
Final dividend to 30 June 2012 10.00 27,889
Final dividend to 30 June 2013 5.00 13,944
On 21 August 2013, the Directors declared a fully franked fi nal dividend of 5 cents per share to the holders of
fully paid ordinary shares in respect of the fi nancial year ended 30 June 2013.
B) FRANKING ACCOUNT
CONSOLIDATED
2013 2012
$’000 $’000
FRANKING ACCOUNT BALANCE AT 1 JULY 40,692 41,076
Australian income tax paid(1) 46,174 15,154
Franking credits attached to dividends paid:
- as fi nal dividend (11,952) (5,976)
- as interim dividend (9,562) (9,562)
FRANKING ACCOUNT BALANCE AT 30 JUNE 65,352 40,692
Franking credits that will arise from the payment /(refund) of income tax payable as at reporting date (3,733) 23,034
Franking credits that will arise from the payment of declared before the fi nancial report was authorised for issue but not recognised as a distribution to equity holders during the period.
(5,976) (11,952)
NET FRANKING CREDITS AVAILABLE 55,643 51,774
(1) Excludes income tax payments made in overseas tax jurisdictions.

NRW ANNUAL REPORT 2013Notes to the Financial Statements 111
NOTES TO THE FINANCIAL STATEMENTSFOR THE YEAR ENDED 30 JUNE 2013
29. RECONCILIATION OF CASH FLOWS FROM OPERATING ACTIVITIES
A) RECONCILIATION OF PROFIT FOR THE PERIOD TO NET CASH FLOWS FROM OPERATING ACTIVITIES
CONSOLIDATED
2013 2012
$’000 $’000
PROFIT FOR THE PERIOD 74,107 97,142
Adjustments for:
Loss on sale of property, plant and equipment 2,811 887
Net foreign exchange (gain)/loss 29 3
Depreciation and amortisation 48,885 41,894
GST funded on asset fi nancing 5,944 -
Working capital funding 7,537 -
Share based payment expense 1,042 1,576
OPERATING PROFIT BEFORE CHANGES IN WORKING CAPITAL AND PROVISIONS 140,355 141,502
Change in trade and other receivables 75,386 (125,041)
Change in provision for doubtful debts - (56)
Change in inventories (15,173) (10,345)
Change in other assets (1,253) 2,767
Change in trade and other payables (53,479) 115,764
Change in provisions and employee benefi ts (12,262) 19,773
Change in provision for income tax (26,686) 22,953
Change in deferred tax balances 11,129 5,866
NET CASH FROM OPERATING ACTIVITIES 118,017 173,183
B) NON-CASH INVESTING ACTIVITIES
During the year, the Group acquired $66,446,150 (2012: $117,664,059) of equipment under fi nance lease and
asset trade fi nance. These acquisitions will be refl ected in the statement of cash fl ows over the term of the
fi nance leases via repayments of borrowings and fi nance leases.
30. FINANCIAL INSTRUMENTS
FINANCIAL RISK MANAGEMENT
The Board has ultimate responsibility to manage the Group’s risk management policy. In addition suitable
prevention controls and action plans are put in place and the risk policies and procedures are reviewed periodically.
The Group’s overall fi nancial risk strategy seeks to ensure appropriate funding levels, approved treasury
directives to meet ongoing project needs and new growth. In addition it is seen as critical that the going
concern basis is maintained and adequate working capital is available.
Primarily interest bearing debt, cash and cash deposits, trade receivables and payables are the main focus
of fi nancial instruments engaged by the Group. The Group is also exposed to some foreign currency risks
although considered minimal.

NRW ANNUAL REPORT 2013Notes to the Financial Statements112
NOTES TO THE FINANCIAL STATEMENTSFOR THE YEAR ENDED 30 JUNE 2013
CAPITAL RISK MANAGEMENT
The capital structure of the Group comprises of debt (borrowings), cash and cash equivalents, and equity to
the relevant stakeholders.
The majority of capital funding is required for the long term purchase of operating assets. These are
primarily placed under hire purchase borrowing arrangements under a clubbing arrangement through the
ANZ Banking Group Ltd.
The cash position is reviewed regularly and ensures the Group will be able to pay its debts as and when
they fall due.
GEARING RATIO
The Board meets regularly to determine the level of borrowings and funding required. The gearing ratio is
infl uenced directly from the capital structure including the payment of dividends and any other movement in
debt. The gearing ratio was calculated at 30 June as:
CONSOLIDATED
2013 2012
$’000 $’000
BORROWINGS (NOTE 23) 219,570 198,770
Cash (Note 12) (130,994) (137,955)
NET DEBT 88,576 60,815
Equity 352,870 329,178
NET DEBT TO EQUITY RATIO 25% 18%
FAIR VALUE OF FINANCIAL INSTRUMENTS
The carrying values of fi nancial assets and fi nancial liabilities recorded in the fi nancial statement approximate
their fair values.
INTEREST RATE RISK MANAGEMENT
The debt clubbing arrangement with its main banker the ANZ Banking Group Ltd continues for the group.
Under this arrangement a progressive drawdown is used to aid the supply of new assets and subsequently
these repayments are grouped into a tranche where a hire purchase repayment schedule is set up.
Repayments are generally made quarterly and the progressive draw incurs interest only. Furthermore a
residual is in most cases set at 25% and terms tend to be set for fi ve years.
The Board continues to review its risk associated with any covenants and borrowing conditions. The bank
imposes various covenants and ratio calculations that must be met. These are calculated quarterly.
The Group enjoys a mixture of fi xed and variable borrowings to manage both cash and long term capital
purchases. The long term debt specifi cally relating to capital purchases of plant and machinery is fi xed.
The Group does not enter into any specifi c swaps or hedging relative to any interest rate volatility. Ongoing
reviews of available cash or credit in anticipation of contract awards continues and is formally reported
monthly or ad hoc subject to any market activity.
Given the Group has most of the fi nancing under fi xed rate hire purchase or other similar asset fi nancing
agreements, the exposure to market rate volatility lies mainly in the overdraft and progressive drawdown facilities.
Considering a swing of 3% in the interest rate cost of funds, would not provide a material impact to the Group.

NRW ANNUAL REPORT 2013Notes to the Financial Statements 113
NOTES TO THE FINANCIAL STATEMENTSFOR THE YEAR ENDED 30 JUNE 2013
LIQUIDITY RISK MANAGEMENT
Ultimate responsibility for liquidity risk management rests with the board of directors, which has established an
appropriate liquidity risk management framework for the management of the Company’s short, medium and
long-term funding and liquidity management requirements. The Company manages liquidity risk by maintaining
banking facilities, ensuring a tight credit control program, continuously monitoring forecast and actual cash fl ows,
and considering the level of capital commitment commensurate with market demand for commodities.
The contractual maturity for its fi nancial liabilities and fi nancial assets are set out in the following tables.
The table shows the effective interest rates and average interest rates as relevant to each class.
A) CONSOLIDATED INTEREST AND LIQUIDITY ANALYSIS 2013
EFFECTIVE INTEREST RATE TOTAL 0 TO 30 DAYS 31 DAYS TO < 1
YEAR 1 TO 5 YRS > 5YRS
% $’000 $’000 $’000 $’000 $’000
FINANCIAL ASSETS
Cash and cash equivalents 1.50% 130,994 130,994 - - -
Trade and other receivables - 205,052 65,195 139,857 - -
336,046 196,189 139,857 - -
FINANCIAL LIABILITIES
Asset fi nancing 7.12% 256,140 3,946 48,433 203,761 -
Trade and other payables - 196,939 154,412 42,527 - -
453,079 158,358 90,960 203,761 -
B) CONSOLIDATED INTEREST AND LIQUIDITY ANALYSIS 2012
EFFECTIVE INTEREST RATE TOTAL 0 TO 30 DAYS 31 DAYS TO < 1
YEAR 1 TO 5 YRS > 5YRS
% $’000 $’000 $’000 $’000 $’000
FINANCIAL ASSETS
Cash and cash equivalents 2.50% 137,955 137,955 - - -
Trade and other receivables - 280,438 143,255 137,183 - -
418,393 281,210 137,183 - -
FINANCIAL LIABILITIES
Asset fi nancing 8.46% 234,585 1,636 61,907 171,042 -
Trade fi nance - - - - - -
Trade and other payables - 250,418 190,550 59,868 - -
Other borrowings 9.24% 100 20 80 - -
485,103 192,206 121,855 171,042 -

NRW ANNUAL REPORT 2013Notes to the Financial Statements114
NOTES TO THE FINANCIAL STATEMENTSFOR THE YEAR ENDED 30 JUNE 2013
FOREIGN EXCHANGE AND CURRENCY EXPOSURE
The Group reports its functional currency in Australian dollars.
The Board considers that movements in foreign currency (negative or positive) will have minimal impact on
operating profi ts, given that most projects are agreed and billed in Australian dollars. Any new developments
which the Group considers or bids for are considered as part of the risk management by the board. Other
than specifi c transactions or purchases negotiated with the supplier, the majority of transactions dealing in
foreign currency are dealt with at spot.
The Groups operations in West Africa – Guinea have a continued minor exposure to foreign currency
movements given the traded currency is Guinea Francs. No material changes have occurred from prior years
and as such predominantly, the exposure to foreign currency fl uctuations is based on the transfer of funds
for services rendered in the country of West Africa – Guinea and for reimbursing on payments made by
NRW Guinea SARL on behalf of NRW Pty Ltd. The cash balances held in Guinea at 30 June 2013 (at spot)
was $5,571 AUD (2012: $278,639 AUD).
No hedging is entered into for the purposes of the Guinea operations. Cash is converted to USD and then
into GNF as required. Volatile market movements is considered low risk, given the majority of the cash is
utilised quickly and intentionally not left idle for long periods.
CREDIT RISK
The credit risk associated with the Group is primarily if any third party fails to meet its obligations to pay
its debt as and when they fall due. Trade and other receivables primarily continue in the 30 to 60 day band.
Cash retentions are small in nature given the priority to utilise bonds and bank guarantees. The retention or
guarantee/bond period varies from contract to contract under the terms of each contract.
Where terms are exceeded by the customer no interest is charged on late payments, however management
continue to follow a strict credit policy as part of day to day cash fl ow management and pursue any delays
or late payments vigorously.
The carrying amount of fi nancial assets recorded in the fi nancial statements net of any allowance for losses,
represents the Group’s maximum exposure to credit risk without taking into account the value of any collateral.
The total amount of guarantees at 30 June 2013 stands at $32,284,488 (2012: $36,426,544) and bonds held
stand at $100,592,178 (2012: $95,984,753).
31. SHARE BASED PAYMENTS
SENIOR MANAGEMENT AND DIRECTOR OPTION PLAN (“SMDOP”)
The SMDOP is a Senior Management and Director share Option Plan and has been put in place since NRW’s
admission to the ASX. No options have been issued under the plan to date. The Board has the discretion
to determine the terms and conditions applying to each offer of options under the SMDOP including
performance conditions attaching to the exercise of options, restrictions on transfer and disposal, exercise
price of options and amount payable for a grant of options.
The SMDOP will be accounted for as equity settled share-based payments where the fair value determined
at the grant date is expensed on a straight-line basis over the vesting period, based on the estimate of
shares that will eventually vest.
EMPLOYEE GIFT OFFER (“EGO”)
No new issues of shares have been provided during the year ended 30 June 2013. (2012: Nil).

NRW ANNUAL REPORT 2013Notes to the Financial Statements 115
NOTES TO THE FINANCIAL STATEMENTSFOR THE YEAR ENDED 30 JUNE 2013
PERFORMANCE INCENTIVE RIGHTS PLAN
FY13 Awards
In respect of the LTI component of the FY13 Awards, the following table shows the total number of
Performance Rights granted to NRW’s KMP. The table sets out the number of Performance Rights that will
be eligible to vest, subject to application of the Vesting Conditions on 15 September 2015.
No. Rights expected to vest on 15 Sept 2015
Maximum potential number of Performance Rights for
FY13 Award
Total number of Performance Rights granted under
the FY13 Award
Mr J Pemberton 10,260 684,006 34,200
Mr W Rooney 2,204 255,362 7,345
Mr M Stewart 13,102 146,186 43,673
Mr W Fair 3,489 88,317 11,631
Mr M Wallace - 101,081 -
Total 29,055 1,274,952 96,849
Fair Value of Performance Rights
The estimation of the fair value of share-based payment awards requires judgement with respect to the
appropriate valuation methodology. The choice of valuation methodology is determined by the structure of
the awards, particularly the vesting conditions. The table below shows the valuation methodology used for
each award.
Valuation Methodology for each award:
Award Type Grant Date Vesting conditions Valuation methodology
Performance Rights 28 November and 18 June 2013Relative TSREPS GrowthROCE
Monte-Carlo simulationAnalyticalAnalytical
Each valuation methodology we have used has been chosen from those available to us to incorporate an
appropriate amount of fl exibility with respect to the particular performance and vesting conditions of the award.
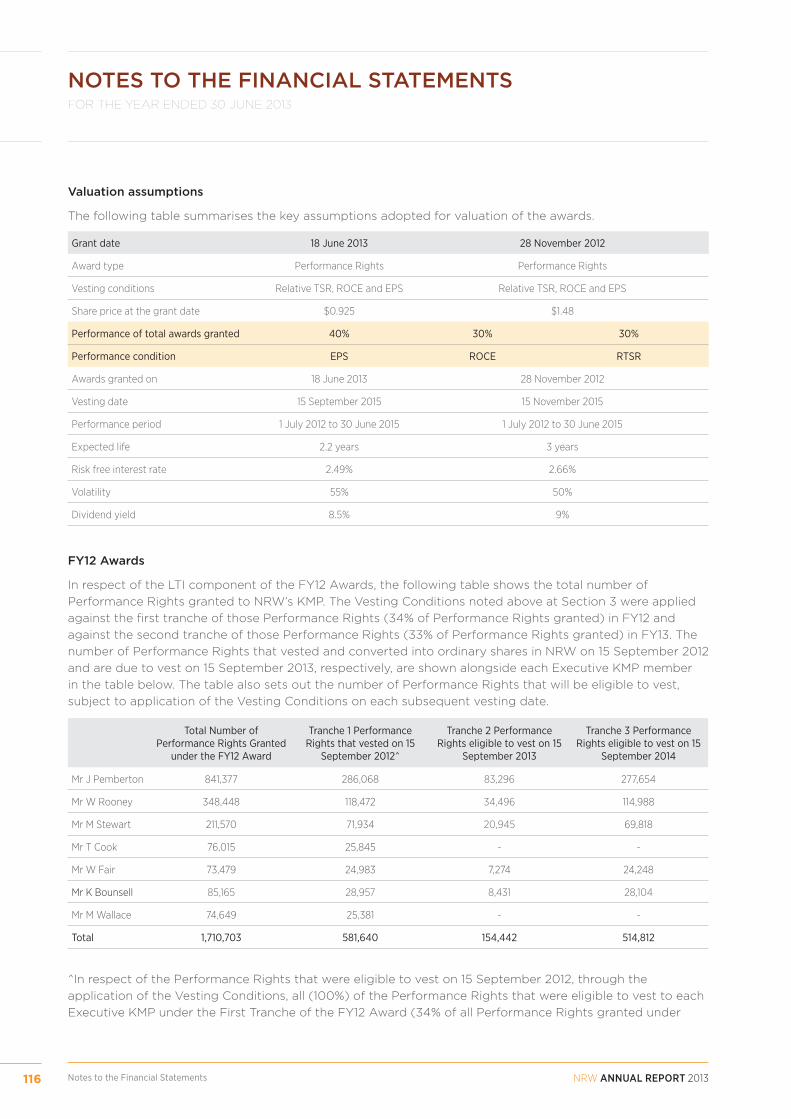
NRW ANNUAL REPORT 2013Notes to the Financial Statements116
NOTES TO THE FINANCIAL STATEMENTSFOR THE YEAR ENDED 30 JUNE 2013
Valuation assumptions
The following table summarises the key assumptions adopted for valuation of the awards.
Grant date 18 June 2013 28 November 2012
Award type Performance Rights Performance Rights
Vesting conditions Relative TSR, ROCE and EPS Relative TSR, ROCE and EPS
Share price at the grant date $0.925 $1.48
Performance of total awards granted 40% 30% 30%
Performance condition EPS ROCE RTSR
Awards granted on 18 June 2013 28 November 2012
Vesting date 15 September 2015 15 November 2015
Performance period 1 July 2012 to 30 June 2015 1 July 2012 to 30 June 2015
Expected life 2.2 years 3 years
Risk free interest rate 2.49% 2.66%
Volatility 55% 50%
Dividend yield 8.5% 9%
FY12 Awards
In respect of the LTI component of the FY12 Awards, the following table shows the total number of
Performance Rights granted to NRW’s KMP. The Vesting Conditions noted above at Section 3 were applied
against the fi rst tranche of those Performance Rights (34% of Performance Rights granted) in FY12 and
against the second tranche of those Performance Rights (33% of Performance Rights granted) in FY13. The
number of Performance Rights that vested and converted into ordinary shares in NRW on 15 September 2012
and are due to vest on 15 September 2013, respectively, are shown alongside each Executive KMP member
in the table below. The table also sets out the number of Performance Rights that will be eligible to vest,
subject to application of the Vesting Conditions on each subsequent vesting date.
Total Number of Performance Rights Granted
under the FY12 Award
Tranche 1 Performance Rights that vested on 15
September 2012^
Tranche 2 Performance Rights eligible to vest on 15
September 2013
Tranche 3 Performance Rights eligible to vest on 15
September 2014
Mr J Pemberton 841,377 286,068 83,296 277,654
Mr W Rooney 348,448 118,472 34,496 114,988
Mr M Stewart 211,570 71,934 20,945 69,818
Mr T Cook 76,015 25,845 - -
Mr W Fair 73,479 24,983 7,274 24,248
Mr K Bounsell 85,165 28,957 8,431 28,104
Mr M Wallace 74,649 25,381 - -
Total 1,710,703 581,640 154,442 514,812
^In respect of the Performance Rights that were eligible to vest on 15 September 2012, through the
application of the Vesting Conditions, all (100%) of the Performance Rights that were eligible to vest to each
Executive KMP under the First Tranche of the FY12 Award (34% of all Performance Rights granted under

NRW ANNUAL REPORT 2013Notes to the Financial Statements 117
NOTES TO THE FINANCIAL STATEMENTSFOR THE YEAR ENDED 30 JUNE 2013
the FY12 Award) vested. The applicable outcomes of the Vesting Conditions tested in respect of the First
Tranche of the FY12 LTI Award are as follows:
FY12 LTI Award – Performance RightsApplication of Vesting Conditions to Rights that vested on 15 September 2012
LTI Vesting Condition,Weighting
Maximum vestingachieved at Basis of Measurement Result Achieved Vesting
EPS Growth,Weighting 40%
EPS Growth of 10% Audited resultEPS Growth
of 116%
100% x 40% weighting=
40% vesting
ROCE,Weighting 30%
ROCE of 25% Audited resultROCE of
45%
100% x 30% weighting=
30% vesting
Relative TSR,Weighting 30%
NRW’s Relative TSR being3rd or better
Link Market Services /Miraqle Metrics provided
independent calculation of NRW Relative TSR
NRW’s Relative TSRPerformance of
1st out of 11
100% x 30% weighting=
30% vesting
TOTAL VESTING 100%
In respect of the Performance Rights that are eligible to vest on 15 September 2013, through the application
of the Vesting Conditions, only the awards relating to the ROCE Vesting Condition (30%) vested. None (0%)
of the awards relating to the EPS (40%) or RTSR (30%) Vesting Conditions vested.
The applicable outcomes of the Vesting Conditions tested in respect of the Second Tranche of the FY12 LTI
Award are as follows:
FY12 LTI Award – Performance RightsApplication of Vesting Conditions to Rights that are due to vest on 15 September 2013
LTI Vesting Condition,Weighting
Maximum vestingachieved at
Basis of Measurement Result Achieved Vesting
EPS Growth,Weighting 40% EPS Growth of 10% Audited result EPS Growth
of (23%)**
0% x 40% weighting=
0% vesting
ROCE,Weighting 30% ROCE of 25% Audited result ROCE of
31%
100% x 30% weighting=
30% vesting
Relative TSR,Weighting 30%
NRW’s Relative TSR being
3rd or better
Orient Capital Pty Ltd provided
independent calculation of NRW Relative TSR
NRW’s Relative TSRPerformance of
8th out of 11
100% x 30% weighting=
0% vesting
TOTAL VESTING 30%
Fair Value of Performance Rights
The estimation of the fair value of share-based payment awards requires judgement with respect to the appropriate valuation methodology. The choice of valuation methodology is determined by the structure of the awards, particularly the vesting conditions. The table below shows the valuation methodology used for each award.
Valuation Methodology for each award:
Award Type Grant Date Vesting conditions Valuation methodology
Performance Rights23 November 2011 and
12 March 2012
Relative TSREPS Growth
ROCE
Monte-Carlo simulationBinomial TreeBinomial Tree

NRW ANNUAL REPORT 2013Notes to the Financial Statements118
NOTES TO THE FINANCIAL STATEMENTSFOR THE YEAR ENDED 30 JUNE 2013
Each valuation methodology we have used has been chosen from those available to us to incorporate an
appropriate amount of fl exibility with respect to the particular performance and vesting conditions of the award.
Valuation assumptions
The following table summarises the key assumptions adopted for valuation of the awards.
Key assumptions for the awards granted on 23 November 2011 Grant date 23 November 2011
Award type Performance Rights
Vesting conditions Relative TSR, ROCE and EPS
Share price at the grant date $2.78
Tranche 1 2 3
Vesting date 15 September 2012 15 September 2013 15 September 2014
Expected life 0.8 years 1.8 years 2.8 years
Risk free interest rate 3.40% 3.09% 3.07%
Volatility 50% 50% 50%
Dividend yield 6.0% 6.0% 6.0%
32. FINANCE LEASES
FINANCE LEASES AS LESSEE
Non-cancellable fi nance leases are payable as follows:
The majority of new plant and equipment purchases are fi nanced using hire purchase as described in the
fi nancial instrument Note 30. The average lease term is fi ve years.
Interest rates underlying all obligations under fi nance leases are fi xed at respective contract dates ranging
from 7.0% to 10.25% (2012: 7.0% to 10.25%).
MINIMUM FUTURE LEASE PAYMENTS PRESENT VALUE OF MINIMUM FUTURE LEASE PAYMENTS
2013 2012 2013 2012
$’000 $’000 $’000 $’000
No later than 1 year 61,658 63,543 52,379 49,492
Later than 1 year and not later than 5 years 194,482 171,042 167,191 149,178
Later than fi ve years - - - -
Minimum future lease payments(1) 256,140 234,585 219,570 198,670
Less future fi nance charges (36,571) (35,915) - -
Present value of minimum lease payments 219,570 198,670 219,570 198,670
(1) Minimum future lease payments include the aggregate of all the lease payments and any guaranteed residual value.
Included in the fi nancial statement as: (Note 23 ‘Borrowings’):

NRW ANNUAL REPORT 2013Notes to the Financial Statements 119
NOTES TO THE FINANCIAL STATEMENTSFOR THE YEAR ENDED 30 JUNE 2013
CONSOLIDATED
2013 2012
$’000 $’000
Current borrowings 52,379 49,492
Non-current borrowings 167,191 149,178
219,570 198,670
33. OPERATING LEASES
OPERATING LEASES AS LESSEE
Non-cancellable operating lease rentals (excluding property rentals - see below) are payable are as follows:
CONSOLIDATED
2013 2012
$’000 $’000
Less than one year 8,278 15,963
Between one and fi ve years 101 7,453
More than fi ve years - -
8,379 23,416
Property lease rentals are payable as follows:
CONSOLIDATED
2013 2012
$’000 $’000
Less than one year 3,037 5,157
Between one and fi ve years 11,462 18,271
More than fi ve years 867 854
15,366 24,282
The majority of property leases relate to commercial property. The majority of these property leases contain
market or CPI review clauses during the term of the leases.
The Group does not have the option to purchase the leased assets at the end of the lease period.

NRW ANNUAL REPORT 2013Notes to the Financial Statements120
NOTES TO THE FINANCIAL STATEMENTSFOR THE YEAR ENDED 30 JUNE 2013
34. CAPITAL AND OTHER COMMITMENTS
CONSOLIDATED
2013 2012
$’000 $’000
Capital expenditure commitments – Plant and equipment and Other
Within one year 3,980 12,124
Between one and fi ve years 23,083 48,496
Later than fi ve years - -
27,063 60,620
35. CONTINGENCIES
CONSOLIDATED
2013 2012
$’000 $’000
Bank guarantees 32,284 36,426
Insurance bonds 100,592 95,985
BALANCE AT THE END OF THE FINANCIAL YEAR 132,876 132,411
The Group has bank guarantees and bonds issued in respect of contract performance in the normal course
of business in respect to its construction contracts.
CLAIMS
Certain claims arising out of construction contracts have been made by or against certain controlled entities
in the ordinary course of business, some of which involve litigation or arbitration. The Directors do not
consider the outcome of any of these claims will have a material adverse impact on the fi nancial position of
the consolidated entity.
36. RELATED PARTIES
The ultimate parent entity within the Group is NRW Holdings Limited. The interests in subsidiaries are set
out in Note 18.
TRADING SUMMARY
Sales of goods or services made to related parties were made at arm’s length and under normal commercial
market conditions. They comprise of:

NRW ANNUAL REPORT 2013Notes to the Financial Statements 121
NOTES TO THE FINANCIAL STATEMENTSFOR THE YEAR ENDED 30 JUNE 2013
TRANSACTION VALUE
KEY MANAGEMENT PERSON AND/OR RELATED PARTY TRANSACTION BOOKED IN GROUP 2013$
2012$
(I) OTHER RELATED PARTY – REVENUE
Mr W Fair - JSW Australia Revenue on services income for civil contracting works. - (51,925)
(II) OTHER RELATED PARTY – EXPENSE
Mr W Fair - Northwest Quarries PTY LTDPurchases of raw material, subcontract services and equipment hire
7,096,922 -
(III) INTER GROUP TRANSACTIONS
NRW Pty Ltd – Purchases from ACN 107 724 274Purchases of tyres, electrical equipment and back charge of repairs and maintenance.
- 309,087
NRW Pty Ltd – Purchases from Action Mining ServicesRepairs and maintenance, plant and module purchases and labour hire.
10,644,444 6,254,103
NRW Pty Ltd – Sales to Action Mining Services Back charges for labour and miscellaneous. - 10,508
NRW Pty Ltd – Revenue from NRW HoldingsTransfer of grants and government incentives or payments received
316,227 806,727
NRW Pty Ltd - Sales to NRW VDM Joint Venture Subcontractor Services - 5,313,362
NRW Pty Ltd - Sales to NRW-NYFL Joint Venture Subcontractor Services 108,059,714 86,226,526
NRW Pty Ltd - Sales to LJN Joint Venture Subcontractor Services - 7,295,628
NRW Pty Ltd - Sales to NRW Eastern Guruma Joint Venture
Subcontractor Services 339,877,555 194,881,835
NRW Pty Ltd – Sales to OTOC Joint Venture Subcontractor Services 480,691 298,570
NRW Pty Ltd – Sales to The Mid West Rail Joint Venture Subcontractor Services 5,032,084 33,886,452
NRW Pty Ltd – Sales to City East Alliance Subcontractor Services 623,244 1,007,794
NRW Pty Ltd – Sales to NRW- Eastern Guruma-NYFL Joint Venture
Subcontractor Services 73,755,163 108,014,192
NRW Pty Ltd – Sales to Action Drill & Blast Back charges for plant, labour and other re project works 12,811 19,495,586
NRW Pty Ltd - Purchases from NRW VDM Joint Venture Employee travel and accommodation charges and other - 3,790,950
NRW Pty Ltd - Purchases from NRW Guinea SARL Management Fee and cost back charges 1,212,930 1,627,465
Action Drill & Blast – Sales to NRW-Eastern Guruma-NYFL Joint Venture
Subcontractor Services 12,598,914 23,111,425
NRW Pty Ltd – Purchases from Action Drill & Blast Drill & Blast Services and back charges 72,083,292 68,238,811
Action Drill & Blast – Sales to NRW-Eastern Guruma Joint Venture
Drill & Blast Services and back charges 13,044,018 6,038,791
Action Drill & Blast – Purchases from Action Mining Services
Repairs and maintenance, plant and module purchases and labour hire.
546,373 119,683
Action Drill & Blast – Sales to Action Mining Services Back charges of labour - 2,494

NRW ANNUAL REPORT 2013Notes to the Financial Statements122
NOTES TO THE FINANCIAL STATEMENTSFOR THE YEAR ENDED 30 JUNE 2013
B) RELATED PARTY OUTSTANDING BALANCES
Amounts receivable from or payable to related parties at reporting date were as follows:
CONSOLIDATED
2013 2012
$’000 $’000
ACCOUNT RECEIVABLE BALANCES
Other related parties - -
Total related party assets - -
ACCOUNTS PAYABLE BALANCES
Other related parties 2,104 -
Total related party payables 2,104 -
The amounts outstanding are unsecured and will be settled in cash. No guarantees have been given or
received. No expense has been recognised in the current or prior periods for bad or doubtful debts in
respect of the amounts owed by related parties.
C) KEY MANAGEMENT PERSONNEL REMUNERATION
The following were key management personnel of the Group at any time during the reporting period and
unless otherwise indicated were key management personnel for the entire period.
DIRECTORS
Dr I Burston Chairman and Non-Executive Director
Mr J Cooper Non-Executive Director
Mr M Arnett Non-Executive Director
Mr J Pemberton Managing Director & Chief Executive Offi cer
EXECUTIVES
Mr K Hyman Company Secretary, Risk Management & Legal
Mr M Wallace (1) Chief Financial Offi cer (Left)
Mr T Raschella (2) Acting Chief Financial Offi cer
Mr W Rooney Managing Director - Civil and Mining
Mr M Stewart General Manager – Civil
Mr T Cook General Manager Mining – West Coast and Overseas Mining (Resigned)
Mr W Fair Drill & Blast General Manager
(1) Mark Wallace left on 7th August 2013.
(2) Tony Raschella acting appointment 7th August 2013.

NRW ANNUAL REPORT 2013Notes to the Financial Statements 123
NOTES TO THE FINANCIAL STATEMENTSFOR THE YEAR ENDED 30 JUNE 2013
The key management personnel compensation included in ‘Employee benefi ts expense’ (see Note 8(a))
is as follows:
CONSOLIDATED
2013 2012
Short term employee benefi ts 5,468,072 7,610,346
Other long term benefi ts 36,354 83,564
Post employment benefi ts 221,387 303,183
Share based payments 1,121,875 1,575,839
TOTAL 6,847,688 9,572,930
Detailed information on remuneration of key management personnel is set out in the Remuneration Report
in the Directors Report.
D) OPTIONS OVER EQUITY INSTRUMENTS GRANTED AS COMPENSATION
Apart from the in-substance options described in the directors report, no options were issued to or held by
key management personnel or their related parties during the reporting period (2012: Nil).
E) MOVEMENTS IN ORDINARY SHARES
The movement during the reporting period in the number of ordinary shares in NRW Holdings Ltd held
directly, indirectly or benefi cially, by each key management personnel, including their related parties, is:
FOR THE YEAR ENDED 30 JUNE 2013
FOR ORDINARY SHARES
KEY PERSON HELD AT 1 JULY 2012 PURCHASES(1) RECEIVED AS
COMPENSATION
RECEIVED ON OPTIONS
/RIGHTS EXERCISED
SALES / TRANSFERS / NET OTHER
CHANGE
HELD AT 30 JUNE 2013
Mr J Pemberton 2,540,014 110,500 - 286,069 - 2,936,583
Dr I F Burston 329,492 - - - - 329,492
Mr J Cooper 10,000 45,000 - - - 55,000
Mr M Arnett 280,474 - - - - 280,474
Mr K Hyman 22,474 - - - 22,474 -
Mr M Wallace - - - 25,381 - 25,381
Mr M Stewart - - - 71,934 - 71,934
Mr W Rooney - - - 118,472 - 118,472
Mr T Cook - - - 25,845 - 25,845
Mr W Fair - - - 24,983 - 24,983
TOTAL 3,182,454 155,500 - 552,684 22,474 3,868,164
(1) All purchases were made via purchases of shares on-market.

NRW ANNUAL REPORT 2013Notes to the Financial Statements124
NOTES TO THE FINANCIAL STATEMENTSFOR THE YEAR ENDED 30 JUNE 2013
A) PERFORMANCE RIGHTS OVER EQUITY INSTRUMENTS GRANTED AS COMPENSATION
All performance rights issued to key management personnel were made in accordance with the provisions of
the Company’s Long Term Incentive plan as outlined in the remuneration report.
FOR THE YEAR ENDED 30 JUNE 2012
FOR ORDINARY SHARES
KEY PERSON HELD AT 1 JULY 2011 PURCHASES(1) RECEIVED AS
COMPENSATION
RECEIVED ON OPTIONS
/RIGHTS EXERCISED
SALES / TRANSFERS / NET OTHER
CHANGE
HELD AT 30 JUNE 2012
Mr J Pemberton 2,540,014 - - - - 2,540,014
Dr I F Burston 329,492 - - - - 329,492
Mr J Cooper - 10,000 - - - 10,000
Mr M Arnett 280,474 - - - - 280,474
Mr K Hyman 22,474 - - - - 22,474
Mr M Wallace 23,500 - - - - -
Mr M Stewart - - - - - -
Mr W Rooney - - - - - -
Mr T Cook - - - - - -
Mr W Fair - - - - - -
TOTAL 3,195,954 10,000 - - - 3,182,454
(1) All purchases were made via purchases of shares on-market.
37. EVENTS AFTER THE REPORTING PERIOD
There has not arisen in the interval between the end of the fi nancial year and the date of this report
any transaction or event of a material nature likely in the opinion of the Directors, to affect signifi cantly
the operations of the consolidated entity, the results of those operations, or the state of affairs of the
consolidated entity in subsequent fi nancial years.
38. AUDITOR’S REMUNERATION
CONSOLIDATED
2013 2012
$ $
AUDIT SERVICES
Auditors of the Company
Deloitte Touche Tohmatsu
- Audit and review of fi nancial reports 306,525 299,500
- Non recurring items (ERP related) 50,000 -
OTHER SERVICES
Deloitte Touche Tohmatsu
- Other Audit and services 23,345 1,155
TOTAL 379,870 300,655
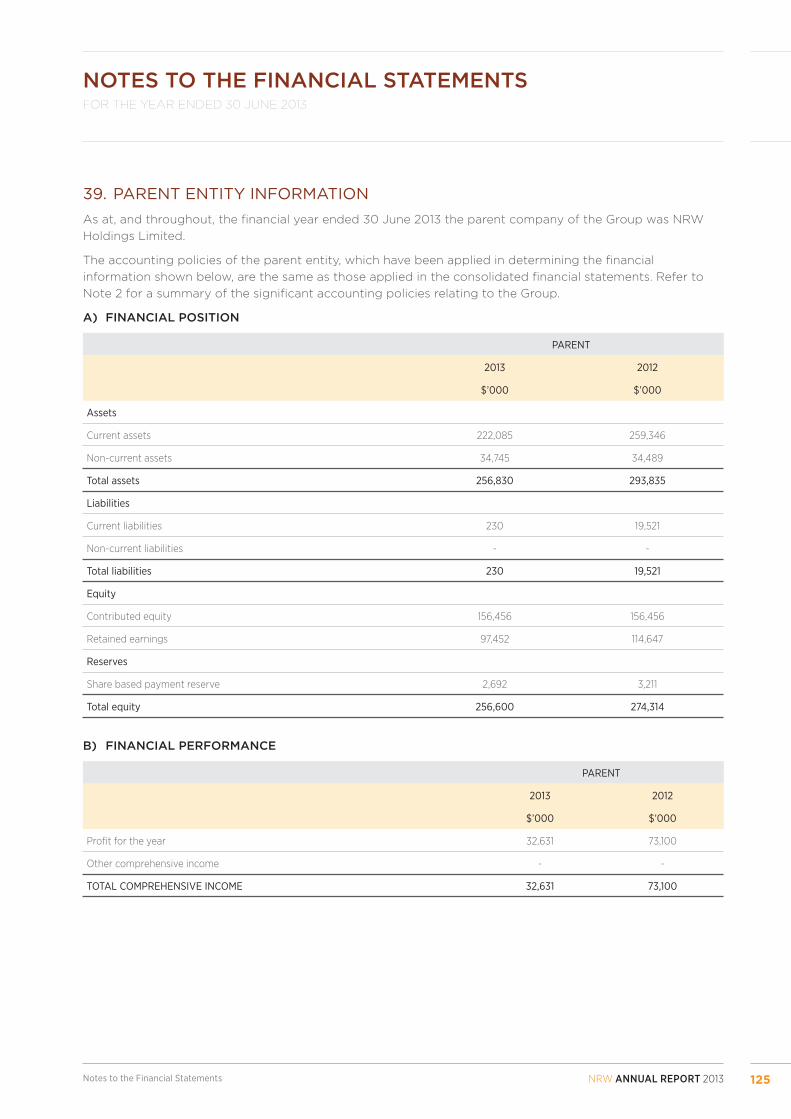
NRW ANNUAL REPORT 2013Notes to the Financial Statements 125
NOTES TO THE FINANCIAL STATEMENTSFOR THE YEAR ENDED 30 JUNE 2013
39. PARENT ENTITY INFORMATION
As at, and throughout, the fi nancial year ended 30 June 2013 the parent company of the Group was NRW
Holdings Limited.
The accounting policies of the parent entity, which have been applied in determining the fi nancial
information shown below, are the same as those applied in the consolidated fi nancial statements. Refer to
Note 2 for a summary of the signifi cant accounting policies relating to the Group.
A) FINANCIAL POSITION
PARENT
2013 2012
$’000 $’000
Assets
Current assets 222,085 259,346
Non-current assets 34,745 34,489
Total assets 256,830 293,835
Liabilities
Current liabilities 230 19,521
Non-current liabilities - -
Total liabilities 230 19,521
Equity
Contributed equity 156,456 156,456
Retained earnings 97,452 114,647
Reserves
Share based payment reserve 2,692 3,211
Total equity 256,600 274,314
B) FINANCIAL PERFORMANCE
PARENT
2013 2012
$’000 $’000
Profi t for the year 32,631 73,100
Other comprehensive income - -
TOTAL COMPREHENSIVE INCOME 32,631 73,100

NRW ANNUAL REPORT 2013Notes to the Financial Statements126
NOTES TO THE FINANCIAL STATEMENTSFOR THE YEAR ENDED 30 JUNE 2013
C) GUARANTEES ENTERED INTO BY THE PARENT ENTITY IN RELATION TO THE DEBTS OF ITS
SUBSIDIARIES:
PARENT
2013 2012
$’000 $’000
Debt borrowings 219,570 198,770
TOTAL 219,570 198,770
NRW Holdings Limited has entered into a Deed of Cross Guarantee with:
• NRW Pty Ltd ATF NRW Unit Trust
• Action Drill & Blast Pty Ltd
• Action Mining Services Pty Ltd
• A.C.N. 107724274 Pty Ltd
• NRW Intermediate Holdings Pty Ltd
Historical unit trust distributions from NRW Unit Trust (subsidiary) to NRW Holdings Limited (parent) have
been historically amended to be compliant with the trust deed. Historical unit trust distributions have not been
settled by way of cash as at 30 June 2013, the balances owing are recorded in the intercompany receivable and
payable of the parent and subsidiary respectively. The deferred tax impacts have also been amended.
2012 OLD ADJ. 2012
NEW
Profi t for the year 71,231 1,869 73,100
Other comprehensive income (expense) for the year, net of tax - - -
Total comprehensive income 71,231 1,869 73,100
2012 OLD ADJ. 2012
NEW
Total Current assets 282,719 (23,373) 259,346
Total non-current assets 34,489 - 34,489
Total assets 317,208 (23,373) 293,835
Total current liabilities 19,521 - 19,521
Total non-current liabilities 8,254 (8,254) -
Total liabilities 27,775 (8,254) 19,521
Contributed equity 156,456 - 156,456
Reserves 3,211 - 3,211
Retained Earnings 129,766 (15,119) 114,647
Total equity 289,433 (15,119) 274,314

NRW ANNUAL REPORT 2013 127
FOR THE YEAR ENDED 30 JUNE 2013
Shareholder Information
SHAREHOLDER INFORMATION
SHAREHOLDER INFORMATION
The shareholder information set out below was applicable as at 9th August 2013.
NRW’s contributed equity comprises 278,888,011 fully paid ordinary shares.
DISTRIBUTION OF SHAREHOLDINGS:
RANGE FULLY PAID ORDINARY SHARES % NO OF HOLDERS %
100,001 and Over 188,722,265 67.67 157 1.69
10,001 to 100,000 64,025,384 22.96 2,346 25.29
5,001 to 10,000 15,011,505 5.38 1,860 20.05
1,001 to 5,000 10,293,482 3.69 3,323 35.83
1 to 1,000 835,375 0.30 1,589 17.13
Total 278,888,011 100.00 9,275 100.00
Unmarketable Parcels 311,886 0.11 972 10.48

NRW ANNUAL REPORT 2013128
FOR THE YEAR ENDED 30 JUNE 2013
Shareholder Information
SHAREHOLDER INFORMATION
NRW’S 20 LARGEST SHAREHOLDERS
RANK NAME SHARES % INTEREST
1 J P MORGAN NOMINEES AUSTRALIA LIMITED 40,381,092 14.48%
2 HSBC CUSTODY NOMINEES (AUSTRALIA) LIMITED 31,463,369 11.28%
3 JP MORGAN NOMINEES AUSTRALIA LIMITED <CASH INCOME A/C> 24,382,858 8.74%
4 NATIONAL NOMINEES LIMITED 15,587,904 5.59%
5 CITICORP NOMINEES PTY LIMITED 12,881,437 4.62%
6 ZERO NOMINEES PTY LTD 7,574,112 2.72%
7 CITICORP NOMINEES PTY LIMITED <COLONIAL FIRST STATE INV A/C> 6,789,834 2.43%
8 UBS WEALTH MANAGEMENT AUSTRALIA NOMINEES PTY LTD 3,736,999 1.34%
9 JULIAN ALEXANDER PEMBERTON THE J P TRUST 2,540,014 0.91%
10 BNP PARIBAS NOMS PTY LTD <DRP> 1,929,819 0.69%
11 QIC LIMITED 1,644,742 0.59%
12 RBC INVESTOR SERVICES - AUSTRALIA NOMINEES PTY LIMITED <PISELECT> 1,545,476 0.55%
13 CS FOURTH NOMINEES PTY LTD 1,380,320 0.49%
14 MR ROBERT MANASSEN & MRS CYNTHIA MANASSEN <MANASSEN HOLDINGS PL S/F A/C> 1,221,433 0.44%
15 MR STEVEN SCHALIT & MS CANDICE SCHALIT <SCHALIT FAMILY S/F A/C> 1,042,232 0.37%
16 KEITH BOUNSELL BOUNSELL FAMILY TRUST 1,038,149 0.37%
17 HSBC CUSTODY NOMINEES (AUSTRALIA) LIMITED-GSCO ECA 810,412 0.29%
18 RBC INVESTOR SERVICES AUSTRALIA NOMINEES PTY LIMITED <BKCUST A/C> 680,121 0.24%
19 PETER LAURENCE DE SAN MIGUEL 638,882 0.23%
20 YAZAD SUPER PTY LTD <YAZAD SUPER FUND A/C> 625,000 0.22%
SUBSTANTIAL SHAREHOLDERS
As at the date of this report, the names of substantial holders in the Company who have notifi ed the
Company in accordance with Section 671B of the Corporations Act 2001 are set out below:
NAME SHARES % INTEREST
J P MORGAN NOMINEES AUSTRALIA LIMITED 40,381,092 14.48%
HSBC CUSTODY NOMINEES (AUSTRALIA) LIMITED 31,463,369 11.28%
JP MORGAN NOMINEES AUSTRALIA LIMITED CASH INCOME A/C 24,382,858 8.74%
NATIONAL NOMINEES LIMITED 15,587,904 5.59%
VOTING RIGHTS
Every shareholder present in person or represented by a proxy or other representative, shall have one vote
for each share held by them.

NRW ANNUAL REPORT 2013 129
FOR THE YEAR ENDED 30 JUNE 2013
Independent Auditor Report
INDEPENDENT AUDITOR REPORT

NRW ANNUAL REPORT 2013130
FOR THE YEAR ENDED 30 JUNE 2013
Independent Auditor Report
INDEPENDENT AUDITOR REPORT

This page has been left blank intentionally
This page has been left blank intentionally

Holdings Limited

NRW Holdings Limited
181 Great Eastern Highway Belmont WA 6104 Australia
Telephone: +61 8 9332 4200
Facsilime: +61 8 9232 4232
Email: [email protected]
Website: nrw.com.au
Holdings Limited