nrel gearbox reliability collaborative: comparing in-field ... · • modified to mw state of the...
TRANSCRIPT

Brian McNiff - McNiff Light IndustryWilliam LaCava – NRELJeroen van Dam - NREL
NREL Gearbox Reliability Collaborative:
Comparing In-field Gearbox Response to Dynamometer Testing
1#
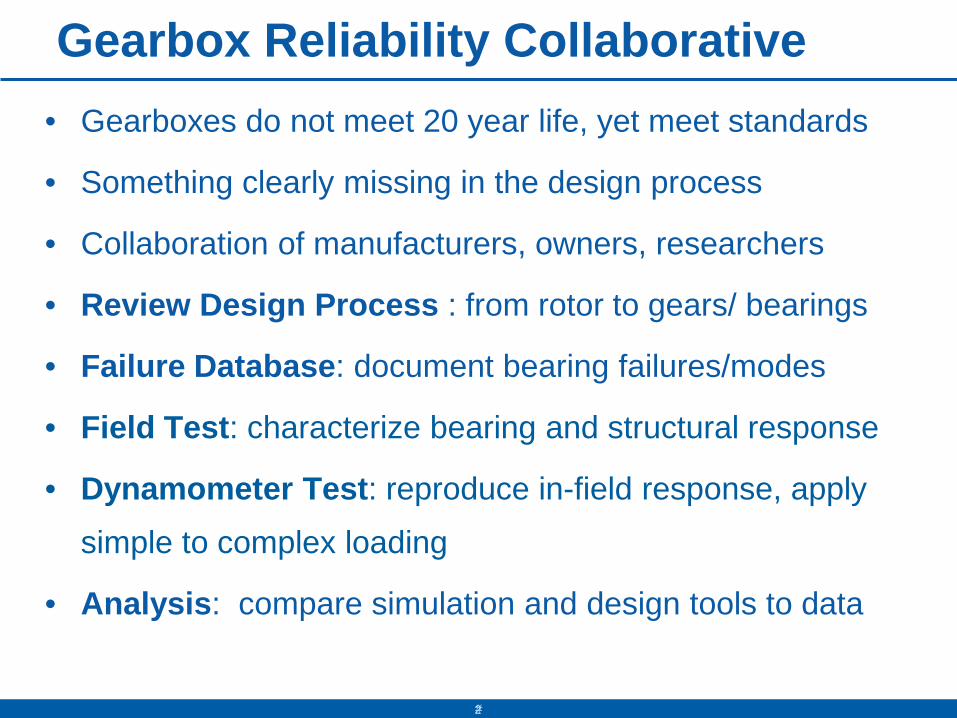
Gearbox Reliability Collaborative
• Gearboxes do not meet 20 year life, yet meet standards
• Something clearly missing in the design process
• Collaboration of manufacturers, owners, researchers
• Review Design Process : from rotor to gears/ bearings
• Failure Database: document bearing failures/modes
• Field Test: characterize bearing and structural response
• Dynamometer Test: reproduce in-field response, apply
simple to complex loading
• Analysis: compare simulation and design tools to data
2#

NREL Gearbox Reliability Collaborative Overview
• Understand internal and external gearbox response to specific loading
• Explore gaps in design process
• Develop dynamometer test to validate design assumptions
• Exercise current state of the art design tools from rotor to tribological surfaces
• Suggest improvements in design practices, validation testing and analytical tools
GRC Goals Field Testing Dynamometer Testing
Analysis
3#

Test Approach & Objectives
• Redesigned, rebuilt 2 identical 750 kW gearboxes • Modified to MW state of the art• Instrumented with over 125 signals to sense motions,
deflections, load distributions, strains and temp• Objective: Collect data to characterize gear and bearing
response in all operating situations• Field Test – capture normal operation and transients• Dyno Test – static torque, add rotor forces and
moments, add dynamics to reproduce field response• Develop data post processing and visualization tools• Validate data to provide to analysis partners• Presentation – can we match internal response in
Dyno#4

Main Shaft Bending and Torque
- two orthagonal directions of shaft bending moment gauges- Gauges mounted between main bearing and gearbox - calibrated with pull, known weight and shunt- Torque gauges same location
5#
NOTE: - static weight moment differ between field and Dyno- NTL forces applied at Fa- gear tooth couplings on LSS

Ring Gear Face Width Load Distribution
-24 gauges mounted on- tooth root centerline- 8 each at 0°-120°-240 °
6#

Ring gear gages
Gear Face load distribution, stepped loading to 100% Rated Torque
7#
The animated video associated with this slide is not available.

Planet bearing load distribution
8#

Planet bearing load distribution
Upwind
Downwind
Courtesy of Timken
9
Raw Signal
AxialDistribution
Load Zone Shift
Dyno
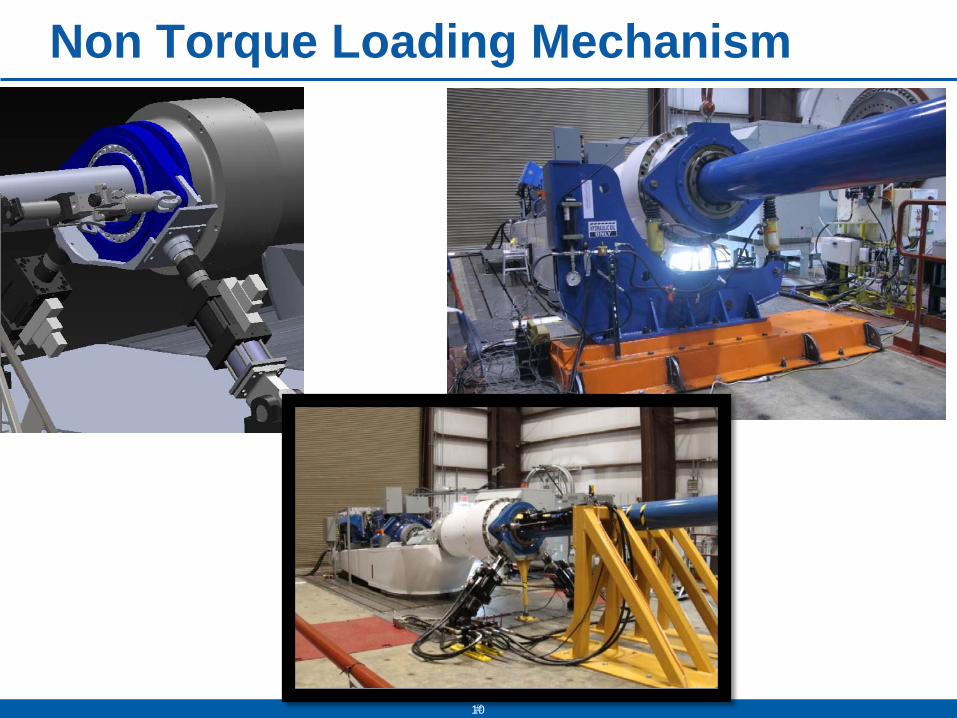
Non Torque Loading Mechanism
10#

Shaft Bending Effect at 240° CW
11
+My
+My

Field Data
- Captured 300+ hours of data at broad range of wind speeds
TORQUE WIND SPEED HISTOGRAM
12

Rotor Moments in Field Test
13
- Applied loads on NTL system in Dyno based on field data
Main Shaft Bending - Magnitude Statistics for Gearbox 1 Field Testing

Field vs Dyno - Torque
Comparison of 100% Torque in Field vs Dyno
Field data features a prominent 3p torque excitationDyno torque only excites at the shaft rotation frequency
0 0.5 1 1.5 2 2.5 3 3.5 4 4.5 5
1
2
3
4
5
6
7
8
9
10
11
X: 2.222Y: 1.361
Frequency (HZ)
Mag
nitu
de
X: 3.333Y: 2.982
X: 1.111Y: 11.46
X: 0.3784Y: 3.84
Field TorqueDyno Torque
0 10 20 30 40 50 60 70280
300
320
340
360
380
400
420
Time (sec)
Tor
que
(kN
m)
Field TorqueDyno Torque
14

Field vs Dyno – Shaft Bending Moment
Comparison of 100% Torque in Field vs Dyno & static NTL
- Variations in loading not accounted for in Dyno-Dyno dominant excitation at shaft rotation frequency- Field has beat frequencies of 1P plus
15

Pin Load Distribution – Field DataPLANET CARRIER
16
A
B C
The animated video associated with this slide is not available.
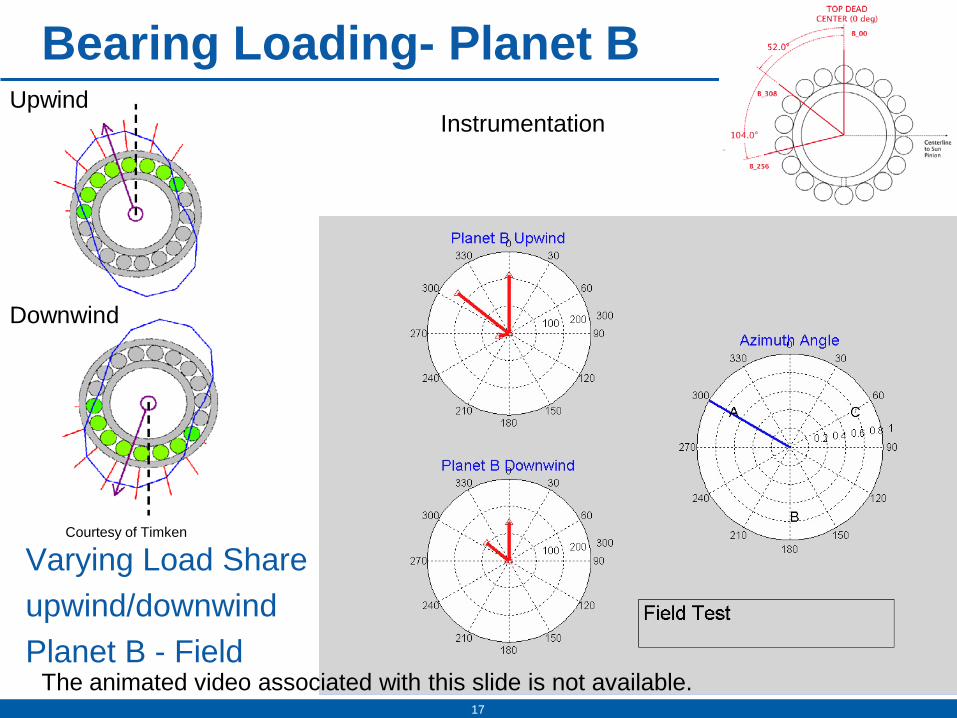
Bearing Loading- Planet B
Varying Load Shareupwind/downwind Planet B - Field
Upwind
Downwind
Courtesy of Timken
Instrumentation
17
The animated video associated with this slide is not available.

Dynamic Shaft Moments – Dyno vs Field
- Able to operate NREL dynamometer NTL to dynamically match shaft bending from actual field data

Dynamic Torque – Dyno vs Field
- Torque was more difficult- Limitations with VFD- Significant filtering

Conclusions
• Rotor forces/moments have an appreciable effect on ring gear and planet bearing load distributions
• Shaft moment and torque variations in the field are not reproduced in typical dynamometer testing.
• Dynamic non-torque load application can reproduce the in-field moment magnitudes and frequency content
• Torque dynamic variations in the field were difficult to reproduce on the NREL Dyno due to system limits
• But, we learned what we needed to do to make it work in upgraded NREL 5 MW Dyno facility
#20


Ruth Heffernan MarshMay 25, 2011
Advanced Wind Turbine Technology Assessment
Using Advanced Technology to Achieve Targets
© Det Norske Veritas AS. All rights reserved.
Advanced Wind Turbine Technology Assessment
May 25, 2011
23
Project Information
Project Sponsor:
Electric Power Research Institute
EPRI Program Manager:
Charles R. McGowin, Ph. D.
DNV Research Team:
Ruth Heffernan Marsh
Morten Andersen
Matthew Malkin
Timothy McCoy
Hugh Turnbaugh

© Det Norske Veritas AS. All rights reserved.
Advanced Wind Turbine Technology Assessment
May 25, 2011
24
The Modern Wind Turbine
Mature commercial technology?
Or work in progress?

© Det Norske Veritas AS. All rights reserved.
Advanced Wind Turbine Technology Assessment
May 25, 2011
25
Improvements Under Development for Many Components or Subsystems
Constant stream of “solutions”
FoundationsOnshore and offshoreSource: Danish Wind Energy Association

© Det Norske Veritas AS. All rights reserved.
Advanced Wind Turbine Technology Assessment
May 25, 2011
2626
26 Technologies Reviewed
Blades/Rotor (12)
Passive aerodynamic devices
Active aero control
Sweep-twist blades
Material innovations: PVC resin
Material innovations: WebCore
Segmented structures
"Stealth" rotor blade
"Smart" blades
Flatback airfoils
Non-destructive inspection
Blade de-icing: super-hydrophobic
Automated blade manufacturing
Drive Train and Power Electronics (6)
Medium-voltage power electronics
Silicon-carbide IGBTs
Low-speed PM generators
Superconducting low-speed generator
Single-stage gearbox with medium speed generator
Hydrodynamic couplings

© Det Norske Veritas AS. All rights reserved.
Advanced Wind Turbine Technology Assessment
May 25, 2011
2727
26 Technologies Reviewed
Sensors and Controls (3)
Short-term forecasting - lidar
Independent blade pitch
Advanced control algorithms (adaptive control)
Towers (3)
Concrete/hybrid towers
Integrated foundation/tower
Tall towers > 120 m
Offshore (2)
Towable gravity foundation
Floating platforms
Which have the greatest potential?
© Det Norske Veritas AS. All rights reserved.
Advanced Wind Turbine Technology Assessment
May 25, 2011
2828
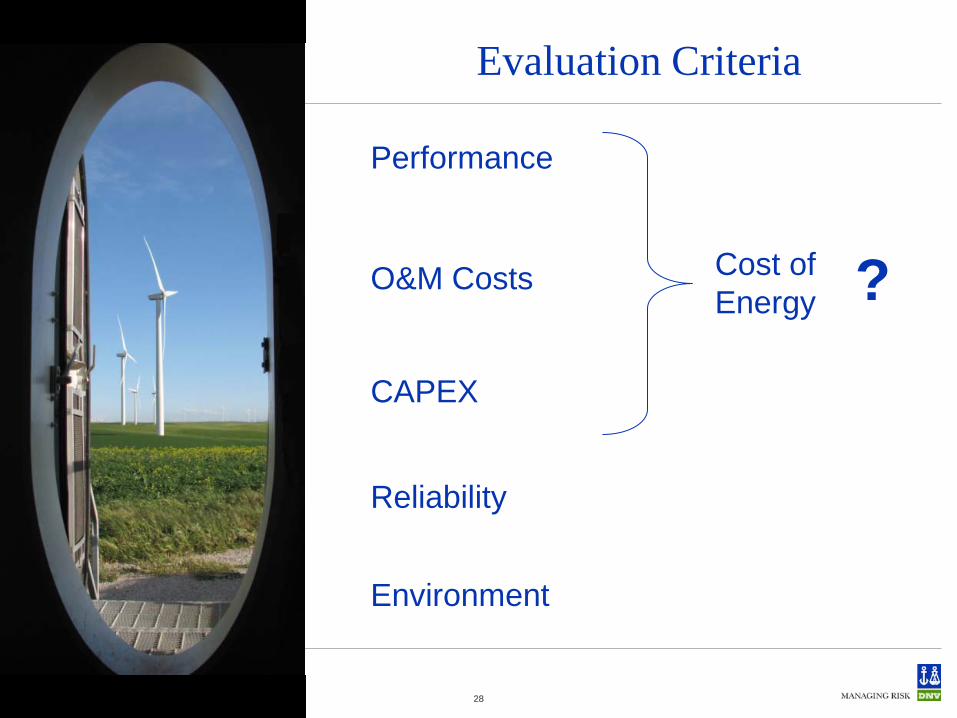
Evaluation Criteria
CAPEX
O&M Costs
Performance
Reliability
Environment
Cost ofEnergy ?

© Det Norske Veritas AS. All rights reserved.
Advanced Wind Turbine Technology Assessment
May 25, 2011
2929
Example: Sweep-Twist Coupled Rotor Blades
CAPEX
O&M Costs
Performance
Reliability
Environment
50%
EstimatedChange
WeightingFactor
15%
25%
5%
5%
Example:Total potential impact score = 6.5/10

© Det Norske Veritas AS. All rights reserved.
Advanced Wind Turbine Technology Assessment
May 25, 2011
3030
Levelized Cost of Energy (LCOE)
Cc_annualized = Annualized CAPEX
CO&M = O&M costs
AEP = Annual energy production
Example: sweep-twist coupled blades • LCOE = -10% to -15%
+=
AEP
CCLCOE MOannualizedc &_

© Det Norske Veritas AS. All rights reserved.
Advanced Wind Turbine Technology Assessment
May 25, 2011
3131
Which Component/Subsystem?
Rotor6% Gearbox and
Generator19%
Converter5%
Tower5%
Foundation/ Construc.
29%
Other36%
Rotor9%
Gearbox and Generator
29%
Converter8%Tower
8%
Foundation/ Construc.
20%
Other26%
Offshore (~$4,000/kW)Onshore (~$1,600/kW)
Installed Cost (CAPEX)

© Det Norske Veritas AS. All rights reserved.
Advanced Wind Turbine Technology Assessment
May 25, 2011
3232
Technology Potential Score: 8.9/10Impact on LCOE: -0 to -5%
Source: “Offshore Wind Technology” presented by Walt Musial, National Renewable Energy Laboratory, at AWEA Offshore Wind Workshop, September 9, 2008

© Det Norske Veritas AS. All rights reserved.
Advanced Wind Turbine Technology Assessment
May 25, 2011
3333
Rotor Blade Sweep-Twist Coupling
----- Conventional Blade Shape____ Sweep-Twist Blade Shape
Technology Potential Score: 6.5/10Impact on LCOE: -10 to -15%

© Det Norske Veritas AS. All rights reserved.
Advanced Wind Turbine Technology Assessment
May 25, 2011
3434
Technology Potential Score: 6.3/10Impact on LCOE: -15 to -20%
Medium-speed drive train
Source: Global Energy Concepts, National Renewable Energy Laboratory WindPACT Advanced Wind Turbine Drive Train Design Study

© Det Norske Veritas AS. All rights reserved.
Advanced Wind Turbine Technology Assessment
May 25, 2011
3535
Tall Towers > 120 m
Hybrid tower concepts
Pre-stressed concrete
H1 H2 H3
Steel tower
Pre-str. concrete section
Hybrid tower concepts
Pre-stressed concrete
H1 H2 H3
Steel tower
Pre-str. concrete section
Hybrid tower concepts
Pre-stressed concrete
H1 H2 H3
Steel tower
Pre-str. concrete section
Technology Potential Score: 5.9/10Impact on LCOE: -10 to -15%

© Det Norske Veritas AS. All rights reserved.
Advanced Wind Turbine Technology Assessment
May 25, 2011
3636
Conclusions and Recommendations
• Innovation needed to achieve industry goals
• Not all technology improvements will have a significant impact
• Good evaluation criteria help focus priorities
• Combining promising technologies can lead to greater improvements

© Det Norske Veritas AS. All rights reserved.
Advanced Wind Turbine Technology Assessment
May 25, 2011
37
Safeguarding Life, Property And The Environment
www.dnv.com
Contact Information:
Ruth Heffernan Marsh
(206) 387-4200, ext 328
Testing of Wind Turbine Blade Pitch Bearings In A
Scaled Test Rig
Robert A. PalliniSerge Bochnovich
John H CowlesRobert Lugosi
Presented May 25, 2011
ConfidentialContains Material Non—public Information© 2011 RBC Bearings Incorporated

© 2011 RBC Bearings Incorporated
Pitch Bearing Function and Requirements
• Pitch Bearing and Purpose– Located between the rotor blade
and the rotor hub– Rotates the blades to adjust to
varying wind and operating conditions
– Transmits turning torque to the blade
• Drive motor and integral gear• Hydraulic actuator arm
39

© 2011 RBC Bearings Incorporated
Pitch Bearing Function and Requirements
• Typical Pitch Bearing Requirements– 20 year service life– -40oC to +60oC ambient temperatures– Slow rotational speed (< 2 rpm)– Small amplitudes of oscillation– Non-leak seals– Friction torque restrictions
40

© 2011 RBC Bearings Incorporated
Pitch Bearing Function and Requirements
41
Typical Pitch Bearing Cross Section

© 2011 RBC Bearings Incorporated42
Pitch Bearing Test Rig
• Purpose– Bench test a scale model bearing to verify design
assumptions for static load, case depth, torque, and fatigue adequacy
• Concept– Test rig to simulate rolling element load / stress levels
occurring in wind turbine pitch blade bearings– Scale model bearing with exact ball / ball groove geometry
and design as pitch blade bearing– Must be able to rotate (oscillate) under load

© 2011 RBC Bearings Incorporated
Test Bearing - Pitch Bearing
43

© 2011 RBC Bearings Incorporated
Pitch Bearing Test Rig – Final Concept
Facts and Figures• Test Bearing
• Two Single Row 4-point BB• 35” OD• 1.75” Ball• M36 Bolts Each Ring
• Rig Dimensions / Weight• Height 96.6” (Table 20”)• Width 54”• Length 109”• Total Weight 17,000 lb
• Applied Loading• Axial Thrust 6,000 lb• Moment 1,700,000 in-lb• 365,000 psi Contact Stress• Breakaway Torque 18,000 in-lb
• Drive System• Roller Screw Actuator• Speed 6.6 in/sec (3 rpm)• Oscillate +/- 30o
44
Axial Load Super Bolt
Moment Load Arms
Moment load Bolts and Load Cells
Linear Actuator
TestBearings

© 2011 RBC Bearings Incorporated45
Pitch Bearing Test Rig – Final Concept

© 2011 RBC Bearings Incorporated
Pitch Bearing Test Rig FEA
46
Simplified, Quarter Symmetry Model of Test Rig
Linear Displacement Across Bearing with Applied Moment Load
Cosine Load Distribution Across Bearing with Moment Load Applied

© 2011 RBC Bearings Incorporated
Pitch Bearing Test Rig FEA
47
Initial Rig Design had shorter cylinder height and no gussets
Maximum Stress in vertical direction applied to top of bearing is not on plane
of symmetry for initial design
-20000
-15000
-10000
-5000
0
5000
10000
15000
0 30 60 90 120 150 180
Theta (degrees)
Ver
tica
l Str
ess
(psi
)
Case 1
Case 2
Case 3
Case 4
Case 5
Case 6
Theta
Ver
tica
l Str
ess
Analyzed Several Test Rig Design Configurations to get Proper Cosine Distribution of Load
0 30 60 90 120 150 180
Final Stress Distribution

© 2011 RBC Bearings Incorporated48
Pitch Bearing Test Rig

© 2011 RBC Bearings Incorporated
Test Plan
• Load Ramp-Up Tests– Intervals of centric axial load and moment Load
• Rig shake-down• Start-up torque levels• Bearing stack height to datum
• Endurance Test– Full axial and moment load
• 347 days / 60o cycles / 3 rpm (20 year service)• Monitor running torque / height / grease contamination• Re-grease every 20 days
49

© 2011 RBC Bearings Incorporated
Torque Data
Running Torque Calculation (Harris, Rumbarger, & Butterfield NREL Design Guideline DG03)
Mr = (µ) (dm/2) [ 4.4Fm/dm + 2.2Fr + Fa] + Mconst
µ = coefficient of friction (0.003 for pitch bearings)
dm = bearing raceway diameterFm = applied overturning moment loadFr = applied radial loadFa = Applied axial loadMconst = Constant torque (seals, grease, bolt torque, etc.)
Mconst = 624 Nm (as measured – fully assembled, greased, sealed, and mounted test bearings)
50

© 2011 RBC Bearings Incorporated
Torque Data – Test Results
51
1 in/sec 3 in/sec 7 in/sec
Axial Load Only Fa = 233.5 kN
872 339 - 791 395 - 678 339 - 678
Moment Load Only Fm = 192 kNm
1892 1695 - 2034 1582 - 1808 1356 - 1582
Endurance Test Loads Fr = 8.9 kN
Fa = 26.7 kN Fm = 192 kNm
1941 - - - - - - - - - -
1977 - 2034 1356 - 1921 1130 - 1977 Avg. 1638
Running Torques (Nm)Measured
Load CaseCalculated
•Computer Analysis = 1800 Nm
-20000
-15000
-10000
-5000
0
5000
10000
15000
20000
0 10 20 30 40 50
Mea
usr
ed B
eari
ng
To
rqu
e (i
n-l
b)
Actuator Travel (in)
Torque Vs. Travel
Typical Torque Trace

© 2011 RBC Bearings Incorporated
Test Results – Grease Sample Results
• Grease Sample Analyses (results in ppm)
52
Sample Fe Cr Ni Al Mn Mo Si K Li Ca P Zn
Baseline 3 0 0 0 0 0 0 0 170 0 3 1
20 day 66 0 0 3 0 2 0 0 2483 10 21 16
40 day 35 0 0 4 0 0 0 8 948 0 16 3
80 day 83 0 0 1 0 0 0 1 5315 27 90 80
100 day 41 0 1 3 0 1 27 1 1688 25 85 22
140 day 25 0 0 0 0 4 3 0 1862 0 46 4
Wear Metals Contaminants Additives
Major Thickener Agent
Typical AdditivesNormal Wear and Run-inRaceway and Cage

© 2011 RBC Bearings Incorporated
Test Results – Bearing Characteristics
• Maximum Contact Stress (Max Loaded Ball)– Calculated = 2456 MPa to 2508 MPa– Goal = 2482 MPa
• Contact Patch Length– Calculated Inner Race 5.7 mm to 15.4 mm
Outer Race 4.7 mm to 15.5 mm – Observed Inner Race 7.1 mm to 16.5 mm
Outer Race 4.6 mm to 16.0 mm
53

© 2011 RBC Bearings Incorporated
Test Results – Bearing Photos (152.5 days)
54
Typical Appearance of Test Bearing Raceways
Contact Patch

© 2011 RBC Bearings Incorporated
SUMMARY
• The ability to test operating characteristics of a scaled pitch blade bearing has been demonstrated
• Measured torque values are in reasonable agreement with calculated values
• Results suggest assumed friction coefficient is conservatively high
• Observed contact lengths and contact angles are in agreement with calculated values
• Endurance test will be resumed
55

© 2011 RBC Bearings Incorporated56
THANK YOU!
Component Certification
Hallmark and entrance for US-suppliers to worldwide wind market

2011-05-25AWEA 2011 - Component Certification 58
• Introducing GL Renewables Certification
• What is „Certification“?• Component Certification
Content of presentation

2011-05-25AWEA 2011 - Component Certification 59
GL Renewables Certification is• Apart of the GL Group, • The leading certification body,
primarily focussed on the certification of wind farms, wind turbines and their components.• At the forefront of understanding in renewables technology • Abreast of all the necessary standards and requirements and takes a harmonised approach in ensuring that these are
met.
Manufacturers, banks and insurers around the world rely on the state-of-the-art service provided by GL Renewables Certification.
GL Renewables segments 750 Employees in 22 Countries
Offshore Wind
Onshore Wind
Support Vessels
Wave Power
Tidal Power
Solar
ChinaJapan
Portugal
UK
France
DenmarkGermany
Turkey
India
Australia
New ZealandBrazil
CanadaUSAMexico
Ireland
Italy
Spain
NetherlandsPoland
Chile
Egypt

2011-05-25AWEA 2011 - Component Certification 60
• Introducing GL Renewables Certification
• What is „Certification“?
• Component Certification
Content of presentation
2011-05-25AWEA 2011 - Component Certification 61
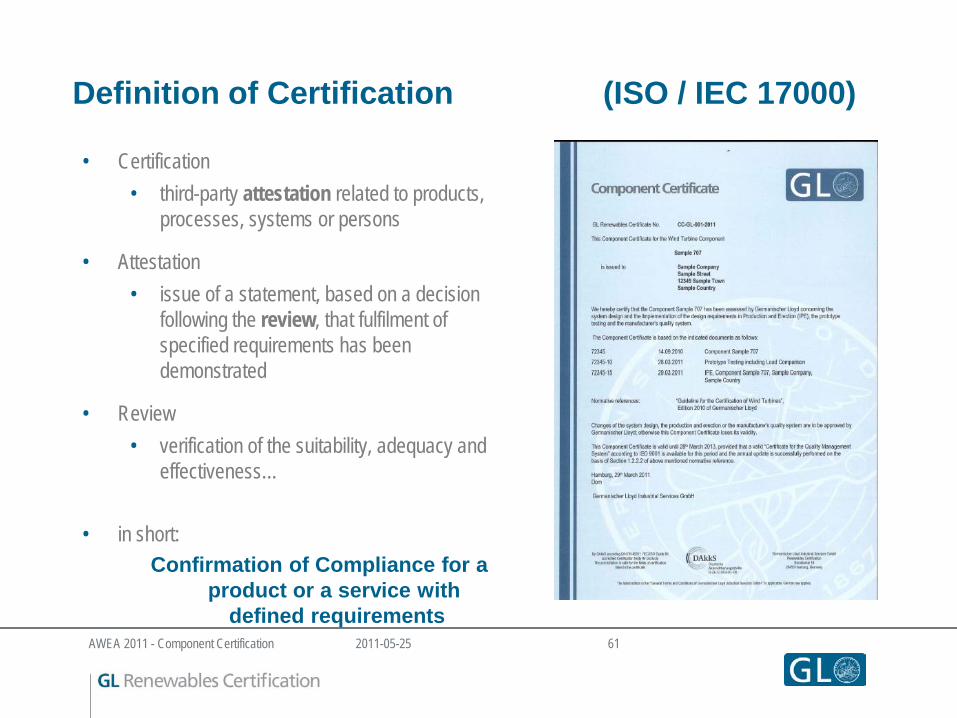
Definition of Certification (ISO / IEC 17000)
• Certification• third-party attestation related to products,
processes, systems or persons
• Attestation• issue of a statement, based on a decision
following the review, that fulfilment of specified requirements has been demonstrated
• Review• verification of the suitability, adequacy and
effectiveness…
• in short: Confirmation of Compliance for a
product or a service withdefined requirements

2011-05-25AWEA 2011 - Component Certification 62
• Introducing GL Renewables Certification• What is „Certification“?
• Component Certification
Content of presentation

2011-05-25AWEA 2011 - Component Certification 63
The object of Component Certification
is the confirmation that a component for a wind turbine is
• designed, • documented and • manufactured
in conformity with
• design assumptions, • specific standards and • technical requirements.

2011-05-25AWEA 2011 - Component Certification 64
Moduls of Component Certification
The specific scope for the assessment within a module depends on the actual component.
The procedures and requirements that must be applied are described in technical standards and guidelines, like
[1] “Guideline for the Certification of Wind Turbines”, Edition 2010[2] “Guideline for the Certification of Offshore Wind Turbines”, Edition 2005[3] ”Conformity testing and certification”, IEC 61400-22 Edition 1.0, 2010-05

2011-05-25AWEA 2011 - Component Certification 65
Component Certificates are often required
• Rotor blades• Gearboxes• Generators • Tower
but more and more also for • Rotor hubs• Main shafts • Main and generator frames • Main bearings• Locking devices • Main brakes• Couplings• Pitch and yaw drives and their
bearings• Transformers • Converters• Lifting devices

2011-05-25AWEA 2011 - Component Certification 66
Moduls of Component Certification
The specific scope for the assessment within a module depends on the actual component.
The procedures and requirements that must be applied are described in technical standards and guidelines, like
[1] “Guideline for the Certification of Wind Turbines”, Edition 2010[2] “Guideline for the Certification of Offshore Wind Turbines”, Edition 2005[3] ”Conformity testing and certification”, IEC 61400-22 Edition 1.0, 2010-05

2011-05-25AWEA 2011 - Component Certification 67
Germanischer Lloyd Renewable Certification can provide tailored solutions for wind turbine manufacturers and component-suppliers.
You will receive a hallmark showing that your component meets both
• International standards and your • Customer’s needs.

Axel DombrowskiDepartment Machinery Components and Electrical Engineering Germanischer Lloyd Industrial Services GmbH Renewables CertificationBrooktorkai 18, 20457 Hamburg GERMANY Phone: +49 (0) 40 - 3 61 49 - 74 08 Fax: +49 (0) 40 - 3 61 49 - 17 20 Email: [email protected] WWW: www.gl-group.com/GLRenewables
Thank you very much for your attention

Questions and AnswersPart 1

Questions and AnswersPart 2