nrdc: improving the science and management of data … · improving the science and ... fisheries:...
TRANSCRIPT
AuthorsDavid Newman – Natural Resources Defense CouncilTom Carruthers – University of British Columbia, Fisheries CentreAlec MacCall – National Marine Fisheries Service, Southwest Fisheries Science Center (Retired)Clay Porch – National Marine Fisheries Service, Southeast Fisheries Science CenterLisa Suatoni – Natural Resources Defense Council
Improving the Science and Management of Data-Limited Fisheries: An Evaluation of Current Methods and Recommended Approaches
NRDC REPoRT october 2014R:14-09-B

AcknowledgmentsThe authors would like to thank the fisheries experts who participated in the January 2014 Data-Limited Methods Workshop that forms the foundation of much of the content contained within this report. The authors are particularly appreciative of the National Marine Fisheries Service Science Centers for enabling many of their leading fisheries scientists to take the time to attend the Workshop.
NRDC would like to thank the Gordon and Betty Moore Foundation, the David and Lucile Packard Foundation, the Sarah K. DeCoizart Perpetual Charitable Trust, the Kingfisher Foundation, the Panaphil Foundation, the Prospect Hill Foundation, and the NRDC Science Center for their generous support of the Workshop, this report, and the underlying research.
We thank the many people who contributed to organizing the Workshop and to the research, drafting, and review of this report, including: Janna D’Ambrisi, Marisa Kaminski, Brad Sewell, Seth Atkinson, Sarah Chasis, and Mary Heglar.
DisclaimerThe scientific results and conclusions, as well as any views or opinions expressed herein, are those of the authors and do not necessarily reflect the views of NOAA Fisheries or the Department of Commerce.
Glossary of Acronyms
About NrDcThe Natural Resources Defense Council (NRDC) is an international nonprofit environmental organization with more than 1.4 million members and online activists. Since 1970, our lawyers, scientists, and other environmental specialists have worked to protect the world's natural resources, public health, and the environment. NRDC has offices in New York City, Washington, D.C., Los Angeles, San Francisco, Chicago, Bozeman, MT, and Beijing. Visit us at www.nrdc.org and follow us on Twitter @NRDC.
NRDC Director of Communications: Lisa BenensonNRDC Deputy Director of Communications: Lisa GoffrediNRDC Policy Publications Director: Alex KennaughDesign and Production: www.suerossi.com
© Natural Resources Defense Council 2014
ABC Acceptable Biological Catch
ACL Annual Catch Limit
AIM An Index Method
BASI Best Available Scientific Information
CC Catch-Curve Estimation
CC-SRA Catch-Curve Stock Reduction Analysis
CFMC Caribbean Fishery Management Council
CIE Certified Independent Expert
CompSRA Catch Composition Stock Reduction Analysis
CPUE Catch Per Unit Effort
DACS Depletion-Adjusted Catch Scalar
DB-SRA Depletion-Based Stock Reduction Analysis
DCAC Depletion-Corrected Average Catch
DLM Data-Limited Methods
exSSS Extended Simple Stock Synthesis
GMFMC Gulf of Mexico Fishery Management Council
HMS Highly Migratory Species
MAFMC Mid-Atlantic Fishery Management Council
ML Mean Length Estimation
MP Algorithmic Management Procedures
MPA Marine Protected Area
MSA Magnuson-Stevens Fishery Conservation and Management Act
MSE Management Strategy Evaluation
MSY Maximum Sustainable Yield
NEFMC New England Fishery Management Council
NEFSC Northeast Fisheries Science Center
NMFS National Marine Fisheries Service
NOAA National Oceanic and Atmospheric Administration
NPFMC North Pacific Fishery Management Council
NRDC Natural Resources Defense Council
NWFSC Northwest Fisheries Science Center
OFL Overfishing Limit
ORCS Only Reliable Catch Stocks
PFMC Pacific Fishery Management Council
PIFSC Pacific Islands Fisheries Science Center
PSA Productivity and Susceptibility Analysis
SAFMC South Atlantic Fishery Management Council
SEDAR Southeast Data Assessment Review
SEFSC Southeast Fisheries Science Center
SERO Southeast Regional Office (NMFS)
SPR Spawning Per Recruit Analysis
SPSRA Surplus Production Stock Reduction Analysis
SRA Stock Reduction Analysis
SSC Scientific and Statistical Committee
STAR Pacific Stock Assessment Review
SWFSC Southwest Fisheries Science Center
WPFMC Western Pacific Fishery Management Council
XDB-SRA Extended Depletion Based Stock Reduction Analysis
YPR Yield Per Recruit Analysis
PAGe 3 | Improving the science and Management of Data-Limited Fisheries
tAbLe oF coNteNts
Introduction .................................................................................................................................................................................... 4
1. current Practices for setting catch Limits for Data-Limited stocks in the united states ................................................. 5
2. emerging Data-Limited Methods .............................................................................................................................................. 6
3. evaluation of current Data-Limited Methods .......................................................................................................................... 7
4. Data-Limited Fisheries toolkit .................................................................................................................................................. 9
5. case studies ............................................................................................................................................................................. 18
6. recommendations for Improving Assessment and Management of Data-Limited Fisheries .......................................... 22
Appendix 1: DLM Workshop Attendees ..................................................................................................................................... 26
Appendix 2: Abstracts of Presentations on emerging Data-Limited Methods ...................................................................... 27
Appendix 3: results of Management strategy evaluation of current Data-Limited Methods in use in the u.s. (carruthers et al., 2014) ................................................................................................................................. 30
references ..................................................................................................................................................................................... 33

PAGe 4 | Improving the science and Management of Data-Limited Fisheries
INtroDuctIoN
Congress amended the Magnuson-Stevens Fishery Conservation and Management Act (MSA) in 2006 to require annual catch limits (ACL) for most federally-managed fish stocks by 2011, with the goals of ending overfishing, improving accountability within the fisheries management
system, and encouraging research into more precise assessment methods (U.S. Senate, 2006). Meeting this mandate required fishery managers to establish new mechanisms for setting ACLs for hundreds of previously unassessed stocks and stock complexes, a considerable undertaking that required substantial resources of time and energy by the regional fishery management councils, the National Marine Fisheries Service (NMFS), stock assessment scientists, and technical advisors.
One of the primary challenges in meeting the ACL mandate has been how to deal with stocks for which only limited data are available. Prior to the ACL requirement, assessment efforts were focused almost entirely on high-value stocks with ample data to conduct conventional “data-rich” assessments. Relatively little attention had been paid to collecting data for the less-targeted and lower-value stocks, and protocols had not been well-established for making optimal use of the limited data that were available. Consequently, many ACLs for previously unassessed stocks have been set initially based on an examination of recent fishery catch statistics with little explicit consideration of other types of data.
The ACL requirement has catalyzed scientific innovation in data analysis, assessment, and ACL-setting methods for data-limited fisheries, as more conventional data-rich assessment approaches are generally inapplicable to data-limited situations. Although data-limited assessment methods have long existed (and even saw widespread use prior to the 1980s), development of new methods has surged recently due to advances in computing technology and mathematical statistics. The field of data-limited assessment is now evolving rapidly, with new methods and tools being developed and implemented across a wide spectrum of fisheries in the United States and around the world.
Diver counting coral reef fishes at Pearl and Hermes Reef using the stationary point count method. NoAA photo by Paula Ayotte.
In January 2014, the Natural Resources Defense Council (NRDC) convened a group of experts from NMFS, state agencies, academic institutions, and non-governmental organizations for a Workshop on the science and management of data-limited fisheries (see Appendix 1 for a complete list of attendees). The goal of the Data-Limited Methods (DLM) Workshop was to evaluate and seek to improve current methods for managing data-limited fisheries through an in-depth exchange of practical experiences combined with quantitative analyses and newly-developed tools. To achieve this goal, the Workshop focused on the following key areas:
n Current practices for setting ACLs for data-limited stocks in the United States.
n Emerging data-limited methods.
n Evaluation of current and proposed data-limited methods.
n Development of a Data-Limited Fisheries Toolkit.
n Case Studies: Pacific Groundfish, Gulf of Mexico Reef Fish, and South Atlantic Snapper-Grouper fisheries.
n Recommendations for implementing the best scientific practices for data-limited stocks.
The Workshop focused attention on the Pacific and Southeastern fishery management regions and associated NMFS Fisheries Science Centers, as they are responsible for many of the data-limited stocks in the United States. Since it was not possible to cover the complete range of data-limited situations in the two regions in such a short time, the scope of the Workshop was further narrowed to cover only the Pacific Groundfish, Gulf of Mexico Reef Fish, and South Atlantic Snapper-Grouper fisheries. However, many of the conclusions of this report also apply to the other fishery management bodies and species complexes in these regions and beyond. This report includes, but is not limited to, information that was presented and discussed during the Workshop. To make the report as current as possible, especially given how rapidly the field of data-limited fisheries science and management is evolving, the report also presents information that has developed since the Workshop was convened in early 2014.

PAGe 5 | Improving the science and Management of Data-Limited Fisheries
1. curreNt PrActIces For settING cAtch LIMIts For DAtA-LIMIteD stocks IN the uNIteD stAtes
To frame the Workshop discussion in practical terms, NRDC presented the preliminary findings of a comprehensive inventory of current data-limited methods being used in U.S. management, including a breakdown of the various methods being used in different regions. The presentation was based on a study conducted by NRDC evaluating how ACLs were established for all federally-managed stocks, which has since been completed in conjunction with a scientist from the NMFS Southeast Fisheries Science Center (SEFSC) and submitted for publication (Newman, Berkson, and Suatoni, in press). The study reviewed all 47 federal fishery management plans and analyzed the methods being used to calculate the acceptable biological catch (ABC) for all stocks requiring an ACL.1 Myriad data-limited methods are currently in use throughout the country (see Table 1). The study found significant regional variations on the types of data-limited approaches being used (see Figure 1). Additional findings included:
n 504 ABCs were calculated in 2014, forming the basis for 189 ACLs for individual stocks and 99 stock complexes.
n 165 stocks are currently exempt from the ACL requirement.
n 30 percent of ABCs based on data-rich assessments, 11 percent using data-moderate methods, and 59 percent using data-poor ones.
n More data-moderate methods used to set ABCs for 2015 (mostly in the Pacific region).
n New England and the Mid-Atlantic regions manage the fewest data-limited stocks.
n The South Atlantic, Gulf of Mexico, Caribbean, Atlantic Highly Migratory Species, and Western Pacific regions have the highest proportion of ABCs set using data-poor methods.
n The Pacific and North Pacific regions, which together are responsible for calculating more ABCs than any other region, include both the largest number of data-rich ABCs and data-limited ones, including nearly all ABCs using data-moderate methods.
n DB-SRA (Depletion-Based Stock Reduction Analysis) and DCAC (Depletion-Corrected Average Catch) are the most common data-poor methods used by the Pacific Council.
n Catch-scalars are the most common data-poor method currently used in other regions.
Data-Limited terminology
Terminology in the field of data-limited fisheries has been a source of confusion. In this report, the term “data-limited” is used to describe a fishery that has few available data, data of poor quality, or, in some cases, available raw data that have yet to be processed into a usable format for conducting a conventional stock assessment. There is no clear demarcation line between data-limited and data-rich fisheries, but the latter are characterized by having multiple sources of information available regarding catch, abundance, and life history characteristics to support a conventional stock assessment. The types of fisheries that can be characterized as data-limited are quite broad, but can be further defined along a spectrum between “data-moderate” (i.e., providing some dynamic feedback on stock status based on information such as an index of abundance or biological sampling data) and “data-poor” (i.e., based on static assumptions lacking any temporal feedback about stock status, usually based on catch history or less, and sometimes informed by expert judgment). Importantly, these terms may be used to describe either the properties of the assessment and ACL-setting method or the inherent characteristics of the data that are available for a particular stock. These categories are not distinct, but rather form a continuum.
70% of all Abcs in u.s. based on
data-limited methods
Data-poor methods are used for
eVerY data-limited stock in the
southeast u.s.
4 of 5 data-moderate Abcs are in the Pacific or
North Pacific regions
1 In some cases, data-limited methods are used to calculate the overfishing limit (oFL) directly and an ABC control rule is used to modify the oFL. In other cases, oFL is considered “unknown” and the ABC is calculated directly with a data-limited method. In all cases, a data-limited method leads to an ABC calculation, so for simplicity we refer to each application of a data-limited method as an “ABC calculation.”
PAGe 6 | Improving the science and Management of Data-Limited Fisheries
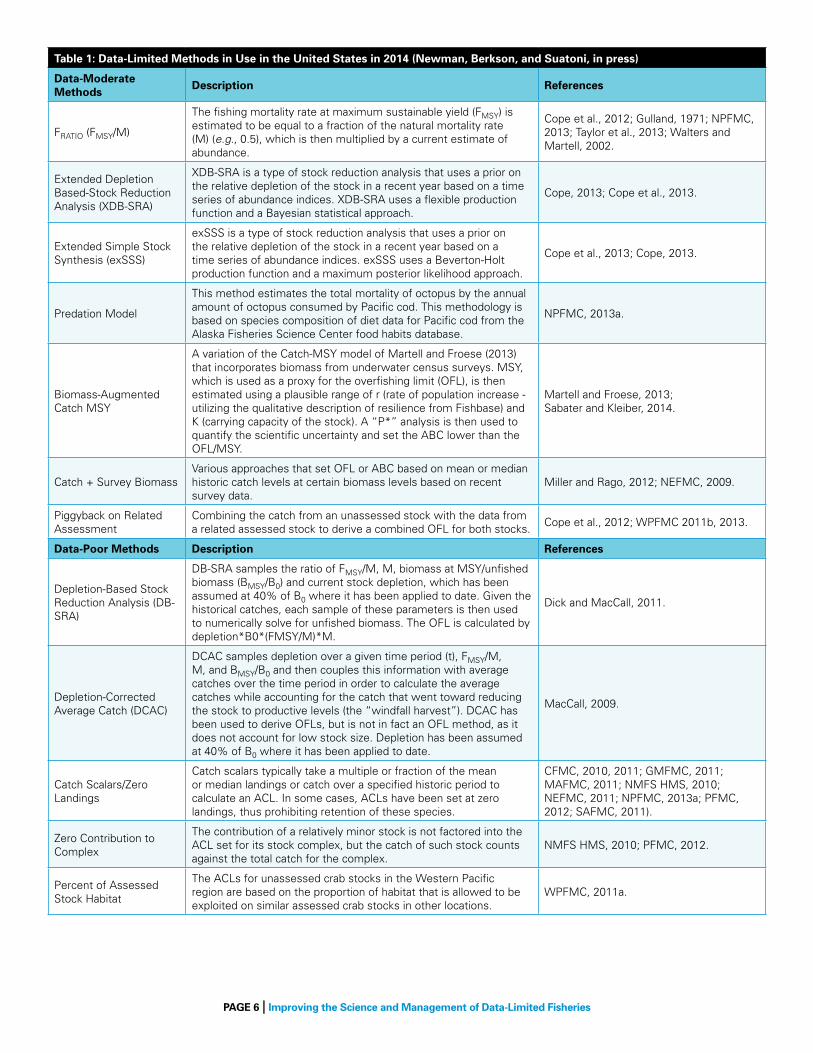
table 1: Data-Limited Methods in use in the united states in 2014 (Newman, berkson, and suatoni, in press)
Data-Moderate Methods Description references
FRATIo (FMSY/M)
The fishing mortality rate at maximum sustainable yield (FMSY) is estimated to be equal to a fraction of the natural mortality rate (M) (e.g., 0.5), which is then multiplied by a current estimate of abundance.
Cope et al., 2012; Gulland, 1971; NPFMC, 2013; Taylor et al., 2013; Walters and Martell, 2002.
Extended Depletion Based-Stock Reduction Analysis (XDB-SRA)
XDB-SRA is a type of stock reduction analysis that uses a prior on the relative depletion of the stock in a recent year based on a time series of abundance indices. XDB-SRA uses a flexible production function and a Bayesian statistical approach.
Cope, 2013; Cope et al., 2013.
Extended Simple Stock Synthesis (exSSS)
exSSS is a type of stock reduction analysis that uses a prior on the relative depletion of the stock in a recent year based on a time series of abundance indices. exSSS uses a Beverton-Holt production function and a maximum posterior likelihood approach.
Cope et al., 2013; Cope, 2013.
Predation Model
This method estimates the total mortality of octopus by the annual amount of octopus consumed by Pacific cod. This methodology is based on species composition of diet data for Pacific cod from the Alaska Fisheries Science Center food habits database.
NPFMC, 2013a.
Biomass-Augmented Catch MSY
A variation of the Catch-MSY model of Martell and Froese (2013) that incorporates biomass from underwater census surveys. MSY, which is used as a proxy for the overfishing limit (oFL), is then estimated using a plausible range of r (rate of population increase - utilizing the qualitative description of resilience from Fishbase) and K (carrying capacity of the stock). A “P*” analysis is then used to quantify the scientific uncertainty and set the ABC lower than the oFL/MSY.
Martell and Froese, 2013; Sabater and Kleiber, 2014.
Catch + Survey BiomassVarious approaches that set oFL or ABC based on mean or median historic catch levels at certain biomass levels based on recent survey data.
Miller and Rago, 2012; NEFMC, 2009.
Piggyback on Related Assessment
Combining the catch from an unassessed stock with the data from a related assessed stock to derive a combined oFL for both stocks.
Cope et al., 2012; WPFMC 2011b, 2013.
Data-Poor Methods Description references
Depletion-Based Stock Reduction Analysis (DB-SRA)
DB-SRA samples the ratio of FMSY/M, M, biomass at MSY/unfished biomass (BMSY/B0) and current stock depletion, which has been assumed at 40% of B0 where it has been applied to date. Given the historical catches, each sample of these parameters is then used to numerically solve for unfished biomass. The oFL is calculated by depletion*B0*(FMSY/M)*M.
Dick and MacCall, 2011.
Depletion-Corrected Average Catch (DCAC)
DCAC samples depletion over a given time period (t), FMSY/M, M, and BMSY/B0 and then couples this information with average catches over the time period in order to calculate the average catches while accounting for the catch that went toward reducing the stock to productive levels (the “windfall harvest”). DCAC has been used to derive oFLs, but is not in fact an oFL method, as it does not account for low stock size. Depletion has been assumed at 40% of B0 where it has been applied to date.
MacCall, 2009.
Catch Scalars/Zero Landings
Catch scalars typically take a multiple or fraction of the mean or median landings or catch over a specified historic period to calculate an ACL. In some cases, ACLs have been set at zero landings, thus prohibiting retention of these species.
CFMC, 2010, 2011; GMFMC, 2011; MAFMC, 2011; NMFS HMS, 2010; NEFMC, 2011; NPFMC, 2013a; PFMC, 2012; SAFMC, 2011).
Zero Contribution to Complex
The contribution of a relatively minor stock is not factored into the ACL set for its stock complex, but the catch of such stock counts against the total catch for the complex.
NMFS HMS, 2010; PFMC, 2012.
Percent of Assessed Stock Habitat
The ACLs for unassessed crab stocks in the Western Pacific region are based on the proportion of habitat that is allowed to be exploited on similar assessed crab stocks in other locations.
WPFMC, 2011a.

PAGe 7 | Improving the science and Management of Data-Limited Fisheries
NEW ENGLANDCATCH + SURVEY BIOMASSCATCH SCALARPERCENT OF ASSESSED STOCK
PACIFICFratioPIGGYBACK ON ASSESSED STOCKXDB-SRAexSSSCATCH SCALARZERO LANDINGSDB-SRA DCAC ZERO CONTRIBUTION
NORTH PACIFICFratioPIGGYBACK ON ASSESSED STOCKPREDATION MODELCATCH SCALARZERO LANDINGS
DATA-LIMITED METHODS BY REGION: Blue = Data-ModerateRed = Data-Poor
WESTERN PACIFICBIOMASS-AUGMENTED CATCH MSYPIGGYBACK ON ASSESSED STOCKCATCH SCALARZERO LANDINGSPERCENT OF INDICATOR STOCK HABITAT
GULF OF MEXICOCATCH SCALARZERO LANDINGS
CARIBBEANCATCH SCALARZERO LANDINGS
SOUTH ATLANTICCATCH SCALARZERO LANDINGS
MID-ATLANTICCATCH + SURVEY BIOMASSCATCH SCALAR
CONSOLIDATED ATLANTIC HMSCATCH SCALARZERO LANDINGSZERO CONTRIBUTION
Figure 1: regional Application of Data-Limited Methods in the united states (Newman, berkson, and suatoni, in press)
PAGe 8 | Improving the science and Management of Data-Limited Fisheries
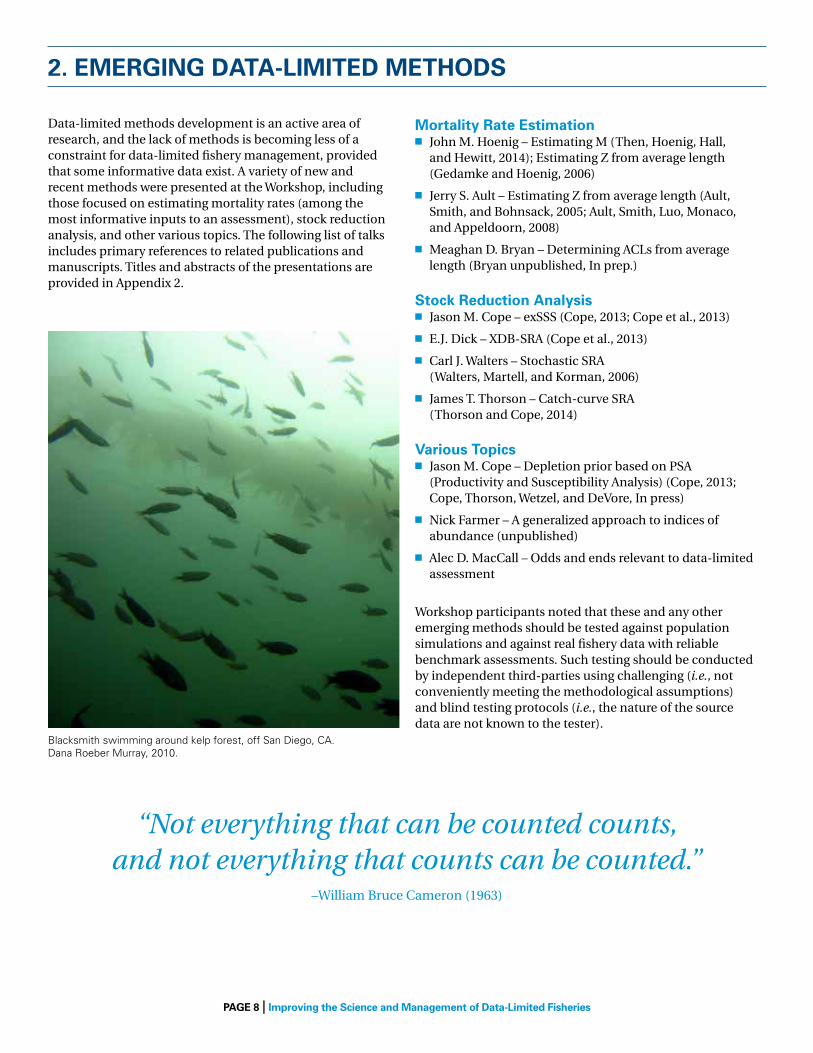
Data-limited methods development is an active area of research, and the lack of methods is becoming less of a constraint for data-limited fishery management, provided that some informative data exist. A variety of new and recent methods were presented at the Workshop, including those focused on estimating mortality rates (among the most informative inputs to an assessment), stock reduction analysis, and other various topics. The following list of talks includes primary references to related publications and manuscripts. Titles and abstracts of the presentations are provided in Appendix 2.
Mortality rate estimationn John M. Hoenig – Estimating M (Then, Hoenig, Hall,
and Hewitt, 2014); Estimating Z from average length (Gedamke and Hoenig, 2006)
n Jerry S. Ault – Estimating Z from average length (Ault, Smith, and Bohnsack, 2005; Ault, Smith, Luo, Monaco, and Appeldoorn, 2008)
n Meaghan D. Bryan – Determining ACLs from average length (Bryan unpublished, In prep.)
stock reduction Analysisn Jason M. Cope – exSSS (Cope, 2013; Cope et al., 2013)
n E.J. Dick – XDB-SRA (Cope et al., 2013)
n Carl J. Walters – Stochastic SRA (Walters, Martell, and Korman, 2006)
n James T. Thorson – Catch-curve SRA (Thorson and Cope, 2014)
Various topics n Jason M. Cope – Depletion prior based on PSA
(Productivity and Susceptibility Analysis) (Cope, 2013; Cope, Thorson, Wetzel, and DeVore, In press)
n Nick Farmer – A generalized approach to indices of abundance (unpublished)
n Alec D. MacCall – Odds and ends relevant to data-limited assessment
Workshop participants noted that these and any other emerging methods should be tested against population simulations and against real fishery data with reliable benchmark assessments. Such testing should be conducted by independent third-parties using challenging (i.e., not conveniently meeting the methodological assumptions) and blind testing protocols (i.e., the nature of the source data are not known to the tester).
2. eMerGING DAtA-LIMIteD MethoDs
Blacksmith swimming around kelp forest, off San Diego, CA. Dana Roeber Murray, 2010.
“Not everything that can be counted counts, and not everything that counts can be counted.”
–William Bruce Cameron (1963)

PAGe 9 | Improving the science and Management of Data-Limited Fisheries
3. eVALuAtIoN oF curreNt DAtA-LIMIteD MethoDs
The results of a recent management strategy evaluation (MSE) of data-limited methods were presented at the Workshop by the study’s primary author, Dr. Tom Carruthers of the University of British Columbia (Carruthers et al., 2014). MSE is a well-established technique that tests proposed management policies as applied to a simulated resource over a fixed period of time. The strength of MSE is its ability to compare the performance of alternative management policies operating under identical conditions and uncertainties, given a wide variety of possible present and future conditions. The approach can also be used to provide an evaluation of the value of various sources of information and an improved understanding of the trade-offs among competing management objectives (e.g., preventing overfishing and stock depletion versus maximizing fishing opportunity).
The data-limited MSE conducted by Carruthers et al. (2014) included six life history types (mackerel, butterfish, porgy, snapper, sole, and rockfish) with a range of natural mortality rates, stock-recruitment steepness, and recruitment variability. Each simulated life history was analyzed based on three categories of initial abundance: overfished (B < 50% BMSY), somewhat depleted (B = 50%-100% BMSY), and healthy (B = 100%-150% BMSY). Various applications of five types of data-limited methods currently in use in U.S. management, along with several alternative methods from the scientific literature, were tested for the probabilities of overfishing and long-term yield, among other performance metrics (See Appendix 3 for graphical representations of the results). These included catch-based scalars, DB-SRA, DCAC, FMSY/M (a.k.a. FRATIO), and a depletion-adjusted catch scalar (DACS).2 Over the range of initial population conditions,
2 Depletion Adjusted Catch Scalar (DACS) relies on the catch scalars recommended by the only Reliable Catch Stocks (oRCS) Technical Working Group (Berkson et al., 2011), but instead of adjusting the scalar based on the oRCS attributes, which tend to be subjective and emphasize static stock characteristics, the implementation of DACS used in the MSE study adjusts based on a relatively unbiased but imprecise input level of depletion.
Rockfish recruits above cold-water corals and anemones, Cordell Bank National Marine Sanctuary. NoAA, 2010.
PAGe 10 | Improving the science and Management of Data-Limited Fisheries
the catch-based scalars performed more poorly than all other methods tested, including those that utilize minimal additional information, such as previous catch history (e.g., DB-SRA, DCAC), or even very rough information on current status (e.g., DACS). Within the range of catch-based methods, the best performance in terms of low probabilities of overfishing and high long-term yields involved a reduction from recent average catch. Those ACLs that were set at a level above the recent average catch performed poorly when the stock’s biomass was equal to or below BMSY. Workshop participants pointed out that the simulations assumed that the reference years for the catch statistic being used for average catch would change over time (i.e., a moving average), whereas this may not represent the approach that may be used in the real world if this management approach were used for years into the future. Participants also pointed out that the simulations assumed that prescribed catch levels would be attained each year, whereas actual catch may fluctuate above or below the prescribed ACL in the real world and thus possibly affect the performance of these methods. The authors of the MSE study drew a number of specific conclusions and recommendations from the results, including the following:
n Data-moderate methods (e.g., FMSY/M and DB-SRA with informed depletion) outperformed the other methods at all biomass levels.
n The data-moderate methods tested are sensitive to biased, but not imprecise, estimates of abundance/depletion. What this means is that any dynamic feedback on current or relative abundance (e.g., from surveys, catch curve analyses, CPUE (Catch Per Unit Effort), etc.), even if imprecise, could lead to higher yields and lower probabilities of overfishing compared with more static catch scalars.
n While they have important limitations, inexpensive methods such as sampling of catch age and length compositions provide better information for data-limited approaches than ad-hoc rules, such as twice maximum historical catch and other catch scalars uninformed by current stock status.
n The Only Reliable Catch Stocks (ORCS) approach (Berkson et al., 2011), which uses a system of attributes about a stock to score a stock’s exploitation level and then scales historic catch accordingly, was too subjective to simulation test. It was observed that most of the ORCS attributes are static characteristics that will not change based on stock status, and thus do not provide dynamic feedback. It was recommended that ORCS should weight dynamic attributes, such as CPUE or landings trends, more heavily and avoid using a maximum catch statistic as a basis for OFL setting.
n DB-SRA and DCAC are inappropriate for short-lived species, particularly at low current biomass levels.
n DB-SRA40 (with an assumed depletion of 40 percent of B0), the DACS and, to a lesser extent, precautionary average catch rules (e.g., 50–75 percent mean catch) may provide an adequate short- to medium-term solution, allowing additional data collection for use of other methods (e.g., FMSY/M, DB-SRA with informed depletion).
n Rules that set ACL below average catch (e.g., 75 percent of mean catch) produced relatively low probabilities of overfishing and high long-term yield when biomass was greater than 50% of BMSY, but performed poorly if the stock was already depleted below this level.
n Rules that set ACL equal to average mean, median, or maximum historic catch (e.g., median landings prior 10 years, maximum catch scalars, third highest catch, etc.) lead to high probabilities of overfishing and low long-term yields. This problem was exaggerated where stock levels were below BMSY.
n Well-informed delay-difference models (i.e., more data-rich approaches) may perform worse than some data-limited methods (e.g., DB-SRA with informed depletion, FMSY/M with an imprecise survey) due to the assumption of temporally stationary productivity and/or fishing efficiency.
n For each of the methods tested a 25 percent buffer between the OFL and ABC led to only small reductions in yield but relatively large reductions in probabilities of overfishing.
Do Data-rich Assessments Always Provide higher Yields and Less overfishing?
There is a tendency to think of data-limited assessments as being less reliable and thus inferior to data-rich assessments. This perspective is clear from the value-laden terminology used to describe different assessment methods (e.g., data-rich, moderate, poor). At numerous points during the Workshop, participants discussed the implications of this assumption and the importance of routinely examining it. The potential role and value of MSE in this effort was recognized. Data-rich methods have become progressively more elaborate and highly parameterized and it is an open question whether these very complex models are categorically superior to simpler models used for data-limited assessment. Simulations, as well as the experience in the wider non-fishery world of modeling suggest they are not always superior, although this issue continues to be the subject of robust debate in the scientific community.
PAGe 11 | Improving the science and Management of Data-Limited Fisheries
The use of management strategy evaluation and other quantitative diagnostic tools for assessing the status of and making management recommendations for data-limited fisheries is currently quite limited within NMFS and other fishery management agencies. Lacking these analytical tools, many fisheries scientists and managers are left with a limited number of assessment models and management strategies that often do not make optimal use of the data that are available for a particular stock. In an effort to broaden the accessibility of a variety of data-limited methods and to facilitate the evaluation of their efficacy, the Workshop sponsors developed a new Data-Limited Fisheries Toolkit, an early demonstration version of which was introduced for evaluation by Workshop participants. The Toolkit has since been expanded and refined, and is now freely available for download through the CRAN-R repository at http://cran.r-project.org/web/packages/DLMtool/index.html or at www.datalimitedtoolkit.com (Carruthers, 2014).
beNeFIts AND usesFormal stock assessment processes for data-limited assessments have yet to be developed in some parts of the country (e.g., Southeast) and are in a nascent stage in others (e.g., Pacific). The use of a standardized set of methods provided by the Toolkit could greatly enhance the efficiency and throughput of such a data-limited assessment system. The Toolkit would be especially useful for conducting a special data-limited methodological review under the auspices of stock assessment review bodies such as the Southeast Data Assessment Review (SEDAR) and the Pacific Stock Assessment Review (STAR) programs. This could significantly simplify and speed the assessment and ACL-setting process for data-limited stocks, compared with more traditional assessment processes.
Workshop participants recognized the potential value of the Toolkit for fisheries scientists and managers internationally. It is estimated that 80 percent of global catch comes from data-limited fisheries (Costello et al., 2012). In many parts of the world, familiarity with emerging data-limited methods is lacking, much less the capability of local scientists and managers to apply such methods. Workshop participants identified the following potential benefits of the Toolkit:
n Powerful diagnostic tools for testing methods and the value of information.
n Improved efficiency of stock assessment throughput (requires a day or two to complete analyses that would normally take weeks).
n Free access to many data-limited methods otherwise unavailable in many cases.
n Pre-tested computer code (avoids duplicative effort writing code).
n Enhanced reliability (avoids review time wasted on bugs).
n User-friendly graphical output.
n Rapid execution and reduced computational workload for data-limited assessments.
n Open access facilitates rapid incorporation and dissemination of new methods.
n Facilitated simulation testing and direct comparison of methods.
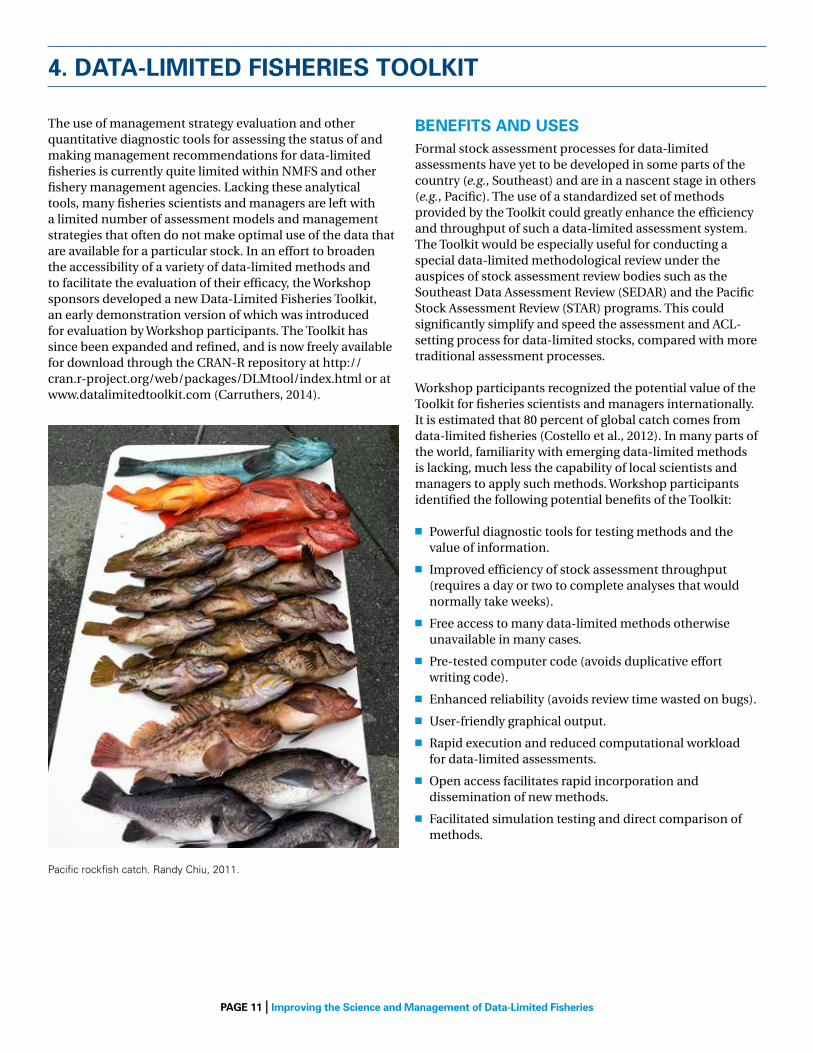
Pacific rockfish catch. Randy Chiu, 2011.
4. DAtA-LIMIteD FIsherIes tooLkIt
PAGe 12 | Improving the science and Management of Data-Limited Fisheries
FeAtures AND cAPAbILItIesThe Toolkit enables users to quickly apply multiple data-limited methods to large numbers of fish stocks and to diagnose which methods provide the most robust results for a given stock, based on the life history type of the species, the fishing fleet characteristics, observation error, and the availability of certain types of data. In addition to its utility for stock assessment scientists, the Toolkit’s open architecture, simple data input form, and graphical outputs can promote transparency, credibility, and increased buy-
in from fishery managers and stakeholders. The Toolkit can also provide useful guidance on the value of information and thus help prioritize data collection and assessment methods in the most cost-effective manner. More than 30 data-limited methods are currently included in the Toolkit, including classes of methods that can prescribe catch limits, effort controls, and spatial management controls (Table 2). Assumptions in the operating model can be fully customized, and additional methods and diagnostic tools can be added by users.
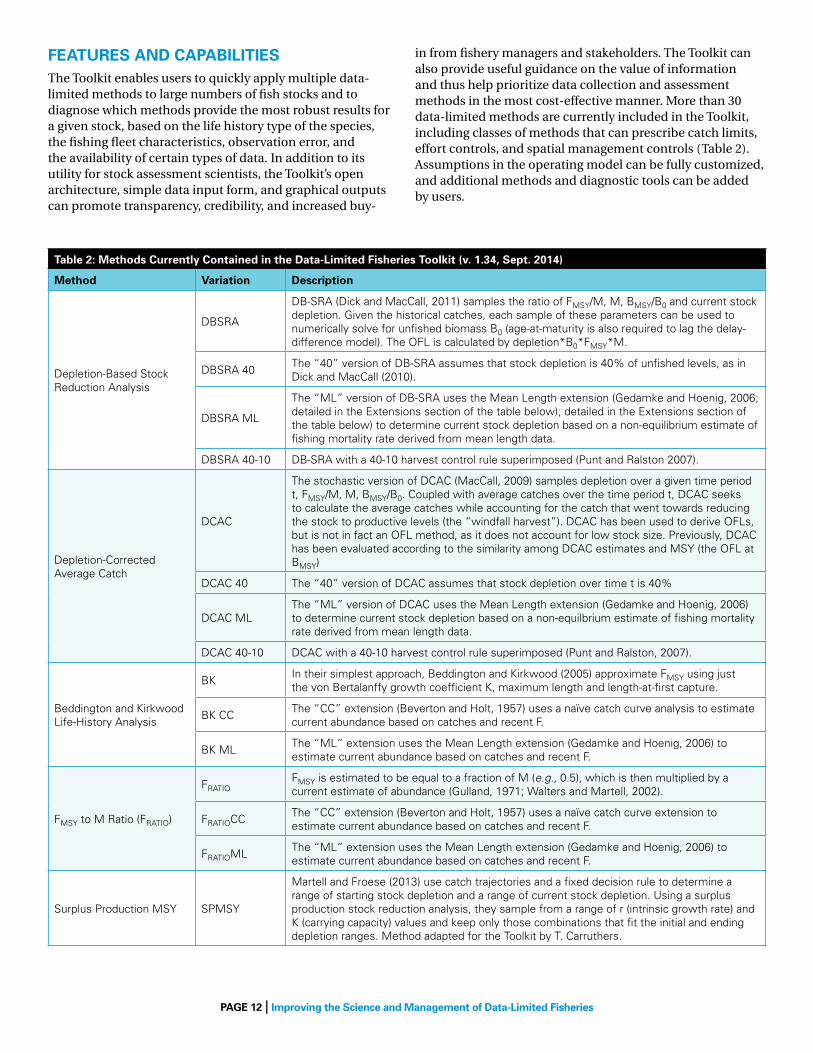
table 2: Methods currently contained in the Data-Limited Fisheries toolkit (v. 1.34, sept. 2014)
Method Variation Description
Depletion-Based Stock Reduction Analysis
DBSRA
DB-SRA (Dick and MacCall, 2011) samples the ratio of FMSY/M, M, BMSY/B0 and current stock depletion. Given the historical catches, each sample of these parameters can be used to numerically solve for unfished biomass B0 (age-at-maturity is also required to lag the delay-difference model). The oFL is calculated by depletion*B0*FMSY*M.
DBSRA 40The “40” version of DB-SRA assumes that stock depletion is 40% of unfished levels, as in Dick and MacCall (2010).
DBSRA ML
The “ML” version of DB-SRA uses the Mean Length extension (Gedamke and Hoenig, 2006; detailed in the Extensions section of the table below); detailed in the Extensions section of the table below) to determine current stock depletion based on a non-equilibrium estimate of fishing mortality rate derived from mean length data.
DBSRA 40-10 DB-SRA with a 40-10 harvest control rule superimposed (Punt and Ralston 2007).
Depletion-Corrected Average Catch
DCAC
The stochastic version of DCAC (MacCall, 2009) samples depletion over a given time period t, FMSY/M, M, BMSY/B0. Coupled with average catches over the time period t, DCAC seeks to calculate the average catches while accounting for the catch that went towards reducing the stock to productive levels (the “windfall harvest”). DCAC has been used to derive oFLs, but is not in fact an oFL method, as it does not account for low stock size. Previously, DCAC has been evaluated according to the similarity among DCAC estimates and MSY (the oFL at BMSY)
DCAC 40 The “40” version of DCAC assumes that stock depletion over time t is 40%
DCAC MLThe “ML” version of DCAC uses the Mean Length extension (Gedamke and Hoenig, 2006) to determine current stock depletion based on a non-equilbrium estimate of fishing mortality rate derived from mean length data.
DCAC 40-10 DCAC with a 40-10 harvest control rule superimposed (Punt and Ralston, 2007).
Beddington and Kirkwood Life-History Analysis
BKIn their simplest approach, Beddington and Kirkwood (2005) approximate FMSY using just the von Bertalanffy growth coefficient K, maximum length and length-at-first capture.
BK CCThe “CC” extension (Beverton and Holt, 1957) uses a naïve catch curve analysis to estimate current abundance based on catches and recent F.
BK MLThe “ML” extension uses the Mean Length extension (Gedamke and Hoenig, 2006) to estimate current abundance based on catches and recent F.
FMSY to M Ratio (FRATIo)
FRATIoFMSY is estimated to be equal to a fraction of M (e.g., 0.5), which is then multiplied by a current estimate of abundance (Gulland, 1971; Walters and Martell, 2002).
FRATIoCCThe “CC” extension (Beverton and Holt, 1957) uses a naïve catch curve extension to estimate current abundance based on catches and recent F.
FRATIoMLThe “ML” extension uses the Mean Length extension (Gedamke and Hoenig, 2006) to estimate current abundance based on catches and recent F.
Surplus Production MSY SPMSY
Martell and Froese (2013) use catch trajectories and a fixed decision rule to determine a range of starting stock depletion and a range of current stock depletion. Using a surplus production stock reduction analysis, they sample from a range of r (intrinsic growth rate) and K (carrying capacity) values and keep only those combinations that fit the initial and ending depletion ranges. Method adapted for the Toolkit by T. Carruthers.
PAGe 13 | Improving the science and Management of Data-Limited Fisheries
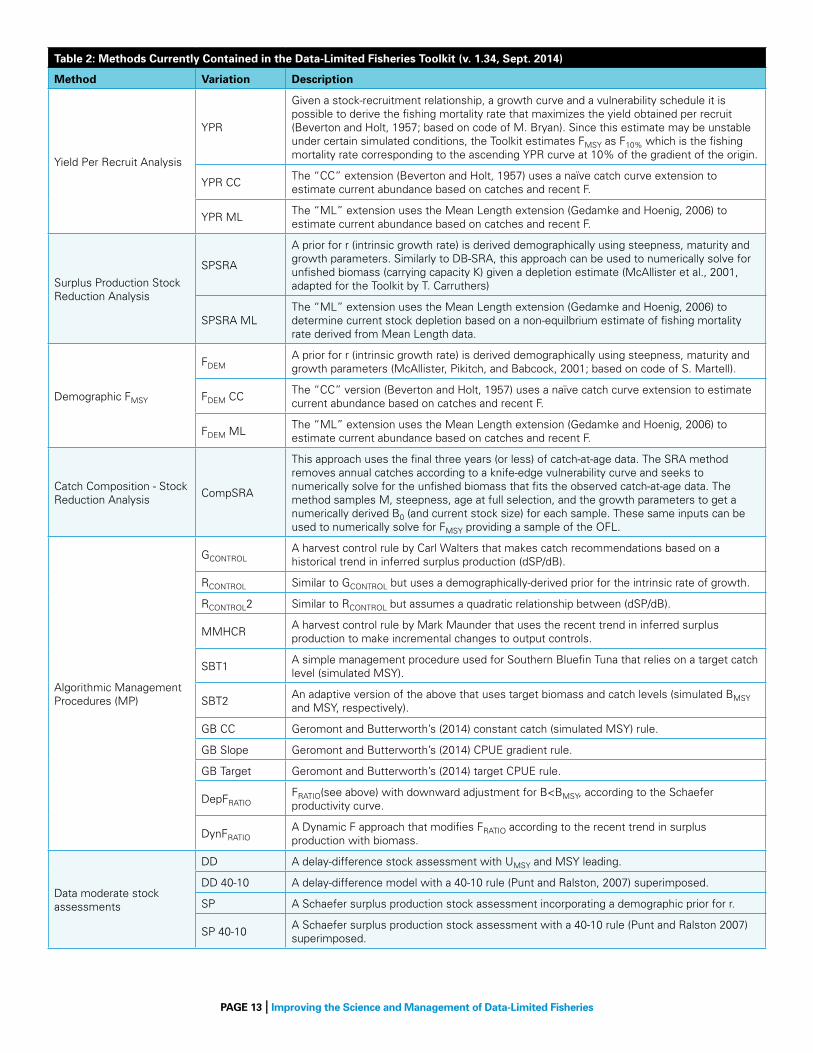
table 2: Methods currently contained in the Data-Limited Fisheries toolkit (v. 1.34, sept. 2014)
Method Variation Description
Yield Per Recruit Analysis
YPR
Given a stock-recruitment relationship, a growth curve and a vulnerability schedule it is possible to derive the fishing mortality rate that maximizes the yield obtained per recruit (Beverton and Holt, 1957; based on code of M. Bryan). Since this estimate may be unstable under certain simulated conditions, the Toolkit estimates FMSY as F10% which is the fishing mortality rate corresponding to the ascending YPR curve at 10% of the gradient of the origin.
YPR CCThe “CC” extension (Beverton and Holt, 1957) uses a naïve catch curve extension to estimate current abundance based on catches and recent F.
YPR MLThe “ML” extension uses the Mean Length extension (Gedamke and Hoenig, 2006) to estimate current abundance based on catches and recent F.
Surplus Production Stock Reduction Analysis
SPSRA
A prior for r (intrinsic growth rate) is derived demographically using steepness, maturity and growth parameters. Similarly to DB-SRA, this approach can be used to numerically solve for unfished biomass (carrying capacity K) given a depletion estimate (McAllister et al., 2001, adapted for the Toolkit by T. Carruthers)
SPSRA MLThe “ML” extension uses the Mean Length extension (Gedamke and Hoenig, 2006) to determine current stock depletion based on a non-equilbrium estimate of fishing mortality rate derived from Mean Length data.
Demographic FMSY
FDEMA prior for r (intrinsic growth rate) is derived demographically using steepness, maturity and growth parameters (McAllister, Pikitch, and Babcock, 2001; based on code of S. Martell).
FDEM CCThe “CC” version (Beverton and Holt, 1957) uses a naïve catch curve extension to estimate current abundance based on catches and recent F.
FDEM MLThe “ML” extension uses the Mean Length extension (Gedamke and Hoenig, 2006) to estimate current abundance based on catches and recent F.
Catch Composition - Stock Reduction Analysis
CompSRA
This approach uses the final three years (or less) of catch-at-age data. The SRA method removes annual catches according to a knife-edge vulnerability curve and seeks to numerically solve for the unfished biomass that fits the observed catch-at-age data. The method samples M, steepness, age at full selection, and the growth parameters to get a numerically derived B0 (and current stock size) for each sample. These same inputs can be used to numerically solve for FMSY providing a sample of the oFL.
Algorithmic Management Procedures (MP)
GCoNTRoLA harvest control rule by Carl Walters that makes catch recommendations based on a historical trend in inferred surplus production (dSP/dB).
RCoNTRoL Similar to GCoNTRoL but uses a demographically-derived prior for the intrinsic rate of growth.
RCoNTRoL2 Similar to RCoNTRoL but assumes a quadratic relationship between (dSP/dB).
MMHCRA harvest control rule by Mark Maunder that uses the recent trend in inferred surplus production to make incremental changes to output controls.
SBT1A simple management procedure used for Southern Bluefin Tuna that relies on a target catch level (simulated MSY).
SBT2An adaptive version of the above that uses target biomass and catch levels (simulated BMSY and MSY, respectively).
GB CC Geromont and Butterworth’s (2014) constant catch (simulated MSY) rule.
GB Slope Geromont and Butterworth’s (2014) CPUE gradient rule.
GB Target Geromont and Butterworth’s (2014) target CPUE rule.
DepFRATIoFRATIo(see above) with downward adjustment for B<BMSY, according to the Schaefer productivity curve.
DynFRATIoA Dynamic F approach that modifies FRATIo according to the recent trend in surplus production with biomass.
Data moderate stock assessments
DD A delay-difference stock assessment with UMSY and MSY leading.
DD 40-10 A delay-difference model with a 40-10 rule (Punt and Ralston, 2007) superimposed.
SP A Schaefer surplus production stock assessment incorporating a demographic prior for r.
SP 40-10A Schaefer surplus production stock assessment with a 40-10 rule (Punt and Ralston 2007) superimposed.

PAGe 14 | Improving the science and Management of Data-Limited Fisheries
table 2: Methods currently contained in the Data-Limited Fisheries toolkit (v. 1.34, sept. 2014)
Method Variation Description
Reference methods
FMSYRef Fishing at FMSY with perfect knowledge (oFL=FMSY*current biomass).
FMSY Ref 75 Fishing at 75% FMSY with perfect knowledge.
FMSY Ref 50 Fishing at 50% FMSY with perfect knowledge.
extensions code Description
Mean Length Estimation ML
Gedamke and Hoenig (2006) (based on code of Gary A. Nelson). This method features an R package of Gary Nelson called “fishmethods” that has a range of commonly applied fisheries modelling methods. The method estimates F for a number of discrete time periods based on a time series of mean-length observations. A number of breakpoints are specified (e.g. 3) to determine the number of F’s estimated (e.g. 4). The approach then examines many combinations of positions for these breakpoints over the time period of the mean length observations. The longer the time-period and the more breakpoints, the larger the number of possible F arrangements. An AIC is calculated for each F arrangement and the “best” arrangement selected. The most current estimate of F can be used to determine stock abundance (recent catch/harvest rate) for methods that require this input (e.g. FRATIo, YPR, BK) or the method be used to return stock depletion for methods that require this input (e.g. DBSRA, DCAC, SPSRA). There are, however, several practical problems with the approach in the scope of the Toolkit. The foremost is that it can be very slow. For example, a 20-year time period with 2 breakpoints (three estimated Fs) can take 20 minutes to produce a single oFL (DBSRA typically completes 1,000-5,000 samples per minute). The second problem is that the r optimization routines are suspect for estimation problems of more than five parameters, and in a simulation framework can be highly unreliable. In this application only two Fs are estimated (one breakpoint), and methods using this extension are not available by default but can be requested explicitly by the user.
Catch Curve Estimation CC
It may be assumed that the age-composition of catches contains information about total mortality rate Z (Beverton and Holt, 1957). In a naïve catch curve analysis, frequency of observations increases with age (older individuals are increasingly vulnerable to fishing) after which the decline in the frequency of observations with age can be interpreted as total mortality Z. Clearly, this is reliant on equilibrium assumptions and will not perform well if vulnerability declines after the age of maximum vulnerability (“dome shaped selectivity”) or if there have been marked temporal changes in recruitment, the vulnerability ogive or fishing mortality rate. Several updates to the naïve catch-curve analysis have been proposed to reduce bias or incorporate the ascending limb of the vulnerability curve. However, simulation testing generally favors the most simple implementation due to the simulation of problematic catch composition samples.
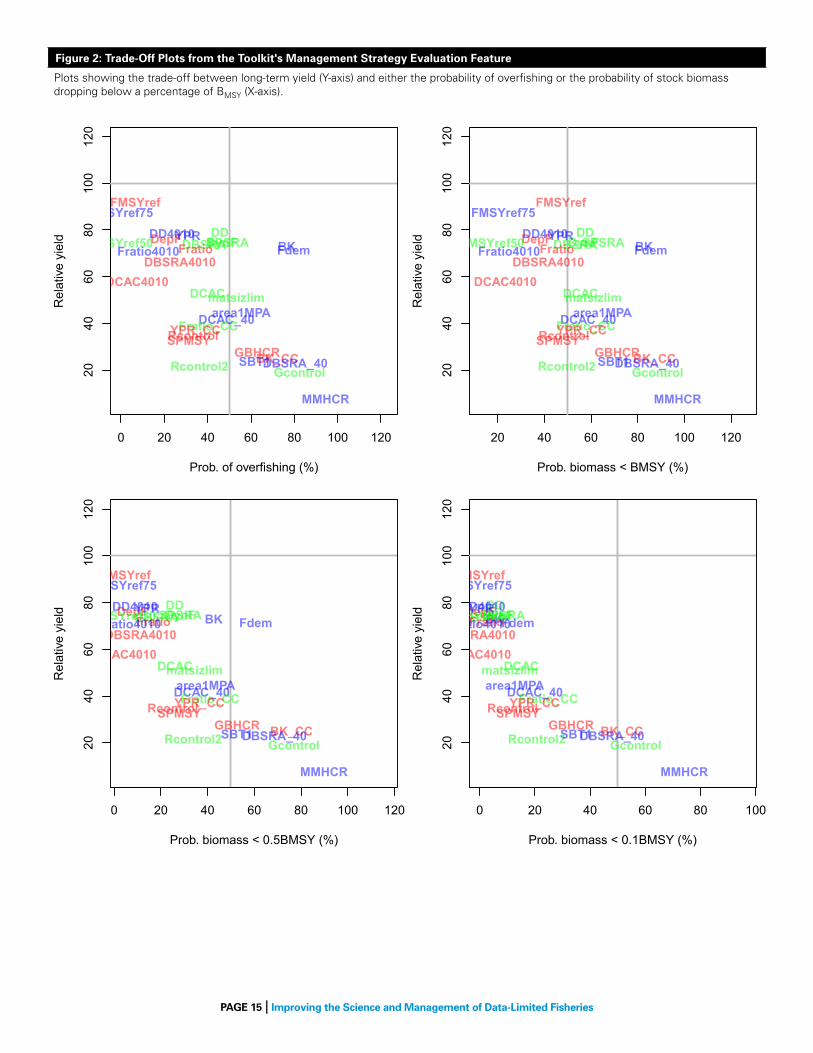
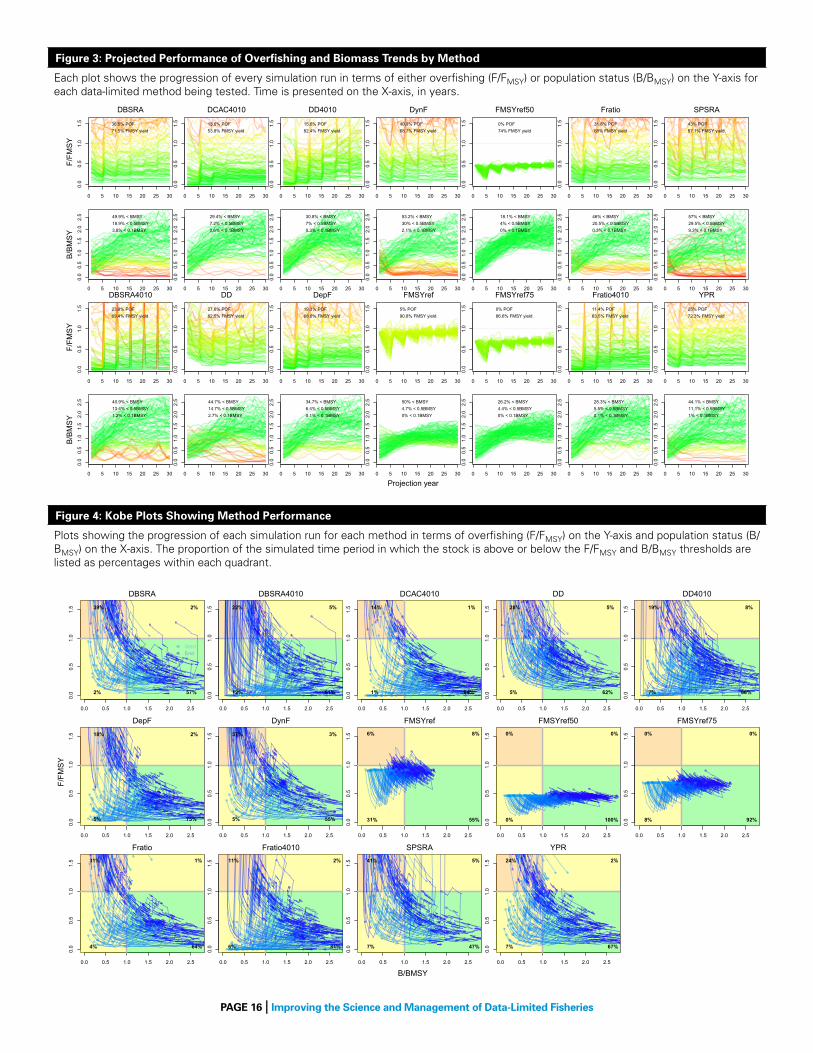
The Toolkit contains a closed-loop MSE that is capable of testing the performance of any method currently included in the Toolkit against a wide range of fish species under different circumstances over long time periods. Performance of different methods can be compared side-by-side using a number of key performance metrics, including biomass trends, overfishing rates, and long-term yield (Figures 2, 3, and 4). This capability also permits sensitivity testing to identify the impact of certain data inputs on the accuracy and precision of method outputs (Figure 5). This feature is useful for determining the value of a particular type of data, so it can be used to prioritize data collection efforts.
Diver counting coral reef fishes using the towboard method. NoAA photo by Jason Helyer.
PAGe 15 | Improving the science and Management of Data-Limited Fisheries
Figure 2: trade-off Plots from the toolkit's Management strategy evaluation Feature
Plots showing the trade-off between long-term yield (Y-axis) and either the probability of overfishing or the probability of stock biomass dropping below a percentage of BMSY (X-axis).
0 20 40 60 80 100 120
2040
6080
100
120
Prob. of overfishing (%)
Rel
ativ
e yi
eld
BK
BK_CC
DBSRA
DBSRA_40
DBSRA4010
DCAC
DCAC_40
DCAC4010
DDDD4010DepF DynF Fdem
FMSYref
FMSYref50
FMSYref75
Fratio
Fratio_CC
Fratio4010
GBHCRGcontrol
MMHCR
Rcontrol
Rcontrol2 SBT1SPMSY
SPSRAYPR
YPR_CC
matsizlimarea1MPA
20 40 60 80 100 12020
4060
8010
012
0Prob. biomass < BMSY (%)
Rel
ativ
e yi
eld
BK
BK_CC
DBSRA
DBSRA_40
DBSRA4010
DCAC
DCAC_40
DCAC4010
DDDD4010DepF DynF Fdem
FMSYref
FMSYref50
FMSYref75
Fratio
Fratio_CC
Fratio4010
GBHCRGcontrol
MMHCR
Rcontrol
Rcontrol2 SBT1SPMSY
SPSRAYPR
YPR_CC
matsizlimarea1MPA
0 20 40 60 80 100 120
2040
6080
100
120
Prob. biomass < 0.5BMSY (%)
Rel
ativ
e yi
eld
BK
BK_CC
DBSRA
DBSRA_40
DBSRA4010
DCAC
DCAC_40
DCAC4010
DDDD4010DepF DynF Fdem
FMSYref
FMSYref50
FMSYref75
Fratio
Fratio_CC
Fratio4010
GBHCRGcontrol
MMHCR
Rcontrol
Rcontrol2SBT1SPMSY
SPSRAYPR
YPR_CC
matsizlimarea1MPA
0 20 40 60 80 100
2040
6080
100
120
Prob. biomass < 0.1BMSY (%)
Rel
ativ
e yi
eld
BK
BK_CC
DBSRA
DBSRA_40
DBSRA4010
DCAC
DCAC_40
DCAC4010
DDDD4010DepFDynFFdem
FMSYref
FMSYref50
FMSYref75
Fratio
Fratio_CC
Fratio4010
GBHCRGcontrol
MMHCR
Rcontrol
Rcontrol2SBT1SPMSY
SPSRAYPR
YPR_CC
matsizlimarea1MPA
PAGe 16 | Improving the science and Management of Data-Limited Fisheries
0 5 10 15 20 25 30
0.0
0.5
1.0
1.5
Index
MS
Eob
j@F_
FMS
Y[1
, mm
, ]
DBSRA
36.5% POF71.5% FMSY yield
F/FM
SY
0 5 10 15 20 25 30
0.0
0.5
1.0
1.5
2.0
2.5
Index
MS
Eob
j@B
_BM
SY
[1, m
m, ] 49.9% < BMSY
18.9% < 0.5BMSY3.8% < 0.1BMSY
B/B
MS
Y
0 5 10 15 20 25 30
0.0
0.5
1.0
1.5
Index
MS
Eob
j@F_
FMS
Y[1
, mm
, ]
DBSRA4010
23.8% POF69.4% FMSY yield
F/FM
SY
0 5 10 15 20 25 30
0.0
0.5
1.0
1.5
2.0
2.5
Index
MS
Eob
j@B
_BM
SY
[1, m
m, ] 40.9% < BMSY
13.4% < 0.5BMSY1.2% < 0.1BMSY
B/B
MS
Y
0 5 10 15 20 25 30
0.0
0.5
1.0
1.5
Index
MS
Eob
j@F_
FMS
Y[1
, mm
, ]
DCAC4010
13.6% POF53.8% FMSY yield
0 5 10 15 20 25 30
0.0
0.5
1.0
1.5
2.0
2.5
Index
MS
Eob
j@B
_BM
SY
[1, m
m, ] 29.4% < BMSY
7.2% < 0.5BMSY0.6% < 0.1BMSY
0 5 10 15 20 25 30
0.0
0.5
1.0
1.5
Index
MS
Eob
j@F_
FMS
Y[1
, mm
, ]
DD
27.6% POF82.5% FMSY yield
0 5 10 15 20 25 30
0.0
0.5
1.0
1.5
2.0
2.5
Index
MS
Eob
j@B
_BM
SY
[1, m
m, ] 44.7% < BMSY
14.7% < 0.5BMSY2.7% < 0.1BMSY
0 5 10 15 20 25 30
0.0
0.5
1.0
1.5
Index
MS
Eob
j@F_
FMS
Y[1
, mm
, ]
DD4010
15.6% POF82.4% FMSY yield
0 5 10 15 20 25 30
0.0
0.5
1.0
1.5
2.0
2.5
Index
MS
Eob
j@B
_BM
SY
[1, m
m, ] 30.8% < BMSY
7% < 0.5BMSY0.3% < 0.1BMSY
0 5 10 15 20 25 30
0.0
0.5
1.0
1.5
Index
MS
Eob
j@F_
FMS
Y[1
, mm
, ]
DepF
19.3% POF68.6% FMSY yield
0 5 10 15 20 25 30
0.0
0.5
1.0
1.5
2.0
2.5
Index
MS
Eob
j@B
_BM
SY
[1, m
m, ] 34.7% < BMSY
6.4% < 0.5BMSY0.1% < 0.1BMSY
0 5 10 15 20 25 30
0.0
0.5
1.0
1.5
Index
MS
Eob
j@F_
FMS
Y[1
, mm
, ]
DynF
40.9% POF68.7% FMSY yield
0 5 10 15 20 25 30
0.0
0.5
1.0
1.5
2.0
2.5
Index
MS
Eob
j@B
_BM
SY
[1, m
m, ] 53.2% < BMSY
30% < 0.5BMSY2.1% < 0.1BMSY
0 5 10 15 20 25 30
0.0
0.5
1.0
1.5
Index
MS
Eob
j@F_
FMS
Y[1
, mm
, ]
FMSYref
5% POF90.8% FMSY yield
0 5 10 15 20 25 30
0.0
0.5
1.0
1.5
2.0
2.5
Index
MS
Eob
j@B
_BM
SY
[1, m
m, ] 50% < BMSY
4.7% < 0.5BMSY0% < 0.1BMSY
0 5 10 15 20 25 30
0.0
0.5
1.0
1.5
Index
MS
Eob
j@F_
FMS
Y[1
, mm
, ]
FMSYref50
0% POF74% FMSY yield
0 5 10 15 20 25 30
0.0
0.5
1.0
1.5
2.0
2.5
Index
MS
Eob
j@B
_BM
SY
[1, m
m, ] 18.1% < BMSY
4% < 0.5BMSY0% < 0.1BMSY
0 5 10 15 20 25 30
0.0
0.5
1.0
1.5
Index
MS
Eob
j@F_
FMS
Y[1
, mm
, ]
FMSYref75
0% POF86.6% FMSY yield
0 5 10 15 20 25 30
0.0
0.5
1.0
1.5
2.0
2.5
Index
MS
Eob
j@B
_BM
SY
[1, m
m, ] 26.2% < BMSY
4.4% < 0.5BMSY0% < 0.1BMSY
0 5 10 15 20 25 30
0.0
0.5
1.0
1.5
Index
MS
Eob
j@F_
FMS
Y[1
, mm
, ]
Fratio
31.8% POF68% FMSY yield
0 5 10 15 20 25 30
0.0
0.5
1.0
1.5
2.0
2.5
Index
MS
Eob
j@B
_BM
SY
[1, m
m, ] 46% < BMSY
20.5% < 0.5BMSY0.3% < 0.1BMSY
0 5 10 15 20 25 30
0.0
0.5
1.0
1.5
Index
MS
Eob
j@F_
FMS
Y[1
, mm
, ]
Fratio4010
11.4% POF63.5% FMSY yield
0 5 10 15 20 25 30
0.0
0.5
1.0
1.5
2.0
2.5
Index
MS
Eob
j@B
_BM
SY
[1, m
m, ] 28.3% < BMSY
5.5% < 0.5BMSY0.1% < 0.1BMSY
0 5 10 15 20 25 30
0.0
0.5
1.0
1.5
Index
MS
Eob
j@F_
FMS
Y[1
, mm
, ]
SPSRA
43% POF67.1% FMSY yield
0 5 10 15 20 25 30
0.0
0.5
1.0
1.5
2.0
2.5
Index
MS
Eob
j@B
_BM
SY
[1, m
m, ] 57% < BMSY
29.5% < 0.5BMSY9.3% < 0.1BMSY
0 5 10 15 20 25 30
0.0
0.5
1.0
1.5
Index
MS
Eob
j@F_
FMS
Y[1
, mm
, ]
YPR
25% POF72.3% FMSY yield
0 5 10 15 20 25 30
0.0
0.5
1.0
1.5
2.0
2.5
Index
MS
Eob
j@B
_BM
SY
[1, m
m, ] 44.1% < BMSY
11.1% < 0.5BMSY1% < 0.1BMSY
Projection year
Figure 3: Projected Performance of overfishing and biomass trends by Method
Each plot shows the progression of every simulation run in terms of either overfishing (F/FMSY) or population status (B/BMSY) on the Y-axis for each data-limited method being tested. Time is presented on the X-axis, in years.
0.0 0.5 1.0 1.5 2.0 2.5
0.0
0.5
1.0
1.5
c(MSEobj@B_BMSY[1, mm, 1], MSEobj@B_BMSY[1, mm, 2])c(M
SE
obj@
F_FM
SY
[1, m
m, 1
], M
SE
obj@
F_FM
SY
[1, m
m, 2
])
StartEnd
39% 2%
2% 57%
DBSRA
0.0 0.5 1.0 1.5 2.0 2.5
0.0
0.5
1.0
1.5
c(MSEobj@B_BMSY[1, mm, 1], MSEobj@B_BMSY[1, mm, 2])c(M
SE
obj@
F_FM
SY
[1, m
m, 1
], M
SE
obj@
F_FM
SY
[1, m
m, 2
])
22% 5%
12% 61%
DBSRA4010
0.0 0.5 1.0 1.5 2.0 2.5
0.0
0.5
1.0
1.5
c(MSEobj@B_BMSY[1, mm, 1], MSEobj@B_BMSY[1, mm, 2])c(M
SE
obj@
F_FM
SY
[1, m
m, 1
], M
SE
obj@
F_FM
SY
[1, m
m, 2
])
14% 1%
1% 84%
DCAC4010
0.0 0.5 1.0 1.5 2.0 2.5
0.0
0.5
1.0
1.5
c(MSEobj@B_BMSY[1, mm, 1], MSEobj@B_BMSY[1, mm, 2])c(M
SE
obj@
F_FM
SY
[1, m
m, 1
], M
SE
obj@
F_FM
SY
[1, m
m, 2
])
28% 5%
5% 62%
DD
0.0 0.5 1.0 1.5 2.0 2.5
0.0
0.5
1.0
1.5
c(MSEobj@B_BMSY[1, mm, 1], MSEobj@B_BMSY[1, mm, 2])c(M
SE
obj@
F_FM
SY
[1, m
m, 1
], M
SE
obj@
F_FM
SY
[1, m
m, 2
])19% 8%
7% 66%
DD4010
0.0 0.5 1.0 1.5 2.0 2.5
0.0
0.5
1.0
1.5
c(MSEobj@B_BMSY[1, mm, 1], MSEobj@B_BMSY[1, mm, 2])c(M
SE
obj@
F_FM
SY
[1, m
m, 1
], M
SE
obj@
F_FM
SY
[1, m
m, 2
])
18% 2%
5% 75%
DepF
0.0 0.5 1.0 1.5 2.0 2.5
0.0
0.5
1.0
1.5
c(MSEobj@B_BMSY[1, mm, 1], MSEobj@B_BMSY[1, mm, 2])c(M
SE
obj@
F_FM
SY
[1, m
m, 1
], M
SE
obj@
F_FM
SY
[1, m
m, 2
])
37% 3%
5% 55%
DynF
0.0 0.5 1.0 1.5 2.0 2.5
0.0
0.5
1.0
1.5
c(MSEobj@B_BMSY[1, mm, 1], MSEobj@B_BMSY[1, mm, 2])c(M
SE
obj@
F_FM
SY
[1, m
m, 1
], M
SE
obj@
F_FM
SY
[1, m
m, 2
])
6% 8%
31% 55%
FMSYref
0.0 0.5 1.0 1.5 2.0 2.5
0.0
0.5
1.0
1.5
c(MSEobj@B_BMSY[1, mm, 1], MSEobj@B_BMSY[1, mm, 2])c(M
SE
obj@
F_FM
SY
[1, m
m, 1
], M
SE
obj@
F_FM
SY
[1, m
m, 2
])
0% 0%
0% 100%
FMSYref50
0.0 0.5 1.0 1.5 2.0 2.5
0.0
0.5
1.0
1.5
c(MSEobj@B_BMSY[1, mm, 1], MSEobj@B_BMSY[1, mm, 2])c(M
SE
obj@
F_FM
SY
[1, m
m, 1
], M
SE
obj@
F_FM
SY
[1, m
m, 2
])
0% 0%
8% 92%
FMSYref75
0.0 0.5 1.0 1.5 2.0 2.5
0.0
0.5
1.0
1.5
c(MSEobj@B_BMSY[1, mm, 1], MSEobj@B_BMSY[1, mm, 2])c(M
SE
obj@
F_FM
SY
[1, m
m, 1
], M
SE
obj@
F_FM
SY
[1, m
m, 2
])
31% 1%
4% 64%
Fratio
0.0 0.5 1.0 1.5 2.0 2.5
0.0
0.5
1.0
1.5
c(MSEobj@B_BMSY[1, mm, 1], MSEobj@B_BMSY[1, mm, 2])c(M
SE
obj@
F_FM
SY
[1, m
m, 1
], M
SE
obj@
F_FM
SY
[1, m
m, 2
])
11% 2%
6% 81%
Fratio4010
0.0 0.5 1.0 1.5 2.0 2.5
0.0
0.5
1.0
1.5
c(MSEobj@B_BMSY[1, mm, 1], MSEobj@B_BMSY[1, mm, 2])c(M
SE
obj@
F_FM
SY
[1, m
m, 1
], M
SE
obj@
F_FM
SY
[1, m
m, 2
])
41% 5%
7% 47%
SPSRA
0.0 0.5 1.0 1.5 2.0 2.5
0.0
0.5
1.0
1.5
c(MSEobj@B_BMSY[1, mm, 1], MSEobj@B_BMSY[1, mm, 2])c(M
SE
obj@
F_FM
SY
[1, m
m, 1
], M
SE
obj@
F_FM
SY
[1, m
m, 2
])
24% 2%
7% 67%
YPR
B/BMSY
F/FM
SY
Figure 4: kobe Plots showing Method Performance
Plots showing the progression of each simulation run for each method in terms of overfishing (F/FMSY) on the Y-axis and population status (B/BMSY) on the X-axis. The proportion of the simulated time period in which the stock is above or below the F/FMSY and B/BMSY thresholds are listed as percentages within each quadrant.

PAGe 17 | Improving the science and Management of Data-Limited Fisheries
●●
●
●
●
●
●
●
●●
●
●
●
●
●
●
●
●
●
●
● ●
●
●
●
●
●
● ●
●
●
●
●
●●
●
●
●●
●
●
●
●
●
●
●
●
● ●
●
●
●
●
●
●
●
●
●
●
●
●●
●
●
● ●
●
●
● ●
●
●
●
●
●
●
●
●
●●
●
●
●●
●
●
●
●
●
●
●
●
●
●
●
●●
●
●
●
0.5 1.0 1.5 2.0
2040
6080
100
FMSY_Mbias
Yiel
d (%
rela
tive
to F
MS
Y)
●●
●
●
●
●
●
●
●●
●
●
●
●
●
●
●
●
●
●
●●
●
●
●
●
●
● ●
●
●
●
●
●●
●
●
●●
●
●
●
●
●
●
●
●
● ●
●
●
●
●
●
●
●
●
●
●
●
●●
●
●
● ●
●
●
●●
●
●
●
●
●
●
●
●
●●
●
●
●●
●
●
●
●
●
●
●
●
●
●
●
●●
●
●
●
−0.4 −0.2 0.0 0.2 0.4
2040
6080
100
Mgrad
●●
●
●
●
●
●
●
●●
●
●
●
●
●
●
●
●
●
●
●●
●
●
●
●
●
●●
●
●
●
●
●●
●
●
●●
●
●
●
●
●
●
●
●
●●
●
●
●
●
●
●
●
●
●
●
●
●●
●
●
●●
●
●
●●
●
●
●
●
●
●
●
●
●●
●
●
●●
●
●
●
●
●
●
●
●
●
●
●
●●
●
●
●
0.5 1.0 1.5 2.0 2.5
2040
6080
100
Abias
●●
●
●
●
●
●
●
●●
●
●
●
●
●
●
●
●
●
●
●●
●
●
●
●
●
●●
●
●
●
●
●●
●
●
●●
●
●
●
●
●
●
●
●
●●
●
●
●
●
●
●
●
●
●
●
●
●●
●
●
● ●
●
●
●●
●
●
●
●
●
●
●
●
●●
●
●
●●
●
●
●
●
●
●
●
●
●
●
●
●●
●
●
●
0.5 1.0 1.5 2.0 2.5
2040
6080
100
Dbias
●●
●
●
●
●
●
●
●●
●
●
●
●
●
●
●
●
●
●
●●
●
●
●
●
●
●●
●
●
●
●
●●
●
●
●●
●
●
●
●
●
●
●
●
● ●
●
●
●
●
●
●
●
●
●
●
●
●●
●
●
● ●
●
●
●●
●
●
●
●
●
●
●
●
●●
●
●
●●
●
●
●
●
●
●
●
●
●
●
●
●●
●
●
●
0.85 0.95 1.05 1.15
2040
6080
100
Kbias
●●
●
●
●
●
●
●
●●
●
●
●
●
●
●
●
●
●
●
●●
●
●
●
●
●
● ●
●
●
●
●
●●
●
●
●●
●
●
●
●
●
●
●
●
● ●
●
●
●
●
●
●
●
●
●
●
●
●●
●
●
●●
●
●●
●
●
●
●
●
●
●
●
●●
●
●
●●
●
●
●
●
●
●
●
●
●
●
●●
●
●
●
0.7 0.9 1.1 1.3
2040
6080
100
BMSY_B0bias
●
●
●●
●● ●
●
● ●● ●●●
●●
●●●●
●●
●●
●
●●
●
●● ●
●
● ● ●●
●●
●●● ● ●●
●
● ●
●
●
●●
●
●
●
● ●●● ●
●●
●●
●
●●●
●●● ●●
● ●
●
●●
●
●
●
●
●
● ● ●●●●
●
●● ●
●
●●●● ●●●
0.5 1.0 1.5 2.0 2.5
020
4060
8010
0
Abias
Pro
b. O
verfi
shin
g(%
)
●
●
● ●
●● ●
●
● ● ●● ● ●
●●
● ●● ●
● ●
● ●
●
● ●
●
● ●●
●
●●● ●
●●
● ●●● ●●
●
●●
●
●
●●
●
●
●
● ●● ●●
● ●
●●
●
● ●●
●● ●● ●
●●
●
● ●
●
●
●
●
●
● ●● ●● ●
●
●● ●
●
● ●● ●● ●●
0.5 1.0 1.5 2.0 2.5
020
4060
8010
0
FMSY_Mbias
●
●
● ●
●●●
●
●● ● ● ●●
●●
● ● ●●
●●
●●
●
●●
●
● ●●
●
●●● ●
●●
●● ● ●● ●
●
● ●
●
●
●●
●
●
●
●● ●● ●
● ●
●●
●
● ●●
● ●●●●
●●
●
●●
●
●
●
●
●
●●●● ● ●
●
● ●●
●
●●● ● ●●●
0.5 1.0 1.5 2.0
020
4060
8010
0
Mbias
●
●
● ●
●● ●
●
●●●● ●●
●●
●● ●●
●●
●●
●
●●
●
●●●
●
● ●●●
● ●
●●● ●● ●
●
●●
●
●
● ●
●
●
●
●● ● ●●
●●
●●
●
● ●●
●●● ●●
●●
●
● ●
●
●
●
●
●
● ●● ●● ●
●
● ●●
●
●● ● ●● ●●
−0.4 −0.2 0.0 0.2 0.4
020
4060
8010
0
Mgrad
●
●
●●
●● ●
●
●● ● ●●●
●●
●● ●●
●●
●●
●
●●
●
●● ●
●
● ●●●
● ●
●●● ●● ●
●
● ●
●
●
● ●
●
●
●
● ● ●●●
●●
●●
●
● ●●
●● ● ● ●
● ●
●
● ●
●
●
●
●
●
●● ● ●● ●
●
●● ●
●
●●● ● ●●●
0.10 0.14 0.18 0.22
020
4060
8010
0
CALsd
●
●
●●
●● ●
●
● ● ●● ●●
●●
● ●● ●
● ●
●●
●
● ●
●
●● ●
●
● ●●●
●●
●● ●● ● ●
●
● ●
●
●
● ●
●
●
●
● ●●● ●
● ●
●●
●
●●●
● ●●● ●
● ●
●
● ●
●
●
●
●
●
● ● ●●●●
●
● ●●
●
● ● ● ●●● ●
0.17 0.18 0.19 0.20 0.21
020
4060
8010
0
K
MSE correlation evaluation for Stock:Snapper Fleet:Generic_FlatE Observation model:Imprecise_Biased: Fratio
Figure 5: sensitivity Analysis of Data Inputs from Mse
The plots show the correlation between model inputs for a given data-limited method to performance in terms of yield and the probability of overfishing.
Figure 6: Data Input File for the toolkit
A simple comma-separated values file (.csv) enables Toolkit users to input fishery data in a common format that can easily be shared among fisheries scientists.
A B C D E F G H I
1 Name China rockfish
2 Year 1916 1917 1918 1919 1920 1921 1922 1923
3 Catch 6.5 10.1 11.9 8.2 8.4 6.9 6 6.5
4 Abundance index NA NA NA NA NA NA NA NA
5 Duration t 25
6 Average catch over time t 27.3
7 Depletion over time t 1.470930233
8 M 0.06
9 FMSY/M 0.97
10 BMSY/B0 0.4
11 MSY NA
12 BMSY NA
13 Age at 50% maturity 5
14 Length at first capture NA
15 Length at full selection NA
16 CAA NA
17 Current stock depletion NA
18 Current stock abundance NA
19 Von Bertalanffy K parameter NA
20 Von Bertalanffy Linf parameter NA
21 Von Bertalanffy t0 parameter NA
22 Length-weight parameter a NA
23 Length-weight parameter b NA
24 Steepness NA
25 Maximum age NA ......China_Rockfish
PAGe 18 | Improving the science and Management of Data-Limited Fisheries
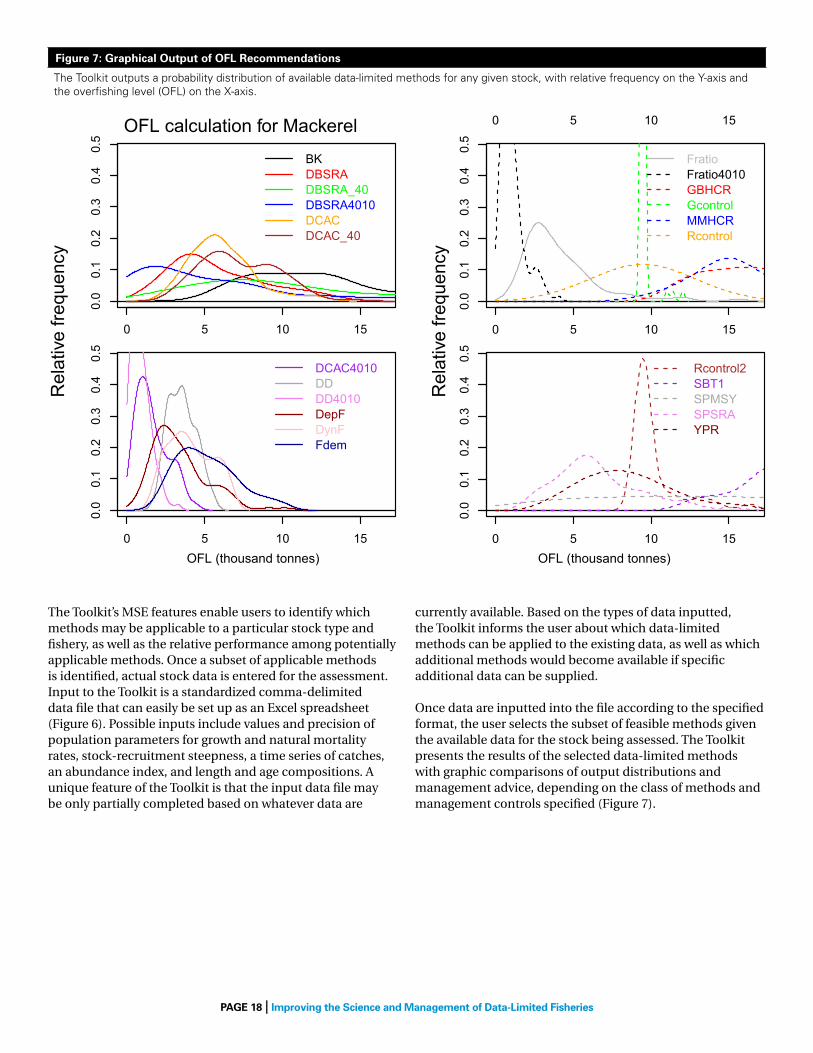
Figure 7: Graphical output of oFL recommendations
The Toolkit outputs a probability distribution of available data-limited methods for any given stock, with relative frequency on the Y-axis and the overfishing level (oFL) on the X-axis.
The Toolkit’s MSE features enable users to identify which methods may be applicable to a particular stock type and fishery, as well as the relative performance among potentially applicable methods. Once a subset of applicable methods is identified, actual stock data is entered for the assessment. Input to the Toolkit is a standardized comma-delimited data file that can easily be set up as an Excel spreadsheet (Figure 6). Possible inputs include values and precision of population parameters for growth and natural mortality rates, stock-recruitment steepness, a time series of catches, an abundance index, and length and age compositions. A unique feature of the Toolkit is that the input data file may be only partially completed based on whatever data are
currently available. Based on the types of data inputted, the Toolkit informs the user about which data-limited methods can be applied to the existing data, as well as which additional methods would become available if specific additional data can be supplied.
Once data are inputted into the file according to the specified format, the user selects the subset of feasible methods given the available data for the stock being assessed. The Toolkit presents the results of the selected data-limited methods with graphic comparisons of output distributions and management advice, depending on the class of methods and management controls specified (Figure 7).
0 5 10 15
0.0
0.1
0.2
0.3
0.4
0.5
BKDBSRADBSRA_40DBSRA4010DCACDCAC_40
0 5 10 15
0.0
0.1
0.2
0.3
0.4
0.5
DCAC4010DDDD4010DepFDynFFdem
0 5 10 15
0.0
0.1
0.2
0.3
0.4
0.5
FratioFratio4010GBHCRGcontrolMMHCRRcontrol
0 5 10 15
0.0
0.1
0.2
0.3
0.4
0.5
Rcontrol2SBT1SPMSYSPSRAYPR
OFL (thousand tonnes)
Rel
ativ
e fre
quen
cy
OFL calculation for Mackerel
0 5 10 150.
00.
10.
20.
30.
40.
5
BKDBSRADBSRA_40DBSRA4010DCACDCAC_40
0 5 10 15
0.0
0.1
0.2
0.3
0.4
0.5
DCAC4010DDDD4010DepFDynFFdem
0 5 10 15
0.0
0.1
0.2
0.3
0.4
0.5
FratioFratio4010GBHCRGcontrolMMHCRRcontrol
0 5 10 15
0.0
0.1
0.2
0.3
0.4
0.5
Rcontrol2SBT1SPMSYSPSRAYPR
OFL (thousand tonnes)
Rel
ativ
e fre
quen
cy
OFL calculation for Mackerel
0 5 10 15
0.0
0.1
0.2
0.3
0.4
0.5
BKDBSRADBSRA_40DBSRA4010DCACDCAC_40
0 5 10 15
0.0
0.1
0.2
0.3
0.4
0.5
DCAC4010DDDD4010DepFDynFFdem
0 5 10 15
0.0
0.1
0.2
0.3
0.4
0.5
FratioFratio4010GBHCRGcontrolMMHCRRcontrol
0 5 10 15
0.0
0.1
0.2
0.3
0.4
0.5
Rcontrol2SBT1SPMSYSPSRAYPR
OFL (thousand tonnes)
Rel
ativ
e fre
quen
cy
OFL calculation for Mackerel0 5 10 15
0.0
0.1
0.2
0.3
0.4
0.5
BKDBSRADBSRA_40DBSRA4010DCACDCAC_40
0 5 10 15
0.0
0.1
0.2
0.3
0.4
0.5
DCAC4010DDDD4010DepFDynFFdem
0 5 10 15
0.0
0.1
0.2
0.3
0.4
0.5
FratioFratio4010GBHCRGcontrolMMHCRRcontrol
0 5 10 15
0.0
0.1
0.2
0.3
0.4
0.5
Rcontrol2SBT1SPMSYSPSRAYPR
OFL (thousand tonnes)
Rel
ativ
e fre
quen
cy
OFL calculation for Mackerel
0 5 10 15
0.0
0.1
0.2
0.3
0.4
0.5
BKDBSRADBSRA_40DBSRA4010DCACDCAC_40
0 5 10 15
0.0
0.1
0.2
0.3
0.4
0.5
DCAC4010DDDD4010DepFDynFFdem
0 5 10 15
0.0
0.1
0.2
0.3
0.4
0.5
FratioFratio4010GBHCRGcontrolMMHCRRcontrol
0 5 10 15
0.0
0.1
0.2
0.3
0.4
0.5
Rcontrol2SBT1SPMSYSPSRAYPR
OFL (thousand tonnes)
Rel
ativ
e fre
quen
cy
OFL calculation for Mackerel

PAGe 19 | Improving the science and Management of Data-Limited Fisheries
how to use the DLM toolkit
1. Identify Management Goals (e.g., preventing overfishing, maximizing yield)
2. Identify Management controls (e.g., catch limits, input/effort controls, temporal/spatial management, and minimum mesh size)
3. run Management strategy evaluation (Mse) n Specify operating model (stock, fleet, observation error)
n Run rapid management strategy evaluation (MSE)
n Evaluate MSE results in light of management goals
n Eliminate poor-performing methods; rank applicable methods
n Run targeted, intensive MSE of applicable methods
n Conduct diagnostic testing and sensitivity analysis
4. Apply best Available Data-Limited Methods to Actual stock n Enter data into the Toolkit
n Determine available methods (“CAN” function)
n Apply best available methods based on performance in MSE
n Derive catch recommendations and/or other management controls
n If insufficient data exist to apply any methods recommended from MSE, then adopt interim measures (Step 7) and update data collection plan (Step 6)
5. conduct sensitivity Analysis and Account for uncertainty n Evaluate Sensitivity of Candidate Methods to Specific Data
n Adjust Catch Modifier to Account for Uncertainties (e.g., if the quality of data deemed sensitive is low, select a larger buffer between recommended overfishing limit and prescribed catch limit)
6. Data collection Planning
n Run the DLM Toolkit’s “NEEDED” function
n Determine what data are required for best performing methods
n Rank data collection priorities according to feasibility of collecting specific types of data and expected benefits in terms of corresponding method performance
n Develop and implement data collection plan
7. Insufficient Data Available (Interim Management) n Use Productivity and Susceptibility Analysis (PSA) and/or similar qualitative/anecdotal information on
current stock status and/or vulnerability
i. If PSA or similar analysis determines that stock status may be abundant, fishing pressure low, and/or vulnerability is low, then cap current catch levels or fishing effort
ii. If PSA or similar analysis determines that stock status may be low, fishing pressure too high, and/or vulnerability is moderate to high, then reduce current catch levels or fishing effort

PAGe 20 | Improving the science and Management of Data-Limited Fisheries
PAcIFIc GrouNDFIsh FIsherY The Pacific Council has the distinction of managing both the most conventionally-assessed stocks using data-rich methods and the largest number of stocks with individually-derived data-limited ACLs. Like most of the fishery management councils, the PFMC delayed addressing ACLs until shortly before the 2011 deadline for implementation. The Southwest Fishery Science Center staff anticipated the problem, and independently investigated data-limited methods prior to the Scientific and Statistical Committee’s (SSC’s) consideration of the subject, scheduled for January 2010. Depletion-Corrected Average Catch (DCAC; MacCall, 2009) had already been developed for ACL-setting purposes, and was a good candidate approach. However, the historical groundfish catch records developed by Ralston, Pearson, Field, and Key (2010) allowed development of a more sophisticated approach: stock reduction analysis. The result was Depletion-Based Stock Reduction Analysis (DB-SRA; Dick and MacCall, 2011), which was validated by testing against existing data-rich assessments, and was presented to the SSC on short notice. Use of DB-SRA and DCAC were conditionally adopted as being the best available basis for setting groundfish ACLs, and a formal review was scheduled to consider the method in closer detail. Dick and MacCall (2010) estimated overfishing limits for 50 West Coast groundfish stocks, forming the basis for their ACLs. Many of these were subsequently combined into assemblages for management purposes. A few of the stocks appeared to be at risk of overfishing (recent catches exceeded the proposed ACL), and these were scheduled for full assessment in 2011.
A suite of data-moderate assessments was conducted in 2013 using related methods, Extended DB-SRA (XDB-SRA) and Extended Simple Stock Synthesis (exSSS) (Cope et al., 2013). Methodological reviews of these new methods were conducted by the STAR panel in 2011 and 2012 and have now been approved for management, marking the recognition of data-moderate assessment approaches as being distinct from data-rich approaches. These data-moderate methods are designed to make use of abundance information that is available for some data-limited stocks and have been proposed for management in the 2015-2016 ACL specification cycle for two flatfish and eight rockfish stocks. The PFMC is also expanding its use of the FMSY/M method for another 13 species of skates, sharks and others that are sampled by annual trawl surveys (Taylor et al., 2013). Several other ACLs have been re-estimated by means of various “piggyback” approaches where catches from a data-poor region are combined with assessment information from an adjacent region that can support an assessment; the ACL for the data-poor region is subsequently obtained by applying the ratio of catches to the overall OFL.
In hindsight, the common ingredient in the West Coast’s success was independent anticipation and initiative by small groups of researchers, rather than coordinated planning by the Councils or Science Centers. Important data on historical catches, which allowed Stock Reduction Analysis of these long-lived species, had recently been reconstructed by Ralston et al. (2010) as being necessary for any assessment effort. Until 2011, the PFMC had relied entirely on data-rich approaches to stock assessment. The variety of approaches and data sources needed to address data-informed ACLs has opened West Coast thinking to a wider variety of assessment solutions, generating a cascade of new data-limited methods.
Looking ahead, the metadata of West Coast survey and recreational CPUE data suggest that perhaps another 30 additional data-limited assessments could be attempted. Some of these will require novel treatments, such as time-blocking of abundance index data to achieve an adequate sample size. Three very rare stocks (bronzespotted, pink, and yellowmouth rockfishes) are good candidates for a “Robin Hood approach” where an effort index obtained from
5. cAse stuDIes
Black and yellow rockfish (Sebastes chrysomelas), California Channel Islands National Marine Sanctuary. Claire Fackler, CINMS, NoAA.

PAGe 21 | Improving the science and Management of Data-Limited Fisheries
better-assessed co-occurring stocks is borrowed for use in assessing a related, more data-poor stock. Some stocks that exhibit non-stationarity, where population parameters are changing over time so that management reference points are not defined, are difficult to assess by current methods, but may be amenable to harvesting algorithms (i.e., management procedures) that respond appropriately to changes in abundance without knowledge of conventional management reference points. Lastly, a few cases of indistinguishable species pairs exist, and thus should be jointly assessed and managed as if a single stock.
The burden for stock assessment and review in the Pacific region is substantial, but manageable, especially as data-limited methods and procedures continue to improve. If assessments remain valid for six years (three two-year cycles), six biennial STAR Panel reviews (two assessments per review) would support up to 36 benchmark assessments.
An additional six update assessments (not requiring STAR) during each cycle would support another 18 stocks. About eight data-moderate assessments could be attempted each cycle (one or two review panels, possibly in the “off” years), and four updates would support about 36 data-moderate assessments. Survey-based ACLs using FMSY/M harvest rates are easily updated, and could address perhaps about 15 stocks. This provides a total of about 100 data-informed ACLs, requiring six to eight STAR Panels every two years. Many of the remaining one-third of the groundfish stocks are negligibly small, may qualify as ecosystem component species, or are amenable to simple piggyback approaches, posing little to no added burden. It appears that informed assessments for the entire list of Pacific groundfish stocks could be maintained (i.e., no assessments older than six years) within current capabilities for assessment and review, but it will require disciplined planning and execution.
Fishing boats in Morro Bay Harbor, CA. Anita Ritenour, 2007.
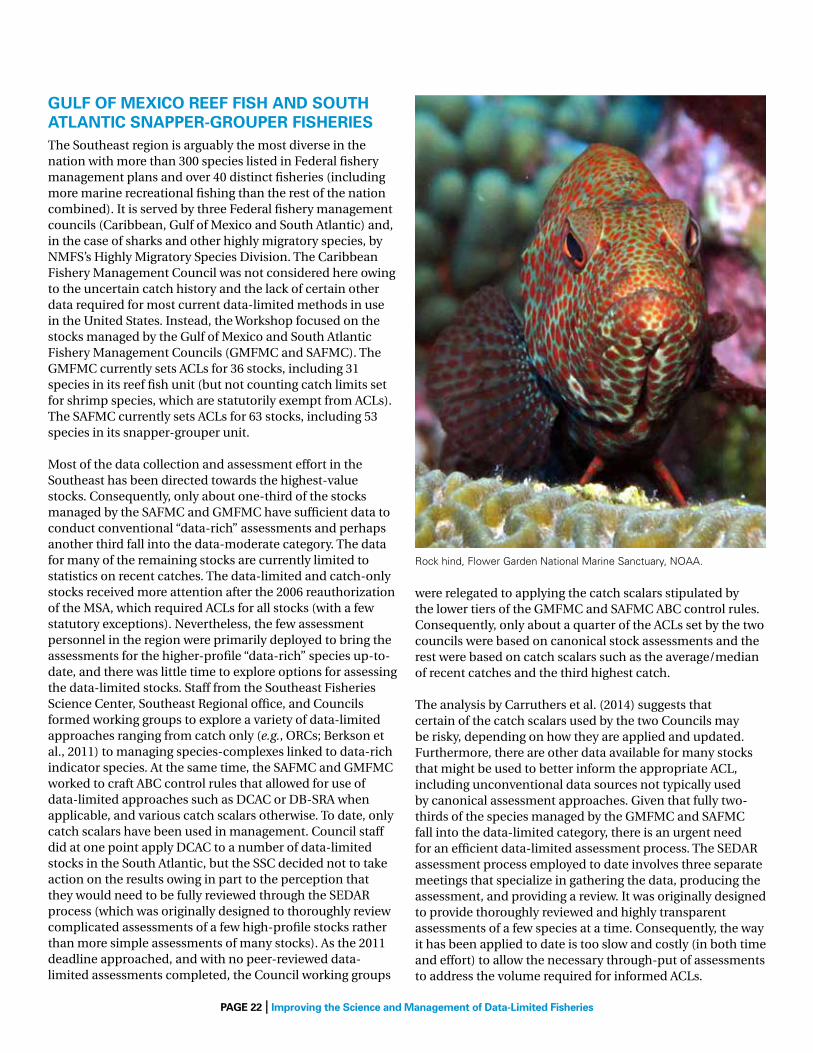
PAGe 22 | Improving the science and Management of Data-Limited Fisheries
GuLF oF MexIco reeF FIsh AND south AtLANtIc sNAPPer-GrouPer FIsherIesThe Southeast region is arguably the most diverse in the nation with more than 300 species listed in Federal fishery management plans and over 40 distinct fisheries (including more marine recreational fishing than the rest of the nation combined). It is served by three Federal fishery management councils (Caribbean, Gulf of Mexico and South Atlantic) and, in the case of sharks and other highly migratory species, by NMFS’s Highly Migratory Species Division. The Caribbean Fishery Management Council was not considered here owing to the uncertain catch history and the lack of certain other data required for most current data-limited methods in use in the United States. Instead, the Workshop focused on the stocks managed by the Gulf of Mexico and South Atlantic Fishery Management Councils (GMFMC and SAFMC). The GMFMC currently sets ACLs for 36 stocks, including 31 species in its reef fish unit (but not counting catch limits set for shrimp species, which are statutorily exempt from ACLs). The SAFMC currently sets ACLs for 63 stocks, including 53 species in its snapper-grouper unit.
Most of the data collection and assessment effort in the Southeast has been directed towards the highest-value stocks. Consequently, only about one-third of the stocks managed by the SAFMC and GMFMC have sufficient data to conduct conventional “data-rich” assessments and perhaps another third fall into the data-moderate category. The data for many of the remaining stocks are currently limited to statistics on recent catches. The data-limited and catch-only stocks received more attention after the 2006 reauthorization of the MSA, which required ACLs for all stocks (with a few statutory exceptions). Nevertheless, the few assessment personnel in the region were primarily deployed to bring the assessments for the higher-profile “data-rich” species up-to-date, and there was little time to explore options for assessing the data-limited stocks. Staff from the Southeast Fisheries Science Center, Southeast Regional office, and Councils formed working groups to explore a variety of data-limited approaches ranging from catch only (e.g., ORCs; Berkson et al., 2011) to managing species-complexes linked to data-rich indicator species. At the same time, the SAFMC and GMFMC worked to craft ABC control rules that allowed for use of data-limited approaches such as DCAC or DB-SRA when applicable, and various catch scalars otherwise. To date, only catch scalars have been used in management. Council staff did at one point apply DCAC to a number of data-limited stocks in the South Atlantic, but the SSC decided not to take action on the results owing in part to the perception that they would need to be fully reviewed through the SEDAR process (which was originally designed to thoroughly review complicated assessments of a few high-profile stocks rather than more simple assessments of many stocks). As the 2011 deadline approached, and with no peer-reviewed data-limited assessments completed, the Council working groups
were relegated to applying the catch scalars stipulated by the lower tiers of the GMFMC and SAFMC ABC control rules. Consequently, only about a quarter of the ACLs set by the two councils were based on canonical stock assessments and the rest were based on catch scalars such as the average/median of recent catches and the third highest catch.
The analysis by Carruthers et al. (2014) suggests that certain of the catch scalars used by the two Councils may be risky, depending on how they are applied and updated. Furthermore, there are other data available for many stocks that might be used to better inform the appropriate ACL, including unconventional data sources not typically used by canonical assessment approaches. Given that fully two-thirds of the species managed by the GMFMC and SAFMC fall into the data-limited category, there is an urgent need for an efficient data-limited assessment process. The SEDAR assessment process employed to date involves three separate meetings that specialize in gathering the data, producing the assessment, and providing a review. It was originally designed to provide thoroughly reviewed and highly transparent assessments of a few species at a time. Consequently, the way it has been applied to date is too slow and costly (in both time and effort) to allow the necessary through-put of assessments to address the volume required for informed ACLs.
Rock hind, Flower Garden National Marine Sanctuary, NoAA.

PAGe 23 | Improving the science and Management of Data-Limited Fisheries
One possible solution is to focus the review process on the methods appropriate for different species life history types and fisheries rather than the specific data associated with each species. One or more data-limited methodology workshops should be held to generate an approved list of data-limited assessment methods. Management strategy evaluation and other diagnostic tools, such as those contained in the Data-Limited Fisheries Toolkit (see Section 4) should form the basis of any methodological review. Participants could include members of the Center of Independent Experts to ensure an adequate level of review. Once the methods are approved, data-limited assessments could either be conducted outside the SEDAR process or else through a modified SEDAR process where assessment workshops are held periodically to apply data-limited approaches for a large number of species at once. This approach would be greatly facilitated by the development of metadata that characterize the quantity and quality of the various data sets available for each species (the Southeast Science Center has since initiated such an effort). The metadata could be used in tandem with a methodological diagnostic key to pre-select viable data-limited methods. The Data-Limited Fisheries Toolkit described above could also assist in this effort.
In order to ensure efficient throughput, it is important that any external reviews focus on the assessment methods and process rather than get bogged down in the details associated with each species (which are better left to the experts with local knowledge who would attend the assessment
Workshop). It will also be important to revise the ABC control rules used by the Council SSCs. The SAFMC ABC control rule appears to be overly prescriptive and may militate against the use of methods that might otherwise be more appropriate for some species. The middle tier of the GMFMC ABC control rule, while perhaps admitting the use of data-limited methods, is unclear and open to interpretation. It is important that the ABC control rules be revised to better accommodate the suite of possible data-limited techniques and assessment tools, thereby enabling each SSC to consider and approve many data-limited assessments in a brief one or two-day subcommittee meeting.
It is important to note that the SEDAR process is not necessarily too rigid to accommodate data-limited method reviews and assessments. Indeed, Workshop participants pointed out that there is not even a requirement that assessments be conducted exclusively through SEDAR and that the process could be made much more flexible and efficient than the way it has been administered to date. The SEDAR Steering Committee, which is dominated by the three regional Councils, must allow the process to evolve to accommodate new methods and review procedures for data-limited stocks or choose to develop a separate, peer-reviewed process exclusively for data-limited stocks, perhaps in conjunction with a partnering academic institution. To date, the Committee has instead voted to allocate resources almost exclusively to repeated benchmark assessments of a small number of high-value commercial stocks.
Fishermen sorting catch of snapper and grouper in Jupiter Inlet, Florida. David Newman, 2013.

PAGe 24 | Improving the science and Management of Data-Limited Fisheries
A series of break-out discussion groups were conducted at the Workshop to help develop specific recommendations for a road map to improved management of data-limited fisheries. Each group was presented with a list of trigger questions on the following topics: metadata review, technical guidance and recommendations for using the Data-Limited Fisheries Toolkit (described above), the stock assessment and ACL-setting processes, and operationalizing recommendations for improvement. The following section provides a synthesis of recommendations that were made throughout the Workshop.
DeVeLoPING MetADAtA sets—uNDerstANDING WhAt DAtA You hAVe There was broad consensus among Workshop participants that metadata (i.e., summary information describing the underlying data) for each managed stock are a necessary prerequisite for planning assessments and management options and urgently needed for many previously unassessed stocks. These summaries are useful for evaluating potential assessment approaches and for identifying data gaps and limitations that could be the focus of future data collection efforts. For many unassessed stocks, data on abundance, average size or other stock attributes may exist, but are not currently used in ACL setting. Compiling this information should be a high priority for NMFS Science Centers and other fisheries science entities.
Workshop participants recommended that fisheries metadata be summarized by broad management region, at the scale that an assessment would most likely be conducted. The categories of potentially-relevant data span the range of conventional statistics collected by fishery monitoring programs and fishery-independent surveys, as well as less conventional data such as the largest fish recorded in annual tournament records or various special studies that may have been conducted over short funding cycles. The metadata for each data series should be annotated by metrics that allow uninformative data to be weeded out. Such metrics should include the spatial and temporal coverage of the data, descriptions of data quality, including known biases, and the protocols underlying data collection (e.g., statistically designed vs. opportunistic). Notation of co-occurrence with other stocks (either as bycatch or multispecies targets) is also recommended and has already been done in some cases (Farmer, Malinowski, McGovern, and Rubec, 2014; Farmer, Mehta, Reichert, and Stephen, 2011). Other metrics, such as sample size, may also be appropriate depending on the type of data. For example, in the case of survey indices of abundance, it is important to note the number of positive
samples that are available because zero catches provide little information for a relative index (simply knowing the total number of samples, including zeroes, is of little use, and could even be misleading). As there are few generally accepted protocols for many types of data, it would be important to involve data managers and statisticians with expertise in each data type.
Maintaining metadata should be a routine component of a Science Center’s overall data processing and assessment activity. It was suggested that the metadata set should be maintained in the cloud as a living document so that new and previously unknown data sets can be added by the authors of those studies.
6. recoMMeNDAtIoNs For IMProVING AssessMeNt AND MANAGeMeNt oF DAtA-LIMIteD FIsherIes
What Are the Differences Among Metadata, raw Data, and Processed Data?
Three aspects of fishery data need to be distinguished: metadata, raw data, and processed data. Metadata are “data about data.” For example, the numbers of fish taken in each trawl sample of a survey are data, but the numbers of samples taken each year by the survey are metadata. Retrieval of metadata is much quicker and easier than retrieval and analysis of the underlying data itself. Raw data are the individual records of numbers and sizes of fish and are the basis from which an index of abundance or a size composition is calculated. Processed data are derived from raw data and consist of summary proportions or averages, but also may be the product of extensive statistical computation, such as in a generalized linear model (GLM). In some cases, samples may exist, but require further work to provide useful data. For example, large numbers of otoliths may have been collected, but await age determinations. This collection of otoliths can be described by metadata, but has yet to become raw or processed data. Nonetheless, the metadata describing these samples are clearly valuable for planning.
APPLYING the DLM tooLkItThe Data-Limited Fisheries Toolkit (see Section 4 above) is designed to streamline and improve the assessment process, while empowering scientists and managers with powerful simulation capabilities and sensitivity analyses. There was widespread support among Workshop participants recommending that the Toolkit be applied in

PAGe 25 | Improving the science and Management of Data-Limited Fisheries
U.S. management and possibly internationally as well. One particularly useful aspect of the Toolkit is that it can be used to apply multiple data-limited methods to a specific data set, although some Workshop participants voiced concern that the availability of too many divergent results could hinder the decision-making process or lead to unscientific cherry-picking of a method simply because it yielded the highest catch limit. In this context, Workshop participants agreed that while the Toolkit makes calculations much easier, technical understanding of the methods is still required for evaluation of the results.
Even though decision-makers often want to reduce information on stock status to an easily-understood single number (usually derived from a single assessment model), this is an especially risky approach for data-limited assessments where high precision may be difficult to achieve. Workshop participants debated whether the Toolkit should
simply average the results of all available methods, although there was general agreement that this approach failed to capture the relative efficacy of the different methods. It was generally agreed that a more expert-informed analysis should be undertaken considering the simulation evaluation and sensitivity results from the Toolkit in order to determine the best-performing methods for each particular situation. It was suggested that if the various assessment approaches have differing plausibility (based either on simulation and statistical analyses or on more general expert experience) that the assessment results should be weighted accordingly. Of course, a method that has proven consistently to be unreliable should be given a low or zero weight, effectively dropping it from consideration. Thus, “best practices” is less a matter of using preferred methods and more about rejecting methods that are known to be unreliable and following a transparent and consistent process of evaluating method performance and data sensitivities.
Angler at Cannon Beach, oregon. DanoStL, 2009.

PAGe 26 | Improving the science and Management of Data-Limited Fisheries
The simulation capability of the Toolkit has already been used to evaluate the performance of some established methods, including various catch-based methods for setting ACLs, survey-based methods using FMSY/M, and some recently developed stock reduction analyses with both informed and uninformed depletion status (Carruthers et al., 2014). Adaptive management algorithms (e.g., the slope-to-target algorithm used in Australia, Little et al., 2011; Prince, Dowling, Davies, Campbell, and Kolody, 2011) have seen relatively little use in U.S. fishery management with some exceptions (e.g., the North Pacific combines FMSY/M with swept-area abundances, and New England has used the AIM (An Index Method) algorithm for some fisheries). Mark Maunder presented a management algorithm designed to self-seek maximum sustainable yield by adjusting ACLs according to fluctuations in an abundance index and associated estimates of annual production. Following the Workshop, Carl Walters explored some simulations and tunings of the control parameters and found that Maunder’s proposed approach performed surprisingly well. This approach and several other methods have since been added to the Toolkit.
streAMLINING the stock AssessMeNt AND AcL-settING Processes For DAtA-LIMIteD stocks Many official NMFS stock assessment processes, for example the Southeast Data Assessment Review (SEDAR) and the Pacific Stock Assessment Review (STAR) programs, were designed for assessing fewer numbers of high-value, target stocks using highly complex assessment models. Even for that purpose, some regions continue to struggle to complete assessments and reviews for its most data-rich stocks. Reforming the SEDAR process to accommodate data-limited stocks was a key point of discussion, and various specific changes were recommended. There was a consensus among the participants that the current SEDAR process is too slow and costly (in both time and effort) to allow the necessary through-put of assessments to address the volume required for informed ACLs. Overall, there was broad agreement for the need to develop an alternative, simplified, and less prescriptive review procedure for data-limited assessments. An initial step would be to convene a special methods Workshop to review and approve a list of applicable data-limited methods, to update the list for each assessment cycle, and to ensure approved methods are available in the Data-Limited Fisheries Toolkit. Another possible solution is to complement SEDAR with externally-conducted data-limited assessments using pre-approved, peer-reviewed methods. Methods already approved for management in other regions should be included in the list.
It is important to develop an institutional understanding of the comparative standards for data-rich and data-limited assessments and use appropriate criteria for evaluating the
sufficiency of different assessment types given varying data availability. Data-limited assessments contain fewer data inputs and therefore do not require tedious data reviews. Relative to the present SEDAR process, it was agreed that a separate data review workshop is desirable, but can be less formal than such workshop currently tend to be. Focus should be on identifying data sources that require scheduling and planning to effectively process for use in an assessment. Data management and retrieval is a major bottleneck in the Southeast region, so a major effort should be made to develop direct data query and retrieval capacity, so assessment authors can spend their time running assessments instead of processing data. It was also agreed that the data Workshop should not be used to exclude consideration of data sources prior to modeling, as model exploration is an important tool for determining utility of data. The assessment authors should have a strong voice in selection of input data.
There was broad agreement that the current practice of convening extensive reviews of two or three species at a time is unnecessary given the fact that data-limited assessments are simpler than canonical data-rich assessments and require fewer decisions. It was recommended that SEDAR adopt a single comprehensive data-limited review Workshop similar to what STAR has done in the Pacific region. The terms of reference for the review should not focus on identifying the best model, but rather emphasize the integration of the information provided by the suite of methods available given the data. It was noted that it may be difficult to find certified independent expert (CIE) reviewers with the required expertise in data-limited assessment techniques, so the role of CIE participants should be redefined to be more advisory (i.e., they would not be authorized to accept or reject pre-established methods, but may provide comments on them). Finally, it was noted that the schedule for setting ACLs in the Southeast should be standardized similar to the two-year ACL specification process used in the Pacific and other regions. This would provide the necessary time to meet procedural requirements, set pre-established benchmarks for data analysis and assessment on a regular schedule, and reduce the need for emergency regulations. Regarding control rules and the ACL-setting process, there was consensus that the current approach, where the P* (see Shertzer, Prager, and Williams [2008] for technical details) is determined from a table that attempts to quantify how well the assessment variances capture scientific uncertainty in the results, is too prescriptive and does not recognize existing additional information. A better alternative may be to use empirically-derived error variances (e.g., Ralston, Punt, Hamel, DeVore, and Conser, 2011) as minimum values, and use the assessment value only if it is larger. It was widely accepted by Workshop participants that there should be higher uncertainty buffers for the more data-poor stocks, but that current practices in some regions contain no explicit uncertainty buffers at all. The current tiered systems used

PAGe 27 | Improving the science and Management of Data-Limited Fisheries
by the Gulf and South Atlantic Councils in their ABC control rules do not reflect the kinds of information produced by multiple data-limited assessments, and merit revision.
IMProVING NMFs AND couNcIL cAPAbILItIes For DAtA-LIMIteD AssessMeNtThe MSA requirement for implementation of ACLs for most Federally-managed stocks, including hundreds of previously unassessed ones, within a relatively short timeframe with few additional resources has been a substantial undertaking. A large number of data-limited and especially data-poor stocks had to be addressed. At the time, there were few methods for conducting data-limited assessments and little effort had been given to compiling the data for such a large number of “minor” stocks—it was not even clear what kinds of data were needed. In the various regions of the United States, the implementation of ACLs was uneven, and Councils that received the most extensive technical support from the Science Centers were the most successful in implementing well-considered ACLs for data-limited stocks.
Remarkable changes have occurred since 2011. The development of data-limited methods has been an active and productive area of fishery research. Yet, transfer of technology and expertise among Science Centers and among Fishery Management Councils remains slow due the differences
in the management systems, data availability and limited interaction of the scientific teams among the different regions of the United States. One of the important lessons from the Workshop was the benefits of and need for additional coordination by NMFS to ensure that the innovation of new approaches and lessons learned are transferred from one region to another in a consistent and sustained manner. Recommendations to this end that were developed at the Workshop include:
n NMFS Science Centers should be responsive to Council needs and requests, but should also maintain independent research priorities addressing the Center’s own evaluation of fishery research and monitoring needs. This helps to avoid excessive focus on politically important stocks.
n Centers should establish dedicated positions to conduct data-limited stock assessment.
n NMFS should establish a nationwide working group to collaborate on methods and validation of data-limited assessment and management approaches. This would also support development of consistent data-limited protocols and methodologies throughout the nation.
n NMFS should develop a centrally-funded program (akin to the CIE) of inter-laboratory and short-term inter-Council personnel exchange. Councils presently have little or no access to NMFS expertise from other than the local Science Center.
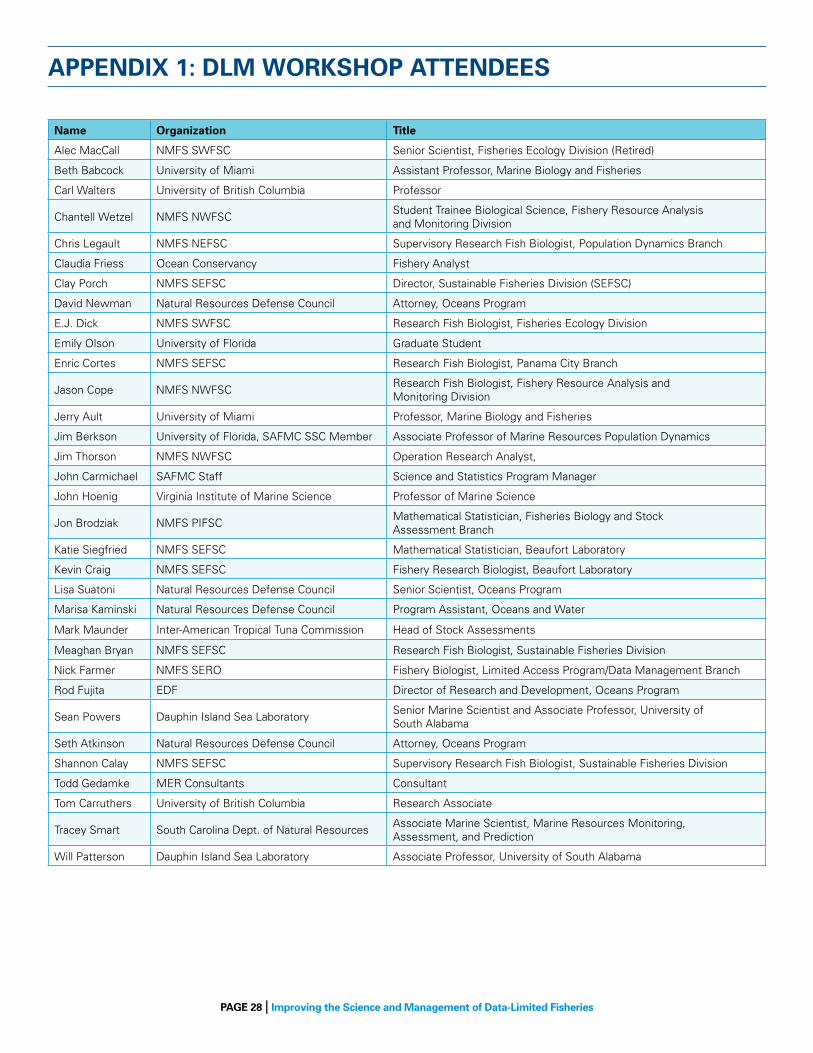
PAGe 28 | Improving the science and Management of Data-Limited Fisheries
Name organization title
Alec MacCall NMFS SWFSC Senior Scientist, Fisheries Ecology Division (Retired)
Beth Babcock University of Miami Assistant Professor, Marine Biology and Fisheries
Carl Walters University of British Columbia Professor
Chantell Wetzel NMFS NWFSCStudent Trainee Biological Science, Fishery Resource Analysis and Monitoring Division
Chris Legault NMFS NEFSC Supervisory Research Fish Biologist, Population Dynamics Branch
Claudia Friess ocean Conservancy Fishery Analyst
Clay Porch NMFS SEFSC Director, Sustainable Fisheries Division (SEFSC)
David Newman Natural Resources Defense Council Attorney, oceans Program
E.J. Dick NMFS SWFSC Research Fish Biologist, Fisheries Ecology Division
Emily olson University of Florida Graduate Student
Enric Cortes NMFS SEFSC Research Fish Biologist, Panama City Branch
Jason Cope NMFS NWFSCResearch Fish Biologist, Fishery Resource Analysis and Monitoring Division
Jerry Ault University of Miami Professor, Marine Biology and Fisheries
Jim Berkson University of Florida, SAFMC SSC Member Associate Professor of Marine Resources Population Dynamics
Jim Thorson NMFS NWFSC operation Research Analyst,
John Carmichael SAFMC Staff Science and Statistics Program Manager
John Hoenig Virginia Institute of Marine Science Professor of Marine Science
Jon Brodziak NMFS PIFSCMathematical Statistician, Fisheries Biology and Stock Assessment Branch
Katie Siegfried NMFS SEFSC Mathematical Statistician, Beaufort Laboratory
Kevin Craig NMFS SEFSC Fishery Research Biologist, Beaufort Laboratory
Lisa Suatoni Natural Resources Defense Council Senior Scientist, oceans Program
Marisa Kaminski Natural Resources Defense Council Program Assistant, oceans and Water
Mark Maunder Inter-American Tropical Tuna Commission Head of Stock Assessments
Meaghan Bryan NMFS SEFSC Research Fish Biologist, Sustainable Fisheries Division
Nick Farmer NMFS SERo Fishery Biologist, Limited Access Program/Data Management Branch
Rod Fujita EDF Director of Research and Development, oceans Program
Sean Powers Dauphin Island Sea LaboratorySenior Marine Scientist and Associate Professor, University of South Alabama
Seth Atkinson Natural Resources Defense Council Attorney, oceans Program
Shannon Calay NMFS SEFSC Supervisory Research Fish Biologist, Sustainable Fisheries Division
Todd Gedamke MER Consultants Consultant
Tom Carruthers University of British Columbia Research Associate
Tracey Smart South Carolina Dept. of Natural ResourcesAssociate Marine Scientist, Marine Resources Monitoring, Assessment, and Prediction
Will Patterson Dauphin Island Sea Laboratory Associate Professor, University of South Alabama
APPeNDIx 1: DLM WorkshoP AtteNDees
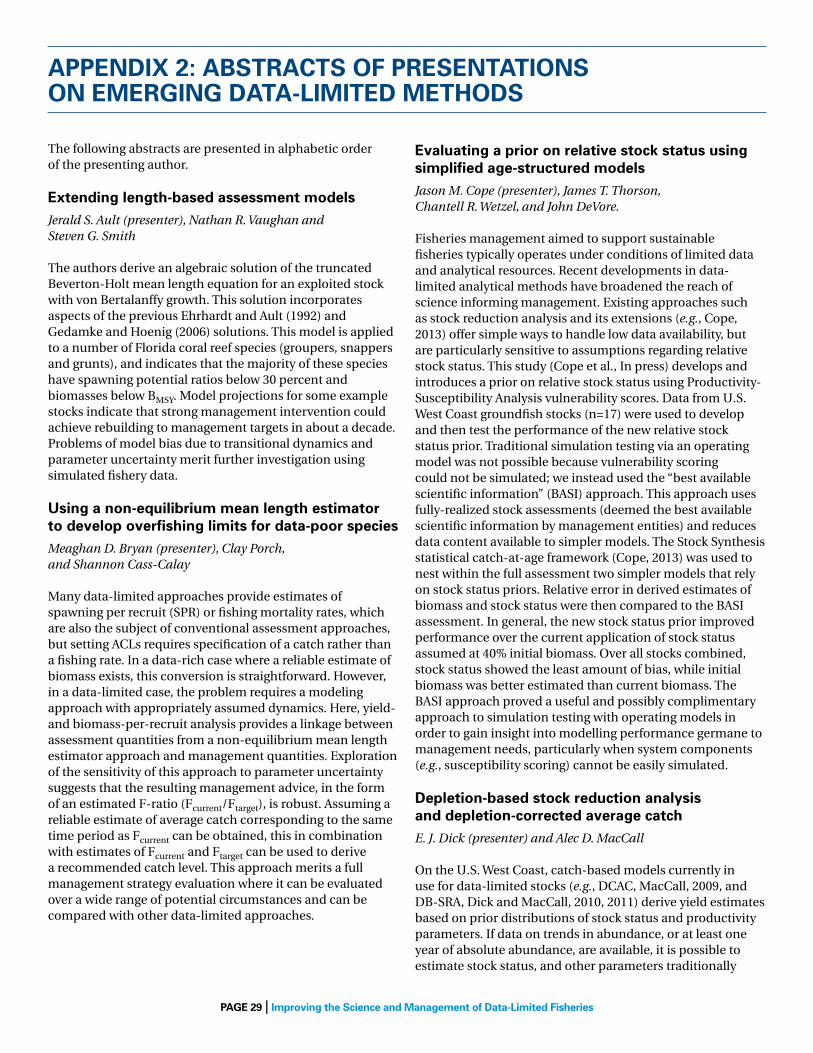
PAGe 29 | Improving the science and Management of Data-Limited Fisheries
APPeNDIx 2: AbstrActs oF PreseNtAtIoNs oN eMerGING DAtA-LIMIteD MethoDs
The following abstracts are presented in alphabetic order of the presenting author.
extending length-based assessment modelsJerald S. Ault (presenter), Nathan R. Vaughan and Steven G. Smith
The authors derive an algebraic solution of the truncated Beverton-Holt mean length equation for an exploited stock with von Bertalanffy growth. This solution incorporates aspects of the previous Ehrhardt and Ault (1992) and Gedamke and Hoenig (2006) solutions. This model is applied to a number of Florida coral reef species (groupers, snappers and grunts), and indicates that the majority of these species have spawning potential ratios below 30 percent and biomasses below BMSY. Model projections for some example stocks indicate that strong management intervention could achieve rebuilding to management targets in about a decade. Problems of model bias due to transitional dynamics and parameter uncertainty merit further investigation using simulated fishery data.
using a non-equilibrium mean length estimator to develop overfishing limits for data-poor speciesMeaghan D. Bryan (presenter), Clay Porch, and Shannon Cass-Calay
Many data-limited approaches provide estimates of spawning per recruit (SPR) or fishing mortality rates, which are also the subject of conventional assessment approaches, but setting ACLs requires specification of a catch rather than a fishing rate. In a data-rich case where a reliable estimate of biomass exists, this conversion is straightforward. However, in a data-limited case, the problem requires a modeling approach with appropriately assumed dynamics. Here, yield- and biomass-per-recruit analysis provides a linkage between assessment quantities from a non-equilibrium mean length estimator approach and management quantities. Exploration of the sensitivity of this approach to parameter uncertainty suggests that the resulting management advice, in the form of an estimated F-ratio (Fcurrent/Ftarget), is robust. Assuming a reliable estimate of average catch corresponding to the same time period as Fcurrent can be obtained, this in combination with estimates of Fcurrent and Ftarget can be used to derive a recommended catch level. This approach merits a full management strategy evaluation where it can be evaluated over a wide range of potential circumstances and can be compared with other data-limited approaches.
evaluating a prior on relative stock status using simplified age-structured modelsJason M. Cope (presenter), James T. Thorson, Chantell R. Wetzel, and John DeVore.
Fisheries management aimed to support sustainable fisheries typically operates under conditions of limited data and analytical resources. Recent developments in data-limited analytical methods have broadened the reach of science informing management. Existing approaches such as stock reduction analysis and its extensions (e.g., Cope, 2013) offer simple ways to handle low data availability, but are particularly sensitive to assumptions regarding relative stock status. This study (Cope et al., In press) develops and introduces a prior on relative stock status using Productivity-Susceptibility Analysis vulnerability scores. Data from U.S. West Coast groundfish stocks (n=17) were used to develop and then test the performance of the new relative stock status prior. Traditional simulation testing via an operating model was not possible because vulnerability scoring could not be simulated; we instead used the “best available scientific information” (BASI) approach. This approach uses fully-realized stock assessments (deemed the best available scientific information by management entities) and reduces data content available to simpler models. The Stock Synthesis statistical catch-at-age framework (Cope, 2013) was used to nest within the full assessment two simpler models that rely on stock status priors. Relative error in derived estimates of biomass and stock status were then compared to the BASI assessment. In general, the new stock status prior improved performance over the current application of stock status assumed at 40% initial biomass. Over all stocks combined, stock status showed the least amount of bias, while initial biomass was better estimated than current biomass. The BASI approach proved a useful and possibly complimentary approach to simulation testing with operating models in order to gain insight into modelling performance germane to management needs, particularly when system components (e.g., susceptibility scoring) cannot be easily simulated.
Depletion-based stock reduction analysis and depletion-corrected average catchE. J. Dick (presenter) and Alec D. MacCall
On the U.S. West Coast, catch-based models currently in use for data-limited stocks (e.g., DCAC, MacCall, 2009, and DB-SRA, Dick and MacCall, 2010, 2011) derive yield estimates based on prior distributions of stock status and productivity parameters. If data on trends in abundance, or at least one year of absolute abundance, are available, it is possible to estimate stock status, and other parameters traditionally
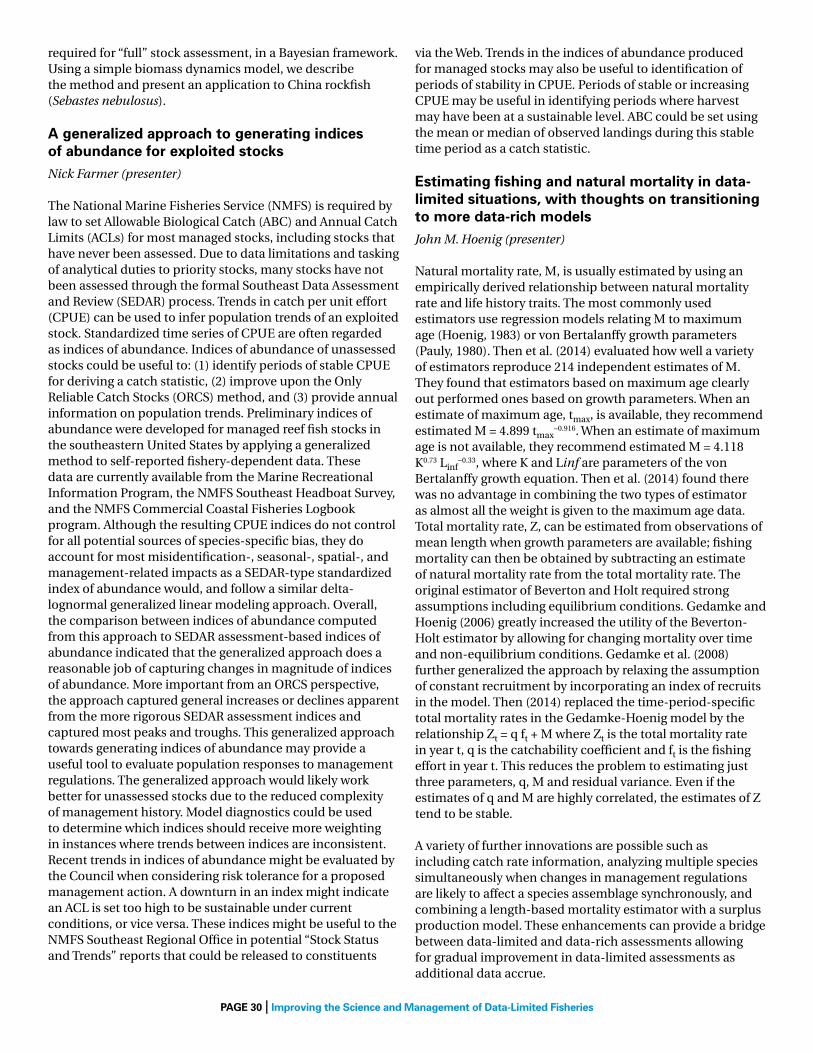
PAGe 30 | Improving the science and Management of Data-Limited Fisheries
required for “full” stock assessment, in a Bayesian framework. Using a simple biomass dynamics model, we describe the method and present an application to China rockfish (Sebastes nebulosus).
A generalized approach to generating indices of abundance for exploited stocksNick Farmer (presenter)
The National Marine Fisheries Service (NMFS) is required by law to set Allowable Biological Catch (ABC) and Annual Catch Limits (ACLs) for most managed stocks, including stocks that have never been assessed. Due to data limitations and tasking of analytical duties to priority stocks, many stocks have not been assessed through the formal Southeast Data Assessment and Review (SEDAR) process. Trends in catch per unit effort (CPUE) can be used to infer population trends of an exploited stock. Standardized time series of CPUE are often regarded as indices of abundance. Indices of abundance of unassessed stocks could be useful to: (1) identify periods of stable CPUE for deriving a catch statistic, (2) improve upon the Only Reliable Catch Stocks (ORCS) method, and (3) provide annual information on population trends. Preliminary indices of abundance were developed for managed reef fish stocks in the southeastern United States by applying a generalized method to self-reported fishery-dependent data. These data are currently available from the Marine Recreational Information Program, the NMFS Southeast Headboat Survey, and the NMFS Commercial Coastal Fisheries Logbook program. Although the resulting CPUE indices do not control for all potential sources of species-specific bias, they do account for most misidentification-, seasonal-, spatial-, and management-related impacts as a SEDAR-type standardized index of abundance would, and follow a similar delta-lognormal generalized linear modeling approach. Overall, the comparison between indices of abundance computed from this approach to SEDAR assessment-based indices of abundance indicated that the generalized approach does a reasonable job of capturing changes in magnitude of indices of abundance. More important from an ORCS perspective, the approach captured general increases or declines apparent from the more rigorous SEDAR assessment indices and captured most peaks and troughs. This generalized approach towards generating indices of abundance may provide a useful tool to evaluate population responses to management regulations. The generalized approach would likely work better for unassessed stocks due to the reduced complexity of management history. Model diagnostics could be used to determine which indices should receive more weighting in instances where trends between indices are inconsistent. Recent trends in indices of abundance might be evaluated by the Council when considering risk tolerance for a proposed management action. A downturn in an index might indicate an ACL is set too high to be sustainable under current conditions, or vice versa. These indices might be useful to the NMFS Southeast Regional Office in potential “Stock Status and Trends” reports that could be released to constituents
via the Web. Trends in the indices of abundance produced for managed stocks may also be useful to identification of periods of stability in CPUE. Periods of stable or increasing CPUE may be useful in identifying periods where harvest may have been at a sustainable level. ABC could be set using the mean or median of observed landings during this stable time period as a catch statistic.
estimating fishing and natural mortality in data-limited situations, with thoughts on transitioning to more data-rich modelsJohn M. Hoenig (presenter)
Natural mortality rate, M, is usually estimated by using an empirically derived relationship between natural mortality rate and life history traits. The most commonly used estimators use regression models relating M to maximum age (Hoenig, 1983) or von Bertalanffy growth parameters (Pauly, 1980). Then et al. (2014) evaluated how well a variety of estimators reproduce 214 independent estimates of M. They found that estimators based on maximum age clearly out performed ones based on growth parameters. When an estimate of maximum age, tmax, is available, they recommend estimated M = 4.899 tmax
−0.916. When an estimate of maximum age is not available, they recommend estimated M = 4.118 K0.73 Linf
−0.33, where K and Linf are parameters of the von Bertalanffy growth equation. Then et al. (2014) found there was no advantage in combining the two types of estimator as almost all the weight is given to the maximum age data. Total mortality rate, Z, can be estimated from observations of mean length when growth parameters are available; fishing mortality can then be obtained by subtracting an estimate of natural mortality rate from the total mortality rate. The original estimator of Beverton and Holt required strong assumptions including equilibrium conditions. Gedamke and Hoenig (2006) greatly increased the utility of the Beverton-Holt estimator by allowing for changing mortality over time and non-equilibrium conditions. Gedamke et al. (2008) further generalized the approach by relaxing the assumption of constant recruitment by incorporating an index of recruits in the model. Then (2014) replaced the time-period-specific total mortality rates in the Gedamke-Hoenig model by the relationship Zt = q ft + M where Zt is the total mortality rate in year t, q is the catchability coefficient and ft is the fishing effort in year t. This reduces the problem to estimating just three parameters, q, M and residual variance. Even if the estimates of q and M are highly correlated, the estimates of Z tend to be stable.
A variety of further innovations are possible such as including catch rate information, analyzing multiple species simultaneously when changes in management regulations are likely to affect a species assemblage synchronously, and combining a length-based mortality estimator with a surplus production model. These enhancements can provide a bridge between data-limited and data-rich assessments allowing for gradual improvement in data-limited assessments as additional data accrue.

PAGe 31 | Improving the science and Management of Data-Limited Fisheries
emerging and alternative approaches— some odds and endsAlec D. MacCall (presenter)
This talk included brief coverage of a number of topics, including the following:
Jeremy Prince’s size composition approach: It has long been known that the size composition of an exploited population reflects the balance of mortality and growth rates, but simple interpretation has been elusive. A promising approach is to divide fish stocks into a few consistent and identifiable taxonomic categories within which the rate dynamics and hence the shape of the unfished length composition tend to be predictable. Comparison of the present length composition with the length composition expected for that taxonomic category allows inference of exploitation status and spawning potential ratio.
Use of maximum size observations: For some species recreational fishing tournaments or even old photographic records can provide data on the largest fish caught each year. This statistic has a well-defined likelihood function and is easily interpreted by age-structured population models. Maximum size can be very informative regarding fishing pressure, but may be slow to reach its equilibrium value.
Data borrowing: It may be possible to transfer information from data-rich assessments to closely-associated data-poor species. An especially useful method is to transfer the F-history. This can either be simultaneous (the “Robin Hood approach”) where data-rich and data-poor assessments are combined in a single analysis, usually as a maximum likelihood model, or can be sequential, which is better suited to a data-moderate Bayesian model. This F-borrowing approach is a promising alternative to the unreliable practice of interpreting the abundance of “indicator species” as being indicative of other species in an assemblage.
Use of MPAs (Marine Protected Areas) for data-limited management: For stocks with relatively low mobility, comparison of demographic properties in the fished area with those in an MPA can provide useful information. Approaches include inside/outside comparison of fish densities (the density ratio approach) and comparative length compositions, both of which are amenable to non-lethal visual survey methods.
Management algorithms: Some sources and methods provide information that is useful for management, but in a form that cannot be immediately used to determine an ACL. For example an optimal fishing rate may not be sufficient to calculate an optimal catch unless something is known about abundance. Methods such as AIM (An Index Method) assist translation of a survey time series into catch advice. The “slope-to-target” approach used in Australia is a general algorithm for adjusting harvest controls such as catch levels to programmatically move the fishery toward a desired target.
catch curve stock-reduction analysis: An alternative solution to the catch equationsJames T. Thorson (presenter) and Jason M. Cope
Legislative changes in the United States and elsewhere now require scientific advice on catch limits for data-poor fisheries. The family of stock reduction analysis (SRA) models is widely used to calculate sustainable harvest levels given a time series of harvest data. SRA works by solving the catch equation given an assumed value for spawning biomass relative to unfished levels in the final (or recent) year, and resulting estimates of recent fishing mortality are biased when this assumed value is mis-specified. We therefore propose to replace this assumption when estimating stock status by using compositional data in recent years to estimate a catch curve and hence estimating fishing mortality in those years. We compare this new “catch-curve stock reduction analysis” (CC-SRA) with an SRA or catch curve using simulated data for slow or fast life histories and various magnitudes of recruitment variability. Results (Thorson and Cope, 2014) confirm that the SRA yields biased estimates of current fishing mortality given mis-specified information about recent spawning biomass, and that the catch curve is biased due to changes in fishing mortality over time. CC-SRA, by contrast, is approximately unbiased for low or moderate recruitment variability, and less biased than other methods given high recruitment variability. We therefore recommend CC-SRA as a data-poor assessment method that incorporates compositional data collection in recent years, and suggest future management strategy evaluation given a data-poor control rule.
stochastic stock reduction analysisCarl J. Walters (presenter)
Stochastic stock reduction analysis is a stochastic age structured population model with Beverton-Holt stock-recruitment function that estimates forward in time and is fit to an abundance estimate or trend of abundance indexes. SRA uses UMSY (MSY exploitation rate) and MSY as leading parameters, and given these parameters, the model simulates changes in biomass by subtracting estimates of mortality and adding recruits. In Stochastic SRA, recruitment is assumed to have had lognormally distributed annual anomalies, and to account for the effects of these, a very large number of simulation runs is made with anomaly sequences chosen from normal prior distributions (with or without autocorrelation). The resulting trials of possible historical trajectories are used as a starting point for Markov Chain Monte Carlo simulation. Stochastic SRA is now available as an executable package (Lombardi and Walters, 2011) that features graphical outputs and performance diagnostics. This package has seen extensive usage at the SEFSC Panama City Laboratory.

PAGe 32 | Improving the science and Management of Data-Limited Fisheries
APPeNDIx 3: resuLts oF MANAGeMeNt strAteGY eVALuAtIoN oF curreNt DAtA-LIMIteD MethoDs IN use IN the u.s. (cArruthers et AL., 2014)
0 10 20 30 40 50 60 70 80 90 100
Long
-Ter
m Y
ield
(% o
f Per
fect
Kno
wle
dge
F MSY
)
Probability of Overfishing (%)
100
90
80
70
60
50
40
30
20
10
0
Data-Limited Method Performance (Snapper)Initial B/BMSY = <50%, 50-100%, 100-150%
3rd Highest
DB-SRA40DCAC40
DACS
DB-SRA
Fmsy/M
Delay Difference
3rd HighestDB-SRA40
DCAC40
DACS
DB-SRA
Fmsy/M
Delay Difference
3rd Highest
DB-SRA40DCAC40
DACS
DB-SRAFmsy/M
Delay Difference
3rd Highest
DB-SRA40DCAC40
DACS
DB-SRA Fmsy/M
Delay Difference3rd Highest
DB-SRA40
DCAC40 DACS
DB-SRA
Fmsy/M
Delay Difference
3rd Highest
DB-SRA40
DCAC
DACS
DB-SRA
Fmsy/M
Delay Difference
0 10 20 30 40 50 60 70 80 90 100
Long
-Ter
m Y
ield
(% o
f Per
fect
Kno
wle
dge
F MSY
)
Probability of Overfishing (%)
100
90
80
70
60
50
40
30
20
10
0
Data-Limited Method Performance (Mackerel)Initial B/BMSY = <50%, 50-100%, 100-150%

PAGe 33 | Improving the science and Management of Data-Limited Fisheries
0 10 20 30 40 50 60 70 80 90 100
Long
-Ter
m Y
ield
(% o
f Per
fect
Kno
wle
dge
F MSY
)
Probability of Overfishing (%)
100
90
80
70
60
50
40
30
20
10
0
Data-Limited Method Performance (Porgy)Initial B/BMSY = <50%, 50-100%, 100-150%
3rd Highest
DB-SRA40DCAC40
DACS
DB-SRA
Fmsy/M
Delay Difference
3rd Highest
DB-SRA40DCAC40 DACS
DB-SRA
Fmsy/M
Delay Difference
3rd HighestDB-SRA40
DCAC40
,DACSDB-SRAFmsy/M
Delay Difference
0 10 20 30 40 50 60 70 80 90 100
Long
-Ter
m Y
ield
(% o
f Per
fect
Kno
wle
dge
F MSY
)
Probability of Overfishing (%)
100
90
80
70
60
50
40
30
20
10
0
Data-Limited Method Performance (Sole)Initial B/BMSY = <50%, 50-100%, 100-150%
3rd Highest
DB-SRA40DCAC40
DACS
DB-SRA
Fmsy/M
Delay Difference
3rd Highest
DB-SRA40
DCAC40
DACSDB-SRAFmsy/M
Delay Difference
3rd Highest
DB-SRA40
DCAC40
DACS
DB-SRAFmsy/M Delay Difference

PAGe 34 | Improving the science and Management of Data-Limited Fisheries
0 10 20 30 40 50 60 70 80 90 100
Long
-Ter
m Y
ield
(% o
f Per
fect
Kno
wle
dge
F MSY
)
Probability of Overfishing (%)
100
90
80
70
60
50
40
30
20
10
0
Data-Limited Method Performance (Rock�sh)Initial B/BMSY = <50%, 50-100%, 100-150%
3rd Highest
DB-SRA40DCAC40
DACS
DB-SRA
Fmsy/M
Delay Difference
3rd Highest
DB-SRA40DCAC40
DACSDB-SRA Fmsy/M
Delay Difference
3rd Highest
DB-SRA40DCAC40
DACS
DB-SRA
Fmsy/M
Delay Difference
0 10 20 30 40 50 60 70 80 90 100
Long
-Ter
m Y
ield
(% o
f Per
fect
Kno
wle
dge
F MSY
)
Probability of Overfishing (%)
100
90
80
70
60
50
40
30
20
10
0
Data-Limited Method Performance (Butter�sh)Initial B/BMSY = <50%, 50-100%, 100-150%
3rd HighestDB-SRA40
DCAC40
DACS
DB-SRA
Fmsy/M
Delay Difference
3rd Highest
DB-SRA40DCAC40
DACS
DB-SRA
Fmsy/M
Delay Difference
3rd Highest
DB-SRA40DCAC40
DACS
DB-SRAFmsy/M
Delay Difference
PAGe 35 | Improving the science and Management of Data-Limited Fisheries
reFereNces
Ault, J.S., Smith, S.G., and Bohnsack, J.A. 2005. Evaluation of aver-age length as an estimator of exploitation status for the Florida coral-reef fish community. ICES Journal of Marine Science 62: 417-423.
Ault, J.S., Smith, S.G., Luo, J., Monaco, M.E., and Appeldoorn, R.S. 2008. Length-based assessment of sustainability benchmarks for coral reef fishes in Puerto Rico. Environmental Conservation 35: 221–231.
Beddington, J.R. and Kirkwood, G.P. 2005. The estimation of potential yield and stock status using life history parameters. Philosophical Transactions of the Royal Society B: Biological Sciences 360(1453): 163–170.
Berkson, J., Barbieri, L., Cadrin, S., Cass-Calay, S., Crone, P., Dorn, M., Trianni, M. 2011. Calculating acceptable biological catch for stocks that have reliable catch data only. NoAA Technical Memorandum, NoAA-TM-NMFS-SEFSC-616.
Beverton, Raymond J.H. and Holt, Sidney J. 1957. On the Dynamics of Exploited Fish Populations. Fishery investigations, series 2, vol. 19, 533 p. London, United Kingdom: H.M. Stationery off.
Cameron, William Bruce. 1963. Informal Sociology: A Casual Introduc-tion to Sociological Thinking. New York, NY: Random House, pp. 170.
Caribbean Fishery Management Council. 2010. Amendment 2 to the fishery management plan for the queen conch fishery of Puerto Rico and the U.S. Virgin Islands; Amendment 5 to the reef fish fishery.
Caribbean Fishery Management Council. 2011. Comprehensive ACL Amendment for the Caribbean.
Carruthers, T. 2014. Data-Limited Fisheries Toolkit (Version 1.34). Software available at http://cran.r-project.org/web/packages/DLMtool/index.html.
Carruthers, T., Punt, A., Walters, C., MacCall, A., McAllister, M., Dick, E., and Cope, J. 2014. Evaluating methods for setting catch limits in data-limited fisheries. Fisheries Research 153:48-68.
Cope, J. M. 2013. Implementing a statistical catch-at-age model (stock synthesis) as a tool for deriving overfishing limits in data-limited situations. Fisheries Research 142: 3-14.
Cope, J., Dick, E.J., and MacCall, A. 2012. Deriving estimates of oFL for species in the “other Fish” complex. PFMC March 2012 Meeting, Agenda Item F.2.a, Attachment 2.
Cope, J., Dick, E.J., MacCall, A., Monk, M., Soper, B., and Wetzel, C. 2013. Data-moderate stock assessments for brown, China, copper, sharpchin, stripetail, and yellowtail rockfishes and English and rex soles in 2013. PFMC June 2013 Meeting, Agenda Item F.5.a, Attach-ment.
Cope, J.M., Thorson, J.T., Wetzel, C.R., and DeVore, J. In press. Evaluating a prior on relative stock status using simplified age-struc-tured models. Fisheries Research.
Costello, C., ovando, D., Hilborn, R., Gaines, S.D., Deschenes, o., and Lester, S.E. 2012. Status and solutions for the world’s unas-sessed fisheries. Science 338(6106): 517-520.
Dick, E.J., and MacCall, A.D. 2010. Estimates of sustainable yield for 50 data-poor stocks in the Pacific Coast groundfish fishery manage-ment plan. NoAA Technical Memorandum, NoAA-TM-NMFS-SWF-SC-460.
Dick, E.J., and MacCall, A.D. 2011. Depletion-based stock reduction analysis: A catch-based method for determining sustainable yields for data-poor fish stocks. Fisheries Research 110:331-341.
Ehrhardt, N.M, and Ault, J.S. 1992. Analysis of two length-based mor-tality models applied to bounded catch length frequencies. Transac-tions of the American Fisheries Society 121:115-122.
Essington, T.T., Kitchell, J.F., and C.J. Walters. 2001. The von Berta-lanffy growth function, bioenergetics, and the consumption rates of fish. Canadian Journal of Fisheries and Aquatic Sciences 58; 2129-2138.
Farmer, N.A., Malinowski, R.P., McGovern, M.J., and Rubec, P.J. 2014. Fisheries stock complexes in the Gulf of Mexico. Ma-rine and Coastal Fisheries (Special Issue: in Review). 50 pp.
Farmer, N.A., Mehta, N.K., Reichert, M.J.M., and Stephen, J.A. 2011. Species groupings for management of the South Atlantic Fishery Management Council Snapper-Grouper Fishery Management Unit. NoAA Fisheries Service, SERo-LAPP-2010-06. 40 pp.
Gedamke, T., Hoenig, J.M., DuPaul, W., Musick, J.A. 2008. Total mortality rates of the barndoor skate, Dipturus laevis, from the Gulf of Maine and Georges Bank, United States, 1963-2005. Fishery Research 89:17-25.
Gedamke, T., and Hoenig, J. M. 2006. Estimating mortality from mean length data in nonequilibrium situations, with application to the assessment of goosefish. Transactions of the American Fisheries Society 135:476–487.
Geromont, H.F., and Butterworth, D.S. 2014. Complex assess-ments or simple management procedures for efficient fisheries management: a comparative study. ICES Journal of Marine Science, doi:10.1093/icesjms/fsu017.
Gulf of Mexico Fishery Management Council. 2011. Generic annual catch limits/accountability measures amendment for the Gulf of Mexico Fishery Management Council’s red drum, reef fish, shrimp, coral and coral reefs fishery management plans.
Gulland, J.A. 1971. The Fish Resources of the Ocean. West Byfleet, Surrey, England: Fishing News (Books) Ltd.
Hoenig, J.M. 1983. Empirical use of longevity data to estimate mortal-ity rates. Fishery Bulletin 81(4):898-903.
Little, L.R., Wayte, S.E., Tuck, G.N., Smith, A.D.N., Klaer, N., Haddon, M., Fuller, M. 2011. Development and evaluation of a CPUE-based harvest control rule for the southern and eastern scalefish and shark fishery of Australia. ICES Journal of Marine Science 68:1699–1705.
Lombardi, L. and Walters, C. 2011. Stochastic Stock Reduction Analy-sis (SRA) User Guide. NoAA Fisheries Service, Southeast Fisheries Science Center, Panama City Laboratory, 3500 Delwood Beach Road, Panama City, Florida 32408. Panama City Laboratory Contribution 11-03. p. 26.

PAGe 36 | Improving the science and Management of Data-Limited Fisheries
MacCall, A.D. 2009. Depletion-corrected average catch: A simple formula for estimating sustainable yields in data-poor situations. ICES Journal of Marine Science 66:2267-2271.
Magnuson-Stevens Fishery Conservation and Management Act (MSF-CMA). 2007. 16 U.S.C. § 1801 et seq.
Martell, S., and Froese, R. 2013. A simple method for estimating MSY from catch and resilience. Fish and Fisheries 14:504-514.
McAllister, M.K., Pikitch, E.K., and Babcock, E.A. 2001. Using demo-graphic methods to construct Bayesian priors for the intrinsic rate of increase in the Schaefer model and implications for stock rebuilding. Canadian Journal of Fisheries and Aquatic Sciences 58: 1871-1890.
Mid-Atlantic Fishery Management Council. 2011. Amendment 13 to the Atlantic mackerel, squids, and butterfish fishery management plan. July, 2011.
Miller, T., and P. Rago. 2012. Empirical exploration of feasible bounds on Butterfish stock size and fishing mortality rates, 1975-2011. Report to the Mid-Atlantic Fishery Management Council Scientific and Statis-tical Committee. Northeast Fisheries Science Center, National Marine Fisheries Service. May 2, 2012.
National Marine Fisheries Service, Highly Migratory Species. 2010. Amendment 2 to the consolidated Atlantic highly migratory species fishery management plan.
New England Fishery Management Council. 2009. Amendment 3 to the fishery management plan for the northeast skate complex. November 30, 2009.
New England Fishery Management Council. 2011. Amendment 3 to the fishery management plan for deep-sea red crab.
Newman, D., Berkson, J., and Suatoni, L. 2014. Current Methods for Setting Catch Limits for Data-Limited Fish Stocks in the United States. Fisheries Research (Special Issue: in press).
North Pacific Fishery Management Council. 2013. North Pacific Groundfish Stock Assessment and Fishery Evaluation Reports for 2014.
Pacific Fishery Management Council. 2012. Final Environmental Impact Statement (FEIS) for Proposed Harvest Specifications and Management Measures for the 2013-2014 Pacific Coast Groundfish Fishery and Amendment 21-2 to the Pacific Coast Fishery Manage-ment Plan.
Pauly, D. 1980. on the interrelationships between natural mortality, growth parameters, and mean environmental temperature in 175 fish stocks. Journal du Conseil International pour l’Exploration de la Mer 39: 175–192.
Prince, J.D., Dowling, N.A., Davies, C.R., Campbell, R.A., and Kolody, D.S. 2011. A simple cost-effective and scale-less empirical approach to harvest strategies. ICES Journal of Marine Science 68:947–960.
Punt, A.E. and Ralston, S. 2007. A Management Strategy Evaluation of Rebuilding Revision Rules for overfished Rockfish Stocks. Biology, Assessment, and Management of North Pacific Rockfishes. Alaska Sea Grant College Program. AK-SG-07-01-2007: 329.
Ralston, S., Pearson, D.E., Field, J.C., and Key, M. 2010. Documenta-tion of the California catch reconstruction project. NoAA Technical Memorandum NoAA-TM-NMFS-SWFSC-461.
Ralston, S., Punt, A.E., Hamel, o.S., DeVore, J.D., and Conser, R J. 2011. A meta-analytic approach to quantifying scientific uncertainty in stock assessments. Fishery Bulletin 109:217–231.
Sabater, M. and Kleiber, P. 2014. Augmented catch-MSY approach to fishery management in coral-associated fisheries. In: Interrelation-ships between corals and fisheries. Bortone, S.A. (ed.). CRC Press.
Shertzer, K., Prager, M., and Williams, E. 2008. A probability-based approach to setting annual catch levels. Fishery Bulletin 106:225-232.
South Atlantic Fishery Management Council. 2011. Comprehensive annual catch limits (ACL) amendment for the South Atlantic Region.
Taylor, I., Cope, J., Hamel, o., Thorson, J. 2013. Deriving estimates of oFL for species in the ‘other Fish’ complex or potential alternative complexes. November 2013 PFMC Meeting, Agenda Item H.6.a, Supplemental Attachment 6.
Then, A.Y. 2014. Estimating fishing and natural mortality rates, and catchability coefficient, from a series of observations on mean length and fishing effort. Chapter 3 in Then, A.Y. Studies of Mortality Estima-tion. Ph.D. Diss., College of William and Mary, Gloucester Point, Virginia.
Then, A.Y., Hoenig, J.M., Hall, N.G., and Hewitt, D.A. 2014. Evaluat-ing the predictive performance of empirical estimators of natural mor-tality rate using information on over 200 fish species. ICES Journal of Marine Science doi: 10.1093/icesjms/fsu136.
Thorson, J.T. and Cope, J.M. 2014. Catch curve stock-reduction analysis: An alternative solution to the catch equations. Fisheries Research, available online 22 May 2014.
U.S. Senate, 2006. MSRA Senate Report, S. REP. 109-229, S. Rep No. 229, 109th Cong., 2nd Sess. 2006, 2006WL 861883, at *6.
Walters, C., Martell, S.J.D., 2002. Stock assessment needs for sustainable fisheries management. Bulletin of Marine Science 70: 629-638.
Walters, C.J., Martell, S.J.D., and Korman, J. 2006. A stochastic ap-proach to stock reduction analysis. Canadian Journal of Fisheries and Aquatic Science 63: 212–223.
Western Pacific Fishery Management Council. 2011a. omnibus Amendment for the Western Pacific Region to Establish a Process for Specifying Annual Catch Limits and Accountability Measures Includ-ing an Environmental Assessment; Amendment 1 to the Fishery Ecosystem Plan for the Pacific Remote Island Areas; Amendment 2 to the Fishery Ecosystem Plan for the American Samoa Archipelago; Amendment 2 to the Fishery Ecosystem Plan for the Mariana Archi-pelago; Amendment 3 to the Fishery Ecosystem Plan for the Hawaii Archipelago; Amendment 4 to the Fishery Ecosystem Plan for Pacific Pelagic Fisheries of the Western Pacific Region, February 24, 2011.
Western Pacific Fishery Management Council. 2011b. Annual Catch Limit Specifications and Accountability Measures for Pacific Islands Crustacean and Precious Coral Fisheries in 2012 and 2013, December 16, 2011.
Western Pacific Fishery Management Council. 2013. Annual Catch Limit Specifications and Accountability Measures for Pacific Islands Bottomfish Fisheries in 2013 and 2014, February 26, 2013.


Natural resources Defense council40 West 20th StreetNew York, NY 10011212 727-2700Fax 212 727-1773
Beijing
Chicago
Los Angeles
Bozeman
San Francisco
Washington, D.C.
www.nrdc.org Printed on recycled paper