nrc staff pre-filed hearing exhibit nrc049, u.s. energy
TRANSCRIPT

NRC049

ContactsThe International Energy Outlook 2011 was prepared under the general direction of John Conti, Assistant Administrator for Energy Analysis ([email protected], 202-586-2222), and Paul Holtberg, Team Leader, Analysis Integration Team ([email protected], 202-586-1284). General questions concerning the content of this report may be directed to the Office of Communications (202-586-8800). Specific questions about the report should be referred to Linda E. Doman ([email protected], 202-586-1041) or the following analysts:
World energy demand and economic outlook ..................................... Linda E. Doman ([email protected], 202-586-1041) Macroeconomic assumptions .............. Kay A. Smith ([email protected], 202-586-1132) Liquid fuels ......................................................... James O’Sullivan (james.o’[email protected], 202-586-2738) Production in Brazil ................................. Kenneth R. Vincent ([email protected], 202-586-6582)Natural gas ......................................................... Justine L. Barden ([email protected], 202-586-3508)
Phyllis D. Martin ([email protected], 202-586-9592) Natural gas prices in Europe ..................... Justine L. Barden ([email protected], 202-586-3508) Shale gas: Hydraulic fracturing
and environmental issues ........ Phillip Budzik ([email protected], 202-586-2847) International shale gas resources .............. Aloulou Fawzi ([email protected], 202-586-1344)Coal ...................................................................... Michael L. Mellish ([email protected], 202-586-2136)
Diane R. Kearney ([email protected], 202-586-2415) Electricity ............................................................ Brian T. Murphy ([email protected], 202-586-1398) Nuclear waste management ..................... Nancy Slater-Thompson ([email protected], 202-586-9322)Industrial sector ................................................ Peter Gross ([email protected], 202-586-8822)Transportation sector ..................................... Victoria V. Zaretskaya ([email protected], 202-287-5501)Energy-related carbon dioxide emissions .............................. Gwendolyn Jacobs ([email protected], 202-586-5847)
Diane R. Kearney ([email protected], 202-586-2415)
The following also contributed to the production of the IEO2011 report: Damien Gaul, Adrian Geagla, Perry Lindstrom, Lauren Mayne, Brooke McLeod, Charles L. Smith, Peggy Wells, and Emre M. Yucel. EIA also wishes to acknowledge the work done by summer intern Trevor Tatum.
Electronic access and related reportsIEO2011 will be available on the EIA Home Page (www.eia.gov/ieo) by September 19, 2011, including text, forecast tables, and graphics. To download the entire publication in Portable Document Format (PDF), go to www.eia.gov/ieo/pdf/0484(2011).pdf.For ordering information and questions on other energy statistics available from EIA, please contact EIA’s Office of Communications. Addresses and telephone numbers are as follows: Office of Communications, EI-40
U.S. Energy Information Administration Forrestal Building Washington, DC 20585
Telephone: 202-586-8800 E-mail: [email protected] 24-hour automated information line Website: www.eia.gov FAX: 202-586-0114
U.S. Energy Information Administration | International Energy Outlook 2011ii
PrefaceThe International Energy Outlook 2011 (IEO2011) presents an assessment by the U.S. Energy Information Administration (EIA) of the outlook for international energy markets through 2035. U.S. projections appearing in IEO2011 are consistent with those published in EIA’s Annual Energy Outlook 2011 (AEO2011) in April 2011. IEO2011 is provided as a service to energy managers and analysts, both in government and in the private sector. The projections are published pursuant to the Department of Energy Organization Act of 1977 (Public Law 95-91), Section 205(c).The IEO2011 consumption projections are divided according to Organization for Economic Cooperation and Development members (OECD)1 and non-members (non-OECD). OECD members are divided into three basic country groupings: OECD Americas (United States, Canada, and Mexico/Chile), OECD Europe, and OECD Asia (Japan, South Korea, and Australia/New Zealand). Non-OECD countries are divided into five separate regional subgroups: non-OECD Europe and Eurasia (which includes Russia); non-OECD Asia (which includes China and India); Middle East; Africa; and Central and South America (which includes Brazil). In some instances, the IEO2011 production models have different regional aggregations to reflect important production sources (for example, Middle East OPEC is a key region in the projections for liquids production). Complete regional definitions are listed in Appendix M.IEO2011 focuses exclusively on marketed energy. Non-marketed energy sources, which continue to play an important role in some developing countries, are not included in the estimates. The IEO2011 projections are based on U.S. and foreign government laws in effect as of the start of 2011. The potential impacts of pending or proposed legislation, regulations, and standards are not reflected in the projections, nor are the impacts of legislation for which the implementing mechanisms have not yet been announced.The report begins with a review of world trends in energy demand and the major macroeconomic assumptions used in deriving the IEO2011 projections, along with the major sources of uncertainty in the projections. The projections extend through 2035. The demand projections and macroeconomic outlook are discussed in Chapter 1, “World Energy Demand and Economic Outlook.”In addition to Reference case projections, IEO2011 includes several scenario cases that are used to estimate the impacts of oil prices and demand on global liquid fuel markets. The impact of alternative supply conditions on the projections is illustrated by the Traditional High and Traditional Low Oil Price cases. In addition, the impact of high and low non-OECD demand (where most of the uncertainty with respect to future energy markets lies) on world liquids markets is captured in the High Price and Low Price cases. All four cases are discussed in Chapter 2, “Liquid Fuels.” The discussion in Chapter 2 includes regional projections of liquids consumption and production (primarily petroleum).Chapters 3 and 4 review regional projections for natural gas and coal energy consumption and production, along with reviews of the current status of each fuel on a worldwide basis. Chapter 5 discusses the projections for world electricity markets—including nuclear power, hydropower, and other commercial renewable energy resources—and presents projections of world installed generating capacity. Chapter 6 provides a discussion of industrial sector energy use. Chapter 7 includes a detailed look at the world’s transportation energy use. Finally, Chapter 8 discusses the outlook for global energy-related carbon dioxide emissions.
1 OECD includes all members of the organization as of September 1, 2010, throughout all time series included in this report. Israel became a member on September 7, 2010, and Estonia became a member on December 9, 2010, but neither country’s membership is reflected in IEO2011.
Objectives of the IEO2011 projectionsThe projections in IEO2011 are not statements of what will happen, but what might happen given the specific assumptions and methodologies used for any particular scenario. The Reference case projection is a business-as-usual trend estimate, given known technology and technological and demographic trends. EIA explores the impacts of alternative assumptions in other scenarios with different macroeconomic growth rates and world oil prices. The IEO2011 cases generally assume that current laws and regulations are maintained throughout the projections. Thus, the projections provide policy-neutral baselines that can be used to analyze international energy markets.While energy markets are complex, energy models are simplified representations of energy production and consumption, regulations, and producer and consumer behavior. Projections are highly dependent on the data, methodologies, model structures, and assumptions used in their development. Behavioral characteristics are indicative of real-world tendencies, rather than representations of specific outcomes.Energy market projections are subject to much uncertainty. Many of the events that shape energy markets are random and cannot be anticipated. In addition, future developments in technologies, demographics, and resources cannot be foreseen with certainty. Key uncertainties in the IEO2011 projections are addressed through alternative cases.EIA has endeavored to make these projections as objective, reliable, and useful as possible. They should, however, serve as an adjunct to, not a substitute for, a complete and focused analysis of public policy initiatives.

iiiU.S. Energy Information Administration | International Energy Outlook 2011
Preface
Appendix A contains summary tables for the IEO2011 Reference case projections of world energy consumption, GDP, energy consumption by fuel, carbon dioxide emissions, and regional population growth. Summary tables of projections for the High and Low Oil Price cases are provided in Appendixes B and C, respectively. Reference case projections of delivered energy consumption by end-use sector and region are presented in Appendix D. Appendix E contains summary tables of projections for world liquids production in all cases. Appendix F contains summary tables of Reference case projections for installed electric power capacity by fuel and regional electricity generation. Appendix G contains summary tables for projections of world natural gas production in all cases. Appendix H includes a set of tables for each of the four Kaya Identity components. In Appendix I, a set of comparisons of projections from the International Energy Agency’s World Energy Outlook 2010 with the IEO2011 projections is presented. Comparisons of the IEO2011 and IEO2010 projections are also presented in Appendix I. Appendix J describes the models used to generate the IEO2011 projections, and Appendix K defines the regional designations included in the report.

This page inTenTionally lefT blank

vU.S. Energy Information Administration | International Energy Outlook 2011
ContentsHighlights .............................................................................................................................................................................................. 1
World energy markets by fuel type ............................................................................................................................................... 1World delivered energy use by sector ........................................................................................................................................... 5World carbon dioxide emissions ................................................................................................................................................... 6
World energy demand and economic outlook .................................................................................................................................... 9Overview ....................................................................................................................................................................................... 9Outlook for world energy consumption by source ......................................................................................................................... 10Delivered energy consumption by end-use sector ........................................................................................................................ 13World economic outlook ................................................................................................................................................................ 16
Liquid fuels ............................................................................................................................................................................................ 25Overview ....................................................................................................................................................................................... 25World oil prices ............................................................................................................................................................................. 25World liquids consumption ............................................................................................................................................................ 28Recent market trends.................................................................................................................................................................... 29World liquids production ................................................................................................................................................................ 30World oil reserves ......................................................................................................................................................................... 37
Natural gas ............................................................................................................................................................................................ 43Overview ....................................................................................................................................................................................... 43World natural gas consumption .................................................................................................................................................... 44World natural gas production ........................................................................................................................................................ 49World natural gas trade ................................................................................................................................................................. 57Reserves ....................................................................................................................................................................................... 63
Coal ........................................................................................................................................................................................................ 69Overview ....................................................................................................................................................................................... 69World coal consumption ................................................................................................................................................................ 69World coal production ................................................................................................................................................................... 73World coal trade ............................................................................................................................................................................ 74World coal reserves ...................................................................................................................................................................... 79
Electricity ............................................................................................................................................................................................... 85Overview ....................................................................................................................................................................................... 85Electricity supply by energy source............................................................................................................................................... 86Regional electricity outlooks ......................................................................................................................................................... 91
Industrial sector energy consumption ................................................................................................................................................. 107Overview ....................................................................................................................................................................................... 107Energy-intensive industries ........................................................................................................................................................... 109Regional industrial energy outlooks .............................................................................................................................................. 111
Transportation sector energy consumption ........................................................................................................................................ 119Overview ....................................................................................................................................................................................... 119OECD countries ............................................................................................................................................................................ 120Non-OECD Countries ................................................................................................................................................................... 125
Energy-related carbon dioxide emissions ........................................................................................................................................... 139Overview ....................................................................................................................................................................................... 139Emissions by fuel ......................................................................................................................................................................... 139Emissions by region ...................................................................................................................................................................... 140Cumulative carbon dioxide emissions........................................................................................................................................... 143Factors influencing trends in energy-related carbon dioxide emissions ....................................................................................... 143The Kaya decomposition of emissions trends .............................................................................................................................. 144
Data Sources ......................................................................................................................................................................................... 147

U.S. Energy Information Administration | International Energy Outlook 2011vi
Contents
Tables
World energy demand and economic outlook 1. World energy consumption by country grouping, 2008-2035 ................................................................................................... 9 2. World gross domestic product by country grouping, 2008-2035 .............................................................................................. 16
Liquid fuels 3. World liquid fuels production in the Reference case, 2008-2035 ............................................................................................. 26 4. World oil prices in four cases, 2009-2035 ................................................................................................................................ 28 5. World oil reserves by country as of January 1, 2011 ............................................................................................................... 38
Natural gas 6. World natural gas production by region/country in the Reference case, 2008-2035 ............................................................... 50 7. World natural gas reserves by country as of January 1, 2011 ................................................................................................. 64
Coal 8. World coal production by region, 2008-2035 ........................................................................................................................... 73 9. World coal flows by importing and exporting regions, Reference case, 2009, 2020, and 2035 ............................................... 75 10. World recoverable coal reserves as of January 1, 2009 .......................................................................................................... 80
Electricity 11. OECD and non-OECD net electricity generation by energy source, 2008-2035 ..................................................................... 86 12. Approaches to nuclear waste management in selected countries ........................................................................................... 90 13. OECD and non-OECD net renewable electricity generation by energy source, 2008-2035 .................................................... 91
Industrial sector energy consumption 14. World industrial delivered energy use by region and energy source, 2008-2035 .................................................................... 107
Transportation sector energy consumption 15. Transportation energy use by region, 2008-2035 .................................................................................................................... 120 16. Tax incentives for hybrid and electric vehicles in OECD Europe, 2010 ................................................................................... 123
Energy-related carbon dioxide emissions 17. Emissions mitigation goals announced by selected countries ................................................................................................. 142 18. Average annual changes in Kaya decomposition factors, 2008-2035 ..................................................................................... 145
AppendixesA. Reference case projections...................................................................................................................................................... 155B. High Oil Price case projections ................................................................................................................................................ 173C. Low Oil Price case projections ................................................................................................................................................. 189D. Reference case projections by end-use sector and country grouping ..................................................................................... 205E. Projections of liquid fuels and other petroleum production in five cases.................................................................................. 227F. Reference case projections for electricity capacity and generation by fuel.............................................................................. 249G. Reference case projections for natural gas production ............................................................................................................ 273H. Kaya Identity factor projections ................................................................................................................................................ 279I. Comparisons with International Energy Agency and IEO2010 projections .............................................................................. 285J. Models used to generate the IEO2011 projections .................................................................................................................. 289K. Regional definitions .................................................................................................................................................................. 291
Figures
Highlights 1. World energy consumption, 1990-2035 ................................................................................................................................... 1 2. World energy consumption by fuel, 1990-2035 ........................................................................................................................ 2 3. World liquids consumption by sector, 2008-2035 ..................................................................................................................... 2 4. Natural gas production in China, Canada, and the United States, 2008 and 2035 ................................................................. 3 5. World coal consumption by region, 1990-2035 ........................................................................................................................ 3 6. World net electricity generation by fuel type, 2008-2035 ......................................................................................................... 4 7. World nuclear generating capacity, 2008 and 2035 ................................................................................................................. 5 8. World industrial delivered energy consumption, 2008-2035 .................................................................................................... 5 9. World transportation delivered energy consumption, 2008-2035 ............................................................................................. 6 10. World energy-related carbon dioxide emissions by fuel, 1990-2035 ....................................................................................... 6 11. World carbon dioxide emissions per capita, 1990-2035 .......................................................................................................... 7

viiU.S. Energy Information Administration | International Energy Outlook 2011
Contents
World energy demand and economic outlook 12. World energy consumption, 1990-2035 ................................................................................................................................... 10 13. Energy consumption in the United States, China, and India, 1990-2035 ................................................................................ 10 14. Non-OECD energy consumption, 1990-2035 .......................................................................................................................... 10 15. World energy consumption by fuel, 1990-2035 ........................................................................................................................ 11 16. World natural gas consumption by end-use sector, 2008-2035 ............................................................................................... 11 17. World net electricity generation by fuel type, 2008-2035 ......................................................................................................... 12 18. Renewable electricity generation in China by source, 2008-2035 ........................................................................................... 12 19. World nuclear generating capacity, 2008 and 2035 ................................................................................................................. 13 20. World delivered residential energy consumption, 2008-2035 .................................................................................................. 14 21. World delivered commercial energy consumption, 2008-2035 ................................................................................................ 15 22. World delivered industrial energy consumption, 2008-2035 .................................................................................................... 15 23. World delivered transportation energy consumption, 2008-2035 ............................................................................................. 17 24. OECD and non-OECD total gross domestic product, 1990-2035 ............................................................................................ 17 25. OECD gross domestic product growth rates by country grouping, 2008-2035 ........................................................................ 17 26. Non-OECD gross domestic product growth rates by country grouping, 2008-2035 ................................................................ 19
Liquid fuels 27. World liquid fuels consumption by region, 1990-2035 ............................................................................................................. 25 28. World liquid fuels production, 1990-2035 ................................................................................................................................. 25 29. Non-OPEC liquids production by region, 2008 and 2035 ........................................................................................................ 27 30. Unconventional liquids production by fuel type, 2008 and 2035 .............................................................................................. 27 31. World oil prices in three cases, 1990-2035 .............................................................................................................................. 27 32. World liquid fuels production in five cases, 2008 and 2035 ..................................................................................................... 27 33. World liquids consumption by sector, 2008-2035 ..................................................................................................................... 29 34. World liquids consumption by region and country group, 2008 and 2035 ............................................................................... 29 35. World total liquid fuels production, 1990-2035 ......................................................................................................................... 30 36. Non-OPEC conventional liquids production by region, 2008 and 2035 ................................................................................... 31 37. OPEC conventional liquids production by country and region, 2008 and 2035 ....................................................................... 35 38. Unconventional liquids production in five cases, 2008 and 2035 ............................................................................................ 36 39. World proved oil reserves by geographic region as of January 1, 2011 .................................................................................. 38
Natural gas 40. World natural gas consumption, 2008-2035 ............................................................................................................................ 43 41. Change in world natural gas production by region, 2008-2035 ............................................................................................... 43 42. Natural gas production in China, Canada, and the United States, 2008 and 2035 ................................................................. 44 43. Natural gas consumption in OECD Americas by country, 2008-2035 ...................................................................................... 44 44. Natural gas consumption in OECD Europe by end-use sector, 2008-2035 ............................................................................. 45 45. Natural gas consumption in OECD Asia by country and end-use sector, 2008 and 2035 ....................................................... 45 46. Natural gas consumption in non-OECD Europe and Eurasia, 2008-2035 ............................................................................... 48 47. Natural gas consumption in non-OECD Asia by country, 2008-2035 ....................................................................................... 48 48. OECD natural gas production by country, 1990-2035 .............................................................................................................. 51 49. OECD Europe natural gas production, 1990-2035 .................................................................................................................. 51 50. Middle East natural gas production, 1990-2035....................................................................................................................... 54 51. Non-OECD Europe and Eurasia natural gas production, 1992-2035 ...................................................................................... 54 52. Africa natural gas production, 1990-2035 ................................................................................................................................ 55 53. Non-OECD Asia natural gas production, 1990-2035 ............................................................................................................... 56 54. China natural gas production, 1990-2035 ................................................................................................................................ 56 55. Non-OECD Central and South America natural gas production, 1990-2035 ........................................................................... 57 56. OECD Americas net natural gas trade, 2008-2035 .................................................................................................................. 58 57. OECD Asia net natural gas trade, 2008-2035 .......................................................................................................................... 60 58. Non-OECD Europe and Eurasia net natural gas trade, 2008-2035 ......................................................................................... 61 59. Middle East net natural gas trade, 2008-2035 ......................................................................................................................... 61 60. Africa net natural gas trade, 2008-2035 ................................................................................................................................... 62 61. Non-OECD Asia net natural gas trade, 2008-2035 .................................................................................................................. 63 62. Non-OECD Central and South America net natural gas trade, 2008-2035 .............................................................................. 63 63. World natural gas reserves by region, 1980-2011 ................................................................................................................... 64 64. World natural gas reserves by geographic region as of January 1, 2011 ................................................................................ 64
Coal 65. World coal consumption by region, 1980-2035 ........................................................................................................................ 69 66. Coal share of world energy consumption by sector, 2008, 2020 and 2035 ............................................................................. 69 67. OECD coal consumption by region, 1980, 2008, 2020 and 2035 ............................................................................................ 70
Figures (continued)

U.S. Energy Information Administration | International Energy Outlook 2011viii
Contents
68. Non-OECD coal consumption by region, 1980, 2008, 2020 and 2035 .................................................................................... 71 69. Coal share of China’s energy consumption by sector, 2008, 2020, and 2035 ......................................................................... 71 70. World coal imports by major importing region, 1995-2035 ....................................................................................................... 74 71. Coal imports to Asia by major importing region, 2008 and 2035.............................................................................................. 74
Electricity 72. Growth in world electricity generation and total delivered energy consumption, 1990-2035 ................................................... 85 73. OECD and non-OECD net electricity generation, 1990-2035 .................................................................................................. 85 74. Non-OECD net electricity generation by region, 1990-2035 .................................................................................................... 86 75. World net electricity generation by fuel, 2008-2035 ................................................................................................................. 87 76. World net electricity generation from nuclear power by region, 2008-2035 ............................................................................. 88 77. OECD Americas net electricity generation by region, 2008-2035 ............................................................................................ 92 78. OECD Americas net electricity generation by fuel, 2008 and 2035 ......................................................................................... 92 79. OECD Europe net electricity generation by fuel, 2008-2035 ................................................................................................... 94 80. OECD Asia net electricity generation by region, 2008-2035 .................................................................................................... 95 81. Non-OECD Europe and Eurasia net electricity generation by region, 2008-2035 ................................................................... 96 82. Non-OECD Asia net electricity generation by fuel, 2008-2035 ................................................................................................ 97 83. Middle East net electricity generation by fuel, 2008-2035........................................................................................................ 99 84. Net electricity generation in Africa by fuel, 2008-2035 ............................................................................................................. 100 85. Net electricity generation in Brazil by fuel, 2008-2035 ............................................................................................................. 101 86. Other Central and South America net electricity generation by fuel, 2008-2035 ..................................................................... 101
Industrial sector energy consumption 87. Annual changes in world industrial and all other end-use energy consumption from previous year, 2007-2011 .................... 108 88. World delivered energy consumption in the industrial and all other end-use sectors, 2005-2035 ........................................... 108 89. OECD and non-OECD industrial sector energy consumption, 2008-2035 .............................................................................. 108 90. World industrial sector energy consumption by fuel, 2008 and 2035 ....................................................................................... 109 91. OECD industrial sector energy consumption by fuel, 2008 and 2035...................................................................................... 109 92. Non-OECD industrial sector energy consumption by fuel, 2008 and 2035 .............................................................................. 109 93. World industrial sector energy consumption by major energy-intensive industry shares, 2008 ............................................... 110 94. OECD and non-OECD major steel producers, 2009................................................................................................................ 110 95. U.S.industrial sector energy consumption by fuel, 2008 and 2035 .......................................................................................... 112 96. Canada industrial sector energy consumption by fuel, 2008 and 2035 ................................................................................... 112 97. OECD Europe industrial sector energy consumption by fuel, 2008 and 2035 ......................................................................... 113 98. Australia/New Zealand industrial sector energy consumption by fuel, 2008 and 2035 ............................................................ 114 99. China industrial sector energy consumption by fuel, 2008 and 2035 ...................................................................................... 114 100. Brazil industrial sector energy consumption by fuel, 2008 and 2035 ....................................................................................... 116
Transportation sector energy consumption 101. World liquids consumption by end-use sector, 2008-2035 ....................................................................................................... 119 102. OECD and non-OECD transportation sector liquids consumption, 2008-2035........................................................................ 119 103. OECD Americas transportation energy use by country, 2008 and 2035 .................................................................................. 121 104. OECD Asia transportation energy use by country, 2008-2035 ................................................................................................. 124 105. Non-OECD transportation energy use by region, 2008-2035 .................................................................................................. 125 106. Non-OECD Asia transportation energy use by country, 2008-2035 ......................................................................................... 126 107. Non-OECD Europe and Eurasia transportation energy use by country, 2008-2035 ................................................................ 129 108. Transportation energy use in the Middle East and Africa, 2008-2035 ..................................................................................... 129 109. Central and South America transportation energy use by country, 2008-2035 ........................................................................ 131
Energy-related carbon dioxide emissions 110. World energy-related carbon dioxide emissions, 1990-2035 ................................................................................................... 139 111. World energy-related carbon dioxide emissions by fuel type, 1990-2035 ................................................................................ 139 112. OECD and non-OECD energy-related carbon dioxide emissions by fuel type, 1990-2035 ..................................................... 140 113. Average annual growth of energy-related carbon dioxide emissions in OECD economies, 2008-2035 .................................. 140 114. Average annual growth of energy-related carbon dioxide emissions in non-OECD economies, 2008-2035 ........................... 140 115. Increases in carbon dioxide emissions by fuel type for regions with highest absolute emissions growth, 2008-2035 ............ 143 116. Cumulative carbon dioxide emissions by region, 1991-2005, 2006-2020, and 2021-2035 ..................................................... 143 117. Average annual changes in Kaya decomposition components of non-OECD carbon dioxide emissions growth,
1990-2008 and 2008-2035 ....................................................................................................................................................... 145 118. Average annual changes in Kaya decomposition components of OECD carbon dioxide emissions growth,
1990-2008 and 2008-2035 ....................................................................................................................................................... 145
Figures (continued)

1U.S. Energy Information Administration | International Energy Outlook 2011
HighlightsIn the IEO2011 Reference case, which does not incorporate prospective legislation or policies that might affect energy markets, world marketed energy consumption grows by 53 percent from 2008 to 2035. Total world energy use rises from 505 quadrillion British thermal units (Btu) in 2008 to 619 quadrillion Btu in 2020 and 770 quadrillion Btu in 2035 (Figure 1). Much of the growth in energy consumption occurs in countries outside the Organization for Economic Cooperation and Development (non-OECD nations),2 where demand is driven by strong long-term economic growth. Energy use in non-OECD nations increases by 85 percent in the Reference case, as compared with an increase of 18 percent for the OECD economies.Although the world continues to recover from the 2008-2009 global recession, the recovery is uneven. In advanced economies, recovery has been slow in comparison with recoveries from past recessions. Unemployment is still high among the advanced economies, and real estate markets and household income growth remain weak. Debt levels in a number of small economies of the European Union—Greece, Ireland, and Portugal—required European Union intervention to avert defaults. Concerns about fiscal sustainability and financial turbulence suggest that economic recovery in the OECD countries will not be accompanied by the higher growth rates associated with past recoveries. In contrast, growth remains high in many emerging economies, in part driven by strong capital inflows and high commodity prices; however, inflation pressures remain a particular concern, along with the need to rebalance external trade in key developing economies.Beyond the pace and timing of the world’s economic recovery, other events have compounded the uncertainty associated with this year’s energy outlook. Oil prices rose in 2010 as a result of growing demand associated with signs of economic recovery and a lack of a sufficient supply response. Prices were driven even higher at the end of 2010 and into 2011 as social and political unrest unfolded in several Middle Eastern and African economies. Oil prices increased from about $82 per barrel3 at the end of November 2010 to more than $112 per barrel in day trading on April 8, 2011. The impacts of quickly rising prices and possible regional supply disruptions add substantial uncertainty to the near-term outlook. In 2011, the price of light sweet crude oil in the United States (in real 2009 dollars) is expected to average $100 per barrel, and with prices expected to continue increasing in the long term, the price reaches $108 per barrel in 2020 and $125 per barrel in 2035 in the IEO2011 Reference case.The aftermath of the devastating earthquake and tsunami that struck northeastern Japan on March 11, 2011—which resulted in extensive loss of life and infrastructure damage, including severe damage to several nuclear reactors at Fukushima Daiichi—provides another major source of uncertainty in IEO2011. The near-term outlook for Japan’s economy is lower than the already sluggish growth that was projected before the events, but the impact on the rest of Asia and on world economic health as a whole probably will be relatively small, given that Japan has not been a major factor in regional economic growth in recent years. However, the event may have more profound implications for the future of world nuclear power. The IEO2011 projections do not reflect the possible ramifications of Fukushima for the long-term global development of nuclear power or the policies that some
countries have already adopted in its aftermath with respect to the continued operation of existing nuclear plants.
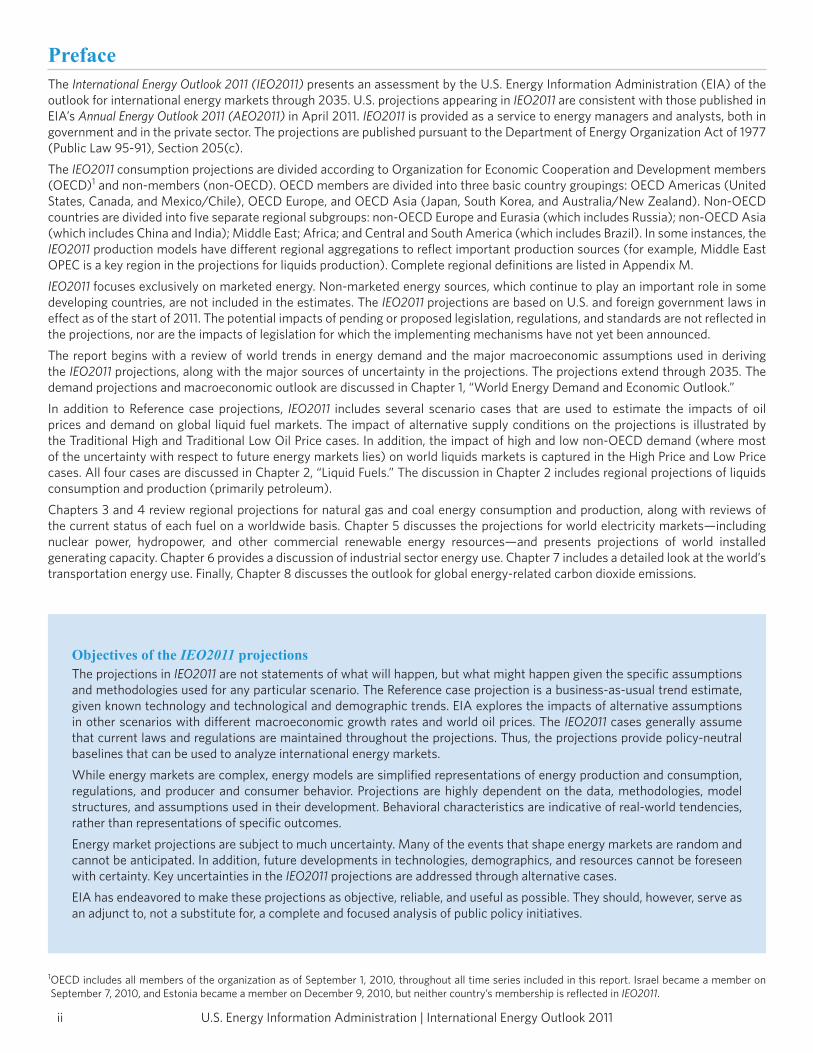
World energy markets by fuel typeIn the long-term, the IEO2011 Reference case projects increased world consumption of marketed energy from all fuel sources through 2035 (Figure 2). Fossil fuels are expected to continue supplying much of the energy used worldwide. Although liquid fuels—mostly petroleum based—remain the largest source of energy, the liquids share of world marketed energy consumption falls from 34 percent in 2008 to 29 percent in 2035, as projected high world oil prices lead many energy users to switch away from liquid fuels when feasible. Renewable energy is the world’s fastest growing form of energy, and the renewable share of total energy use increases from 10 percent in 2008 to 14 percent in 2035 in the Reference case.
Liquid fuelsWorld use of petroleum and other liquids4 grows from 85.7 million barrels per day in 2008 to 97.6 million barrels per day
2 Current OECD member countries (as of September 1, 2010) are the United States, Canada, Mexico, Austria, Belgium, Chile, Czech Republic, Denmark, Finland, France, Germany, Greece, Hungary, Iceland, Ireland, Italy, Luxembourg, the Netherlands, Norway, Poland, Portugal, Slovakia, Slovenia, Spain, Sweden, Switzerland, Turkey, the United Kingdom, Japan, South Korea, Australia, and New Zealand. Israel became a member on September 7, 2010, and Estonia became a member on December 9, 2010, but neither country’s membership is reflected in IEO2011.
3 Nominal dollars per barrel of West Texas Intermediate crude oil at Cushing, Oklahoma.4 Petroleum and other liquid fuels include petroleum-derived fuels and non-petroleum-derived liquid fuels, such as ethanol and biodiesel, coal-to-liquids, and gas-to-liquids. Petroleum coke, which is a solid, is included. Also included are natural gas liquids, crude oil consumed as a fuel, and liquid hydrogen.
0
200
400
600
800
1990 2000 2008 2015 2020 2025 2030 2035
354406
505
573619
671721
770
OECD
Non-OECD
Figure 1. World energy consumption, 1990-2035 (quadrillion Btu)
U.S. Energy Information Administration | International Energy Outlook 20112
Highlights
in 2020 and 112.2 million barrels per day in 2035. In the Reference case, most of the growth in liquids use is in the transportation sector, where, in the absence of significant technological advances, liquids continue to provide much of the energy consumed. Liquid fuels remain an important energy source for transportation and industrial sector processes. Despite rising fuel prices, use of liquids for transportation increases by an average of 1.4 percent per year, or 46 percent overall from 2008 to 2035. The transportation sector accounts for 82 percent of the total increase in liquid fuel use from 2008 to 2035, with the remaining portion of the growth attributable to the industrial sector (Figure 3). The use of liquids declines in the other end-use sectors and for electric power generation.To meet the increase in world demand in the Reference case, liquids production (including both conventional and unconventional liquids supplies) increases by a total of 26.6 million barrels per day from 2008 to 2035. The Reference case assumes that OPEC countries will invest in incremental production capacity in order to maintain a share of approximately 40 percent of total world liquids production through 2035, consistent with their share over the past 15 years. Increasing volumes of conventional liquids (crude oil and lease condensate, natural gas plant liquids, and refinery gain) from OPEC producers contribute 10.3 million barrels per day to the total increase in world liquids production, and conventional supplies from non-OPEC countries add another 7.1 million barrels per day.Unconventional resources (including oil sands, extra-heavy oil, biofuels, coal-to-liquids, gas-to-liquids, and shale oil) from both OPEC and non-OPEC sources grow on average by 4.6 percent per year over the projection period. Sustained high oil prices allow unconventional resources to become economically competitive, particularly when geopolitical or other “above ground” constraints5 limit access to prospective conventional resources. World production of unconventional liquid fuels, which totaled only 3.9 million barrels per day in 2008, increases to 13.1 million barrels per day and accounts for 12 percent of total world liquids supply in 2035. The largest components of future unconventional production are 4.8 million barrels per day of Canadian oil sands, 2.2 and 1.7 million barrels per day of U.S. and Brazilian biofuels, respectively, and 1.4 million barrels per day of Venezuelan extra-heavy oil. Those four contributors to unconventional liquids supply account for almost three-quarters of the increase over the projection period.
Natural gasWorld natural gas consumption increases by 52 percent in the Reference case, from 111 trillion cubic feet in 2008 to 169 trillion cubic feet in 2035. Although the global recession resulted in an estimated decline of 2.0 trillion cubic feet in natural gas use in 2009, robust demand returned in 2010, and consumption exceeded the level recorded before the downturn. Natural gas continues to be the fuel of choice for many regions of the world in the electric power and industrial sectors, in part because its relatively low carbon intensity compared with oil and coal makes it an attractive option for nations interested in reducing greenhouse gas emissions. In the power sector, low capital costs and fuel efficiency also favor natural gas.In the IEO2011 Reference case, the major projected increase in natural gas production occurs in non-OECD regions, with the largest increments coming from the Middle East (an increase of 15 trillion cubic feet between 2008 and 2035), Africa (7 trillion cubic feet), and non-OECD Europe and Eurasia, including Russia and the other former Soviet Republics (9 trillion cubic feet). Over the projection period, Iran and Qatar alone increase their natural gas production by a combined 11 trillion cubic feet, nearly 20 percent of the total increment in world gas production. A significant share of the increase is expected to come from a single offshore field, which is called North Field on the Qatari side and South Pars on the Iranian side.
5 “Above-ground” constraints refer to those nongeological factors that might affect supply, including: government policies that limit access to resources; conflict; terrorist activity; lack of technological advances or access to technology; price constraints on the economical development of resources; labor shortages; materials shortages; weather; environmental protection actions; and other short- and long-term geopolitical considerations.
0
25
50
75
100
125
2008 2015 2020 2025 2030 2035
Transportation
Electric power
Industrial
Buildings
Figure 3. World liquids consumption by sector, 2008-2035 (million barrels per day)
0
50
100
150
200
250
1990 2000 2008 2015 2025 2035
Liquids
Coal
Natural gas
Renewables
Nuclear
2008History Projections
Figure 2. World energy consumption by fuel, 1990-2035 (quadrillion Btu)

3U.S. Energy Information Administration | International Energy Outlook 2011
Highlights
Contributing to the strong competitive position of natural gas among other energy sources is a strong growth outlook for reserves and supplies. Significant changes in natural gas supplies and global markets occur with the expansion of liquefied natural gas (LNG) production capacity and as new drilling techniques and other efficiencies make production from many shale basins economical worldwide. The net impact is a significant increase in resource availability, which contributes to lower prices and higher demand for natural gas in the projection.Although the extent of the world’s unconventional natural gas resources—tight gas, shale gas, and coalbed methane—have not yet been assessed fully, the IEO2011 Reference case projects a substantial increase in those supplies, especially from the United States but also from Canada and China. An initial assessment of shale gas resources in 32 countries was released by EIA in April 2011.6 The report found that technically recoverable shale gas resources in the assessed shale gas basins and the United States amount to 6,622 trillion cubic feet. To put the shale gas resource estimate in perspective, according to the Oil & Gas Journal7 world proven reserves of natural gas as of January 1, 2011, are about 6,675 trillion cubic feet, and world technically recoverable gas resources—largely excluding shale gas—are roughly 16,000 trillion cubic feet.Rising estimates of shale gas resources have helped to increase total U.S. natural gas reserves by almost 50 percent over the past decade, and shale gas rises to 47 percent of U.S. natural gas production in 2035 in the IEO2011 Reference case. Adding production of tight gas and coalbed methane, U.S. unconventional natural gas production rises from 10.9 trillion cubic feet in 2008 to 19.8 trillion cubic feet in 2035. Unconventional natural gas resources are even more important for the future of domestic gas supplies in Canada and China, where they account for 50 percent and 72 percent of total domestic production, respectively, in 2035 in the Reference case (Figure 4).
World natural gas trade, both by pipeline and by shipment in the form of LNG, is poised to increase in the future. Most of the projected increase in LNG supply comes from the Middle East and Australia, where a number of new liquefaction projects are expected to become operational within the next decade. Additionally, several LNG export projects have been proposed for western Canada, and there are also proposals to convert underutilized LNG import facilities in the United States to liquefaction and export facilities for domestically sourced natural gas. In the IEO2011 Reference case, world liquefaction capacity more than doubles, from about 8 trillion cubic feet in 2008 to 19 trillion cubic feet in 2035. In addition, new pipelines currently under construction or planned will increase natural gas exports from Africa to European markets and from Eurasia to China.
CoalIn the absence of national policies and/or binding international agreements that would limit or reduce greenhouse gas emissions, world coal consumption is projected to increase from 139 quadrillion Btu in 2008 to 209 quadrillion Btu in 2035, at an average annual rate of 1.5 percent. Regional growth rates are uneven, with little growth in coal consumption in OECD nations but robust growth in non-OECD nations, particularly among the Asian economies (Figure 5).Strong economic growth and large domestic coal reserves in China and India lead to a substantial increase in their coal use for electric power and industrial processes. Installed coal-fired generating capacity in China nearly doubles in the Reference case from 2008 to 2035, and coal use in China’s industrial sector grows by 67 percent. The development of China’s electric power and
6 U.S. Energy Information Administration, World Shale Gas Resources: An Initial Assessment of 14 Regions Outside the United States (Washington, DC, April 2011), website www.eia.gov/analysis/studies/worldshalegas/index.cfm#7.
7 “Worldwide Look at Reserves and Production,” Oil & Gas Journal, Vol. 106, No. 47 (December 6, 2010), pp. 46-49, website www.ogj.com (subscription site), adjusted with the EIA release of proved reserve estimates as of December 31, 2010.
Unconventional(tight gas, shale gas, coalbed methane)
0
10
20
30
2008 2035 2008 2035 2008 2035
Conventional(all other gas)
China Canada United States
Figure 4. Natural gas production in China, Canada, and the United States, 2008 and 2035 (trillion cubic feet)
2008History Projections
0
50
100
150
1990 2000 2008 2015 2025 2035
Non-OECD Asia
OECD
Rest of world
Figure 5. World coal consumption by region, 1990-2035 (quadrillion Btu)

U.S. Energy Information Administration | International Energy Outlook 20114
Highlights
industrial sectors will require not only large-scale infrastructure investments but also substantial investment in both coal mining and coal transportation infrastructure. In India, coal-fired generating capacity rises from 99 gigawatts in 2008 to 172 gigawatts in 2035, a 72-percent increase, while industrial sector coal use grows by 94 percent.
ElectricityWorld net electricity generation increases by 84 percent in the IEO2011 Reference case, from 19.1 trillion kilowatthours in 2008 to 25.5 trillion kilowatthours in 2020 and 35.2 trillion kilowatthours in 2035. Although the 2008-2009 global economic recession slowed the rate of growth in electricity use in 2008 and resulted in negligible change in electricity use in 2009, demand returned in 2010, led by strong recoveries in non-OECD economies. In general, in OECD countries, where electricity markets are well established and consumption patterns are mature, the growth of electricity demand is slower than in non-OECD countries, where a large amount of potential demand remains unmet. Total net electricity generation in non-OECD countries increases by an average of 3.3 percent per year in the Reference case, led by non-OECD Asia (including China and India), where annual increases average 4.0 percent from 2008 to 2035. In contrast, net generation among OECD nations grows by an average of 1.2 percent per year from 2008 to 2035.In many parts of the world, concerns about security of energy supplies and the environmental consequences of greenhouse gas emissions have spurred government policies that support a projected increase in renewable energy sources. As a result, renewable energy sources are the fastest growing sources of electricity generation in the IEO2011 Reference case at 3.1 percent per year from 2008 to 2035 (Figure 6). Natural gas is the second fastest growing generation source, increasing by 2.6 percent per year. An increase in unconventional natural gas resources, particularly in North America but elsewhere as well, helps keep global markets well supplied and prices competitive. Future generation from renewables, natural gas, and to a lesser extent nuclear power largely displaces coal-fired generation, although coal remains the largest source of world electricity through 2035.More than 82 percent of the increase in renewable generation is in the form of hydroelectric power and wind power. The contribution of wind energy, in particular, has grown swiftly over the past decade, from 18 gigawatts of net installed capacity at the end of 2000 to 121 gigawatts at the end of 2008—a trend that continues into the future. Of the 4.6 trillion kilowatthours of new renewable generation added over the projection period, 2.5 trillion kilowatthours (55 percent) is attributed to hydroelectric power and 1.3 trillion kilowatthours (27percent) to wind. The majority of the hydroelectric growth (85 percent) occurs in the non-OECD countries, while a slight majority of wind generation growth (58 percent) occurs in the OECD. High construction costs can make the total cost to build and operate renewable generators higher than those for conventional plants. The intermittence of wind and solar, in particular, can further hinder the economic competitiveness of those resources, as they are not operator-controlled and are not necessarily available when they would be of greatest value to the system. However, improving battery storage technology and dispersing wind and solar generating facilities over wide geographic areas could mitigate many of the problems associated with intermittency over the projection period.Electricity generation from nuclear power worldwide increases from 2.6 trillion kilowatthours in 2008 to 4.9 trillion kilowatthours in 2035 in the IEO2011 Reference case, as concerns about energy security and greenhouse gas emissions support the development of new nuclear generating capacity. In addition, world average capacity utilization rates have continued to rise over time, from about 65 percent in 1990 to about 80 percent today, with some increases still anticipated in the future.There is still considerable uncertainty about the future of nuclear power, and a number of issues could slow the development of new nuclear power plants. Issues related to plant safety, radioactive waste disposal, and proliferation of nuclear materials continue
to raise public concerns in many countries and may hinder plans for new installations. High capital and maintenance costs also may keep some countries from expanding their nuclear power programs. In addition, a lack of trained labor resources, as well as limited global manufacturing capacity for certain components, could keep national nuclear programs from advancing quickly. Finally, although the long-term implications of the disaster at Japan’s Fukushima Daiichi nuclear power plant for world nuclear power development are unknown, Germany, Switzerland, and Italy have already announced plans to phase out or cancel all their existing and future reactors. Those plans, and new policies that other countries may adopt in response to the disaster at the Fukushima Daiichi plant, although not reflected in the IEO2011 projections, indicate that some reduction in the projection for nuclear power should be expected.In the Reference case, 75 percent of the world expansion in installed nuclear power capacity occurs in non-OECD countries (Figure 7). China, Russia, and India account for the
0
10
20
30
40
2008 2015 2020 2025 2030 2035Liquids
Coal
Natural gas
Renewables
Nuclear
Hydropower
Figure 6. World net electricity generation by fuel type, 2008-2035 (trillion kilowatthours)

5U.S. Energy Information Administration | International Energy Outlook 2011
Highlights
largest increment in world net installed nuclear power from 2008 to 2035: China adds 106 gigawatts of nuclear capacity over the period, Russia 28 gigawatts, and India 24 gigawatts.
World delivered energy use by sectorThis section discusses delivered energy use in the buildings, industrial, and transportation sectors; it does not include losses associated with electricity generation and transmission.
Residential and commercial buildingsWorld residential energy use increases by 1.1 percent per year, from 52 quadrillion Btu in 2008 to 69 quadrillion Btu in 2035 in the IEO2011 Reference case. Much of the growth in residential energy consumption occurs in non-OECD nations, where robust economic growth improves standards of living and increases demand for residential energy. One factor contributing to increased demand in non-OECD nations is the trend toward replacing nonmarketed energy sources (including wood and waste, which are not fully included in the energy demand totals shown in the IEO) with marketed fuels, such as propane and electricity, for cooking and heating. Non-OECD residential energy consumption rises by 1.9 percent per year, compared with the much slower rate of 0.3 percent per year for OECD countries, where patterns of residential energy use already are well established, and slower population growth and aging populations translate to smaller increases in energy demand.Globally, IEO2011 projects average growth in commercial energy use of 1.5 percent per year through 2035, with the largest share of growth in non-OECD nations. OECD commercial energy use expands by 0.8 percent per year. Slow expansion of GDP and low or declining population growth in many OECD nations contribute to slower anticipated rates of growth in commercial energy demand. In addition, continued efficiency improvements moderate the growth of energy demand over time, as relatively inefficient equipment is replaced with newer, more efficient stock.In non-OECD nations, economic activity and commerce increase rapidly over the 2008-2035 projection period, fueling additional demand for energy in the service sectors. Total delivered commercial energy use among non-OECD nations is projected to grow by 2.8 percent per year from 2008 to 2035. Population growth also is expected to be more rapid than in OECD countries, portending increases in the need for education, health care, and social services and the energy required to provide them. In addition, as developing nations mature, they are expected to transition to more service-related enterprises, which will increase demand for energy in the commercial sector.
IndustrialWorldwide, industrial energy consumption grows from 191 quadrillion Btu in 2008 to 288 quadrillion Btu in 2035 in the Reference case. The industrial sector accounted for much of the recession-related reduction in energy use in 2009, primarily because of a substantial decline in manufacturing output that had a more pronounced impact on energy use in the industrial sector than in other sectors. In the Reference case, national economic growth rates and energy consumption patterns are projected to return to historical trends by 2015. Non-OECD economies account for about 89 percent of the world increase in industrial sector energy consumption in the Reference case (Figure 8). Rapid economic growth is projected for the non-OECD countries, accompanied by rapid growth in their combined total industrial energy consumption, averaging 2.0 percent per year from 2008 to 2035. Because OECD nations have been undergoing a transition from manufacturing economies to service economies in recent decades, and have relatively slow projected growth in economic output, industrial energy use in the OECD region as a whole grows by an average of only 0.5 percent per year from 2008 to 2035.
0 50 100 150 200
Other non-OECDEurope/Eurasia
Other Asia
Other non-OECD
OECD Europe
OECD Americas
India
OECD Asia
Russia
China
20082035
Figure 7. World nuclear generating capacity, 2008 and 2035 (gigawatts)
0
100
200
300
2008 2015 2020 2025 2030 2035
OECD
Non-OECD
216232
250269
288
191
Figure 8. World industrial delivered energy consumption, 2008-2035 (quadrillion Btu)
U.S. Energy Information Administration | International Energy Outlook 20116
Highlights
0
10
20
30
40
50
1990 2000 2008 2015 2025 2035
Liquids
Coal
Natural gas
2008History Projections
Figure 10. World energy-related carbon dioxide emissions by fuel, 1990-2035 (billion metric tons)
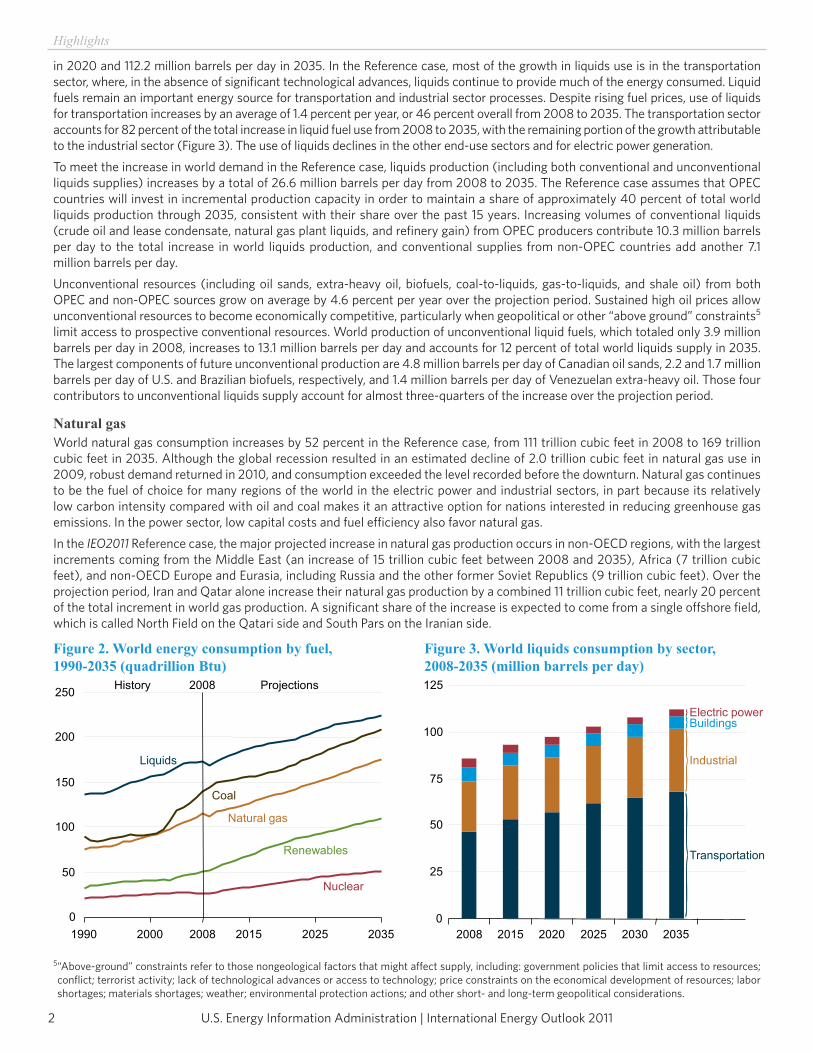
TransportationEnergy use in the transportation sector includes the energy consumed in moving people and goods by road, rail, air, water, and pipeline. The transportation sector is second only to the industrial sector in terms of total end-use energy consumption. The transportation share of world total liquids consumption increases from 54 percent in 2008 to 60 percent in 2035 in the IEO2011 Reference case, accounting for 82 percent of the total increase in world liquids consumption. Thus, understanding the development of transportation energy use is the most important factor in assessing future trends in demand for liquid fuels.World oil prices reached historically high levels in 2008, in part because of a strong increase in demand for transportation fuels, particularly in emerging non-OECD economies. Non-OECD energy use for transportation increased by 4.1 percent in 2007 and 6.4 percent in 2008, before the impact of the 2008-2009 global economic recession resulted in a slowdown in transportation sector activity. Even in 2009, non-OECD transportation energy use grew by an estimated 3.3 percent, in part because many non-OECD countries (in particular, but not limited to, the oil-rich nations) provide fuel subsidies to their citizens. With robust economic recovery expected to continue in China, India, and other non-OECD nations, growing demand for raw materials, manufactured goods, and business and personal travel is projected to support fast-paced growth in energy use for transportation both in the short term and over the long term. In the IEO2011 Reference case, non-OECD transportation energy use grows by 2.6 percent per year from 2008 to 2035 (Figure 9).High oil prices and the economic recession had more profound impacts in the OECD economies than in the non-OECD economies. OECD energy use for transportation declined by an estimated 1.6 percent in 2008, followed by a further decrease estimated at 1.8 percent in 2009, before recovering to 0.7-percent growth in 2010. Indications are that the return of high world oil prices and comparatively slow recovery from the recession in several key OECD nations will mean that transportation energy demand will continue to grow slowly in the near to mid-term. Moreover, the United States and some of the other OECD countries have instituted a number of policy measures to increase the fuel efficiency of their vehicle fleets. OECD transportation energy use grows by only 0.3 percent per year over the entire projection period.
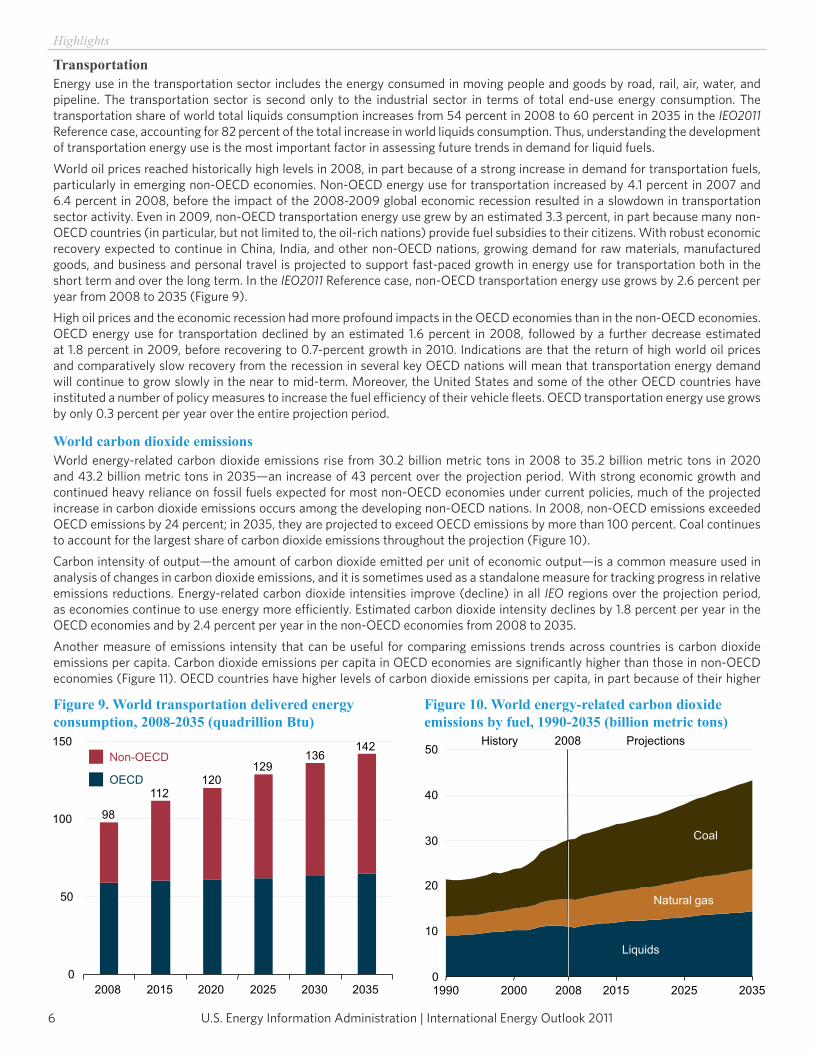
World carbon dioxide emissionsWorld energy-related carbon dioxide emissions rise from 30.2 billion metric tons in 2008 to 35.2 billion metric tons in 2020 and 43.2 billion metric tons in 2035—an increase of 43 percent over the projection period. With strong economic growth and continued heavy reliance on fossil fuels expected for most non-OECD economies under current policies, much of the projected increase in carbon dioxide emissions occurs among the developing non-OECD nations. In 2008, non-OECD emissions exceeded OECD emissions by 24 percent; in 2035, they are projected to exceed OECD emissions by more than 100 percent. Coal continues to account for the largest share of carbon dioxide emissions throughout the projection (Figure 10).Carbon intensity of output—the amount of carbon dioxide emitted per unit of economic output—is a common measure used in analysis of changes in carbon dioxide emissions, and it is sometimes used as a standalone measure for tracking progress in relative emissions reductions. Energy-related carbon dioxide intensities improve (decline) in all IEO regions over the projection period, as economies continue to use energy more efficiently. Estimated carbon dioxide intensity declines by 1.8 percent per year in the OECD economies and by 2.4 percent per year in the non-OECD economies from 2008 to 2035.Another measure of emissions intensity that can be useful for comparing emissions trends across countries is carbon dioxide emissions per capita. Carbon dioxide emissions per capita in OECD economies are significantly higher than those in non-OECD economies (Figure 11). OECD countries have higher levels of carbon dioxide emissions per capita, in part because of their higher
0
50
100
150
2008 2015 2020 2025 2030 2035
OECD
Non-OECD
112120
129136
142
98
Figure 9. World transportation delivered energy consumption, 2008-2035 (quadrillion Btu)
7U.S. Energy Information Administration | International Energy Outlook 2011
Highlights
levels of income and fossil fuel use per person. Among non-OECD countries, China has the highest percentage increase in emissions per capita in the Reference case, from 5.1 metric tons per person in 2008 to 9.3 metric tons per person in 2035, an average annual increase of 2.2 percent. In contrast, OECD emissions per capita fall over the projection period, from 11.1 metric tons per person in 2008 to 10.6 metric tons per person in 2035.
0
5
10
15
1990 2000 2008 2015 2025 2035
2008History Projections
Non-OECD
OECD
Figure 11. World carbon dioxide emissions per capita, 1990-2035 (metric tons per person)

This page inTenTionally lefT blank

9U.S. Energy Information Administration | International Energy Outlook 2011
Chapter 1
World energy demand and economic outlookOverviewIn the IEO2011 Reference case, world energy consumption increases by 53 percent, from 505 quadrillion Btu in 2008 to 770 quadrillion Btu in 2035 (Table 1). In the near term, the effects of the global recession of 2008-2009 curtailed world energy consumption.8 As nations recover from the downturn, however, world energy demand rebounds in the Reference case and increases strongly as a result of robust economic growth and expanding populations in the world’s developing countries. OECD member countries are, for the most part, more advanced energy consumers.9 Energy demand in the OECD economies grows slowly over the projection period, at an average annual rate of 0.6 percent, whereas energy consumption in the non-OECD emerging economies expands by an average of 2.3 percent per year.The global recovery from the 2008-2009 worldwide economic recession continues to advance, but the recovery remains uneven. In advanced economies, recovery is slow in comparison with recoveries from past recessions. Unemployment still is high among the advanced economies, and real estate markets and household income growth remain weak. Concerns about fiscal sustainability and financial turbulence means that advanced economies may not achieve the higher growth seen in past recoveries. In many emerging economies, growth remains high, in part driven by strong capital inflows and high commodity prices. Inflation pressures remain a concern, along with the need to rebalance external trade in key emerging economies.The pace of economic recovery varies among the advanced, OECD nations. While the recession in the United States has officially ended,10 recovery has been weaker than recoveries from past recessions. Europe’s economic recovery has lagged even more. Japan’s recovery had been sluggish before the devastating earthquake of March 11, 2011, and now the timing of economic recovery is more uncertain. In contrast to the OECD nations, developing non-OECD Asian economies have led the global recovery. The IEO2011 Reference case assumes that, by 2015, most nations of the world will have resumed their expected rates of long-term growth before the recession. World GDP rises by an average of 3.4 percent per year from 2008 to 2035 in the Reference case, with non-OECD economies averaging 4.6 percent per year and OECD economies 2.1 percent per year. Future energy consumption will be driven by non-OECD demand. Whereas energy use in non-OECD nations was 7 percent greater than that in OECD nations in 2008, non-OECD economies consume 38 percent more energy than OECD economies in 2020 in the IEO2011 Reference case and 67 percent more in 2035 (Figure 12).Two nations that were among the least affected by the worldwide recession are China and India. They continue to lead world economic growth and energy demand growth in the Reference case. Since 1990, energy consumption in both countries as a share of total world energy use has increased significantly, and together they accounted for about 10 percent of total world energy consumption in 1990 and 21 percent in 2008. Although energy demand faltered in many parts of the world during the recession, robust growth continued in China and India, whose economies expanded by 12.4 percent and 6.9 percent, respectively, in 2009. U.S. energy consumption declined by 5.3 percent in 2009, and energy use in China is estimated to have surpassed that of the
8 The International Monetary Fund (World Energy Outlook 2008, October 2008, p. 43) defines a global recession to be when the world’s annual gross domestic product (GDP)—on a purchasing power parity basis—increases by less than 3.0 percent. According to IHS Global Insight, world GDP increased by 2.7 percent in 2008, 0.7 percent in 2009, and 4.6 percent in 2010.
9 For consistency, OECD includes all members of the organization as of September 1, 2010, throughout all the time series included in this report. Israel became a member on September 7, 2010, and Estonia became a member on December 9, 2010, but neither country’s membership is reflected in IEO2011.
10 The National Bureau of Economic Research defines a recession as “a significant decline in economic activity spread across the economy, lasting more than a few months, normally visible in real GDP, real income, employment, industrial production, and wholesale-retail sales.” However, the shorthand version of a recession is often given as two consecutive quarters of negative growth in GDP. In September 2010, the National Bureau of Economic Research declared that the recession which began in the United States in December 2007 had ended in June 2009.
Table 1. World energy consumption by country grouping, 2008-2035 (quadrillion Btu)
Region 2008 2015 2020 2025 2030 2035
Average annual percent change
2008-2035
OECD 244.3 250.4 260.6 269.8 278.7 288.2 0.6
Americas 122.9 126.1 131.0 135.9 141.6 147.7 0.7
Europe 82.2 83.6 86.9 89.7 91.8 93.8 0.5
Asia 39.2 40.7 42.7 44.2 45.4 46.7 0.6
Non-OECD 260.5 323.1 358.9 401.7 442.8 481.6 2.3
Europe and Eurasia 50.5 51.4 52.3 54.0 56.0 58.4 0.5
Asia 137.9 188.1 215.0 246.4 274.3 298.8 2.9
Middle East 25.6 31.0 33.9 37.3 41.3 45.3 2.1
Africa 18.8 21.5 23.6 25.9 28.5 31.4 1.9
Central and South America 27.7 31.0 34.2 38.0 42.6 47.8 2.0
World 504.7 573.5 619.5 671.5 721.5 769.8 1.6

U.S. Energy Information Administration | International Energy Outlook 201110
World energy demand
United States for the first time. In the IEO2011 Reference case, strong economic growth continues in both China and India, and their combined energy use more than doubles, accounting for 31 percent of total world energy consumption in 2035. In 2035, China’s energy demand is 68 percent higher than U.S. energy demand (Figure 13).Energy use in non-OECD Asia (led by China and India) shows the most robust growth of all the non-OECD regions, rising by 117 percent from 2008 to 2035 (Figure 14). However, strong growth in energy use also is projected for much of the rest of the non-OECD regions. With fast-paced growth in population and access to ample domestic resources, energy demand in the Middle East increases by 77 percent over the projection period. Energy consumption increases by 72 percent in Central and South America and by 67 percent in Africa. The slowest projected growth among non-OECD regions is for non-OECD Europe and Eurasia, which includes Russia and the other former Soviet Republics. Growth in energy use for the region totals 16 percent from 2008 to 2035, as its population declines and substantial gains in energy efficiency are achieved through the replacement of inefficient Soviet-era capital equipment.
Outlook for world energy consumption by sourceThe use of all energy sources increases over the time horizon of the IEO2011 Reference case (Figure 15). Given expectations that world oil prices will remain relatively high through most of the projection period, petroleum and other liquid fuels11 are the world’s slowest-
growing source of energy. Liquids consumption increases at an average annual rate of 1.0 percent from 2008 to 2035, whereas total energy demand increases by 1.6 percent per year. Renewables are the fastest-growing source of world energy, with consumption increasing by 2.8 percent per year. Relatively high projected oil prices, as well as concern about the environmental impacts of fossil fuel use and strong government incentives for increasing the use of renewable energy in many countries around the world, improve the prospects for renewable energy sources worldwide in the outlook.Although liquid fuels are expected to remain the largest source of energy, their share of world marketed energy consumption declines from 34 percent in 2008 to 29 percent in 2035. On a worldwide basis, liquids consumption increases only in the industrial and transportation sectors while declining in the buildings and electric power sectors. The decrease in liquid fuel use in the residential, commercial, and power sectors is a result of steadily rising world oil prices, which lead to switching to alternative fuels where possible. In contrast, the use of liquids in the transportation sector continues to
11 In IEO2011, “petroleum and other liquid fuels” includes a full array of liquid product supplies, both conventional and unconventional. Conventional liquids include crude oil and lease condensate, natural gas plant liquids, and refinery gain; unconventional liquids include biofuels, gas-to-liquids, coal-to-liquids, and unconventional petroleum products (extra-heavy oils, oil shale, and bitumen) but do not include compressed natural gas (CNG), liquefied natural gas (LNG), or hydrogen.
0
50
100
150
200
1990 2000 2008 2015 2025 2035
China
United States
India
2008History Projections
Figure 13. Energy consumption in the United States, China, and India, 1990-2035 (quadrillion Btu)
Central and South America
Non-OECDAsia
Middle East
AfricaEurope andEurasia
0
100
200
300
400
500
1990 2000 2008 2015 2025 2035
155 171
260
323
402
482
Figure 14. Non-OECD energy consumption, 1990-2035 (quadrillion Btu)
0
200
400
600
800
1990 2000 2008 2015 2020 2025 2030 2035
OECDNon-OECDWorld total
Figure 12. World energy consumption, 1990-2035 (quadrillion Btu)

11U.S. Energy Information Administration | International Energy Outlook 2011
World energy demand and economic outlook
increase despite rising prices, given the expectation that liquids will continue to dominate transportation markets absent significant technological advances. World liquids consumption for transportation grows by 1.4 percent per year from 2008 to 2035 and accounts for 82 percent of the total projected increment in liquid fuel use.In the IEO2011 Reference case, the world’s total natural gas consumption increases by 1.6 percent per year on average, from 111 trillion cubic feet in 2008 to 169 trillion cubic feet in 2035. Increasing supplies of unconventional natural gas, particularly in North America but elsewhere as well, help keep global markets well supplied. As a result, natural gas prices remain more competitive than oil prices, supporting the growth in projected worldwide gas consumption. In the projection period, the most rapid expansion of natural gas use is for electric power generation and industrial uses (Figure 16). Worldwide natural gas used for power generation increases by 2.0 percent per year from 2008 to 2035, and consumption in the industrial sector increases by 1.7 percent per year. These two sectors alone account for 87 percent of the net increase in global natural gas use over the projection period.Throughout the projection, coal continues to be an important source of fuel, especially in non-OECD Asia, where the combination of fast-paced economic growth and large domestic reserves supports growth in coal demand. World coal consumption increases by an average 1.5 percent per year on average from 2008 to 2035, while coal use in non-OECD Asia increases by 2.3 percent per year. World coal consumption increased by a total of 30 percent from 2003 and 2008, largely because of China’s fast-growing energy demand. In China alone, coal consumption increased by 71 percent over the 5-year period. Although the global recession had a negative impact on coal use in almost every other part of the world in 2009, coal consumption continued to increase in China. In the absence of policies or legislation that would limit the growth of coal use, China and, to a lesser extent, India and the other nations of non-OECD Asia consume coal in place of more expensive fuels in the outlook. In the IEO2011 Reference case, China alone accounts for 76 percent of the net increase in world coal consumption, and India and the rest of non-OECD Asia account for 19 percent of the world increase.Electricity is the world’s fastest-growing form of end-use energy consumption in the Reference case, as it has been for the past several decades. Net electricity generation worldwide rises by 2.3 percent per year on average from 2008 to 2035, while total world energy demand grows by 1.6 percent per year. The strongest growth in electricity generation is projected for non-OECD countries. Non-OECD electricity generation increases by an average annual rate of 3.3 percent in the Reference case, as rising standards of living increase demand for home appliances and electronic devices, as well as the expansion of commercial services, including hospitals, office buildings, and shopping malls. In the OECD nations, where infrastructures are more mature and population growth is relatively slow or declining, the growth in power generation is much slower, averaging 1.2 percent per year from 2008 to 2035.Coal provides the largest share of world electricity generation, although its share declines over the projection period. From 40 percent of total generation in 2008, coal’s share falls to 37 percent in 2035 (Figure 17). The liquids share of total generation also falls in the Reference case. With oil prices remaining high, alternative fuels are substituted for liquids-fired generation where possible, and the liquids share of generation falls from 5 percent in 2008 to just over 2 percent in 2035. In contrast to coal and liquids, natural gas and renewable energy sources account for increasing shares of total generation. The natural gas share of global generation grows from 22 percent in 2008 to 24 percent in 2035, and the renewable share increases from 19 percent to 23 percent. Renewable generation is the world’s fastest-growing source of electric power in the IEO2011 Reference case, rising at an average annual rate of 3.0 percent and outpacing the average annual increases for natural gas (2.6 percent), nuclear power (2.4 percent), and coal (1.9 percent). Government policies and incentives throughout the world support the rapid construction of renewable generation facilities.
0
50
100
150
200
250
1990 2000 2008 2015 2025 2035
Liquids
Coal
Natural gas
Renewables
Nuclear
2008History Projections
Figure 15. World energy consumption by fuel, 1990-2035 (quadrillion Btu)
Transportation
Electric power
Industrial
Buildings
0
50
100
150
200
2008 2015 2020 2025 2030 2035
111123
133144
157169
Figure 16. World natural gas consumption by end-use sector, 2008-2035 (trillion cubic feet)
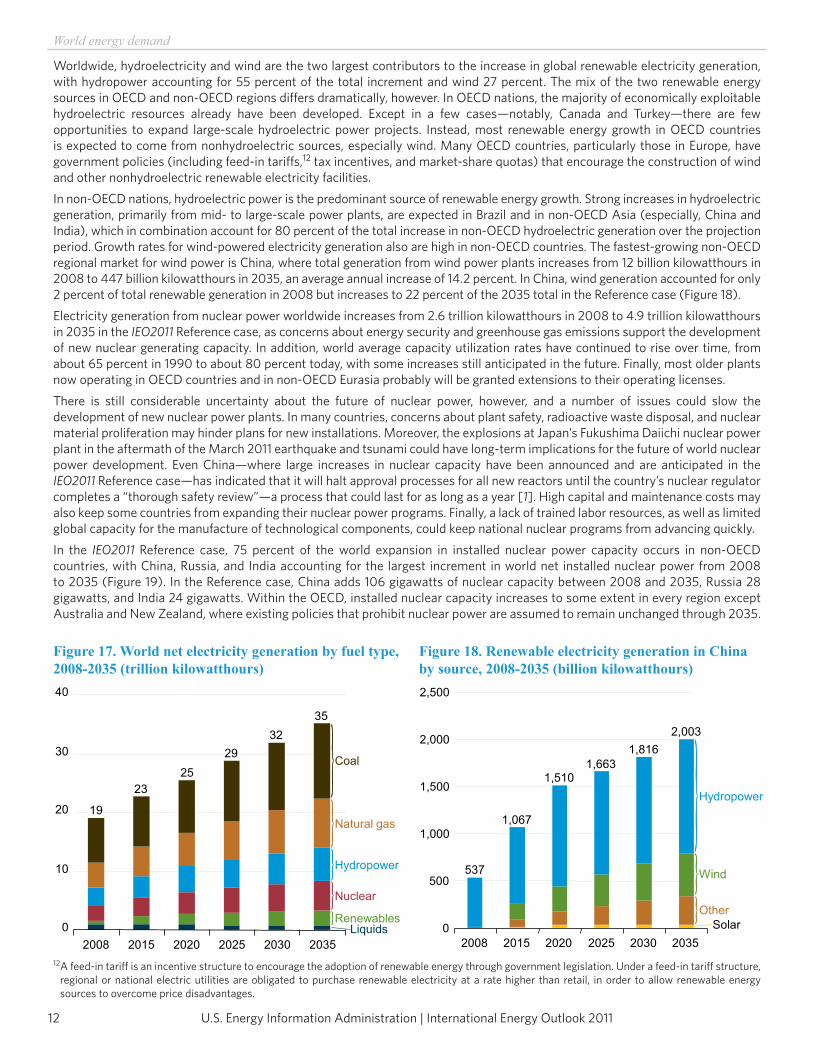
U.S. Energy Information Administration | International Energy Outlook 201112
World energy demand
Worldwide, hydroelectricity and wind are the two largest contributors to the increase in global renewable electricity generation, with hydropower accounting for 55 percent of the total increment and wind 27 percent. The mix of the two renewable energy sources in OECD and non-OECD regions differs dramatically, however. In OECD nations, the majority of economically exploitable hydroelectric resources already have been developed. Except in a few cases—notably, Canada and Turkey—there are few opportunities to expand large-scale hydroelectric power projects. Instead, most renewable energy growth in OECD countries is expected to come from nonhydroelectric sources, especially wind. Many OECD countries, particularly those in Europe, have government policies (including feed-in tariffs,12 tax incentives, and market-share quotas) that encourage the construction of wind and other nonhydroelectric renewable electricity facilities.In non-OECD nations, hydroelectric power is the predominant source of renewable energy growth. Strong increases in hydroelectric generation, primarily from mid- to large-scale power plants, are expected in Brazil and in non-OECD Asia (especially, China and India), which in combination account for 80 percent of the total increase in non-OECD hydroelectric generation over the projection period. Growth rates for wind-powered electricity generation also are high in non-OECD countries. The fastest-growing non-OECD regional market for wind power is China, where total generation from wind power plants increases from 12 billion kilowatthours in 2008 to 447 billion kilowatthours in 2035, an average annual increase of 14.2 percent. In China, wind generation accounted for only 2 percent of total renewable generation in 2008 but increases to 22 percent of the 2035 total in the Reference case (Figure 18).Electricity generation from nuclear power worldwide increases from 2.6 trillion kilowatthours in 2008 to 4.9 trillion kilowatthours in 2035 in the IEO2011 Reference case, as concerns about energy security and greenhouse gas emissions support the development of new nuclear generating capacity. In addition, world average capacity utilization rates have continued to rise over time, from about 65 percent in 1990 to about 80 percent today, with some increases still anticipated in the future. Finally, most older plants now operating in OECD countries and in non-OECD Eurasia probably will be granted extensions to their operating licenses.There is still considerable uncertainty about the future of nuclear power, however, and a number of issues could slow the development of new nuclear power plants. In many countries, concerns about plant safety, radioactive waste disposal, and nuclear material proliferation may hinder plans for new installations. Moreover, the explosions at Japan’s Fukushima Daiichi nuclear power plant in the aftermath of the March 2011 earthquake and tsunami could have long-term implications for the future of world nuclear power development. Even China—where large increases in nuclear capacity have been announced and are anticipated in the IEO2011 Reference case—has indicated that it will halt approval processes for all new reactors until the country’s nuclear regulator completes a “thorough safety review”—a process that could last for as long as a year [1]. High capital and maintenance costs may also keep some countries from expanding their nuclear power programs. Finally, a lack of trained labor resources, as well as limited global capacity for the manufacture of technological components, could keep national nuclear programs from advancing quickly.In the IEO2011 Reference case, 75 percent of the world expansion in installed nuclear power capacity occurs in non-OECD countries, with China, Russia, and India accounting for the largest increment in world net installed nuclear power from 2008 to 2035 (Figure 19). In the Reference case, China adds 106 gigawatts of nuclear capacity between 2008 and 2035, Russia 28 gigawatts, and India 24 gigawatts. Within the OECD, installed nuclear capacity increases to some extent in every region except Australia and New Zealand, where existing policies that prohibit nuclear power are assumed to remain unchanged through 2035.
12 A feed-in tariff is an incentive structure to encourage the adoption of renewable energy through government legislation. Under a feed-in tariff structure, regional or national electric utilities are obligated to purchase renewable electricity at a rate higher than retail, in order to allow renewable energy sources to overcome price disadvantages.
0
10
20
30
40
2008 2015 2020 2025 2030 2035Liquids
Coal
Natural gas
Renewables
Nuclear
Hydropower
19
2325
2932
35
Figure 17. World net electricity generation by fuel type, 2008-2035 (trillion kilowatthours)
0
500
1,000
1,500
2,000
2,500
2008 2015 2020 2025 2030 2035Solar
Other
Wind
Hydropower
537
1,067
1,5101,663
1,8162,003
Figure 18. Renewable electricity generation in China by source, 2008-2035 (billion kilowatthours)

13U.S. Energy Information Administration | International Energy Outlook 2011
World energy demand and economic outlook
Prior to the Fukushima disaster, prospects for nuclear power in OECD Europe had improved markedly over the past few years, and many countries were reevaluating their nuclear power programs to consider plant life extensions or construction of new nuclear generating capacity. The governments of several countries had announced changes in their positions, including the Belgian government, which decided to delay its phaseout plans by 10 years; the German government, which extended the amount of time its nuclear reactors would be allowed to continue operating by between 8 and 14 years; and the Italian government, which formally ended its anti-nuclear policies and announced plans for constructing a new reactor by 2020 [2]. Even in Spain, where the government has remained steadfast in its opposition to the construction of new nuclear power plants, the main political parties—including the ruling Socialist Party—had agreed to allow nuclear facilities to operate longer than 40 years [3]. In addition, Poland and Turkey had announced plans to begin new nuclear generation programs with plants that could become operational soon after 2020 [4].The projections in the IEO2011 Reference case do not reflect the policy responses of some governments in the wake of the Fukushima disaster, which are likely to curtail the projections for nuclear power from both existing and new plants. The full extent to which governments in Europe and Japan might withdraw their support for nuclear power is uncertain, but some countries have already reversed their nuclear policies since the disaster occurred in March 2011. The German government, for instance, has announced plans to close all nuclear reactors in the country by 2022 [5]. The Swiss Cabinet also has decided to phase out nuclear power by 2034 [6], and Italian voters, in a country-wide referendum, have rejected plans to build nuclear power plants in Italy [7]. In addition, the European Commission has announced that it will conduct a program of stress tests at nuclear reactors operating within the European Union. (Turkey, in contrast, has announced that it will proceed with construction of the country’s first nuclear power plant [8].) Still, environmental concerns and the importance of energy security provide support for future European nuclear generation.In the United States, Title XVII of the Energy Policy Act of 2005 (EPACT2005, Public Law 109-58) authorizes the U.S. Department of Energy to issue loan guarantees for innovative technologies that “avoid, reduce, or sequester greenhouse gases.” In addition, subsequent legislative provisions in the Consolidated Appropriation Act of 2008 (Public Law 110-161) allocated $18.5 billion in guarantees for nuclear power plants [9]. That legislation supports a net increase of about 10 gigawatts of nuclear power capacity, which would raise the U.S. total from 101 gigawatts in 2008 to 111 gigawatts in 2035. The projected increase in the IEO2011 Reference case includes 3.8 gigawatts of expanded capacity at existing plants and 6.3 gigawatts of new capacity, including completion of a second unit at the Watts Bar site in Tennessee—where construction was halted in 1988 when it was nearly 80 percent complete—as well as four new nuclear power plants that are projected to be in operation before 2020 to take advantage of Federal financial incentives. One nuclear unit, Oyster Creek, is projected to be retired at the end of 2019, as announced by Exelon in December 2010. All other existing U.S. nuclear units continue to operate through 2035 in the Reference case.13
Delivered energy consumption by end-use sectorUnderstanding patterns in the consumption of energy delivered to end users14 is important to the development of projections for global energy use. Outside the transportation sector, which at present is dominated by liquid fuels, the mix of energy use in the residential, commercial, and industrial sectors varies widely by region, depending on a combination of regional factors, such as the availability of energy resources, levels of economic development, and political, social, and demographic factors.
Residential sectorEnergy use in the residential sector, which accounted for about 14 percent of world delivered energy consumption in 2008, is defined as the energy consumed by households, excluding transportation uses. Residential energy use grows at an average rate of 1.1 percent per year from 2008 to 2035. Projected robust economic growth among the emerging, non-OECD nations translates to much more rapid growth in residential energy use than in the developed OECD nations. As a result, non-OECD residential energy consumption increases at a rate more than seven times that of OECD nations—1.9 percent per year compared with 0.3 percent per year (Figure 20).The type and amount of energy used by households vary from country to country, depending on income levels, natural resources, climate, and available energy infrastructure. In general, typical households in OECD nations use more energy than those in non-OECD nations, in part because
13 For a discussion of the issues surrounding extension of the operating lives of U.S. nuclear reactors to 60 years, see “U.S. nuclear power plants: Continued life or replacement after 60?” in the Issues in Focus section of EIA’s Annual Energy Outlook 2010, DOE/EIA-0383(2010) (Washington, DC, April 2010), pp. 43-46, website www.eia.gov/oiaf/archive/aeo10.
14 Delivered energy consumption in the end-use sectors consists of primary energy consumption and retail sales of electricity, excluding electrical system energy losses.
0 50 100 150 200
Other non-OECDEurope/Eurasia
Other Asia
Other non-OECD
OECD Europe
OECD Americas
India
OECD Asia
Russia
China
20082035
Figure 19. World nuclear generating capacity, 2008 and 2035 (gigawatts)