nowcasting annual national accounts with quarterly ... and suggestions. i’m also grateful to zula...
TRANSCRIPT

WP/16/71
Nowcasting Annual National Accounts with Quarterly Indicators:
An Assessment of Widely Used Benchmarking Methods
by Marco Marini
IMF Working Papers describe research in progress by the author(s) and are published to elicit comments and to encourage debate. The views expressed in IMF Working Papers are those of the author(s) and do not necessarily represent the views of the IMF, its Executive Board, or IMF management.

© 2016 International Monetary Fund WP/16/71
IMF Working Paper
Statistics Department
Nowcasting Annual National Accounts with Quarterly Indicators: An Assessment of Widely Used Benchmarking Methods
Prepared by Marco Marini1
Authorized for distribution by Claudia Dziobek
March 2016
Abstract
Benchmarking methods can be used to extrapolate (or “nowcast”) low-frequency benchmarks on the basis of available high-frequency indicators. Quarterly national accounts are a typical example, where a number of monthly and quarterly indicators of economic activity are used to calculate preliminary annual estimates of GDP. Using both simulated and real-life national accounts data, this paper aims at assessing the prediction accuracy of three benchmarking methods widely used in the national accounts compilation: the proportional Denton method, the proportional Cholette-Dagum method with first-order autoregressive error, and the regression-based Chow-Lin method. The results show that the Cholette-Dagum method provides the most accurate extrapolations when the indicator and the annual benchmarks move along the same trend. However, the Denton and Chow-Lin methods could prevail in real-life cases when the quarterly indicator temporarily deviates from the target series.
JEL Classification Numbers: C22, C61, C82
Keywords: Benchmarking, Extrapolation, Quarterly National Accounts
Author’s E-Mail Address: [email protected]
1 I would like to thank Robert Heath, Claudia Dziobek, Rob Dippelsman, and Michael Stanger for their valuable comments and suggestions. I’m also grateful to Zula Oimandakh and Terri Walker for their editorial assistance. This paper originated from research conducted for the update of the IMF’s Quarterly National Accounts Manual.
IMF Working Papers describe research in progress by the author(s) and are published to elicit comments and to encourage debate. The views expressed in IMF Working Papers are those of the author(s) and do not necessarily represent the views of the IMF, its Executive Board, or IMF management.

3
Contents Page
Abstract ......................................................................................................................................2
I. Introduction ............................................................................................................................4
II. Benchmarking Methods in the QNA: a Review ....................................................................5
III. Assessment using Simulated Data .....................................................................................11
IV. An Application to National Accounts Data .......................................................................15
V. Conclusions .........................................................................................................................22
Table 1. Summary statistics of the national accounts exercise ..........................................................17
Figures 1. Mean Absolute Error in Scenario 1: Cholette-Dagum is superior when the BI ratio is stableand unpredictable .....................................................................................................................13
2. Mean Absolute Error in Scenarios 2 and 3: Denton and Cholette-Dagum prevail when theirunderlying assumptions are met ...............................................................................................13
3. Mean Absolute Error in Scenario 4 and 5: Chow-Lin improves the out-of-sample accuracywhen the benchmark-indicator model is additive ....................................................................15
4. Morocco Exports: Chow-Lin outperforms the other methods .............................................18
5. Jamaica Exports: Chow-Lin underestimates the target value ..............................................19
6. Ireland Imports: Denton performs well when the BI ratio follows a trend ..........................20
7. Brazil Exports: Cholette-Dagum is superior when the BI ratio converges towards itsaverage .....................................................................................................................................20
8. Armenia Imports: Chow-Lin produces smoother series than Denton when the correlationbetween annual data and quarterly indicator is low .................................................................21
Annex 1. List of countries with available export and import series ....................................................24
References References ................................................................................................................................25

4
I. INTRODUCTION
Benchmarking methods are used for improving the temporal consistency between high-frequency series and low-frequency benchmarks.2 The adjustment process eliminates the discrepancy between the sum or the average of high-frequency observations and corresponding low-frequency values. Benchmarking methods are typically used in the compilation of quarterly national accounts (QNA), where a set of quarterly indicators is “benchmarked” to more comprehensive and more consolidated benchmarks from the annual national accounts.
Benchmarking methods are also used to project the benchmarked series beyond the last available benchmark. Benchmarking methods calculate these projections (or extrapolations) based on the current values of high-frequency series and some functional relationship between the high-frequency series and the low-frequency counterparts. In the national accounts, compilers use benchmarking methods to extrapolate the quarterly GDP (and other main QNA variables) on the basis of a set of quarterly indicators.
The extrapolation of QNA is required for timeliness reasons. Quarterly data of national accounts variables (such as the quarterly GDP) precede the dissemination of the annual estimate, which is normally based on more comprehensive source data and, sometimes, a different methodology. Early estimates of QNA variables are often referred to as “flash” or “advanced” estimates, to give the idea of increased timeliness of these estimates. Economists also use the term “nowcasts” to indicate that these extrapolations take into account a partial set of information from the quarter under estimation.
Benchmarking methods can improve the accuracy and reliability of the QNA by minimizing the error between the extrapolated quarters and the annual estimate. Better extrapolations are essential to minimize the size of revisions in the QNA estimates when the new annual benchmark is incorporated in the QNA system.
The purpose of this paper is to shed light on the predictive power of three benchmarking methods widely used in the QNA: the proportional Denton method; the proportional Cholette-Dagum method; and the regression-based Chow-Lin method. The performances of the methods are compared on the basis of simulated data and real-life data extracted from the IMF’s International Financial Statistics (IFS) database.
The simulation exercise shows that each benchmarking method outperforms the others when the relationship between the quarterly indicator and the annual benchmarks is in line with the assumptions of the method. When the quarterly indicator is an unbiased, proportionally
2 In the literature, benchmarking methods are also referred to as temporal disaggregation, distribution, or interpolation methods.

5
related measurement of the annual series, the Cholette-Dagum method is shown to provide the most accurate extrapolations of annual benchmarks.
Nevertheless, the same conclusion cannot be reached using real-life data. For the specific dataset used in this paper, the Chow-Lin method returned the smallest error in absolute terms. In contrast, the Denton method and the Cholette-Dagum method could not pick up differences in local trends between quarterly indicators and annual variables and produced on average worse extrapolations than Chow-Lin. It should be noted, however, that the Chow-Lin method manifested a tendency to underestimate annual growth and produce the largest amount of quarterly revisions.
The paper is organized as follows. The properties of the three benchmarking methods are reviewed in the next section. Section 3 presents the results of the simulation experiment. In section 4, the three methods are used to calculate annual projections of exports and imports of national accounts using quarterly merchandise trade statistics of 87 countries. Section 5 draws conclusions from this work, and provides suggestions for improving the results of benchmarking methods in the QNA compilation.
II. BENCHMARKING METHODS IN THE QNA: A REVIEW
First, it is convenient to define the benchmarking problem in mathematical notation. Let nX
denote the annual benchmark for the year n, with 1, ,n m and m the last available
benchmark.3 Let ty be the corresponding indicator series available for m+1 years, where
1, , 4( 1)t m . It is assumed that the values of the indicator do not match the annual
benchmarks, that is
4
4 3
n
t nt n
y X
for any n. The objective of benchmarking is to obtain a benchmarked series tx – that is a
series satisfying the annual constraints
4
4 3
n
t nt n
x X
– such that the quarterly movements in tx are as close as possible to the movements in the
observed quarterly indicator ty . Because the values of the indicator for the following year
are timely available, benchmarking methods can also be used to calculate an early projection
3 In this paper, annual benchmarks are indicated with uppercase letters and quarterly indicators with lowercase letters. The temporal indices are t for quarters and n for years.
6
of 1mX before an estimate from the annual national accounts system becomes available. The
benchmarking process makes the annual projection consistent with previous observations of the quarterly series.
The three benchmarking methods considered in this paper rely on different assumptions in extrapolation. Each method is discussed below.4 This review focuses on three widely used benchmarking methods in the QNA context. For a broader review of other benchmarking and extrapolation methods, please refer to Dagum and Cholette (2006).
Proportional Denton method
The proportional Denton method, as modified by Cholette (1984), obtains the solution to the benchmarking problem by solving the following constrained minimization problem:
24
1
2 1
mint
mt t
xt t t
x x
y y
(1)
subject to
4
4 3
for 1,...,n
t nt n
x X n m
. (2)
The objective function (1) is known as proportional first difference (PFD) variant of the Denton method— or more simply, the proportional Denton method. It is called proportional because it is assumed that the quarterly benchmarked series is proportional to the values of the indicator.
The ratio in (1) is also called the quarterly benchmark-indicator (BI) ratio. The Denton method preserves the movements in the indicator by smoothing the quarterly BI ratios under the annual restrictions (2). The annual BI ratio is very helpful in analyzing the relationship between the annual benchmarks and the quarterly indicator.5 A stable annual BI series over time is a sign of good relationship. When the annual BI ratio shows large and sudden variations, the quarterly indicator and the annual benchmarks are likely to present diverging movements.
When quarterly values of the indicator are available beyond the last annual benchmark (i.e., when 4t m ), quarterly extrapolated figures for the benchmarked series are obtained under
4 Additional details on the properties of the three benchmarking methods can be found in the updated QNA manual (see chapter 6 in IMF, 2014). 5 The annual BI ratio is the ratio between the annual benchmark and the annually aggregated indicator.

7
the assumption that the BI ratio remains equal to the BI ratio of the fourth quarter of the last benchmark year:
4 4
4 4
m k m
m k m
x x
y y
,
or equivalently by multiplying the indicator’s value by the last quarterly BI ratio
44 4
4
mm k m k
m
xx y
y (3)
This happens because the benchmark for year m+1 is not yet available, therefore the
minimum impact under equation (1) is attained when 4 4 1
4 4 1
0m k m k
m k m k
x x
y y
for any 0k ,
that is when 4 4
4 4
m k m
m k m
x x
y y
.
The one-year-ahead estimate of 1mX can be calculated as the sum of the extrapolated quarters
4m kx , with 1,..., 4k . Using equation (3), the one-year-ahead estimate using the Denton
method can be written as
41 1
4
mm m
m
xX Y
y . (4)
Equation (4) implies that the annual estimate for year m+1 is also calculated under the assumption of a fixed BI ratio of the fourth quarter of year m.
In extrapolation, the Denton method generates benchmarked series with quarter-to-quarter growth rates that are identical to those in the indicator. At first glance, this can be regarded an ideal approach for extrapolation
However, this simple rule may generate distortions in the annual estimate when the annual benchmark mX and the corresponding quarters in mY move at different rates in the last year
(i.e., when the BI ratio in the last available year shows a significant change from the previous year). Carrying forward the quarterly BI ratio from the fourth quarter is equivalent to assuming that any deviation in the ratio between the annual benchmark and the indicator arising in the fourth quarter of the previous year persists in the following year. This assumption may not hold true, and could generate distortions in the extrapolations of important QNA variables, such as the quarterly GDP.

8
Proportional Cholette-Dagum method with AR(1) error
Cholette and Dagum (1994) proposed a very general framework for benchmarking grounded in the generalized least-squares regression model. The Cholette-Dagum model encompasses (i) the presence of bias in the indicator, and (ii) the presence of autocorrelated and heteroschedastic errors in the original data. Furthermore, it allows for non-binding benchmarks (e.g., benchmarks that can be subject to adjustment). These characteristics make the Cholette-Dagum method very flexible to address different benchmarking problems.
A particular case of the Cholette-Dagum framework is the proportional benchmarking method with first-order autoregressive error (or AR(1) error). This method comprises the following three equations:
t t ty x e for 1,..., 4t m (5)
1t t te e v (6)
4
4 3
n
n tt n
X x
for 1,...,n m (7)
where ty is the quarterly indicator (possibly adjusted for a level bias); tx is the quarterly target
series; te is a quarterly auto correlated and heteroscedastic error; and nX is the annual series.
A proportional relationship between ty and tx is achieved by assuming that the quarterly
error in (5) is proportionally related to the indicator, namely t t te e y .
The proportional Denton method can be seen as a particular (approximated) case of the proportional Cholette-Dagum method with AR(1) error. In fact, it can be shown that equations (5)-(7) lead to a minimization problem that converges to the one defined by Denton when 1 .
The value of the AR parameter is very important in extrapolation. Its value determines
how fast the benchmarked series tx converges to the (bias-adjusted) indicator ty . Values of
close to zero tend to converge quickly; conversely, values close to one maintain the fourth quarter BI ratio for the next year (similarly to Denton). Previous research on this topic provides guidance on how to best calibrate the value of .6
6 For quarterly series, Dagum and Cholette (2006) suggest a range of values of between 0.343 and 0.729,
which is temporally consistent with the range [0.7; 0.9] suggested for monthly series. However, this range could lead to sizable differences between the movements in the benchmarked series and the indicator. The IMF’s QNA manual suggests a value of 0.84 for . This value produces a quarterly BI ratio in the fourth
quarter of the year m+1 that is the mid-point ratio between the last observed quarterly BI ratio and the average BI ratio.

9
After some algebra manipulations on equations (5) and (6), quarterly extrapolations according to the Cholette-Dagum method with AR(1) error can be written as
4 4 4(1 )km k m k mx y e . (8)
As for Denton, the extrapolated value 4m kx remains based on the value of the indicator
4m ky and the last quarterly error 4me (which is a transformation of the BI ratio 4 4m mx y ).
However, the effect of the BI ratio is discounted by the AR coefficient as one moves away from the period 4m . As explained above, the AR parameter determines how fast the BI ratio converges to zero (and how fast 4m kx converges to 4m ky ).
The one-year-ahead estimate of the Cholette-Dagum method can be obtained by aggregation of the quarterly extrapolations in (8):
4 4
4 4 41 1
44
1 1 414
(1 )
.
km k m k m
k k
kmm m m k
km
x y e
eX Y y
y
(9)
Regression-based Chow-Lin method
Chow and Lin (1971) proposed a method for interpolating, distributing, and extrapolating time series based on a regression model using related indicators. The benchmarked series is derived from the best linear unbiased estimates (BLUE) of the regression parameters. The Chow-Lin method is presently used by some statistical agencies with sophisticated QNA systems.7
The Chow-Lin method assumes a regression model between the true (unobserved) quarterly observations tx and a set of p quarterly related series 1, ,, ...,t p ty y :
,1
p
t j j t tj
x y u
for 1,..., 4t m (10)
where
1t t tu u v , (11)
7 Details on the Chow-Lin methodology for temporal disaggregation are provided in the European QNA handbook (Eurostat, 2013).

10
with tx the quarterly (unknown) target value; ,j ty the j-th quarterly indicator; j the
regression coefficient for the j-th indicator; and tu a first-order AR model with independently
and identically distributed innovations. For the purpose of this paper, it is assumed that equation (10) includes one indicator plus a constant term, that is8
.t t tx y u
Because tx is unobserved, equation (10) cannot be estimated at the quarterly frequency.
Chow and Lin assume that the same model applies for the annual data (which are observable). The BLUE of the regression coefficients can be obtained by maximum likelihood. In the common practice, the AR coefficient is calculated using a scanning
procedure within a pre-specified (stationary and positive) region.
The benchmarked series tx consists of the sum of two components: the regression component
and the residuals component. It should be noted that the model (10)-(11) is partly proportional and partly additive. The estimated coefficient (plus the constant) rescales the indicator to the level of the benchmarks. However, the error is distributed without taking into account the size of the indicator.
Dagum and Cholette (2006) show that the Chow-Lin model is a particular case of their regression-based additive model with a single indicator (note that the method discussed in this paper is the proportional version of the Cholette-Dagum model). The AR(1) assumption for tu is required for a smooth distribution of the quarterly errors, similarly to the Cholette-
Dagum method with AR error.9 However, in the Chow-Lin approach the value of the AR coefficient is estimated from observed data and not calibrated by the user (as for the AR
coefficient in the Cholette-Dagum model).
The extrapolated quarters with the Chow-Lin method are obtained by projecting the estimated regression coefficients in the next quarters,
4 4 4
4 4 1
ˆˆ
ˆm k m k m k
m k m k
x y u
u u
where ̂ is the estimated constant term, ̂ is the estimated regression coefficient for the
indicator, and 4m ku is the estimated residual for the quarter 4m k . The one-year-ahead
projection is obtained as the sum of the four extrapolated quarters:
8 In QNA compilation, the Chow-Lin method is normally used with an indicator-plus-constant specification. Therefore, this assumption is not too restrictive for assessing the current QNA practice. 9 Other assumptions for the quarterly error are the random-walk model by Fernandez (1981) and the AR(1)-plus-random walk model by Litterman (1983).

11
4 4
4 4 41 1
1 1 1
ˆˆ( )
ˆˆ4 ,
m k m k m kk k
m m m
x y u
X Y U
(12)
where 1mU is the sum of the quarterly extrapolated residuals 4m ku .
III. ASSESSMENT USING SIMULATED DATA
The objective of this exercise is to assess the out-of-sample performance of the proportional Denton method, the proportional Cholette-Dagum method with AR(1) error, and the regression-based Chow-Lin method under different simulated scenarios. Annual projections for the three methods are obtained as the sum of quarterly extrapolations on the basis of equations (4), (9), and (12), respectively. For Cholette-Dagum, the AR parameter is fixed
to 0.84. For Chow-Lin, the regression model includes a constant term and one indicator. The coefficients are estimated by maximum likelihood. The AR coefficient is estimated using
a scanning procedure within the range [0.70; 0.99].
The simulation exercise is designed as follows. The quarterly indicator is simulated according to a first-order integrated AR model 10
1t t ty y , (13)
where (1 )B is the first difference operator (with 1t tBy y ), is an AR coefficient,
and t is a normally-distributed error process with variance 2 . The coefficient is drawn
from a uniform distribution between 0.75 and 0.95. The series is generated for 240 periods, but only the last 40 observations are considered to remove the dependency from initial conditions. This process is repeated for 20,000 series, each time drawing different values for
, 2 , and t . Each quarterly indicator ty is then annually aggregated by summation.
The annual series nX is generated under five different scenarios, which assume different
relationships with the simulated indicator series ty . The relationships are defined in terms of
annual BI ratio. Each scenario is described below.
Scenario 1: Random noise in the extrapolated year
Scenario 1 assumes that the ratio between the annual variable nX and the annually-
aggregated indicator nY follows a normally distributed process, that is
10 This model has been chosen because it generates patterns that are similar to many observed economic time series (under stationary conditions for the AR process).

12
nn
n
X
Y (14)
with (1.05,0.01)n N . In other words, the BI ratio is assumed to be stable around the
mean. This amounts to saying that the quarterly indicator ty is an unbiased measurement of
the annual benchmarks nX , and any deviation from the average BI ratio is expected to be
small and unpredictable.
Annual benchmarks nX are generated based on equation (14) for each of the 20,000 ty
series produced. Then, the three benchmarking methods are used to calculate quarterly extrapolations for the last simulated year (e.g., year 10). The final annual observation ( 10X )
is not included in the benchmarking process, whereas all 40 quarterly values of the simulated indicator ty are considered.
To evaluate the relative performance of the methods, the one-year-ahead prediction error for year 10 of all the series j is obtained by calculating the relative difference (in percent) between the one-year-ahead estimate (from the three methods) and the true annual value:
10, 10,10,
10,
ˆˆ 100j j
jj
X XE
X
where 10, jX is the true annual value of series j for year 10, 10,ˆ
jX is the one-year-ahead
estimate obtained using (4), (9), or (12), and j denotes one of the 20,000 series. The mean absolute error (MAE) is calculated as
10,
1 ˆ20,000 j
j
MAE E (15)
Figure 1 shows the MAE computed on the 20,000 simulated cases under Scenario 1. The Cholette-Dagum method attains the lowest MAE, with an absolute average error of around one percent, followed by Denton (1.24 percent) and Chow-Lin (1.53 percent). This result confirms that the Cholette-Dagum method with AR(1) error performs very well in extrapolation when the BI ratio moves randomly and does not present any systematic deviation in the extrapolated year. As expected from the proportional assumption between the variables, the two proportional benchmarking methods (Denton and Cholette-Dagum) outperform Chow-Lin. In effect, the Chow-Lin method applies an additive distribution of the residual component that disregard the relative size of the indicator.

13
Figure 1. Mean Absolute Error in Scenario 1: Cholette-Dagum is superior when the BI ratio is stable and unpredictable
Scenario 2: Past trends in the extrapolated year
Scenario 2 assumes that the BI ratio for the extrapolated year moves along the same direction of change shown in the previous year. As explained in the IMF’s QNA manual (IMF, 2014), this is a favorable condition for the Denton method. When the annual BI ratio moves along a trend, the quarterly BI ratio will also move along that trend. By taking the last quarter BI ratio, the Denton method is implicitly projecting that the trend in the BI ratio will (partially) persist in the extrapolated year.
Scenario 2 is still based on equation (14), with the annual observation 10, jX modified as
10, 9, 9, 8,
9, 8,10, 9,
j j j j
j jj j
X X X X
Y YY Y
.
Figure 2. Mean Absolute Error in Scenarios 2 and 3: Denton and Cholette-Dagum prevail when their underlying assumptions are met
Scenario 2 Scenario 3
The left-hand side of Figure 2 shows the MAE for Scenario 2. Compared with Scenario 1, the Denton method clearly improves its performance (0.80 percent vs. 1.24 percent). Similarly,
0.0
0.5
1.0
1.5
2.0
Denton Cholette-Dagum Chow-Lin
0.0
0.5
1.0
1.5
Denton Cholette-Dagum Chow-Lin0.0
0.5
1.0
1.5
Denton Cholette-Dagum Chow-Lin

14
the Chow-Lin method improves its results (1.10 percent vs. 1.53 percent). On the contrary, the accuracy of Cholette-Dagum method deteriorates (1.18 percent vs. 1.01 percent). This is in line with expectations, as the Cholette-Dagum method assumes that the BI ratio converges towards the average BI ratio. This is shown in the next scenario.
Scenario 3: Convergence towards the average BI in the extrapolated year
In this scenario the annual BI ratio for the extrapolated year is assumed to converge to the average BI calculated from the previous nine years, that is
910 9
110 9
10.5 0.5
9t
t t
X X X
Y Y Y
.
As clear from the right-hand side of Figure 2, the Cholette-Dagum method performs at its best under this assumption (the MAE goes down to 0.3 percent). The AR mechanism for the error process ensures that the extrapolated BI converges towards its mean. The chosen value for the AR coefficient (0.84) is such that the extrapolated BI ratio is the mid-point between the last quarterly BI ratio and its historical average, in line with the assumption used for this scenario. Both Denton and Chow-Lin obtain smaller out-of-sample errors than in previous scenarios, but much larger ones than Cholette-Dagum in this scenario.
Scenario 4: Additive BI
The first three scenarios assume proportionality between the target variable and the indicator. Clearly, this assumption facilitates the work of proportional benchmarking methods, like Denton and Cholette-Dagum; in contrast, the Chow-Lin method, which postulates a model with additive distribution of the residuals, is penalized. Scenario 4 simulates the target variable nX as the sum of an indicator nY (as derived from the
simulated ty ) and a white-noise error nU ,
n n nX Y U . (16)
The error term nU is normally-distributed with (25,15)N . The chosen values for the mean and
variance of the normal distribution allow for sufficient difference (in the levels and rates of change) between the benchmarks nX and the values of the annually-aggregated indicator nY .
Figure 3 shows the MAE statistics for the three methods for Scenario 4 (left-hand side). Chow-Lin clearly outperforms proportional methods when the additive model (16) is used.

15
Figure 3. Mean Absolute Error in Scenario 4 and 5: Chow-Lin improves the out-of-sample accuracy when the benchmark-indicator model is additive
Scenario 4 Scenario 5
Scenario 5: Additive BI with AR(1) residuals
In Scenario 5, model (16) is modified to include an AR(1) model for the residuals nU :
10.5n n nU U w .
This change puts the Chow-Lin method under ideal conditions. In fact, the Chow-Lin method assumes that an AR(1) model for the quarterly residuals.11 In fact, Figure 3 (right-hand side) shows that the Chow-Lin method slightly improves its performance under this scenario. Conversely, the performance of the two proportional benchmarking methods largely deteriorates in Scenario 5 relative to Scenario 4. This finding highlights that proportional benchmarking methods like Denton or Cholette-Dagum are likely to produce inferior out-of-sample results when the difference between the benchmarks and the indicator is autocorrelated.
IV. AN APPLICATION TO NATIONAL ACCOUNTS DATA
The national accounts data considered are annual exports (X-NA) and imports (M-NA) of goods and services. The quarterly indicators are exports of goods (X-MTS) and imports of goods (M-MTS) from the merchandise trade statistics (MTS). MTS data are generally used to compile exports and imports of goods in the national accounts, so it is expected that the quarterly indicators are highly correlated with the annual counterparts. For many countries, however, trends in total exports and imports are found to deviate from those in MTS data due to different movements in the service component.
11 A quarterly AR(1) process corresponds to an annual ARMA(1,1) process. However, an AR(1) assumption for the annual residuals generally improves the fit of the Chow-Lin regression model with respect to non-correlated residuals.
0.0
0.5
1.0
1.5
Denton Cholette-Dagum Chow-Lin0.0
0.5
1.0
1.5
Denton Cholette-Dagum Chow-Lin

16
The data are taken from the IFS database, which has been developed and maintained by the IMF’s Statistics Department. This exercise is conducted for 87 countries. Countries were selected based on data availability in the IFS. The selected countries are those with full information for the national accounts and MTS data between 2000 and 2012 (13 years, 52 quarters) as of March 2015.12
The exercise consists in calculating one-year-ahead estimates of annual X-NA and M-NA based on the quarterly X-MTS and M-MTS indicators, respectively. The three benchmarking methods discussed in this paper are applied.
The one-year-ahead estimates are obtained through a recursive (expanding window) exercise. The first year extrapolated is 2007. For 2007, the annual data for X-NA and M-NA are taken for 2000–2006 (seven years); the X-MTS and M-MTS series are used until the fourth quarter of 2007 (2000q1-2007q4, 32 quarters). The three methods are then used to extrapolate figures for the 2007 quarters. For each method, the annual aggregation of the four extrapolated quarters provides the one-year-ahead estimate of 2007. The same process is followed for each method and for the years 2008–2012.
Likewise the simulation exercise, the three methods are compared on the basis of their out-of-sample accuracy. For each year extrapolated, the one-year-ahead prediction error is computed by calculating the relative difference (in percent) between the one-year-ahead estimate from each method and the true annual value. More precisely,
, ,,
,
ˆˆ 100i n i n
i ni n
X XE
X
where ,i nX is the true annual value of the target variable (i.e., exports or imports) for year n
of the i-th country, ,ˆ
i nX is the one-year-ahead estimate of each method, and n is a time index
covering the six years 2007-2012. Overall, the exercise generated a total of 3,132 one-year-ahead estimates (i.e., 2 series x 87 countries x 6 years x 3 methods). Mean absolute error (MAE), mean error (ME), and standard deviation (SD) are calculated from all the 3,132
annual extrapolation errors ,ˆ
i nE .
Furthermore, in the national accounts application the three methods are also compared in terms of revisions. The benchmarking process produces revised numbers when annual forecasts are replaced by actual values. Clearly, it is desirable that the benchmarking process minimizes the size of revisions. In particular, the impact on the short-term movements should
12 The list of countries is available in Annex Table 1. Detailed results on each country (not shown in the paper) are available upon request.

17
be limited. To detect this revision effect, the mean absolute revision (MAR) of the latest three years of quarterly changes is used
1
1
( ) ( )4( 1), ,( ) ( )
4( 2) 1 , 1 , 1
ˆ ˆ1ˆ ˆ(12) (87)
m m
m m
X Xmi t i t
X Xi t m i t i t
x xMAR
x x
, (17)
where the superscripts ( 1mX ) and ( mX ) indicate the final annual observation used in the
benchmarking process.
Table 1 presents the MAE, mean error (ME), standard deviation (SD), and mean absolute revision (MAR) statistics for X-NA and M-NA. The Chow-Lin method produces the most accurate extrapolations with this dataset. In fact, the Chow-Lin method yields a lower MAE than the Denton and Cholette-Dagum methods for both X-NA and M-NA. A possible explanation for the inferior performance of Denton and Cholette-Dagum is that the two methods are unable to pick up the different trends shown by exports and imports of services, which are not covered in the MTS data. On the other hand, the Chow-Lin method detects such differences and incorporates this information in the estimated regression coefficients and residuals. This helps improve the accuracy of its one-year-ahead estimates.
For similar reasons, Denton performs slightly better than Cholette-Dagum. Denton is expected to perform better then Cholette-Dagum (with AR(1) error) when the difference (or the ratio) between the annual benchmarks and the indicator series show a slowly moving trend (i.e., when the BI ratio moves along an upward or downward trend). This tendency seems to be present in this dataset.
Table 1. Summary statistics of the national accounts exercise
X-NA M-NA
Denton Cholette-Dagum Chow-Lin Denton Cholette-Dagum Chow-LinMean Absolute Error 8.0% 8.7% 6.4% 5.6% 5.9% 5.1% Mean Error 0.2% -0.1% -2.1% -0.2% 0.0% -2.1% Standard Deviation 13.3% 14.0% 9.7% 8.8% 9.0% 7.7% Mean Absolute Revision 1.0% 1.1% 1.1% 0.6% 0.7% 0.9%

18
Figure 4. Morocco Exports: Chow-Lin outperforms the other methods (a) Quarterly benchmarked series
Source: IFS, Author’s calculations.
(b) Annual BI ratio
Source: IFS, Author’s calculations.
Figure 4 shows a clear case where the Chow-Lin method prevails over the two other methods. The charts refer to the one-year-ahead estimate of Morocco’s exports of national accounts for the year 2012 (based on quarterly data for Morocco’s exports from merchandise trade statistics until 2012q4). Panel (a) shows the three benchmarked series (gray line for Denton, blue line for Cholette-Dagum, red dotted line for Chow-Lin), the indicator series (black line), and the (rescaled) annual benchmarks (black dotted horizontal line) from 2009 to 2012.
The chart shows that the indicator and the annual benchmarks move along different trends: in particular, the indicator moves much faster than the benchmark figures during the years 2009–2010. Most likely, this means that the services component grows at slower rates than the goods component during those years. The Chow-Lin method detects this evidence and returns a one-year-ahead estimate of 2012 that is below the pattern shown by the indicator. In contrast, Denton and Cholette-Dagum replicate the short-term movements in the indicator. This determines for both methods an overstatement in the one-year-ahead estimate of 2012 compared with the true value.
Panel (b) of Figure 4 shows the annual BI series, including the ratio for 2012 (which is considered “unknown” at the time of the projection). The sharp movements in the BI ratio between 2008 and 2010 show that X-NA and X-MTS for Morocco grew at very different rates during those years, which makes the extrapolation task for mechanical benchmarking methods such as Denton and Cholette-Dagum extremely complicated.
Notwithstanding the lowest MAE value, the Chow-Lin is shown to underestimate the true annual value for many series. In fact, the mean error (ME) statistic for Chow-Lin shows on average 2.1 percent downward bias in the one-year-ahead estimate for both X-NA and M-NA. In contrast, both Denton and Cholette-Dagum do not present evidence of bias in their projections. Figure 5 shows the case of Jamaica’s exports, where the Chow-Lin produces a downward biased out-of-sample estimate of 2012.
4.0E+07
4.5E+07
5.0E+07
5.5E+07
6.0E+07
6.5E+07
7.0E+07
7.5E+07
8.0E+07
8.5E+07
2009q1 2010q1 2011q1 2012q1
Denton Cholette-Dagum Chow-Lin
Indicator Annual
0.80
0.85
0.90
0.95
1.00
1.05
1.10
1.15
2000 2002 2004 2006 2008 2010 2012
Annual BI ratio Average BI
19
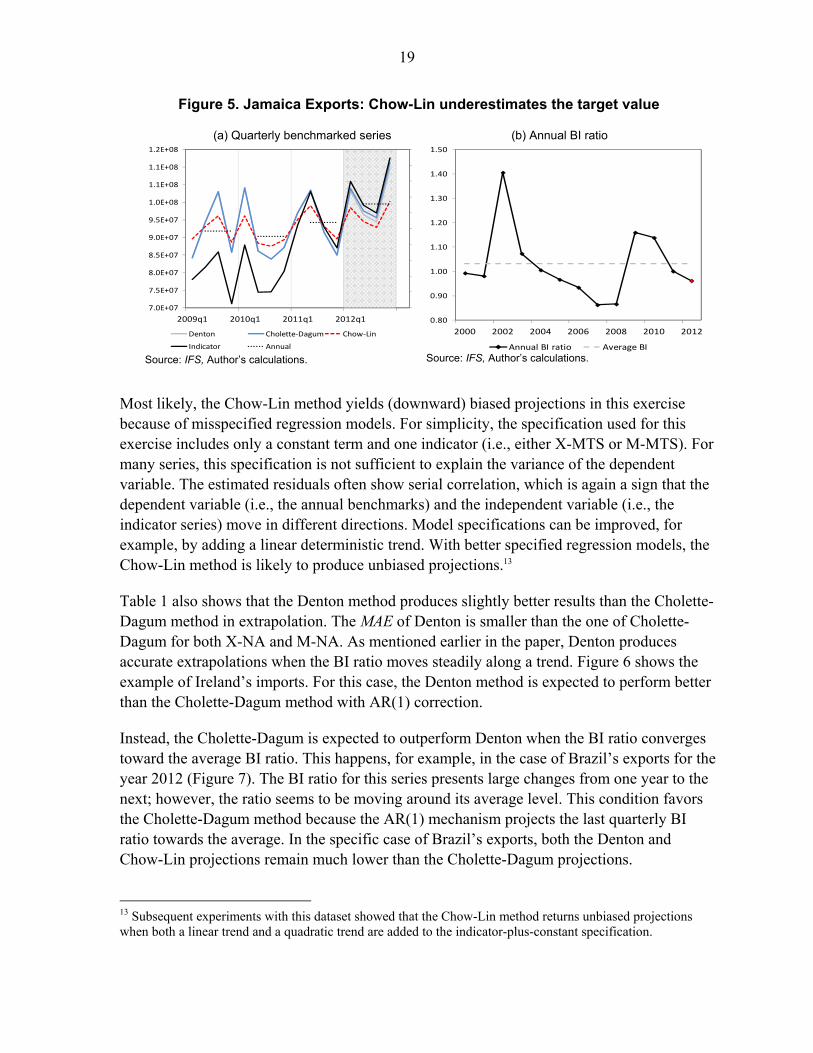
Figure 5. Jamaica Exports: Chow-Lin underestimates the target value
(a) Quarterly benchmarked series
Source: IFS, Author’s calculations.
(b) Annual BI ratio
Source: IFS, Author’s calculations.
Most likely, the Chow-Lin method yields (downward) biased projections in this exercise because of misspecified regression models. For simplicity, the specification used for this exercise includes only a constant term and one indicator (i.e., either X-MTS or M-MTS). For many series, this specification is not sufficient to explain the variance of the dependent variable. The estimated residuals often show serial correlation, which is again a sign that the dependent variable (i.e., the annual benchmarks) and the independent variable (i.e., the indicator series) move in different directions. Model specifications can be improved, for example, by adding a linear deterministic trend. With better specified regression models, the Chow-Lin method is likely to produce unbiased projections.13
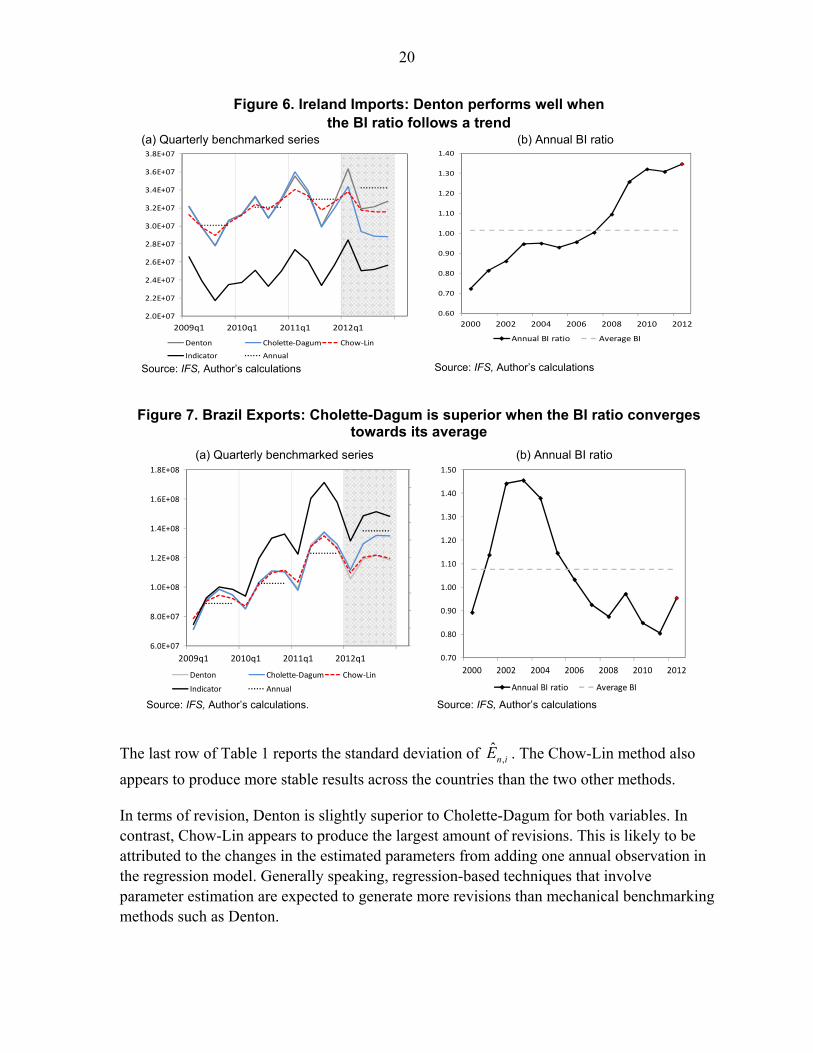
Table 1 also shows that the Denton method produces slightly better results than the Cholette-Dagum method in extrapolation. The MAE of Denton is smaller than the one of Cholette-Dagum for both X-NA and M-NA. As mentioned earlier in the paper, Denton produces accurate extrapolations when the BI ratio moves steadily along a trend. Figure 6 shows the example of Ireland’s imports. For this case, the Denton method is expected to perform better than the Cholette-Dagum method with AR(1) correction.
Instead, the Cholette-Dagum is expected to outperform Denton when the BI ratio converges toward the average BI ratio. This happens, for example, in the case of Brazil’s exports for the year 2012 (Figure 7). The BI ratio for this series presents large changes from one year to the next; however, the ratio seems to be moving around its average level. This condition favors the Cholette-Dagum method because the AR(1) mechanism projects the last quarterly BI ratio towards the average. In the specific case of Brazil’s exports, both the Denton and Chow-Lin projections remain much lower than the Cholette-Dagum projections.
13 Subsequent experiments with this dataset showed that the Chow-Lin method returns unbiased projections when both a linear trend and a quadratic trend are added to the indicator-plus-constant specification.
7.0E+07
7.5E+07
8.0E+07
8.5E+07
9.0E+07
9.5E+07
1.0E+08
1.1E+08
1.1E+08
1.2E+08
2009q1 2010q1 2011q1 2012q1
Denton Cholette-Dagum Chow-Lin
Indicator Annual
0.80
0.90
1.00
1.10
1.20
1.30
1.40
1.50
2000 2002 2004 2006 2008 2010 2012
Annual BI ratio Average BI
20
Figure 6. Ireland Imports: Denton performs well when the BI ratio follows a trend
(a) Quarterly benchmarked series
Source: IFS, Author’s calculations
(b) Annual BI ratio
Source: IFS, Author’s calculations
Figure 7. Brazil Exports: Cholette-Dagum is superior when the BI ratio converges towards its average
(a) Quarterly benchmarked series
Source: IFS, Author’s calculations.
(b) Annual BI ratio
Source: IFS, Author’s calculations
The last row of Table 1 reports the standard deviation of ,ˆ
n iE . The Chow-Lin method also
appears to produce more stable results across the countries than the two other methods.
In terms of revision, Denton is slightly superior to Cholette-Dagum for both variables. In contrast, Chow-Lin appears to produce the largest amount of revisions. This is likely to be attributed to the changes in the estimated parameters from adding one annual observation in the regression model. Generally speaking, regression-based techniques that involve parameter estimation are expected to generate more revisions than mechanical benchmarking methods such as Denton.
2.0E+07
2.2E+07
2.4E+07
2.6E+07
2.8E+07
3.0E+07
3.2E+07
3.4E+07
3.6E+07
3.8E+07
2009q1 2010q1 2011q1 2012q1
Denton Cholette-Dagum Chow-Lin
Indicator Annual
0.60
0.70
0.80
0.90
1.00
1.10
1.20
1.30
1.40
2000 2002 2004 2006 2008 2010 2012
Annual BI ratio Average BI
6.0E+07
8.0E+07
1.0E+08
1.2E+08
1.4E+08
1.6E+08
1.8E+08
2009q1 2010q1 2011q1 2012q1
Denton Cholette-Dagum Chow-Lin
Indicator Annual
0.70
0.80
0.90
1.00
1.10
1.20
1.30
1.40
1.50
2000 2002 2004 2006 2008 2010 2012
Annual BI ratio Average BI

21
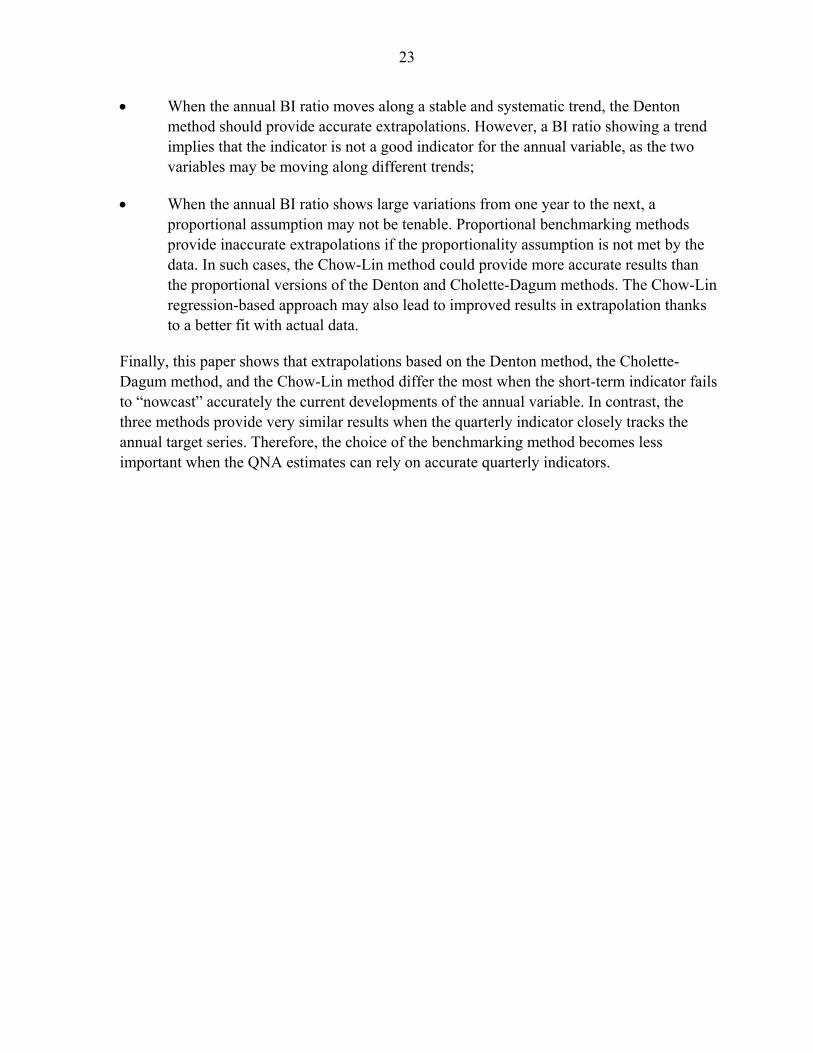
One additional finding relates to the quarterly periods covered by annual benchmarks. The Chow-Lin method tends to produce smoother benchmarked series than Denton and Cholette-Dagum when the correlation between the indicator and the annual series is low. In such cases, the residuals of the Chow-Lin regression model tend to be unrelated with the short-term movements in the indicator, for they are distributed on the basis of a pure AR(1) error model. When the estimated fit is poor, the residual component is likely to dominate the variance in the benchmarked series. Consequently, the Chow-Lin method is expected to produce benchmarked series with rates of change that deviate from those of the indicator. Conversely, the Denton method is designed to preserve as much as possible the rates of change of the indicator, whatever is the relationship between the two variables. Figure 8 shows the example of Armenia’s imports, where the Chow-Lin method (red line) produces a smoother benchmarked series than Denton (black line). This is obtained at a cost of a larger distance from the movements shown by the indicator.
Figure 8. Armenia Imports: Chow-Lin produces smoother series than Denton when the correlation between annual data and quarterly indicator is low
Source: IFS, Author’s calculations.
10000000
110000000
210000000
310000000
410000000
510000000
610000000
20
00
q1
20
01
q1
20
02
q1
20
03
q1
20
04
q1
20
05
q1
20
06
q1
20
07
q1
20
08
q1
20
09
q1
20
10
q1
20
11
q1
20
12
q1
Denton Chow-Lin

22
V. CONCLUSIONS
This paper analyzes the out-of-sample accuracy of three widely used benchmarking methods in the compilation of QNA: the proportional Denton method; the proportional Cholette-Dagum method with AR(1) error; and the regression-based Chow-Lin method.
The simulation exercise shows that the performance of each method improves when their underlying assumptions about the relationship between the quarterly indicator the annual benchmarks are met. When the quarterly indicator is proportionally related to the annual benchmarks, and in absence of systematic patterns in the extrapolated year, the proportional Cholette-Dagum method with AR(1) error provides the best performance. Denton performs at its best in extrapolation when a local bias from the previous year persists in the next year. Finally, when the indicator and the benchmarks are not proportionally related, the Chow-Lin guarantees better results than proportional-based methods like Denton and Cholette-Dagum. This is even more so when the quarterly error presents autocorrelation.
The comparison based on a sample of national accounts data tells a different story. The objective was to calculate one-year-ahead estimates of annual exports and imports data of national accounts using merchandise trade statistics for 87 countries. In most cases, the Chow-Lin method is shown to produce the most accurate extrapolations. The service component (i.e., which is included in the annual exports and imports series of national accounts, but not in the quarterly indicators) is better captured by the Chow-Lin regression model than purely mechanical adjustment methods such as Denton and Cholette-Dagum, especially for those countries with diverging trends between exports and imports of goods and services. On the other hand, the results also show that the Chow-Lin method systematically understates the true annual value due to misspecifications of the regression model. Furthermore, a larger amount of revisions to quarterly changes is noted in the results from the Chow-Lin method compared with the other methods. Needless to say, these findings are specific to the dataset used and cannot be generalized.
This paper contains useful results that can help improve the quality of QNA estimates. They suggest that a time series analysis of the annual BI ratio – the ratio between the annual benchmarks and the annually aggregated indicator series – is crucial in identifying breakdowns in the historical relationship between the annual benchmarks and the quarterly indicator, especially for the most recent periods.
In particular, the time-series properties of the annual BI ratio may help determine which of the three benchmarking methods can provide the best results in extrapolation:
When the annual BI ratio moves closely around an average level, the proportional Cholette-Dagum method with AR(1) error is expected to provide the best results. Overall, the simulation experiment shows that calculating extrapolations by assuming convergence-toward-mean for the BI ratio is a safety net against over- or under-estimation of annual benchmarks;
23
When the annual BI ratio moves along a stable and systematic trend, the Denton method should provide accurate extrapolations. However, a BI ratio showing a trend implies that the indicator is not a good indicator for the annual variable, as the two variables may be moving along different trends;
When the annual BI ratio shows large variations from one year to the next, a proportional assumption may not be tenable. Proportional benchmarking methods provide inaccurate extrapolations if the proportionality assumption is not met by the data. In such cases, the Chow-Lin method could provide more accurate results than the proportional versions of the Denton and Cholette-Dagum methods. The Chow-Lin regression-based approach may also lead to improved results in extrapolation thanks to a better fit with actual data.
Finally, this paper shows that extrapolations based on the Denton method, the Cholette-Dagum method, and the Chow-Lin method differ the most when the short-term indicator fails to “nowcast” accurately the current developments of the annual variable. In contrast, the three methods provide very similar results when the quarterly indicator closely tracks the annual target series. Therefore, the choice of the benchmarking method becomes less important when the QNA estimates can rely on accurate quarterly indicators.

24
ANNEX. LIST OF COUNTRIES WITH AVAILABLE EXPORT AND IMPORT SERIES FOR 2000–2012 IN THE MARCH 2015 EDITION OF IFS
Albania Israel Anguilla Italy Argentina Jamaica Armenia, Republic of Japan Aruba Kazakhstan Australia Korea, Republic of Austria Kuwait Bahamas, The Kyrgyz Republic Barbados Latvia Belarus Lebanon Belgium Lithuania Belize Luxembourg Bolivia Macedonia, FYR Botswana Mexico Brazil Mongolia Bulgaria Morocco Burundi Netherlands Canada New Zealand Chile Nicaragua China, P.R.: Hong Kong Norway China, P.R.: Macao Pakistan China, P.R.: Mainland Paraguay Colombia Peru Costa Rica Philippines Croatia Poland Czech Republic Portugal Denmark Romania Dominica Russian Federation Ecuador South Africa Egypt Spain El Salvador St. Kitts and Nevis Finland St. Lucia France St. Vincent and the Grenadines Georgia Sweden Germany Switzerland Grenada Thailand Guatemala Tonga Haiti Turkey Honduras Uganda Hungary Ukraine Iceland United Kingdom India United States Indonesia Uruguay Ireland

25
References
Bloem, A., Dippelsman, R., Mæhle, N. (2001), Quarterly National Accounts Manual:
Concepts, Data Sources, and Compilation, IMF, Washington DC. Cholette, P.A., and E.B. Dagum (1994), “Benchmarking Time Series with Autocorrelated
Survey Errors,” International Statistical Review, Vol. 62(3), 365–377. Chow, G.C., and A. Lin (1971), “Best Linear Unbiased Interpolation, Distribution, and
Extrapolation of Times Series by Related Series,” The Review of Economic and Statistics, Vol. 53(4), pp. 372–375.
Denton, F. (1971), “Adjustment of Monthly or Quarterly Series to Annual Totals: An
Approach based on Quadratic Minimization,” Journal of the American Statistical Association, Vol. 66, pp. 99–102.
Dagum, E.B., and P.A. Cholette (2006), Benchmarking, Temporal Disaggregation, and
Reconciliation Methods for Time Series, Springer edition. Di Fonzo, T., and M. Marini (2012a), “Benchmarking Time Series according to a Growth
Rates Preservation Principle,” Journal of Economic and Social Measurement, Vol. 37(3), pp. 225–252.
Di Fonzo, T., and M. Marini (2012b), “On the Extrapolation with the Denton Proportional
Benchmarking Method,” IMF Working Paper Series, WP/12/169. Fernández, R. B. (1981) “A Methodological Note on the Estimation of Time Series,” The
Review of Economics and Statistics, Vol. 63(3), pp. 471–476. Eurostat (2013), Handbook on quarterly national accounts, Manuals and Guidelines. IMF (2014), “Chapter 6. Benchmarking and Reconciliaiton,” first draft of the update of the
Quarterly National Accounts Manual: Data sources, Methods, and Compilation techniques, 2001 version.
Litterman, R. B. (1983) “A Random walk, Markov model for the Distribution of Time
Series,” Journal of Business and Economic Statistics, Vol. 1(2), pp. 169–173.