november 21, 2016 - cubic corporation corp q4fy16 slides... · 21-11-2016 · november 21, 2016...
TRANSCRIPT

November 21, 2016
Fiscal Year 2016 Fourth-Quarter and Full-Year Results Conference Call
Bradley H. Feldmann President and Chief Executive Officer
John “Jay” D. Thomas Executive Vice President and Chief Financial Officer
Mark A. Harrison Senior Vice President and Corporate Controller
Safe Harbor
This presentation contains forward-looking statements within the meaning of Section 21E of the Securities Exchange Act of 1934,
as amended, that are subject to the “safe harbor” created by those sections. Any statements about our expectations, beliefs,
plans, objectives, assumptions or future events or our future financial and/or operating performance are not historical and may
be forward-looking. These statements are often, but not always, made through the use of words or phrases such as “may,” “will,”
“anticipate,” “estimate,” “plan,” “project,” “continuing,” “ongoing,” “expect,” “believe,” “intend,” “predict,” “potential,”
“opportunity” and similar words or phrases or the negatives of these words or phrases. These statements involve estimates,
assumptions and uncertainties, including those discussed in “Risk Factors” in the Company’s annual report on Form 10-K for the
year ended September 30, 2016, and throughout this presentation that could cause actual results to differ materially from those
expressed in these statements.
Because the risk factors referred to above could cause actual results or outcomes to differ materially from those expressed in any
forward-looking statements made by us or on our behalf, you should not place undue reliance on any forward-looking statements.
In addition, past financial and/or operating performance is not necessarily a reliable indicator of future performance and you
should not use our historical performance to anticipate results or future period trends. Further, any forward-looking statement
speaks only as of the date on which it is made, and we undertake no obligation to update any forward-looking statement to reflect
events or circumstances after the date on which the statement is made or to reflect the occurrence of unanticipated events. New
factors emerge from time to time, and it is not possible for us to predict which factors will arise. In addition, we cannot assess the
impact of each factor on our business or the extent to which any factor, or combination of factors, may cause actual results to
differ materially from those contained in any forward-looking statements.
2 NYSE: CUB
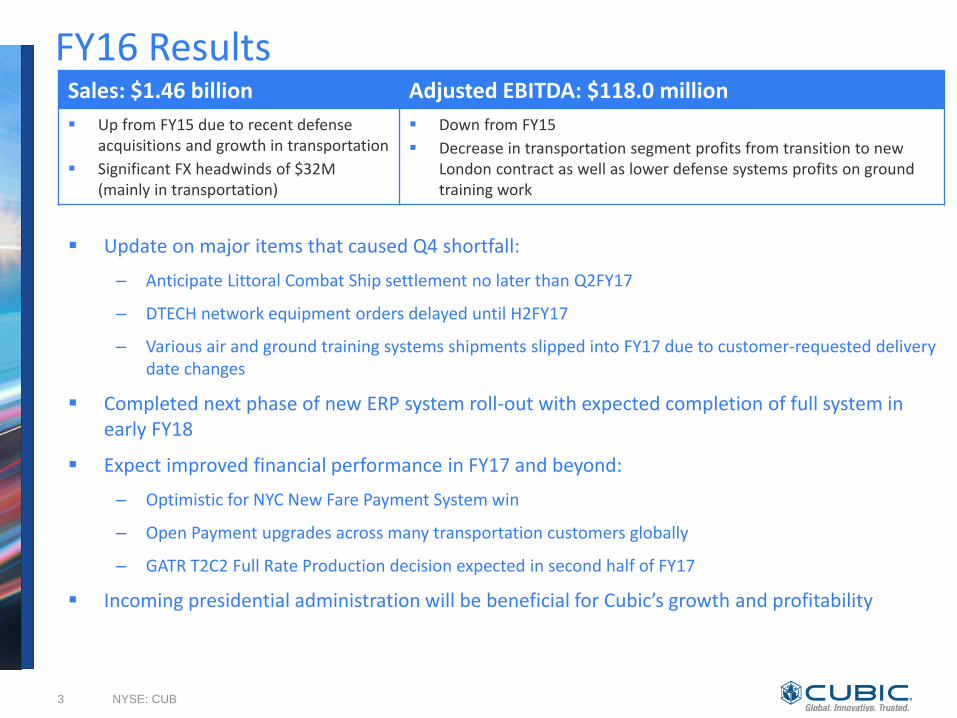
FY16 Results
Update on major items that caused Q4 shortfall:
– Anticipate Littoral Combat Ship settlement no later than Q2FY17
– DTECH network equipment orders delayed until H2FY17
– Various air and ground training systems shipments slipped into FY17 due to customer-requested delivery date changes
Completed next phase of new ERP system roll-out with expected completion of full system in early FY18
Expect improved financial performance in FY17 and beyond:
– Optimistic for NYC New Fare Payment System win
– Open Payment upgrades across many transportation customers globally
– GATR T2C2 Full Rate Production decision expected in second half of FY17
Incoming presidential administration will be beneficial for Cubic’s growth and profitability
NYSE: CUB 3
Sales: $1.46 billion Adjusted EBITDA: $118.0 million
Up from FY15 due to recent defense acquisitions and growth in transportation
Significant FX headwinds of $32M (mainly in transportation)
Down from FY15
Decrease in transportation segment profits from transition to new London contract as well as lower defense systems profits on ground training work

Strategy Update GOAL 2020
By Winning the Customer, we are targeting $2B+ with 10%+ EBITDA margin, growing 10%+ year-on-year
Strategic focus areas for growth are: NextCity, C4ISR, and NextTraining
Improving productivity and efficiency through One Cubic initiatives, which will result in increased profitability
STRATEGIC OBJECTIVES STATUS UPDATE
WINNING THE CUSTOMER
Provide superior solutions, spurred by innovation and ultimate customer focus
BUILDING NEXTCITY GLOBALLY
Expand from mass transit fare collection to smart mobility information & payments provider
GROWING C4ISR BUSINESS
Expand from secure communications to expeditionary communications leader
BUILDING NEXTTRAINING GLOBALLY
Provide innovative, integrated LVC-G solutions to enable performance-based training
LIVING ONE CUBIC
Rebuild infrastructure that is scalable, efficient and effective; share technology, processes & people
4 NYSE: CUB
Leveraging OneAccount in many cities around the world Submitted NYC bid with Cubic customer TfL as a partner Won TfL asset management services for bike-sharing scheme Opened London Innovation Centre
Establishing expeditionary communications leadership
position; multiple awards for GATR and TeraLogics Working to transition T2C2 program to full-rate production HALO R&D contract
Shifting to Performance-Based Training Naval game-based training advantage with LCS LVC Air Combat Training edge with AFRL contract Providing live training on JSF; won SOF re-compete
Successful ERP roll-out in 10/16; complete by early FY18 Decreased supply chain vendors by half – savings started Singapore Thomson-East Coast line win due to One Cubic
(sharing of expertise across Defense and Transportation)
Innovation Blue Ribbon award for LVC Military Training Innovation award for Chicago Ventra app (1M downloads) Multiple innovation awards for NextAgent

Consolidated Operating Highlights
Sales up 2% YOY despite FX headwinds of $32.2M, but down 5% in Q4 on U.S. DOD funding delays and shipment slips into FY17
Operating income down for the year due to lower margins in defense systems and transportation, acquisition-related costs, as well as planned One Cubic ERP costs
5
Year Ended September 30, Three Months Ended
September 30,
In Millions, except EPS 2016 2015 2016 2015 Sales $1,461.7 $1,431.0 $406.6 $425.9 Adjusted EBITDA* $118.0 $140.5 $35.7 $53.9 % to Sales 8.1% 9.8% 8.8% 12.7% Operating income $7.2 $75.4 $10.5 $34.7 % to Sales 0.5% 5.3% 2.6% 8.1% GAAP diluted EPS $0.06 $0.85 ($0.28) $0.75
*See schedules on slides 13 - 18 (appendix) for detailed reconciliations of these non-GAAP financial measures to the directly comparable GAAP financial measures
NYSE: CUB
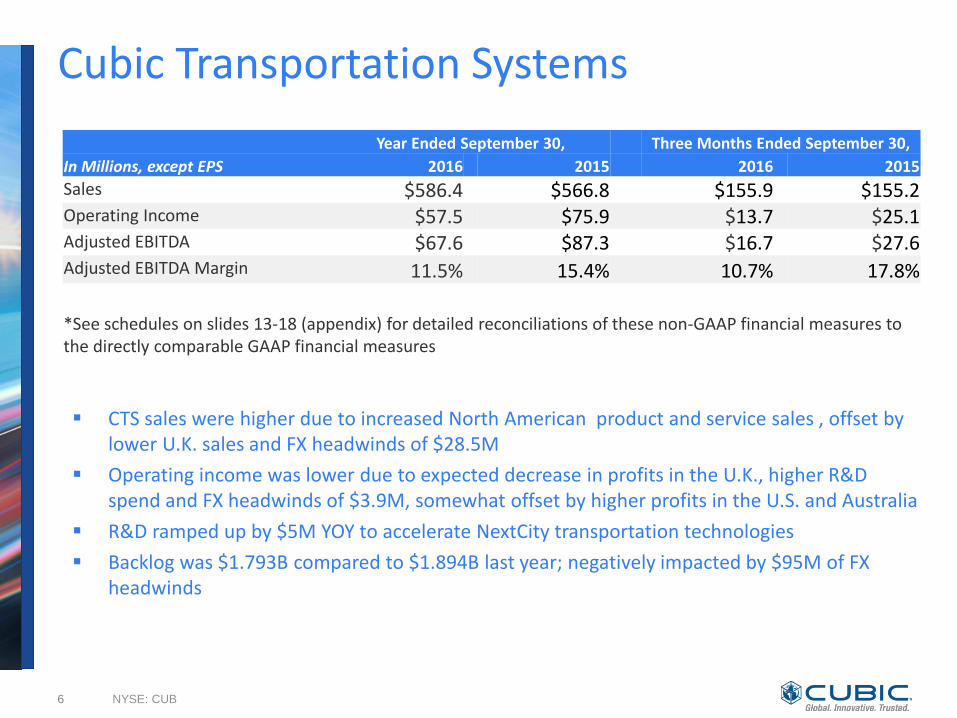
Cubic Transportation Systems
NYSE: CUB 6
CTS sales were higher due to increased North American product and service sales , offset by lower U.K. sales and FX headwinds of $28.5M
Operating income was lower due to expected decrease in profits in the U.K., higher R&D spend and FX headwinds of $3.9M, somewhat offset by higher profits in the U.S. and Australia
R&D ramped up by $5M YOY to accelerate NextCity transportation technologies
Backlog was $1.793B compared to $1.894B last year; negatively impacted by $95M of FX headwinds
Year Ended September 30, Three Months Ended September 30,
In Millions, except EPS 2016 2015 2016 2015
Sales $586.4 $566.8 $155.9 $155.2 Operating Income $57.5 $75.9 $13.7 $25.1 Adjusted EBITDA $67.6 $87.3 $16.7 $27.6 Adjusted EBITDA Margin 11.5% 15.4% 10.7% 17.8%
*See schedules on slides 13-18 (appendix) for detailed reconciliations of these non-GAAP financial measures to the directly comparable GAAP financial measures

Cubic Global Defense Systems
7
Sales increased 5% YOY on recent acquisitions and higher air combat shipments, somewhat offset by lower ground training, datalink and DTECH sales (funding delays)
Operating income impacted by $32.7M of acquisition-related costs
Adjusted EBITDA was 8.2% compared to 10.2% last year, reflecting lower sales on high margin DTECH products, as well as lower ground profits due to cost growth
Backlog was $576.8M compared to $595.7M last year due to lower air and ground training work, somewhat offset by recent acquisitions
NYSE: CUB
Year Ended September 30, Three Months Ended September 30,
In Millions, except EPS 2016 2015 2016 2015
Sales $484.2 $462.1 $152.9 $166.9 Operating Income (Loss) $(17.1) $18.4 $6.6 $15.6 Adjusted EBITDA $39.7 $47.3 $16.5 $24.8 Adjusted EBITDA Margin 8.2% 10.2% 10.8% 14.9%
*See schedules on slides 13-18 (appendix) for detailed reconciliations of these non-GAAP financial measures to the directly comparable GAAP financial measures

Cubic Global Defense Services
8 NYSE: CUB
Sales for Defense Services were down 3% YOY on lower contract activity for the U.S. Army, U.S. Marine Corps and Special Forces
Adjusted EBITDA of $16.9M was up slightly over last year due to better cost control
Backlog was $570.3M compared to $485.7M last year due to an award from the U.S. Navy totaling $64.0M
Year Ended September 30, Three Months Ended September 30,
In Millions, except EPS 2016 2015 2016 2015
Sales $391.1 $402.1 $97.8 $103.8 Operating Income $11.2 $6.6 $1.9 $2.4 Adjusted EBITDA $16.9 $16.2 $2.3 $5.0 Adjusted EBITDA Margin 4.3% 4.0% 2.4% 4.8%
*See schedules on slides 13-18 (appendix) for detailed reconciliations of these non-GAAP financial measures to the directly comparable GAAP financial measures

Key Balance Sheet and Cash Flow Data
9
A/R days increased due to lower customer advances and some slow payments from international customers
Overseas cash balances impacted by a decline in the British Pound
Total debt increased due to the acquisitions of GATR Technologies and TeraLogics
Cap Ex includes $20.3M of capitalized cost for the new ERP System
NYSE: CUB
Key Balance Sheet Data
In Millions September 30,
2016 September 30,
2015
Cash $ 197.1 $ 218.5
Restricted cash 75.6 69.3
Marketable securities 13.0 30.5
Total $ 285.7 $ 318.3
Gross accounts receivable, net of customer advances $ 332.4 $ 281.8
Inventory $ 66.4 $ 63.7
Total debt $ 441.0 $ 186.7
Key Cash Flow Data Year Ended September 30, Quarter Ended September 30,
In Millions 2016 2015 2016 2015
Cash flow from operations $44.6 $89.7 $39.2 $43.2
Capital expenditures ($33.1) ($22.2) ($6.2) ($6.5)
Dividends paid ($7.3) ($7.3) $3.6 3.6
Cash paid for acquisitions ($243.5) ($92.2) - $2.0

FY17 Guidance
10 NYSE: CUB
Strong organic growth expected in defense systems in FY17 in the C4ISR Mission Solutions portfolio transportation growth tied to winning NYC and growth of open payment markets
Constructively cautious on defense services business given election changes
Expect good rebound in profitability on less ERP spend and legacy acquisition cost somewhat offset by higher R&D spend
Higher R&D spend tied to next generation technologies and pre-award spend on pivotal contracts in both defense systems and transportation
1 FY17 Guidance assumes no new M&A activity. Key foreign exchange rates used in this forecast compared to the U.S. dollar are as follows: British pound – 1.22; Australian dollar – .76; New Zealand dollar – .72. 2 Adjusted EBITDA assumes add back of estimated $35 - $45 million (~$10M capitalized) of costs related to strategic investment in ERP and $8 - $12 million of legacy acquisition-related expenses.
FY17 Guidance
Total Sales1 (constant currency) $1.505B to $1.555B
Operating Income $30M to $50M
EBITDA $80M to $100M
Adjusted EBITDA2 $120M to $140M 8.0% to 9.0% of Sales
GAAP EPS $.40 to $.80

Summary
Strategy is sound; we are making great progress on our Goal 2020 strategic objectives
Disappointed in FY16 shortfall due to delayed defense funding, however, we fully expect catch up in FY17
Expect improved financial performance in FY17, especially in Defense Systems/C4ISR business
Will complete rest of ERP implementation by early FY18 – expect to see significant savings, growth and efficiency
FY17 will be a pivotal year for Cubic
NYSE: CUB 11

Appendices
Earnings before interest, taxes, depreciation and amortization (EBITDA) and Adjusted EBITDA
– Year Ended September 30, 2016 and 2015
– Three Months Ended September 30, 2016 and 2015
GAAP to Non-GAAP Reconciliation Adjusted Operating Income
GAAP to Non-GAAP Reconciliation Adjusted Diluted EPS
NYSE: CUB 12
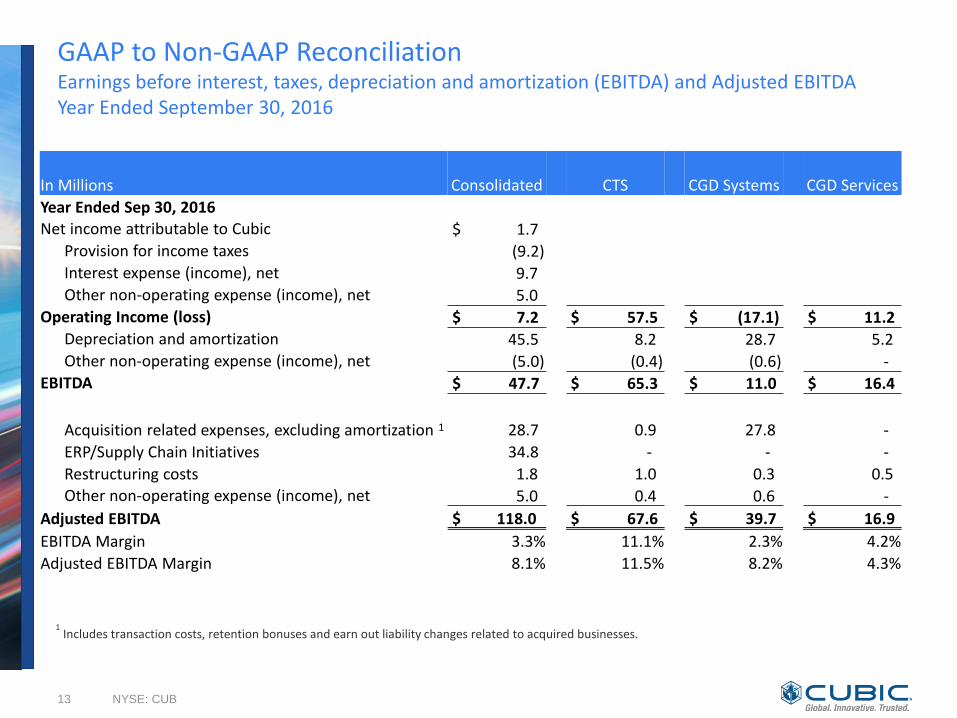
GAAP to Non-GAAP Reconciliation Earnings before interest, taxes, depreciation and amortization (EBITDA) and Adjusted EBITDA Year Ended September 30, 2016
13 NYSE: CUB
1 Includes transaction costs, retention bonuses and earn out liability changes related to acquired businesses.
In Millions Consolidated CTS CGD Systems CGD Services
Year Ended Sep 30, 2016 Net income attributable to Cubic $ 1.7 Provision for income taxes (9.2) Interest expense (income), net 9.7 (1.2) $ - $ (0.1)
Other non-operating expense (income), net 5.0 0.4 $ 0.6 $ -
Operating Income (loss) $ 7.2 $ 57.5 $ (17.1) $ 11.2
Depreciation and amortization 45.5 8.2 28.7 5.2
Other non-operating expense (income), net (5.0) (0.4) (0.6) -
EBITDA $ 47.7 $ 65.3 $ 11.0 $ 16.4
Acquisition related expenses, excluding amortization 1 28.7 0.9 27.8 -
ERP/Supply Chain Initiatives 34.8 - - -
Restructuring costs 1.8 1.0 0.3 0.5 Other non-operating expense (income), net 5.0 0.4 0.6 -
Adjusted EBITDA $ 118.0 $ 67.6 $ 39.7 $ 16.9
EBITDA Margin 3.3% 11.1% 2.3% 4.2%
Adjusted EBITDA Margin 8.1% 11.5% 8.2% 4.3%

GAAP to Non-GAAP Reconciliation Earnings before interest, taxes, depreciation and amortization (EBITDA) and Adjusted EBITDA Year Ended September 30, 2015
14 NYSE: CUB
1 Includes transaction costs, retention bonuses and earn out liability changes related to acquired businesses.
In Millions Consolidated CTS CGD Systems CGD Services
Year Ended Sep 30, 2015 Net income attributable to Cubic $ 22.9 Provision for income taxes 49.0 Interest expense (income), net 2.6 (1.2) (0.4) - Other non-operating expense (income), net 0.9 1.0 4.5 (0.1) Operating Income (loss) $ 75.4 $ 75.9 $ 18.4 $ 6.6
Depreciation and amortization 37.7 10.8 17.1 8.5
Other non-operating expense (income), net (0.9) (1.0) (4.5) 0.1
EBITDA $ 112.2 $ 85.7 $ 31.0 $ 15.2
Acquisition related expenses, excluding amortization 1 7.9 0.1 7.2 0.6
ERP/Supply Chain Initiatives 13.3 - - -
Restructuring costs 6.2 0.5 4.6 0.5
Other non-operating expense (income), net 0.9 1.0 4.5 (0.1)
Adjusted EBITDA $ 140.5 $ 87.3 $ 47.3 $ 16.2
EBITDA Margin 7.8% 15.1% 6.7% 3.8%
Adjusted EBITDA Margin 9.8% 15.4% 10.2% 4.0%
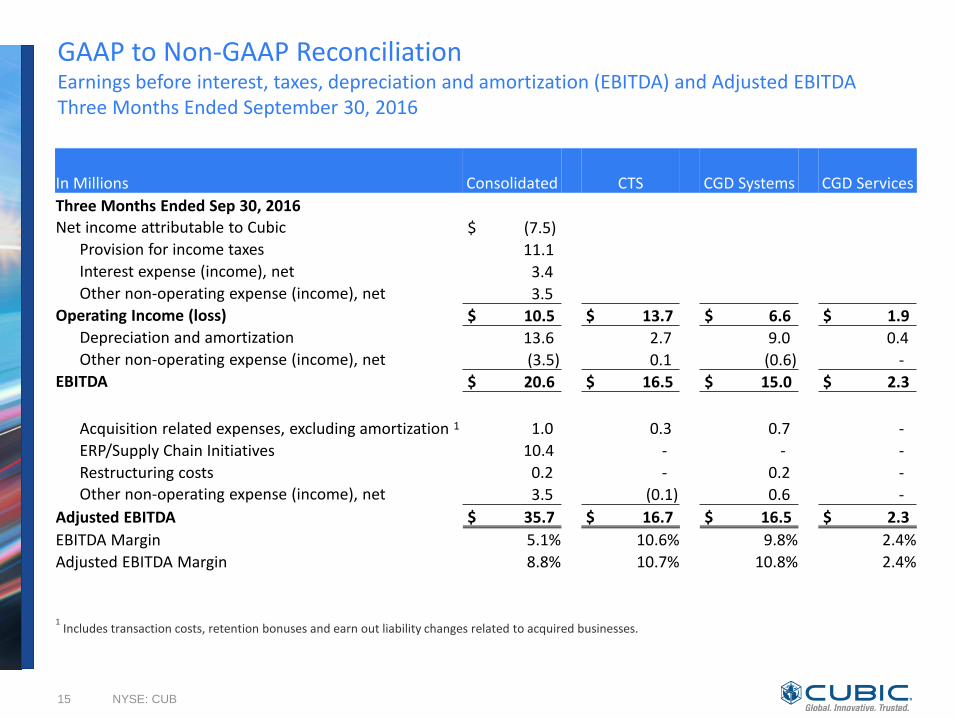
GAAP to Non-GAAP Reconciliation Earnings before interest, taxes, depreciation and amortization (EBITDA) and Adjusted EBITDA Three Months Ended September 30, 2016
15 NYSE: CUB
1 Includes transaction costs, retention bonuses and earn out liability changes related to acquired businesses.
In Millions Consolidated CTS CGD Systems CGD Services
Three Months Ended Sep 30, 2016
Net income attributable to Cubic $ (7.5)
Provision for income taxes 11.1
Interest expense (income), net 3.4 (0.2) - (0.1)
Other non-operating expense (income), net 3.5 (0.1) 0.6 - Operating Income (loss) $ 10.5 $ 13.7 $ 6.6 $ 1.9 Depreciation and amortization 13.6 2.7 9.0 0.4 Other non-operating expense (income), net (3.5) 0.1 (0.6) -
EBITDA $ 20.6 $ 16.5 $ 15.0 $ 2.3
Acquisition related expenses, excluding amortization 1 1.0 0.3 0.7 -
ERP/Supply Chain Initiatives 10.4 - - -
Restructuring costs 0.2 - 0.2 -
Other non-operating expense (income), net 3.5 (0.1) 0.6 -
Adjusted EBITDA $ 35.7 $ 16.7 $ 16.5 $ 2.3
EBITDA Margin 5.1% 10.6% 9.8% 2.4%
Adjusted EBITDA Margin 8.8% 10.7% 10.8% 2.4%

GAAP to Non-GAAP Reconciliation Earnings before interest, taxes, depreciation and amortization (EBITDA) and Adjusted EBITDA Three Months Ended September 30, 2015
NYSE: CUB 16
1 Includes transaction costs, retention bonuses and earn out liability changes related to acquired businesses.
In Millions Consolidated CTS CGD-Systems CGD-Services
Three Months Ended Sep 30, 2015
Net income attributable to Cubic $ 20.0
Provision for income taxes 14.1
Interest expense (income), net 0.9 (0.4) (0.2) - Other non-operating expense (income), net (0.3) (0.7) 4.2 - Operating Income (loss) $ 34.7 $ 25.1 $ 15.6 $ 2.4 Depreciation and amortization 9.0 2.4 3.9 2.2 Other non-operating expense (income), net 0.3 0.7 (4.2) - EBITDA $ 44.0 $ 28.2 $ 15.3 $ 4.6
Acquisition related expenses, excluding amortization 1 4.0 0.1 4.7 0.2
ERP/Supply Chain Initiatives 5.4 - - -
Restructuring costs 0.8 - 0.6 0.2 Other non-operating expense (income), net (0.3) (0.7) 4.2 -
Adjusted EBITDA $ 53.9 $ 27.6 $ 24.8 $ 5.0
EBITDA Margin 10.3% 18.2% 9.2% 4.4%
Adjusted EBITDA Margin 12.7% 17.8% 14.9% 4.8%

GAAP to Non-GAAP Reconciliation Adjusted Operating Income
17 NYSE: CUB
Year Ended
September 30 Three Months Ended
September 30
In Millions 2016 2015 2016 2015
Net income attributable to Cubic $ 1.7 $ 22.9 $ (7.5) $ 20.0
Add:
Interest expense (income), net 9.7 2.6 3.4 0.9
Provision for income taxes (9.2) 49.0 11.1 14.1
Other non-operating expense (income), net 5.0 0.9 3.5 (0.3)
Operating Income $ 7.2 $ 75.4 $ 10.5 $ 34.7
Acquisition related expenses 1 28.7 7.9 1.0 4.0
ERP/Supply Chain Initiatives 34.8 13.3 10.4 5.4
Restructuring costs 1.8 6.2 0.2 0.8
Adjusted Operating Income $ 72.5 $ 102.8 $ 22.1 $ 44.9
Operating Income Margin 0.5% 5.3% 2.6% 8.1%
Adjusted Operating Income Margin 5.0% 7.2% 5.4% 10.5%
1 Includes transaction costs, retention bonuses and earn out liability changes related to acquired businesses.

GAAP to Non-GAAP Reconciliation Adjusted Diluted EPS
18 NYSE: CUB
Year Ended
September 30 Three Months Ended
September 30
In Millions 2016 2015 2016 2015
Diluted earnings per share attributable to Cubic $ 0.06 $ 0.85 $ (0.28) $ 0.75
Add:
Acquisition related expenses 1 0.90 0.18 0.02 0.09
ERP/Supply Chain Initiatives 1 0.78 0.30 0.23 0.12
Deferred tax valuation allowance adjustment (0.34) 1.40 0.44 0.28
Restructuring costs 1 0.04 0.14 - 0.02
Adjusted diluted earnings per share attributable to Cubic $ 1.44 $ 2.87 $ 0.41 $ 1.26
1 Net of applicable income taxes