november 2017 improving college - palomar.edu fileppic.org improving college pathways in california...
TRANSCRIPT

NOVEMBER 2017
Niu Gao and Hans Johnson
Supported with funding from the Dirk and Charlene Kabcenell Foundation, the Evelyn and Walter Haas, Jr. Fund, the James Irvine Foundation, the Leona M. and Harry B. Helmsley Charitable Trust, and the Sutton Family Fund
Improving College Pathways in California

© 2017 Public Policy Institute of California
PPIC is a public charity. It does not take or support positions on any ballot measures or on any local, state, or federal legislation, nor does it endorse, support, or oppose any political parties or candidates for public office.
Short sections of text, not to exceed three paragraphs, may be quoted without written permission provided that full attribution is given to the source.
Research publications reflect the views of the authors and do not necessarily reflect the views of our funders or of the staff, officers, advisory councils, or board of directors of the Public Policy Institute of California.

PPIC.ORG Improving College Pathways in California 3
Introduction 5
Roadblocks in High School 6
Improving Pathways through College 16
Policy Recommendations 22
References 25
About the Authors 27
Acknowledgments 27
Technical appendices to this paper are available on the PPIC website.
Far too many California students are falling off the pathway to and through college. At current rates of high school and college completion, only about 30 percent of California 9th graders will earn a bachelor’s degree, a rate that is insufficient for an economy that increasingly demands more highly educated workers.
In this study, we examine college pathways in high school, at California’s community colleges, and at California State University (CSU). We find that most students exit the pathway in the last two years of high school or the first two years of college. In addition, we find
Most of California’s high school graduates are not prepared for college. Even with significant increases over the past ten years, only 45 percent of the graduating class of 2016 complete the college preparatory courses—known as the a–g courses—required to be considered for admission to CSU or the University of California. Completion of these courses is also a strong indicator of success in community colleges. Math and English are critical subject areas.
Even academically prepared students are falling off the pathway. Among our sample of high schools, students who successfully pass the first college preparatory math course, 34 percent do not take the next one—even though 13 percent earned an A and 22 percent a B in the class. In community colleges, close to 20 percent of well-prepared students are directed toward developmental—remedial—courses, which have been shown to slow progress.
Eliminating progression problems in our sample of high schools would increase the a–g completion rate by 18 percentage points. More importantly, it would reduce racial/ethnic and socioeconomic disparities in student outcomes. Addressing progression problems in college would translate to 28 percent more community college transfers and 16 percent more students earning a bachelor’s degree.
Students historically underrepresented in higher education are more likely to drop off the pathway at every stage. In high school, the difference in math completion rates between the highest performing group (Asian American students) and the lowest (African American and Latino students) more than doubles by graduation. At CSU, African American students are much more likely to drop out in their first two years (35%) than are Asian American students (19%).
CSU does not have adequate capacity to enroll qualified students. Eligibility targets were set 50 years ago and do not reflect current changes in the state’s economy or education system. In the past four
CONTENTS
SUMMARY

PPIC.ORG Improving College Pathways in California 4
years, CSU has turned away more than 69,000 qualified California high school graduates, who have completed the a–g course requirements. With more high school graduates expected to complete the a–g sequence, CSU’s capacity constraints are likely to limit students’ access to higher education.
To improve the pathway to and through college, we recommend a number of policy actions, including updating high school graduation requirements and increasing the number of a–g approved courses. At every stage, improvements in academic counseling and course placement policies will help students stay on the path. Capacity improvements at CSU are essential. Finally, California needs a statewide longitudinal database that tracks individual student progress from kindergarten through college graduation in order to improve systems and assess outcomes more effectively.

PPIC.ORG Improving College Pathways in California 5
Introduction
Earning a bachelor’s degree has tremendous economic benefits, not only for individuals, but also for the state (Card 1999; Hanushek and Woessmann 2008). PPIC has projected that the state’s economy will increasingly demand more highly educated workers—and if current trends persist, the state will face a shortfall of 1.1 million of these workers by 2030 (Johnson, Cuellar, and Bohn 2015). Improvements in high school graduation, college enrollment, and college completion are necessary to meet that demand. Despite some recent gains, far too many students in California fail to successfully navigate the pathway through high school and college to earn a degree. Understanding where students fall off that pathway is essential if we are to improve educational outcomes in the state.
The good news is that demand for college is strong. The vast majority of California parents (85%) want their child to eventually earn a bachelor’s or graduate degree (Baldassare et al. 2017). National surveys show that a majority of 9th graders expect to complete a bachelor’s or graduate degree, and almost all high school seniors (more than 90%) have some postsecondary aspirations (NCES 2012).
In striking contrast to these goals, about 70 percent of California 9th graders will not earn a bachelor’s degree. Students fall off the pathway to college completion at various points: some don’t finish high school, others never enroll in college, and some enroll in college but never earn a degree (Figure 1). We find that the last two years of high school and the first two years in college are critical, as the vast majority of students who fall off the pathway to a college degree do so at these junctures. For instance, among those who do not earn a bachelor’s degree, half (51%) never finish high school or finish high school but do not enroll in college. Almost half (49%) enroll in two-year or four-year colleges but never transfer or earn a degree.1
FIGURE 1 Too few California high school students complete college
SOURCE: PPIC calculations, based on current rates of high school completion, college enrollment, and college completion; rates calculated using data from the California Department of Education (2015–16), the California Community Colleges (2015), the California State University (2015), the University of California (2015), and the Integrated Postsecondary Education Data System (2014).
1 For a detailed estimation of where students fall off the pathway to college completion, please refer to Technical Appendix A.

PPIC.ORG Improving College Pathways in California 6
Most high school students in California are not prepared for college by the time they graduate.2 A small share of students drop out of high school entirely, but more commonly students graduate from high school without completing the college preparatory courses—known as the a–g courses—required to be considered for admission to the California State University and University of California systems.3 Completion of these requirements is also an important element of success at community college, since it allows students to take higher-level transfer courses, speeding them along the pathway toward a certificate, degree, or a transfer to a four-year university.
The first two years of college present other challenges. A large number of community college students are slowed down by placement in developmental—or remedial—courses (Cuellar, Rodriguez, and Johnson 2016). And 25 percent of CSU freshmen drop out by the end of their second year (Jackson and Cook 2016).4
In this report we use a unique longitudinal dataset to identify when students fall off the college pathway, which students fall off, and the factors that drive these outcomes. Where possible, we use statewide data to provide context for our results, but most of our work relies on a large longitudinal sample of high school students who we can follow to some community colleges and CSU campuses (see Technical Appendix B for details). Students in our sample tend to have lower test scores, which means that results from this sample highlight issues facing lower-performing students and schools. Improving college pathways for these students is key to closing the persistent statewide achievement gaps. This focus also has important policy implications because recent reforms —including the federal Every Student Succeeds Act of 2015 and its predecessor No Child Left Behind of 2001, and the state’s new Local Control Funding Formula—have focused on the turnaround of low-performing schools (US Department of Education 2001, 2015, California Department of Education 2013).
The first section of this report examines high school, with a focus on a–g completion in the key areas of English, math, and science. Next, we look at community colleges and the CSU system, touching on issues of preparation, course enrollment, and capacity. Finally, we provide policy recommendations directed at the high school and college levels, identifying policies and interventions that will help more students to successfully make their way along the college pathway.
Roadblocks in High School
In this section, we focus on completion of a–g courses as a way of tracking student progress along the college pathway. Successful completion of these courses not only means that students are eligible to be considered for admission to CSU and UC, but—as we shall see—helps students in many other ways during their academic careers.
Courses used by high schools—including online schools—to satisfy the a–g requirements must be submitted to and approved by both CSU and UC. It is important to note that not every high school in California offers the full sequence of courses in every subject area—a troubling situation that we address in our policy recommendations
2 A tremendous amount of research has focused on high school dropouts, but much less research has been done on students who finish high school but are not prepared for college. In California, 10 percent of 9th graders drop out of high school and another 45 percent will graduate without completing the a-g courses (California Department of Education, 2017a). Our focus here is on the latter (and much larger) group. 3 Other college readiness measures include the statewide assessment tests taken by 11th graders in public high schools. The tests, known as the Smarter Balanced Summative Assessments, are used to provide high school students with information on whether they are ready for college level work in English and math. CSU and most community colleges use the results of the test to determine if students could be exempted from remediation (although CSU’s recent decision to eliminate remediation might mean that the results are no longer pertinent). In 2017, 60 percent of 11th graders met or exceeded the standards in ELA but only 32 percent met or exceeded the standards in math. While a useful measure, the tests do not replace the a-g course requirements for UC and CSU eligibility. 4 In 2016, 38 percent of CSU freshmen were required to take remedial courses in either English or math. However, beginning in Fall 2018, CSU will no longer place students into remedial courses.
PPIC.ORG Improving College Pathways in California 7
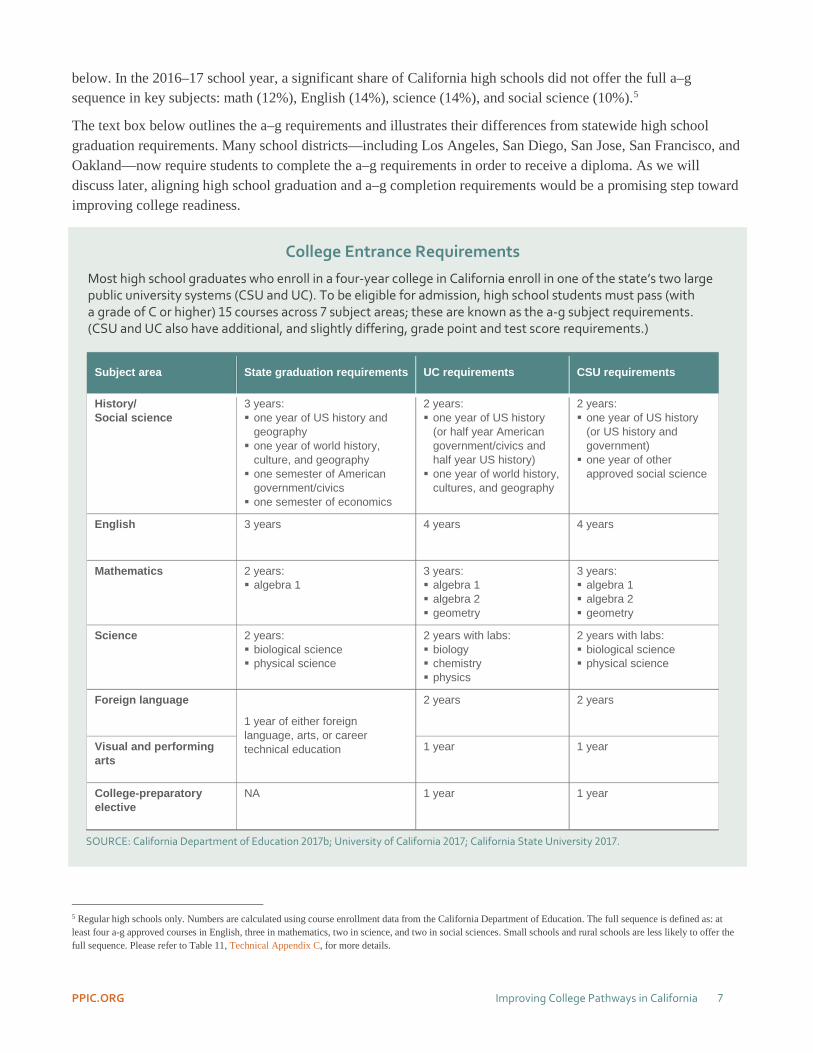
below. In the 2016–17 school year, a significant share of California high schools did not offer the full a–g sequence in key subjects: math (12%), English (14%), science (14%), and social science (10%).5
The text box below outlines the a–g requirements and illustrates their differences from statewide high school graduation requirements. Many school districts—including Los Angeles, San Diego, San Jose, San Francisco, and Oakland—now require students to complete the a–g requirements in order to receive a diploma. As we will discuss later, aligning high school graduation and a–g completion requirements would be a promising step toward improving college readiness.
5 Regular high schools only. Numbers are calculated using course enrollment data from the California Department of Education. The full sequence is defined as: at least four a-g approved courses in English, three in mathematics, two in science, and two in social sciences. Small schools and rural schools are less likely to offer the full sequence. Please refer to Table 11, Technical Appendix C, for more details.
College Entrance Requirements
Most high school graduates who enroll in a four-year college in California enroll in one of the state’s two large public university systems (CSU and UC). To be eligible for admission, high school students must pass (with a grade of C or higher) 15 courses across 7 subject areas; these are known as the a-g subject requirements. (CSU and UC also have additional, and slightly differing, grade point and test score requirements.)
Subject area State graduation requirements UC requirements CSU requirements
History/ Social science
3 years: one year of US history and
geography one year of world history,
culture, and geography one semester of American
government/civics one semester of economics
2 years: one year of US history
(or half year American government/civics and half year US history) one year of world history,
cultures, and geography
2 years: one year of US history
(or US history and government) one year of other
approved social science
English 3 years 4 years 4 years
Mathematics 2 years: algebra 1
3 years: algebra 1 algebra 2 geometry
3 years: algebra 1 algebra 2 geometry
Science 2 years: biological science physical science
2 years with labs: biology chemistry physics
2 years with labs: biological science physical science
Foreign language
1 year of either foreign language, arts, or career technical education
2 years 2 years
Visual and performing arts
1 year 1 year
College-preparatory elective
NA 1 year 1 year
SOURCE: California Department of Education 2017b; University of California 2017; California State University 2017.

PPIC.ORG Improving College Pathways in California 8
The following analysis draws on administrative data from 24 districts in California. Our sample includes 141,307 high school graduates from the classes of 2007 to 2014, representing about 5 percent of California’s high school graduates (for more details, see Technical Appendix B).6
Math and English are critical to a–g completion Only 20 percent of high school graduates in our sample complete the a–g course requirements (compared to 38% of high school graduates statewide over the same time period, 2007 to 2014). When we impose grade requirements—CSU and UC require a minimum grade of C—just 14 percent of graduates do so. Almost all of those who do not complete the requirements fail to finish the English or math sequences. Majorities of those students also do not complete science and foreign language requirements (84% each). Some students are just one course short of meeting the a–g requirements, but most need to complete two or more courses.
Figure 2 shows the number of high school graduates in our sample completing each subject area sequence. Only 36 percent complete the English requirements and 42 percent complete the math requirements with a minimum grade of C. Slightly more than half complete the foreign language (51%), science (54%), and social science (57%) requirements. This variation may be due to the nature of each subject (i.e., math and science are usually considered more difficult than social science). It may also reflect the differences between the a–g and state graduation requirements in these subjects. The state requires three courses in English, two in math (one must be algebra 1), and one in foreign language, while the universities require an additional course in each subject area—i.e., four courses in English, three in math (elementary algebra, advanced algebra, and geometry), and two in foreign language.7 In science, while both high schools and universities require two years of instruction, universities have more stringent requirements in specific disciplines.
The completion rate is lower among male, African American, Latino, low-income students, and students whose parents do not have a college degree. We see the largest achievement gaps in science, in which only 41 percent of African American students completed the a–g sequence, compared to 75 percent of Asian American students. Despite differences between these groups, all high school graduates in our sample, regardless of their gender, race/ethnicity, family income, and parental education levels, have the lowest completion rate in math and English (see Technical Appendix C).
6 Compared to statewide average, our sample includes a larger share of low-income, low-performing students. Because of this, our results may not be generalized to all schools in the state. This is not necessarily a drawback of our study, as recent education reforms (e.g., Every Student Succeeds Act and its predecessor No Child Left Behind) have prioritized the turnaround of low-performing schools. 7 The low completion rate in English may also be attributed to English Learners, as about 13 percent of students in our sample took at least one English development (ELD) course. While advanced level ELD courses may be used to meet the a-g requirements, students on ELD pathways may not have sufficient time to complete the full sequence, which requires four years of a-g approved courses.

PPIC.ORG Improving College Pathways in California 9
FIGURE 2 Completion of a–g requirements varies widely across subjects
SOURCE: Authors’ calculations based on Cal-PASS Plus sample data.
NOTE: Sample restricted to 97,209 high school graduates with complete four-year high school transcripts from 2007 to 2014. Each column refers to % graduates completing a–g sequence in each subject area with a C or better. Dotted columns refer to % graduates completing each requirement with a grade of D or better.
Grades 11 and 12 are key exit points Most students in our sample—including those who eventually fall off the a–g pathway—start their high school journey by taking at least one a–g course in math or English (Figure 3). Students exit the pathway at all grades, but grades 11 and 12 see the most dramatic decrease in participation in a–g courses. Seventy-two percent of non-completers took (at least) one a–g math course in grade 9, but only 43 percent did so in their senior year.8 Only 40 percent of non-completers took a–g science in grade 9 and the number decreased to 23 percent in grade 12. The attrition rate is roughly the same in math and science, though the participation rate is higher in math, which may reflect the differences in a–g requirements among subject areas—only two years are required in science while three years are required in math. In English, where the requirement is four years, the participation rate decreases in grade 11 and then levels off.
The decline in a–g course-taking occurs across broad categories of student characteristics, including gender, race/ethnicity, family income, and parental education. For instance, while there is some difference across groups in a–g participation, all groups see a dramatic decline in a–g participation in grades 11 and 12.9 Low participation in college preparatory courses, particularly during key transition years, not only has significant implications for students’ readiness for college but also affects later educational outcomes, as rigorous course-taking has been shown to boost outcomes in high school and beyond (Long, Conger, and Iatarola 2012; Joensen and Nielsen 2009; Levine and Zimmerman 1995; Rose and Betts 2004).
8 Student enrollment has remained largely stable across grades. 9 These results are available upon request.
57%
36%42%
54% 51%
74%82%
0%
20%
40%
60%
80%
100%
Social Science(a)
English (b) Math (c ) Science (d) ForeignLanguage (e)
Art (f) Electives (g)
% completing a-g
% completing a-g,with C or better

PPIC.ORG Improving College Pathways in California 10
FIGURE 3 Progress in a–g coursework falls sharply after grade 10
SOURCE: Authors’ calculations using Cal-PASS Plus data.
NOTE: Sample restricted to schools offering the full a–g sequence in each subject area to tease out the effect of course-offerings. Because the number of schools offering the full sequence varies by subject area, the sample includes 37,618 (in science) to 48,334 (in math) non-completers from 2007 to 2014 school years. Results using the full sample (e.g., all students, all schools) are similar.
Progression is a major concern Why do students fall off the pathway to college readiness?10 We find that a significant number of students on the pathway simply stall out. We do not find so-called bottleneck courses—those with high failure rates—to be a dominant factor in determining progression: overall passing rates in a–g courses are reasonably high and increase in later grades (Technical Appendix C). A student’s family background (e.g., family income, parental education) and pre-high school preparation are important and most likely play a role in keeping students on a pathway to college, but most students in our sample start high school on the a–g track.11 And while we cannot fully tease out the effects of high school course offerings, particularly access to rigorous courses within schools, these effects do not appear to be a major factor either, as the share of schools in our sample offering a–g courses is very high (≥95%) and increases with grade levels (Technical Appendix C).12
Our work instead points to a simple lack of progression—especially troubling because it is even occurring among academically prepared students. Failure to progress through the a–g math sequence is most striking (Figure 4). This sequence is linear, requiring students to finish courses in a prescribed order. We find that among students who successfully pass algebra 1, only 66 percent move on to take the next a–g course in the sequence (geometry or equivalent) in subsequent years.13 Similarly, among students who pass a–g geometry, only 59 percent take the next course in the sequence, algebra 2; and among students who complete algebra 2, less than half (47%) go on to
10 Existing research on student persistence, advanced course-taking, and high school graduation has suggested multiple factors including course failure, family background (including poverty and parents’ education), inequitable access to rigorous courses, pre-high school preparation, and peer effects (Allensworth and Easton 2007; Klopfenstein 2004; Riegle-Crumb 2006; Stevenson, Schiller, and Schneider 1994; Zietz and Joshi, 2004; Solorzano and Ornelas 2004; Handwerk et al. 2008). 11 Of course, as shown later for math, some students started high school farther ahead of their peers. Students who took algebra 1 in middle school were much more likely to complete the a-g sequence in math than other students, most likely due to selection bias. 12 Since it is empirically very hard to distinguish offerings from takings—for instance, schools may not offer calculus courses because the demand is very low—we have restricted the sample to schools offering the full a-g sequence in each subject area. 13 About a third of our high school students took a-g algebra 1, 86 percent of whom passed the course. The actual number may be higher because many students take algebra 1 before high schools.
72%
43%
40%23%
70% 64%
0%
20%
40%
60%
80%
100%
Grade 9 Grade 10 Grade 11 Grade 12
% n
on-c
ompl
eter
s ta
king
a-g
cou
rses
Math
Science
English

PPIC.ORG Improving College Pathways in California 11
take a higher level math course, which includes trigonometry, pre-calculus, probability and statistics, and calculus (Figure 4).
This lack of progression suggests that student preparation alone does not necessarily move students along the college pathway.14 Especially striking is the fact that a significant number of those who have passed the previous math course with good grades do not progress. For instance, among students who have passed algebra 1 with an A or B, 31 percent did not take geometry. This means that more than a third of high-achieving, well-prepared students are falling off the college pathway.15
What did these students do if they did not take the next level a–g math course? Most (59–65%) never enrolled in any math course and among those who did, a vast majority (77–94%) took non a–g math courses.
FIGURE 4 Large shares of students do not progress along the math pathway
SOURCE: Authors’ calculations using Cal-PASS Plus data.
NOTE: Sample includes 454,083 high school students from 2007 to 2014 school years. Sample restricted to schools offering full sequence of a–g math course (covering 96 percent of students in our sample).
The magnitude of this stalling out problem depends on when students take algebra 1, the first course in the a–g sequence. To analyze this problem, we divide students into four groups, depending on their grade level when they first took algebra 1 (Figure 5). Students on pathway I took algebra 1 before high school (mostly in grades 8 and 7), and represent a selective group (19% of our sample is in this group). Students on pathway II first took algebra 1 in grade 9, a relatively common pattern (58% of our sample). Those on pathway III (14% of the sample) took algebra 1 in grade 10, and students on pathway IV (9% of the sample) took algebra 1 in grade 11 or later.16
Students on pathway I have better outcomes, mostly because students who take algebra 1 before high school tend to be high performing students. Yet even among these students, about one third do not complete the a–g math requirement (algebra 2). The decline is more drastic in other pathways and the difference between the highest
14 Because most students fail to meet the math, English, and science requirements, we limit our analysis to these subjects. 15 The numbers are substantially higher among African American students (Technical Appendix C). 16 We grouped them together because the sample is relatively small for each group.
66%59%
47%
69% 68%
59%
0%
20%
40%
60%
80%
100%
Algebra I to geometry Geometry to algebra 2 Algebra 2 to higher math
among students passingprevious math course
among students passingprevious math course with anA or B

PPIC.ORG Improving College Pathways in California 12
performing group and the lowest performing groups has increased. Indeed, students in pathway IV do not have enough time to complete algebra 2 because they start the sequence too late in their high school years.
FIGURE 5 Progression along the math pathway depends on when students start the sequence
SOURCE: Authors’ calculations using Cal-PASS Plus data.
NOTE: Sample includes 454,083 high school students from 2007 to 2014 school years. The sample is restricted to schools offering the full sequence of a–g math courses (serving 96% of students in our sample). Similar gaps exist among all major subgroups, e.g., female, Asian, African American, Latino, low-income (proxied by free/reduced price lunch eligibility) students, and students whose parents have a bachelor’s degree or higher (Technical Appendix C).
Students fall off the pathway in other subject areas as well, including science and English (Figure 6). Since science and English do not share the same hierarchy as the math sequence—for instance, biology is not a prerequisite for physics and some schools may offer physics before biology—we present results in these subjects by grade levels. Among students who pass grade 9 science, 77 percent take grade 10 a–g science. The number plummets to 43 percent by the end of grade 11, probably due to the fact that only two years of science is required for a–g completion.
In English, because the a–g requirement is four years, the persistence rate is higher; however, about 10 to 20 percent of students still fall off the a–g pathway. The largest decline in English enrollment occurs in grade 11, but declines are notable in other years as well.
81%
66%
51%
65%
55%
24%
55%
24%31%
0%
20%
40%
60%
80%
100%
Algebra I to geometry Geometry to algebra 2 Algebra 2 to higher math
Pathway I, start Algebra 1 before high school
Pathway II, start Algebra 1 in 9th grade
Pathway III, start Algebra 1 in 10th grade
Pathway IV, start Algebra 1 in 11th/12th grade

PPIC.ORG Improving College Pathways in California 13
FIGURE 6 Students also fall off the science and English a–g pathway
SOURCE: Authors’ calculations using Cal-PASS Plus data.
NOTE: Sample includes 96,955/97,173 high school graduates with complete four-year transcripts from 2007 to 2014 school years. The sample is restricted to schools that offered full sets of a–g science/English courses. Subgroup results included in Technical Appendix C.
Pathway problems leave underrepresented students further behind Progression problems exacerbate the achievement gap. Students who are historically underrepresented in higher education experience more attrition than others in a–g courses. Latino and African American students have higher attrition rates in the a–g math sequence (Table 1). In our sample, low-income and first generation students are by and large on par with overall averages. The difference between the highest performing group (Asian American students) and the lowest performing group (African American students) almost doubles by the time students leave high schools.
TABLE 1 % of a–g completers moving on to the next level a–g math course, by student characteristics, 2007–2014
Algebra I
completers taking geometry
Geometry completers taking
algebra 2
Algebra 2 completers taking higher level math
Overall 66% 59% 47%
Female 67% 61% 48%
Male 64% 58% 47%
Asian American 80% 74% 64%
African American 66% 52% 38%
White 66% 63% 51%
Latino 67% 58% 44%
Eligible for free or reduced price lunch 70% 59% 46%
First generation college 70% 60% 46%
Gap (highest–lowest performing group) 15% 22% 26%
SOURCE: Authors’ calculations using Cal-PASS Plus data.
NOTE: Sample includes 454,083 high school students from 2007 to 2014 school years. The sample is restricted to schools offering the full sequence of a–g math courses (serving 96% of students in our sample). Results based on pathways are included in Technical Appendix C.
77%67%
43%
0%
20%
40%
60%
80%
100%
Passed 9th grade,moved to 10th
Passed 10th grade,moved to 11th
Passed 11th grade,moved to 12th
Science90%
82% 83%
0%
20%
40%
60%
80%
100%
Passed 9th grade,moved to 10th
Passed 10th grade,moved to 11th
Passed 11th grade,moved to 12th
English

PPIC.ORG Improving College Pathways in California 14
What could explain the differences in advancement rates between groups? While there is a substantial difference in student course performance (e.g., low-income students tend to underperform their affluent peers), this does not fully explain the gap. Our evidence suggests that non-academic factors, such as school placement policies and course counseling, may play an important role in student course-taking and their effects may be even larger among some students.
In Figure 7 the solid columns refer to the actual share of students who complete algebra 1 and later take geometry. Dotted columns are simulated shares after we match each group’s performance to their highest-progressing peers—in this case, Asian American students—such that all groups have the same progression rate within their performance group. Adjusting for group performance eliminates some of the gaps—and in some cases most of the gaps—for instance, among students who would be the first in their families to go to college. But it does not eliminate all of them, as African American and Latino students would still be significantly behind. This suggests that academic preparation does not fully explain the disparities across groups, and non-academic factors, such as course placement and academic counseling, may play an important role in student course-taking decisions.
FIGURE 7 Academic factors do not fully explain the difference in student progression along the a–g pathway
SOURCE: Authors’ calculations using Cal-PASS Plus data.
NOTE: Sample includes 454,083 high school students from 2007 to 2014 school years. The sample is restricted to schools offering the full sequence of a–g math courses. Results are based on a regression of advancement rates on student course grade in a previous course (i.e., geometry). In our simulated scenario, we adjust each group’s course grades such that they perform at the level of their highest-performing peers (i.e., Asian American students, among whom 50 percent passed geometry with a grade of A or B).
Why don’t students progress? Why do students—academically prepared students in particular—fail to advance to the next level a–g courses? A few factors are likely to be involved:
First, high school graduation requirements play an important role in shaping students’ course-taking behavior. California is one of the few states that requires just two years of math (one year in algebra 1) for high school graduation. In recent years most districts (63%) have supplemented the state minimum with additional local requirements, such as requiring an additional year of math. But California as a whole still lags behind other states
Highest performing group (Asian American)
0%
20%
40%
60%
80%
100%
Male Female AfricanAmerican
White Latino Low income Firstgeneration
college
% algebra 1completerstaking geometry
Simulated

PPIC.ORG Improving College Pathways in California 15
and this has affected student course-taking patterns (Gao 2016). For instance, the share of students advancing to geometry (which is not required for high school graduation) decreases sharply, and even fewer students move on to algebra 2.
Second, high school course placement policies and practices also affect student progression, possibly unevenly across students. Our analysis shows sizeable progression gaps in math, science, and English, and these gaps are not solely because students are unprepared academically for the next level of coursework. In fact, some who do not progress have done well in previous courses. Non-academic factors such as course placement policies may be very important.17 The source of this problem is uncertain—in many districts, students have a lot of latitude in choosing their own courses while other districts may use a more systematic approach. Before the state legislature passed the California Mathematics Placement Act (2015), it was not clear, to researchers or to parents, how students were placed into different courses and what kind of criteria were used in the process. High schools should ensure that students are not misplaced—either by the school or by the student—into courses they do not need and courses that do not lead to a–g completion.
Last, course counseling and academic support also affect students’ course-taking decisions. Students, particularly underrepresented students, often attend schools that do not have a strong college-going history. As a result, these students often do not have information about college pathways. In the absence of an effective course counseling and academic support system, these students may fail to progress in the a–g sequence, even when they are ready. This is especially problematic in light of the high educational aspirations that students have for themselves and that parents have for their children.
How many more college-ready students would California have if these issues were addressed? We estimate what would happen if high schools in our sample were able to help all students stay on track to complete the a–g requirements (Figure 8). The solid bars indicate the actual number of students in each category who complete the math sequence with a grade of C or better; the shaded areas indicate the number if all students stayed on track. We find that eliminating progression problems increases the a–g math completion rate by 18 percentage points (from 42% to 60%) and greatly reduces racial/ethnic and socioeconomic disparities.
17 The literature has looked at the effects of ability grouping or tracking on student outcomes (Gamoran 1987, 1992; Oakes and Guiton 1995).

PPIC.ORG Improving College Pathways in California 16
FIGURE 8 Many more students would complete the a–g requirements if progression problems were addressed
SOURCE: Authors’ calculations using Cal-PASS Plus data.
NOTE: Sample includes 141,307 high school graduates from 2007 to 2014 school years. Actual data are the raw a–g completion rates (with a C or better) among high school graduates. Predicted numbers are derived under the following assumptions: first, all algebra 1 completers (with a C or better) successfully take geometry; second, all geometry completers (with a C or better) take algebra 2, the highest level math required by UC/CSU. The predicted numbers may underestimate the number of graduates because research has shown that taking these courses increases students’ probability of graduating from high school.
Clearly, an increased focus on helping students stay on the college pathway during high school is critical. But efforts also need to be taken to ensure success at the college level—the focus of the next section.
Improving Pathways through College
Most of California’s high school graduates attend some type of college—but many do not complete a bachelor’s degree. We estimate that 78 percent of California’s high school graduates attend college somewhere in the United States (see Technical Appendix A). Most of those students attend a community college in California. Indeed, in 2014 California ranked fifth among states in the share of recent high school graduates that go to community college. However, the large majority of students who attend community college do not earn a degree or certificate, and only about 40 percent transfer to a four-year college.
Access to four-year colleges is much more limited in California, with only one in three recent high school graduates enrolling in a four-year college, placing California 47th in the nation. There are sharp differences across groups, with low-income and historically underrepresented students much more likely to enroll in community colleges than four-year colleges (see Technical Appendix A). With such large numbers of students enrolling in college, the central challenge in California is to improve pathways through college.
In our examination of these pathways, we focus on California Community College (CCC) and California State University (CSU)—not only because they are the largest public institutions in the nation, but also because they are the most diverse, enrolling the largest number of traditionally underrepresented students, including African American, Latino, low-income, and first generation college students. Moreover, there is considerable room for
0%
20%
40%
60%
80%
Overall Female Male AsianAmerican
AfricanAmerican
White Latino Low-income FirstGeneration
Actual Data
Predicted

PPIC.ORG Improving College Pathways in California 17
improving pathways to completion at these institutions. At CSU, about 40 percent of freshmen do not earn a bachelor’s degree within six years of enrolling, and the vast majority (60%) of community college students never transfer to a four-year college.
Most students who leave college do so in their first two years. Both CCC and CSU are implementing new initiatives to support students during this critical time period. These changes—including reforms to placement policies and developmental, or remedial, education—have the potential to help many students overcome some of the most significant barriers to advancement that we find.
Improving student success in community college The California Community College (CCC) system is the largest provider of higher education in the United States, enrolling more than 2.1 million students on 114 campuses. Transfer students from CCC to CSU and UC make up a significant share of college graduates, as about a third of UC graduates and half of CSU graduates started from a community college (CCC Chancellor’s Office 2017).
For the following analysis we matched high school graduates in our sample to 18 community colleges near their high schools and followed them over time. Our sample includes 16,792 first-time college students from 2011 to 2015 (for more details see Technical Appendix B). To be able to follow students from high school through college, our sample is selective in certain ways. For example, our sample only includes students who move quickly from high school graduation to community college enrollment. However, despite some differences with statewide averages, this sample provides an important look at the path to community college and student outcomes once enrolled.18
High school preparation is key A critical determinant of student success in community colleges is whether or not students take developmental, or remedial, courses. Participation and performance in a–g courses in high school—including the number of courses taken, the highest-level math course taken, and grades received in rigorous courses—are significant factors in college success. For instance, taking higher level math courses such as calculus or statistics reduces a student’s likelihood of taking a developmental education course by almost 5 percent, and increases the likelihood of taking transfer-level courses by 7 percent. The benefits are larger among historically underrepresented students, including Latino, low-income, and first generation college students. Taking higher level math reduces these students’ likelihood of taking developmental courses by 7 percent, 6 percent, and 5.5 percent respectively (for more details, see Technical Appendix C).
Research has shown that developmental education is the single largest impediment to student success in community college (Cuellar, Rodriguez, and Johnson 2016). Clearly, improving high school preparation is essential to addressing this barrier.
Many prepared students enroll in developmental math or English As in high school, well-prepared students in community college can stall out on the college pathway. We found that many students who are ready to take college-level courses in English and math instead take developmental 18 This matched sample represents about 12 percent of high school graduates in our K–12 sample. Since we restricted our sample to high school graduates (1) who have complete four-year transcripts (so we can identify their a-g completion status), and (2) who enroll in a nearby community college immediately following high school graduation (due to data limitations), our sample is a very selective one; students in our sample have better outcomes than state averages. For instance, 45 percent of students in our sample take at least one transfer level course in Math or English, and only a third are ever enrolled in a developmental education course during their two years in college (compared to 80 percent statewide within six years). Latino and African American students are underrepresented in our sample, but more students in our sample are first generation college students. Please refer to Table 2, Technical Appendix B for more details.

PPIC.ORG Improving College Pathways in California 18
(remedial) courses. These courses do not count for college credit and they slow student progress toward a certificate, degree, or transfer. We found that about 35 percent of students in our sample had completed the a–g sequence in math and English, and yet 30 percent of these students took at least one developmental course in these subjects.19
A major driver of this problem seems to be inaccurate course placement.20 For example, among well-prepared students who had strong high school records and very high likelihood of passing transfer level courses in English and math, close to 20 percent were enrolled in developmental courses, even though most of them had completed higher math in high school. This problem is consistent across broad groups of students (Figure 9). Many factors are likely to be involved, including the validity and reliability of placement assessments, the amount of time between the assessment and the students’ relevant high school coursework, students’ poor showing in the assessment, grade inflation in high school, and the quality and rigor of high school courses. A new state law (Assembly Bill 705, signed in 2017) will require community colleges to focus their assessment and placement decisions on high school courses and grades rather than placement exams. This approach should reduce the amount of misplacement.
FIGURE 9 Many students with a high probability of passing transfer level math/English are placed in development education courses
SOURCE: Authors’ calculations using Cal-PASS Plus data.
NOTE: Sample includes 16,792 first time college freshmen from 2011–2015 school years. The predicted probability is based on a probit model in which the dependent variable is whether a student passes transfer level courses in English and math (in each year/term); and the independent variables include student demographics (gender and race/ethnicity), low-income status (as proxied by free/reduced lunch price eligibility), parental education, disability status, financial aid status, community college fixed effects, term, and school year fixed effects. Among takers the average predicted probability is 0.11 and students with predicted probability higher than 0.11 are considered having a high probability of passing. Please refer to Technical Appendix C for model specifications.
19 Completing the a-g requirements may be a necessary but not sufficient condition for being college ready. For instance, according to CSU analytics, more than 30 percent of students (who are a-g completers) take developmental courses. Even so, when we broadened our analysis to include other factors that indicate a high likelihood of success in transfer-level courses, including demographics, socioeconomic background, and high school coursework (for more detail, see Technical Appendix C), we found that a larger number of students do not end up taking courses that best prepare them for college success. Overall, 62 percent of students in our broader analysis are likely to be eligible for transfer-level courses in math or English but do not take them. Interestingly, this problem is noticeably lower among Latino, low-income, and first generation college students, perhaps because these students tend to be less prepared for college, which means that they are less likely to be ready to take transfer level courses, so mismatch between preparation and course-taking has a smaller effect on them. It is important to note that our sample is not representative of all high school graduates or community college students. 20 Other factors such as the shift to career technical education (CTE) and bottleneck courses in community college may also play a role, but they are unlikely to be the major ones. Only 19 percent of the mismatched students take some CTE courses and the overall passing rate is reasonably high in transfer level courses (77%).
21%
15%
21%
13%
18%19%
17%
14%
0%
5%
10%
15%
20%
25%
30%
Female Male AsianAmerican
AfricanAmerican
Latino White Low Income FirstGeneration

PPIC.ORG Improving College Pathways in California 19
But even among students who pass the gateway transfer level courses in English and math, many do not progress toward earning a degree or transfer (Cuellar, Rodriguez, and Johnson 2016). One possible explanation for this lack of progression is that students do not have a clear understanding of their educational pathways and fail to put together a coherent program of study toward college completion. This combined with the increase in non-traditional attendance patterns, including delayed entry to college, part-time enrollment, and part-time or full-time work obligations, may limit students’ course options. New reforms, termed “guided pathways,” are designed to address some of these problems.
Improving student success at CSU The primary four-year college destination for most high school graduates in California is one of the 23 campuses of the California State University. In this section we draw on statewide data to examine major barriers to student success in CSUs; we then use our administrative data (matching our high school graduates to three CSU campuses near their high schools) to examine the role of high school preparation in addressing these barriers (for more details, see Technical Appendix B).21
Access is a problem
The California’s Master Plan for Higher Education—adopted in 1960—specifies eligibility targets for CSU. In the last four years (2013–2016) CSU reports that more than 69,000 students from California high schools who applied to CSU met the system-wide eligibility requirements but were denied admission. These students, termed “denied eligibles” by CSU, applied to campuses that are “impacted,” meaning that there is insufficient capacity (both physical space and operating funds) to enroll these qualified students. In addition, 35,000 transfer students who met CSU’s eligibility criteria were turned away over the same period of time (Figure 10).
FIGURE 10 Many students are eligible for CSU but are denied admission
SOURCE: California State University, CSU Applications and Admissions for College Year 2013 –14, 2014–16, 2015–16, 2016–17.
NOTE: 1. Number of denied eligibles includes applications from first-time freshmen (66%) and community college transfers (34%). 2. Numbers for other race/ethnic groups (e.g., American Indian), multi race/ethnic group, and unknown race/ethnic group are not shown in the figure.
21 Our analytical sample includes 3,004 first time students from the 2011 to 2015 school years. Latino and female students were underrepresented in our sample, and African American, low-income, and first generation college students are overrepresented. Students in our sample tend to have lower persistence rates, as only 77 percent return after the first year (compared to 84% system wide). This has the implication that our findings can only be applied to similar settings, e.g., colleges with a large proportion of low-income, first generation college students.
1,039
4,082
10,191
7,199
0
2,000
4,000
6,000
8,000
10,000
12,000
2013 2014 2015 2016
# of
den
ied
elig
ible
s
African American
Asian American
Latino
White

PPIC.ORG Improving College Pathways in California 20
CSU is in the process of developing a referral pool to redirect these students to campuses that are not impacted (Jackson and Cook 2016). However, without expansion at impacted campuses, the increase in the number of college-ready high school graduates will not translate into more college graduates. A recently released study of eligibility found that just over 40 percent of high school graduates are meeting CSU’s eligibility criteria (Silver et al. 2017). This is higher than in previous years and higher than the Master Plan target of 33 percent. Strong improvement in college preparation among high school graduates is a positive outcome and argues for a rethinking of Master Plan targets (Johnson 2010, 2016).
Persistence in the first two years is critical Among students enrolled in CSU, one of the largest impediments to success is the relatively low persistence rate—and hence low graduation rates (CSU 2016). The vast majority of students who drop out do so in their first two years (Figure 11). Across the system, about 16 percent of students starting in 2010 dropped out in their first year; another 9 percent did so in their second year. By the end of the fifth year, slightly more than a third (34%) left CSU.
FIGURE 11 Large numbers of CSU freshmen drop out in their first two years
SOURCE: California State University, 2006-2015 Degree-Seeking First-Time Freshmen Campus Reports.
Why do students fall off the pathway in college?
Our analysis suggests that a number of issues explain student progress in college. Student performance, choice of major, and pre-collegiate preparation explain some of the barriers to progression. Students earning fewer credit units or having lower GPAs are less likely to persist. In our sample, we find that a student’s academic performance (as measured by GPA) is the most important predictor of persistence. For instance, the average GPA among dropouts is 2.0, compared to 2.5 among those who stay in school. Dropouts also earn 38 percent fewer credits each year. At the same time, we find that students majoring in science, technology, engineering, and mathematics (STEM) areas are slightly less likely to drop out.
16% 16% 17%25%
18%12% 14%
9% 9% 10%
10%
9%
7%10%
7% 6%8%
9%
8%
7%5%
2% 2%3%
4%
3%
2%2%
0%
10%
20%
30%
40%
50%
60%
All Female Male AfricanAmerican
Latino Asian American White
% s
tude
nts
drop
ping
out
1st year
2nd year
3rd year
4th year
5th year

PPIC.ORG Improving College Pathways in California 21
High school preparation is key to student success at CSU. Students who did not take a–g math or science in their high school senior year or students with lower GPAs are more likely to have persistence issues.22 As shown in Figure 12, taking a–g courses in math and science in grades 11 and 12 is an important predictor of student performance (GPA) at CSU. If students also complete those a–g courses with high grades, their GPA would be a full point higher (3.3 versus 2.3). Because of their strong high school preparation, these students are much more likely to stay on the pathway to a bachelor’s degree.
FIGURE 12 High school preparation predicts CSU grade point average
SOURCE: Authors’ calculations using Cal-PASS Plus Data.
NOTE: These simulations are based on coefficients from an OLS model. The dependent variable is CSU GPA in a given year, and other independent variables include student demographics, family income (proxied by their free/reduced lunch eligibility in high schools), parental education, highest math course by grade 11, took grade 12 math, average grade in other a–g subject areas, CSU campus fixed effects and school year fixed effects. All numbers are significant at 1 percent level.
CCC and CSU have in recent years taken major initiatives to improve student persistence and completion—in particular, reforming developmental education, revamping placement measures, eliminating developmental courses, and improving graduation rates in CSU. These are important steps toward bettering student outcomes and producing more college graduates to meet the needs of the state’s economy.
What if California successfully addressed progression problems in community colleges and ensured that all eligible students were able to enroll in CSU? Estimates based on our sample show that these actions would translate to 28 percent more community college transfers and 16 percent more students earning a bachelor’s degree.
22 Existing research has found other personal, institutional, and social factors that may affect students’ decision to drop out. These include the amount and timing of student financial aid, academic advising and counseling, student self-efficacy and goal orientation, family background, and college organization structures (Ishitani and DesJardins 2002; Heisserer and Parette 2002; Hsieh, Sullivan, and Guerra 2007; Daugherty and Lane 1999; Cabrera, Nora, and Castaneda 1993)
2.52 2.50
2.89
3.33
Baseline GPA at CSU
2
2.2
2.4
2.6
2.8
3
3.2
3.4
Took 12th grade math orscience
Took higher math in grade 11 Above average a-g grades Did all three
Aver
age
GPA

PPIC.ORG Improving College Pathways in California 22
Policy Recommendations
In California and the nation, educators and policy officials are increasingly focused on college readiness and success. Across the nation, curriculum reforms have been designed to ensure that more students are both college and career ready when they graduate from high school. In California, additional K–12 funding has targeted school districts with large shares of students who have historically been less likely to graduate from high school ready for college, including English language learners and low-income students.23 The state’s community colleges have implemented a number of reforms focusing on improving student outcomes, including changes in developmental education, and CSU has initiated programs to improve on-time graduation rates. These and other efforts are leading to advances in college readiness and success; however, there is still room for improvement, particularly among students who have been underrepresented in higher education.
In this report we focus on two key parts of the college pathway: completing the a–g requirements in high school and finishing the first two years in college. We examine the major impediments to student success at these critical junctions. Our analysis shows widespread progression problems in high school, which keep academically prepared students from advancing to the next level of a–g coursework. Similar problems exist in community college, where well prepared students do not take the transfer-level courses that would move them toward college completion. In both cases equity gaps are evident, with historically underrepresented students experiencing more attrition along the college pathway.
Success will depend on institutional actions, not simply improved individual student choices. At the high school level, we recommend
School districts should increase the number of a–g approved courses. During the 2016–17 school year, only 86 percent of California’s high schools offered the full a–g science sequence. Significant variation exists across schools. In particular, small schools, rural schools, and schools serving a large proportion of disadvantaged students are less likely to offer a–g courses—implying that progression problems may be exacerbated by the low number of a–g course-offerings in these schools. For instance, only 61 percent of small schools offered the full science sequence (see Technical Appendix C).
To improve the overall completion rate and reduce racial disparities in a–g completion, districts should increase the number of courses that are a–g approved. In fact, interviews with districts that had the largest gains in a–g completion revealed that one common strategy was to ensure that most courses (either existing or new) met the criteria to be certified as an a–g course. However, it should be pointed out that UC and CSU need to monitor the course submission to make sure that the a–g courses are sufficiently rigorous.
State and local policymakers should consider using high school graduation requirements to improve college readiness. California is one of the few states that requires just two years of math for high school graduation. This has led to low participation in a–g math courses during junior and senior years. Some states have specific course requirements (e.g., algebra 1, geometry, and algebra 2) while others have specific grade-level requirements (e.g., mandatory math in the last year of high school). Many school districts in California, including some of the largest, are now requiring that students complete the a–g course sequence in order to receive a diploma. Research suggests that such policies can and will lead to improvements in college preparation, especially among students from groups underrepresented in college (Betts et al. 2016). Cost may be a concern, because the state needs to fund any changes to graduation
23 See Hill and Ugo (2015).

PPIC.ORG Improving College Pathways in California 23
requirements. However, it is not likely to be a major issue, as most districts already require three years of math. Another concern is that a higher bar may prevent students from graduating, but districts can provide course support to make sure that all students benefit from meeting a higher bar.24
Districts should revise their course placement policies. The progression problem—in which many students pass an a–g course but do not take the full sequence of a–g courses—is one of the major barriers to college readiness. Local course placement policies could be effective in nudging these students to stay on track. For instance, instead of allowing students to set their own schedules, high schools should ensure that students take courses that keep them on the a–g pathway. One way to do so is to make students opt-out of a–g courses rather than opt-in. Under an opt-out system, students are automatically placed in the next level a–g course if they pass the previous course. Concerns about the placement process—particularly around equity—prompted the California Legislature to pass the California Mathematics Placement Act (2015), which requires districts to develop a “fair, transparent, and objective” system to place incoming 9th graders into appropriate math courses. This is a promising step, but more work needs to be done to address this issue.
Districts should encourage more high school seniors to stay on the a–g pathway. Taking an a–g course in grade 12 improves students’ chances of success in college, by increasing their likelihood to persist, to take more college units, and to succeed in college courses. Yet only 54 percent of high school graduates in our sample took a fourth-year science, and just 67 percent took a fourth-year math course. The percentage is higher in social science, perhaps due to course sequencing, but there is still room for improvement.
At the college level we recommend
Community colleges should continue the current effort to develop new, accurate placement systems. A significant number of college-ready students have been misplaced into developmental courses, and this has significant implications for these students’ education trajectories. Majorities of students in developmental education never complete a degree or transfer, making it one of the largest impediments to student success in community college. A few reforms, such as the Multiple Measures Assessment Project, and the Common Assessment Initiative, have been implemented in California’s community colleges to improve assessment and placement practices. These reforms include using multiple measures like high school course taking and grades to place students. This is another positive step, but more research is needed to understand the effectiveness of these new practices.
Colleges should also establish an effective academic counseling and support system. Most students enter community college with the goal of obtaining an associate degree and/or transferring into a four-year college. But many of them do not have a clear understanding of their educational pathway and fail to develop a coherent course plan to reach their academic goals. A well-supported counseling system is likely to increase the chances that students will take transfer-level courses, which best prepare them for success in community college. The new guided pathways initiative holds tremendous promise in improving student success.25
CSU (and UC) should consider expanding California’s higher education Master Plan to take more eligible students. California is seeing an increase in college-ready students. But CSU has been turning away as many as 19,000 eligible first-time freshmen a year. Increases in the number of college-ready students will not translate into increases in the number of college graduates unless the state and postsecondary institutions create more slots for eligible students.
24 There may be some unintended consequences: for instance, students who are far behind completing the a-g requirements may move to non-traditional schools and thus be removed from the calculation of the graduation rate. For some empirical evidence, please refer to Betts, Zau, and Bachofer (2017). 25 See Bailey, Jaggars, and Jenkins (2015).

PPIC.ORG Improving College Pathways in California 24
A statewide longitudinal database is needed to track individual students from K–12 schools through post-secondary institutions. The federal government has invested more than $265 million to help states build statewide longitudinal data systems. These systems can monitor student progress from one grade to the next and measure whether students are on track to high school graduation, college enrollment, and college completion. They would also allow reforms to be monitored, gaps in the education system to be identified, and specific changes to be made. In addition, these systems would enable decision makers to develop an early-detection system that would trigger interventions when needed and a placement system that would better assign students into appropriate courses in high school and college.
California faces a critical workforce skills gap and will experience a shortfall of 1.1 million college graduates if current trends persist. The good news is that all of the state’s public education sectors—K–12, the community colleges, CSU, and UC—have implemented bold initiatives to improve student pathways to and through college. However, more work needs to be done and more research will be needed to assess these initiatives and to identity further actions that can assist students at every stage along the college pathway. Our recommendations are part of a larger discussion that the state and its educational institutions must continue to engage in—to improve the prospects of California’s students and to ensure the strength of its future economy.

PPIC.ORG Improving College Pathways in California 25
REFERENCES Allensworth, Elaine and John Easton. 2007. “What Matters for Staying On-Track and Graduating in Chicago Public High Schools: A Close
Look at Course Grades, Failures, and Attendance in the Freshmen Year.” Consortium on Chicago School Research.
Bailey, Thomas, Shanna Jaggars, and Davis Jenkins. 2015. Redesigning America’s Community Colleges: A Clearer Path to Student Success. Harvard University Press.
Baldassare, Mark, Dean Bonner, David Kordus, and Lunna Lopes. 2017. PPIC Statewide Survey: Californians and Education. (April). Public Policy Institute of California.
Betts, Julian, Sam Young, Andrew Zau, and Karen Volz Bachofer. 2016. College Prep for All: Will San Diego Students Meet Challenging New Graduation Requirements? Public Policy Institute of California.
Betts, Julian, Andrew Zau, and Karen Bachofer. 2017. “The ‘College Prep for All’ Mandate – An Update on How San Diego’s Class of 2016 Has Fared with New Graduation Requirements.” The San Diego Education Research Alliance.
Cabrera, A.F., Nora, A., and Castaneda, M.B. 1993. “College Persistence: Structural Equations Modeling Test of an Integrated Model of Student Retention.” Journal of Higher Education 64(2), 123–139.
California Community College Chancellor’s Office. 2015. Enrollment Status Summary Report.
California Community College Chancellor’s Office. 2017. California Community Colleges Key Facts.
California Department of Education. 2013. Local Control Funding Formula Overview.
California Department of Education. 2016. Cohort Outcome Data for the Class of 2015-16.
California Department of Education. 2017a. Cohort Outcome Multi-Year Summary.
California Department of Education. 2017b. State Minimum Course Requirements: Minimum Set of Courses Required for High School Graduation.
California Mathematics Placement Act 2015. California Senate Bill 359 (2015).
California State University. 2015. Regularly Admitted First-time Freshmen from California High Schools by Ethnicity.
California State University. 2016. CSU Undergraduate Outcomes Report: Graduation Rates, Persistence Rates, and Analysis of Factors Related to Outcomes.
California State University. 2017. Freshman: Admission Requirements. High School Course Requirements (“a–g” courses).
California State University. 2013-2017. CSU Applications and Admissions for College Year.
California State University. 2006-2015. Degree-Seeking First-Time Freshmen Campus Reports.
Card, David. 1999. “The Causal Effect of Education on Earnings” In Handbook of Labor Economics, Volume 3a. North-Holland.
Cuellar Mejia, Marisol, Olga Rodriguez, and Hans Johnson. 2016. Preparing Students for Success in California’s Community Colleges. Public Policy Institute of California.
Daugherty, Timothy, and Eric Lane. 1999. “A Longitudinal Study of Academic and Social Predictors of College Attrition.” Social Behavior and Personality: An Internal Journal 27, 355–362.
Gamoran, Adam. 1987. “The Stratification of High School Learning Opportunities.” Sociology of Education 60 (July): 135–155.
Gamoran, Adam. 1992. “The Variable Effects of High School Tracking.” American Sociological Review 57(6), 812–828.
Gao, Niu. 2016. “Updating High School Math Requirements.” Public Policy Institute of California.
Handwerk, Philip, Namrata Tognatta, Richard Coley, and Drew Gitomer. 2008. “Access to Success: Patterns of Advanced Placement Participation in U.S. High Schools.” Educational Testing Service.
Hanushek, Eric, and Ludger Woessmann. 2008. “The Role of Cognitive Skills in Economic Development.” Journal of Economic Literature, 46(3), 607-668.
Heisserer, Dana L., and Phil Parette. 2002. “Advising At-Risk Students in College and University Settings.” College Student Journal 36(1), 69–83.
Hill, Laura and Iwunze Ugo. 2015. Implementing California’s School Funding Formula: Will High-need Students Benefit? Public Policy Institute of California.

PPIC.ORG Improving College Pathways in California 26
Hsieh, Peggy, Jeremy Sullivan and Norma Guerra. 2007. “A Closer Look at College Students: Self-Efficacy and Goal Orientation.” Journal of Advanced Academics 18(3), 454–476.
Ishitani, Terry T. and Stephen L. DesJardins. 2002. “A Longitudinal Investigation of Dropout from College in the United States.” Journal of College Student Retention: Research, Theory & Practice 4(2), 2002.
Jackson, Jacob and Kevin Cook. 2016. Improving College Graduation Rates: A Closer Look at California State University. Public Policy Institute of California
Joensen, Schroter, and Helena Skyt Nielsen. 2009. “Is There a Causal Effect of High School Math on Labor Market Outcomes?” Journal of Human Resources 52(3), 171–198.
Johnson, Hans, Marisol Cuellar Mejia, and Sarah Bohn. 2015. Will California Run Out of College Graduates? Public Policy Institute of California.
Johnson, Hans. 2010. Higher Education in California: New Goals for the Master Plan. Public Policy Institute of California.
Johnson, Hans. 2016. “Testimony: Closing California’s Workforce Skills Gap.” Public Policy Institute of California.
Klopfenstein, Kristin. 2004. “Advanced Placement: Do Minorities Have Equal Opportunity?” Economics of Education Review 23(2), 115–131.
Levine, Phillip and David Zimmerman. 1995. “The Benefit of Additional High School Math and Science Classes for Young Men and Women.” Journal of Business and Economic Statistics 13(2): 137–149.
Long, Mark, Dylan Conger, and Patrice Iatarola 2012. “Effects of High School Course-Taking on Secondary and Postsecondary Success.” American Educational Research Journal, 49(2).
NCES (National Center for Education Statistics). 2012. “Higher Education: Gaps in Access and Persistence Study.” US Department of Education.
NCES (National Center for Education Statistics). 2014. “Integrated Postsecondary Education Data System”.
Oakes, Jeannie and Gretchen Guiton. 1995. “Matchmaking: The Dynamics of High School Tracking Decisions.” American Educational Research Journal 32(1): 3–33.
Riegle-Crumb, Catherine. 2006. “The Path through Math: Course Sequences and Academic Performance at the Intersection of Race-Ethnicity and Gender.” American Journal of Education 113 (1), 101–122.
Rose, Heather and Julian Betts. 2004. “The Effect of High School Courses on Earnings.” The Review of Economics and Statistics 86(2), 497–513.
Silver, David, Elisabeth Hensley, Yihua Hong, Peter Siegel, and Denise Bradby. 2017. University Eligibility Study for the Public High School Class of 2015. RTI International.
Solorzano, Daniel Gilbert, and Armida Ornelas. 2004. “A Critical Race Analysis of Latina/o and African American Advanced Placement Enrollment in Public High Schools.” The High School Journal 87(3), 15–26.
Stevenson, David Lee, Kathryn S. Schiller, and Barbara Schneider. 1994. “Sequences of Opportunities for Learning.” Sociology of Education 67(3), 184–198.
University of California. 2015. UC Fall Enrollment Headcount by Level and Ethnicity.
University of California. 2017. A–G Subject Requirements.
US Department of Education. 2001. No Child Left Behind Act.
US Department of Education. 2015. Every Student Succeeds Act.
Zietz, Joachim and Prathibha Joshi. 2004. “Academic Choice Behavior of High School Students: Economic Rationale and Empirical Evidence.” Economics of Education Review 34(3), 297–308.
PPIC.ORG Improving College Pathways in California 27
ABOUT THE AUTHORS Niu Gao is a research fellow at the Public Policy Institute of California, specializing in K–12 education. Her areas of interest include accountability and the teacher labor market, with recent work on funding for K–12 education, digital learning in K–12 schools, and STEM education. Prior to joining PPIC, she worked as a quantitative policy analyst at Stanford. She holds a PhD in educational policy and an MS in economics from Florida State University.
Hans Johnson is director of the PPIC Higher Education Center and a senior fellow at the Public Policy Institute of California. As center director, he works with a team of researchers to identify policies that can make higher education policy more successful and sustainable. His own research focuses on improving college access and completion. He frequently presents his work to policymakers and higher education officials, and he serves as a technical advisor to many organizations seeking to improve college graduation rates, address workforce needs, and engage in long-term capacity planning. His other areas of expertise include international and domestic migration, housing in California, and population projections. Previously, he served as research director at PPIC. Before joining PPIC, he worked as a demographer at the California Research Bureau and at the California Department of Finance. He holds a PhD in demography and a master’s degree in biostatistics from the University of California, Berkeley.
ACKNOWLEDGMENTS The authors would like to thank Olga Rodriguez, Jacob Jackson, Julian Betts, Andrea Venezia, and Ryan Fuller for their valuable comments and thorough reviews of earlier drafts of the report. We also appreciate the excellent editorial support from Lynette Ubois. Ken Sorey and Anthony Dalton at the Education Results Partnership helped us access and understand the CAL-PASS Plus data, without which the report would not be possible. Any errors are our own.

PUBLIC POLICY INSTITUTE OF CALIFORNIA
Board of Directors
Mas Masumoto, Chair Author and Farmer
Mark Baldassare President and CEO Public Policy Institute of California
Ruben Barrales President and CEO, GROW Elect
María Blanco Executive Director University of California Immigrant Legal Services Center
Louise Henry Bryson Chair Emerita, Board of Trustees J. Paul Getty Trust
A. Marisa Chun Partner, McDermott Will & Emery LLP
Chet Hewitt President and CEO Sierra Health Foundation
Phil Isenberg Former Chair Delta Stewardship Council
Donna Lucas Chief Executive Officer Lucas Public Affairs
Steven A. Merksamer Senior Partner Nielsen, Merksamer, Parrinello, Gross & Leoni, LLP
Leon E. Panetta Chairman The Panetta Institute for Public Policy
Gerald L. Parsky Chairman, Aurora Capital Group
Kim Polese Chairman, ClearStreet, Inc.
Gaddi H. Vasquez Senior Vice President, Government Affairs Edison International Southern California Edison

The Public Policy Institute of California is dedicated to informing and improving public policy in California through independent, objective, nonpartisan research.
Public Policy Institute of California 500 Washington Street, Suite 600 San Francisco, CA 94111 T: 415.291.4400 F: 415.291.4401 PPIC.ORG
PPIC Sacramento Center Senator Office Building 1121 L Street, Suite 801 Sacramento, CA 95814 T: 916.440.1120 F: 916.440.1121