november 2016 cav: the road ahead - clorosurclorosur.org/seminar2016/presentation/17/01-ihs.pdf ·...
TRANSCRIPT
CAV: THE ROAD AHEAD
NOVEMBER 2016
Hazel Kreuz, Global Director, Chlor-Alkali/Vinyls
+1 832 619 8592
© 2016 IHS. ALL RIGHTS RESERVED.
Prepared for Clorosur 2016 Buenos Aires, Argentina

© 2016 IHS. ALL RIGHTS RESERVED.
About IHS Markit IHS Markit thinks about the world in a unique way.
We call this The New Intelligence.
IHS Markit’s singular ability to look across complex industries, financial markets, and
government actions that drive the global economy and provide our customers with insights,
perspective and solutions for what really matters.
Energy Chemical Automotive Financial Markets
Product Design Technology, Media &
Telecom
Maritime & Trade Aerospace,
Defense & Security
2

© 2016 IHS. ALL RIGHTS RESERVED.
Discussion
Agenda
1. Economic outlook
2. Directions for Chlor-alkali
3. The PVC road ahead
4. Key take-aways
LG Chem / November 2016

© 2016 IHS. ALL RIGHTS RESERVED.
LG Chem / November 2016
Economic Outlook: What train are we on?
© 2016 IHS. ALL RIGHTS RESERVED.
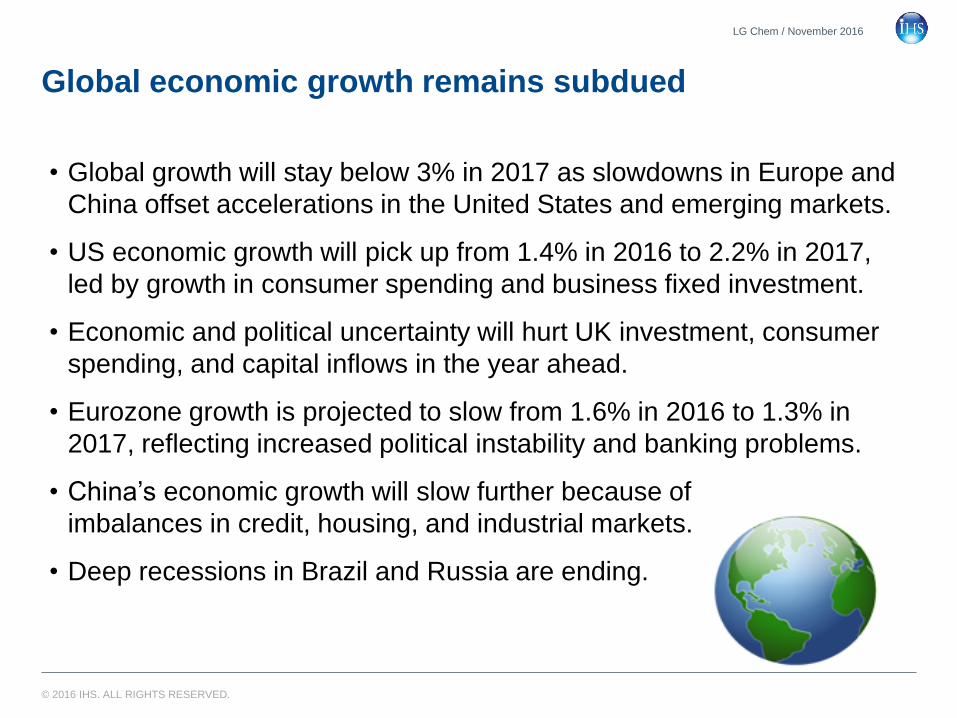
Global economic growth remains subdued
• Global growth will stay below 3% in 2017 as slowdowns in Europe and
China offset accelerations in the United States and emerging markets.
• US economic growth will pick up from 1.4% in 2016 to 2.2% in 2017,
led by growth in consumer spending and business fixed investment.
• Economic and political uncertainty will hurt UK investment, consumer
spending, and capital inflows in the year ahead.
• Eurozone growth is projected to slow from 1.6% in 2016 to 1.3% in
2017, reflecting increased political instability and banking problems.
• China’s economic growth will slow further because of
imbalances in credit, housing, and industrial markets.
• Deep recessions in Brazil and Russia are ending.
LG Chem / November 2016

© 2016 IHS. ALL RIGHTS RESERVED.
-2
0
2
4
6
NAFTA OtherAmericas
WesternEurope
EmergingEurope
Mideast-N. Africa
Sub-Saharan
Africa
Japan OtherAsia-
Pacific
An
nu
al
perc
en
t ch
an
ge
2015 2016 2017 2018 2019–23
Asia-Pacific (excluding Japan) will achieve the fastest
growth in real GDP
LG Chem / November 2016
Real GDP
Source: IHS © 2016 IHS

© 2016 IHS. ALL RIGHTS RESERVED.
Latin America – 3 Regions on 2 Continents With
Significant Potential
South
America
North
America
-12.0
-9.0
-6.0
-3.0
0.0
3.0
6.0
9.0
12.0
2010 2011 2012 2013 2014 2015 2016 2017 2018 2019 2020
Latin America
World
Brazil
Mexico
Argentina
Venezuela
Colombia
% GDP Growth
• Large market with 640 Million of
finished goods consumers
• Mid America: MEX, VEN, COL
• East of Andes: BRA, ARG
• West of Andes: CHL, PER
LAPPC / November 2016
7

© 2016 IHS. ALL RIGHTS RESERVED.
Real GDP Growth in South America
8
LAPPC / November 2016
-12
-9
-6
-3
0
3
6
Brazil Argentina Venezuela Colombia Chile Peru
2015 2016 2017 2018 2019–23
© 2016 IHS
An
nu
al
Pe
rce
nt
Ch
an
ge
Source: IHS
© 2016 IHS. ALL RIGHTS RESERVED.
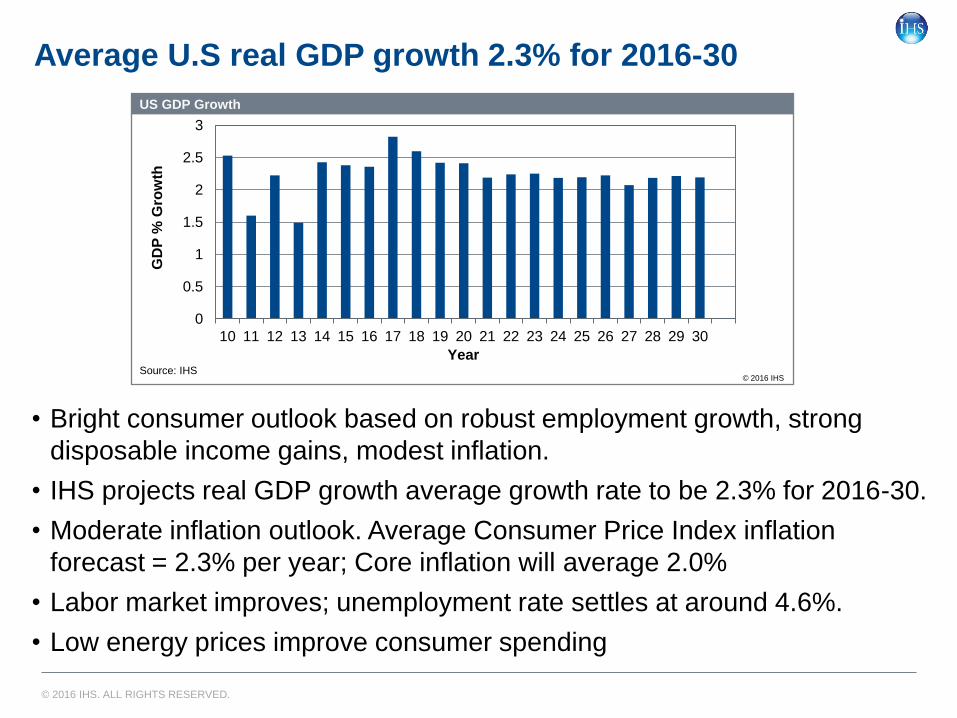
Average U.S real GDP growth 2.3% for 2016-30
• Bright consumer outlook based on robust employment growth, strong
disposable income gains, modest inflation.
• IHS projects real GDP growth average growth rate to be 2.3% for 2016-30.
• Moderate inflation outlook. Average Consumer Price Index inflation
forecast = 2.3% per year; Core inflation will average 2.0%
• Labor market improves; unemployment rate settles at around 4.6%.
• Low energy prices improve consumer spending
0
0.5
1
1.5
2
2.5
3
10 11 12 13 14 15 16 17 18 19 20 21 22 23 24 25 26 27 28 29 30
US GDP Growth
Source: IHS
GD
P %
Gro
wth
Year
© 2016 IHS
© 2016 IHS. ALL RIGHTS RESERVED.
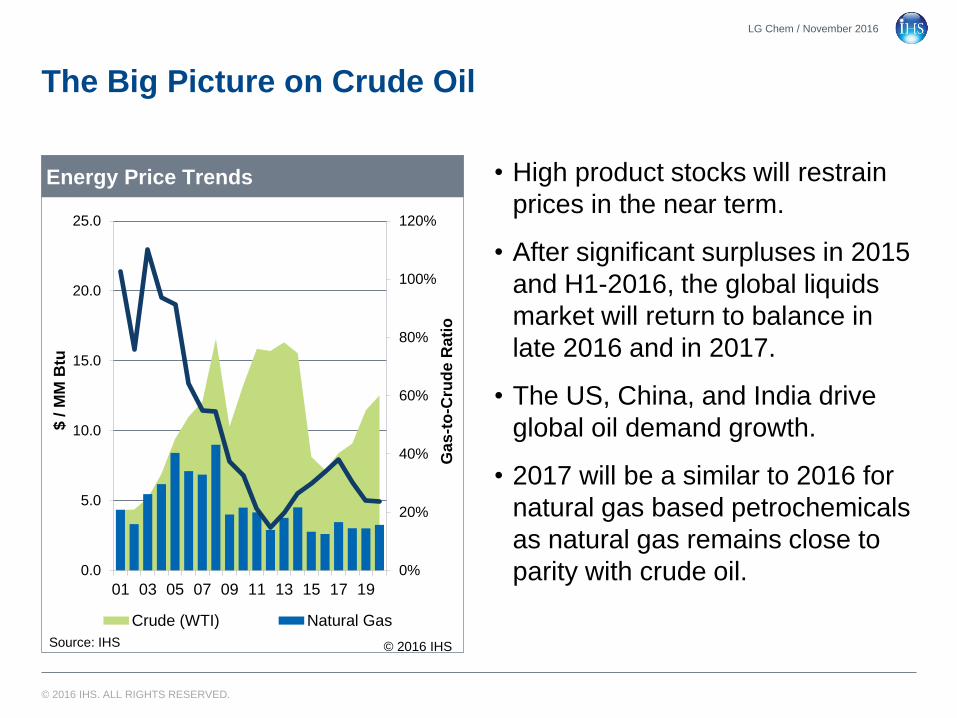
The Big Picture on Crude Oil
0%
20%
40%
60%
80%
100%
120%
0.0
5.0
10.0
15.0
20.0
25.0
01 03 05 07 09 11 13 15 17 19
Crude (WTI) Natural Gas
Energy Price Trends
Source: IHS
$ / M
M B
tu
Ga
s-t
o-C
rud
e R
ati
o
© 2016 IHS
• High product stocks will restrain
prices in the near term.
• After significant surpluses in 2015
and H1-2016, the global liquids
market will return to balance in
late 2016 and in 2017.
• The US, China, and India drive
global oil demand growth.
• 2017 will be a similar to 2016 for
natural gas based petrochemicals
as natural gas remains close to
parity with crude oil.
LG Chem / November 2016
© 2016 IHS. ALL RIGHTS RESERVED.
LG Chem / November 2016
The Chlor-Alkali Market: Picking up the pace

© 2016 IHS. ALL RIGHTS RESERVED.
North America Caustic Supply Consolidation
14,500
15,000
15,500
16,000
16,500
0
20
40
60
80
100
2010 2015 2016 Pre A/WMerge
2016 Post A/WMerge
Axiall Dow Dow/Mitsui FPC Georgia Gulf
Olin OxyChem PPG Shintech Sunbelt
Westlake Others Total Capacity
North America Caustic Capacity
Source: IHS © 2016 IHS
Pe
rce
nta
ge
Th
ou
sa
nd
Me
tric
To
ns

© 2016 IHS. ALL RIGHTS RESERVED.
Higher Asset Utilization In Chlor-Alkali Will Drive
Improved Profitability By 2020
13
50%
60%
70%
80%
90%
100%
0.0
20.0
40.0
60.0
80.0
100.0
10 11 12 13 14 15 16 17 18 19 20 21
Demand Total Capacity Operating Rate
World: Caustic Soda Supply & Demand
Source: IHS © 2016 IHS
Op
era
tin
g R
ate
Millio
n D
ry M
etr
ic T
on
s
• Global operating rates currently
below 80%; China operating
rates below 70%
• No significant capacity increases
on the horizon beyond 2017
• EU mandate to close or convert
mercury cell plants reduce
capacity
• Steady demand growth over the
forecast period raises operating
rates to upper 80’s% in forecast
period; some regional operating
rates will be > 90%

© 2016 IHS. ALL RIGHTS RESERVED.
Global Surplus Caustic Capacity To Decline Due
To Limited Capacity Growth
14
0%
5%
10%
15%
20%
25%
30%
35%
0
5
10
15
20
25
30
35
90 92 94 96 98 00 02 04 06 08 10 12 14 16 18 20 22
Excess Capacity Over Demand Excess as % of Demand
Average Excess as % of Demand, 90-07' Average Excess as % of Demand, 08-22'
Global Caustic Soda Excess Capacity
© 2016 IHS
Ex
ce
ss
Ca
pa
cit
y, M
illio
n M
etr
ic T
on
s
Source: IHS
Ex
ce
ss
as
a %
of
De
ma
nd

© 2016 IHS. ALL RIGHTS RESERVED.
USGC ECU Economics Improve with Higher Asset
Utilization
Caustic Prices Provide Majority of Earnings Contribution
-200
0
200
400
600
-220
0
220
440
660
09 10 11 12 13 14 15 16 17 18 19 20 21
Do
lla
rs P
er
Sh
ort
To
n
Do
lla
rs P
er
Me
tric
To
n
ECU Value from Chlorine (Asset-sharing) ECU Value from Caustic
ECU Value ECU Cash Margin
US Gulf Coast Chlor-Alkali Annual ECU Economics
Source: IHS © 2016 IHS
15

© 2016 IHS. ALL RIGHTS RESERVED.
Global Crude Prices Recover as Oil Supply/Demand
Balances Tighten
0
30
60
90
120
0
5
10
15
20
10 11 12 13 14 15 16 17 18 19 20 21
Crude Oil vs. Natural Gas
Natural Gas WTI Brent
Global Crude Oil vs. USGC Natural Gas
Source: IHS © 2016 IHS
$/B
arre
l, Cru
de
$/ M
MB
tu,
Natu
ral G
as
• Demand growth of 1.1-1.5 MMb/d from
2016-20 underpins oil market outlook.
• Oil prices remain low enough to force US
crude production lower.
• OPEC production remains high and surplus
capacity available from OPEC falls to
extremely low levels.
• Driven by power and LNG exports, North
American gas demand reaches 105 Bcf/d
by 2020, but….
• N. American gas supply is plentiful and low
cost. Rapid demand growth leads to higher
natural gas prices, but remain under $4 per
MMBtu
16

© 2016 IHS. ALL RIGHTS RESERVED.
US Gulf Coast & China ECU Advantage Driven By Low
Cost Energy
0
100
200
300
400
500
2009 2010 2011 2012 2013 2014 2015 2016 2017 2018 2019 2020 2021
USGC Diap NEA Memb WEP Memb/Merc ChinaNotes: * NEA Excludes China
Global ECU Cash Cost
Source: IHS © 2016 IHS
U.S
. D
oll
ars
Pe
r M
etr
ic T
on
17

© 2016 IHS. ALL RIGHTS RESERVED.
ECU Cash Cost Curve
North America has a sustainable advantage under current energy scenario
Brent
Crude
USGC
Natural Gas
($/Bbl) ($/MM Btu)
43 2.39
MDE Avg
NAM Avg NEA Avg WEP Avg
0
200
400
600
800
1000
0.0 20.0 40.0 60.0 80.0
World Cost Curve: ECU World Cost Curve: ECU
Cumulative Production - MMT
World Cost Curve: ECU World Cost Curve: ECU World Cost Curve: ECU World Cost Curve: ECU World Cost Curve: ECU World Cost Curve: ECU World Cost Curve: ECU World Cost Curve: ECU World Cost Curve: ECU World Cost Curve: ECU World Cost Curve: ECU World Cost Curve: ECU World Cost Curve: ECU 2016 World Cost Curve: ECU
Do
lla
rs P
er
Me
tric
To
n
Source: IHS © 2016 IHS
MDE Avg
NAM Avg
NEA Avg
WEP Avg
0
200
400
600
800
1000
0.0 20.0 40.0 60.0 80.0 100.0
2019 World Cost Curve: ECU
Do
lla
rs P
er
Me
tric
To
n
Source: IHS © 2016 IHS
Cumulative Production - MMT
Brent
Crude
USGC
Natural Gas
($/Bbl) ($/MM Btu)
71 2.95
18

© 2016 IHS. ALL RIGHTS RESERVED.
-1
0
1
2
3
4
5
200
0
200
1
200
2
200
3
200
4
200
5
200
6
200
7
200
8
200
9
201
0
201
1
201
2
201
3
201
4
201
5
201
6
201
7
201
8
201
9
202
0
NEA xChina WEP NAM
Indexed CAV ROI trend with time (NAM 2000 as 1)
Source: IHS © 2016 IHS
Shale Gas Driving ROI Advantage
19
ERCO Port Edwards Day / September 2016

© 2016 IHS. ALL RIGHTS RESERVED.
Mercury Phase-out Impact on European Capacity
Will Help Improve Industry Asset Utilization
0.0
2.0
4.0
6.0
8.0
10.0
12.0
14.0
2010 2012 2014 2016 2018 2020
Diaphragm cell Diaphragm Abestos cell
Membrane cell Mercury cell
Others
European Chlorine Capacity
© 2016 IHS
MM
T
Source: IHS
• Net Capacity loss ≈ 1 dmt
• Capacity loss limited by several
membrane plants expansion:
• Akzo (Frankfurt)
• BASF (Ludwigshafen)
• Rokita (Brzeg Dolny)
• Spolchemie, CABB, ICL
• Some conversion delays expected
• Asbestos extension and
conversion
20
© 2016 IHS. ALL RIGHTS RESERVED.
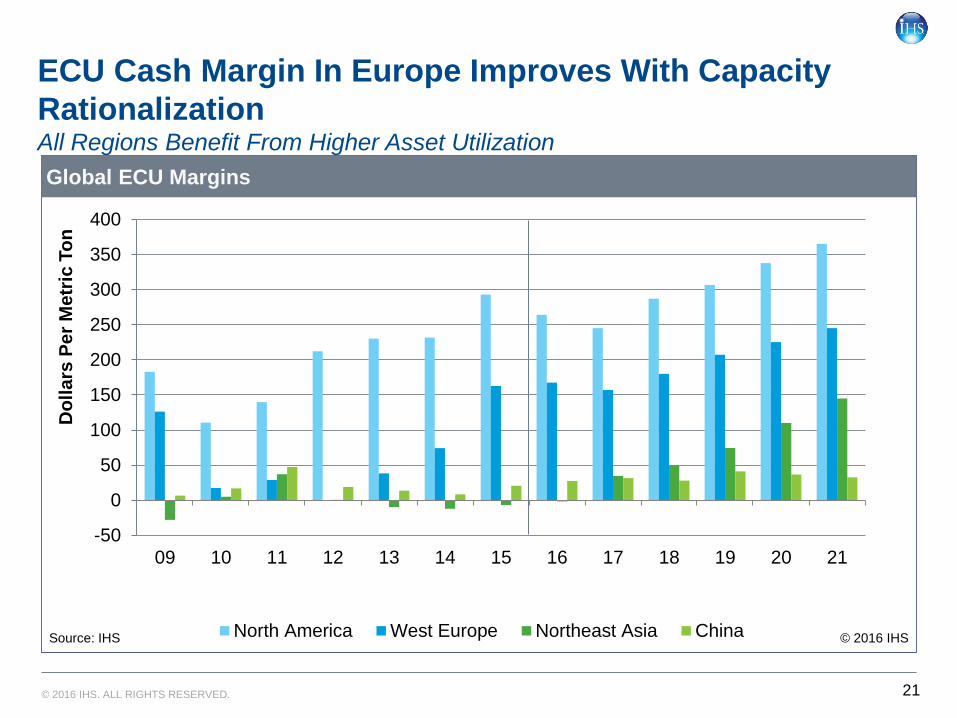
ECU Cash Margin In Europe Improves With Capacity
Rationalization All Regions Benefit From Higher Asset Utilization
-50
0
50
100
150
200
250
300
350
400
09 10 11 12 13 14 15 16 17 18 19 20 21
Do
lla
rs P
er
Me
tric
To
n
North America West Europe Northeast Asia China
Global ECU Margins
Source: IHS © 2016 IHS
21

© 2016 IHS. ALL RIGHTS RESERVED.
US Caustic Trade Reflects Global Cost Advantage
• 2Q 2016: Record USGC
exports
• Net exports must increase to
handle the additional caustic
generated by chlorine chain
exports
• Imports on North America’s
East coast will decline
• Growing exports become a
more significant percentage
of output
22
ERCO Port Edwards Day / September 2016
-1.5
-1.0
-0.5
0.0
0.5
1.0
1.5
2.0
2.5
3.0
3.5
10 15 20
Imports Exports Net Trade
United States: Caustic Soda Trade
Source: IHS © 2015 IHS
Forecast
Millio
n M
etr
ic T
on
s
Exports
Imports
© 2016 IHS. ALL RIGHTS RESERVED.
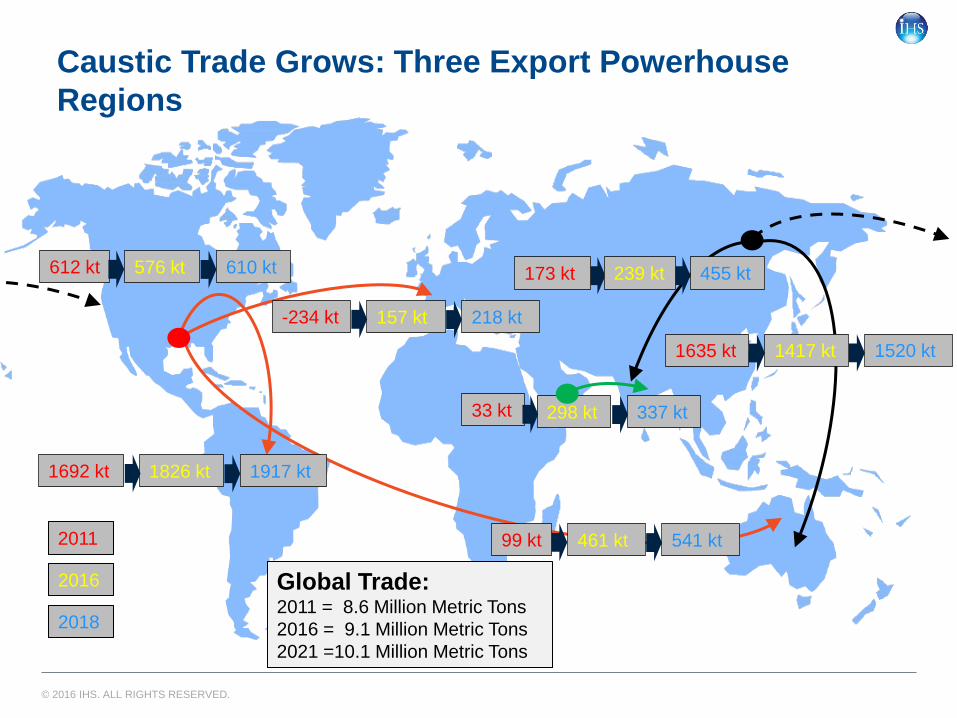
Caustic Trade Grows: Three Export Powerhouse
Regions
Global Trade: 2011 = 8.6 Million Metric Tons
2016 = 9.1 Million Metric Tons
2021 =10.1 Million Metric Tons
2016
2018
2011 461 kt 541 kt 99 kt
157 kt 218 kt -234 kt
1826 kt 1692 kt 1917 kt
298 kt 337 kt 33 kt
576 kt 612 kt 610 kt
1520 kt 1635 kt 1417 kt
455 kt 239 kt 173 kt
© 2016 IHS. ALL RIGHTS RESERVED.
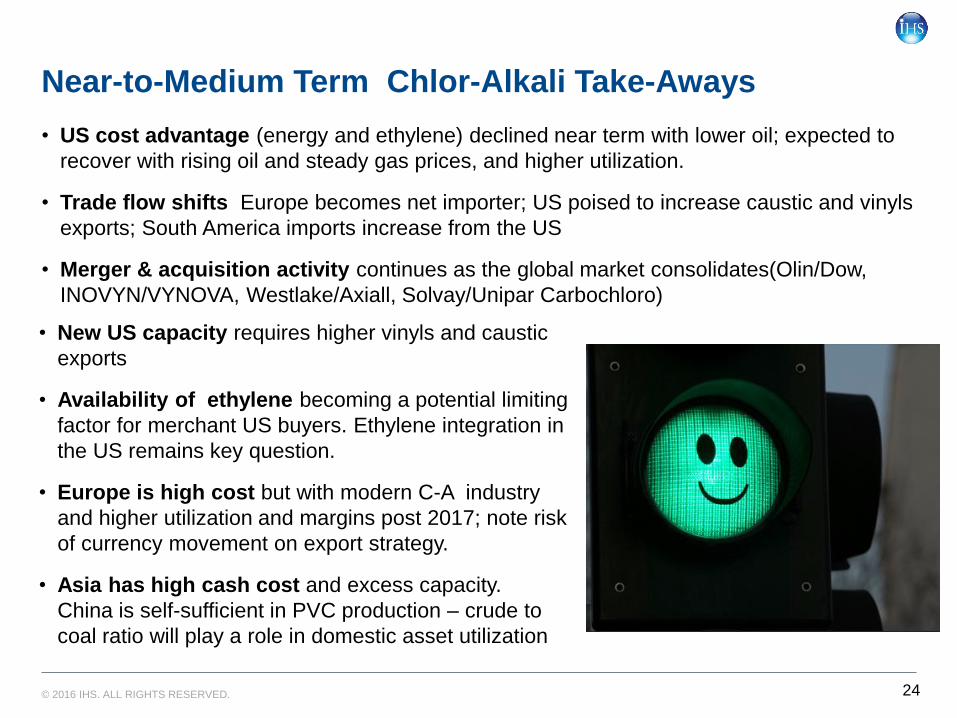
Near-to-Medium Term Chlor-Alkali Take-Aways
• US cost advantage (energy and ethylene) declined near term with lower oil; expected to
recover with rising oil and steady gas prices, and higher utilization.
• Trade flow shifts Europe becomes net importer; US poised to increase caustic and vinyls
exports; South America imports increase from the US
• Merger & acquisition activity continues as the global market consolidates(Olin/Dow,
INOVYN/VYNOVA, Westlake/Axiall, Solvay/Unipar Carbochloro)
24
• New US capacity requires higher vinyls and caustic
exports
• Availability of ethylene becoming a potential limiting
factor for merchant US buyers. Ethylene integration in
the US remains key question.
• Europe is high cost but with modern C-A industry
and higher utilization and margins post 2017; note risk
of currency movement on export strategy.
• Asia has high cash cost and excess capacity.
China is self-sufficient in PVC production – crude to
coal ratio will play a role in domestic asset utilization

© 2016 IHS. ALL RIGHTS RESERVED.
PVC: The Road Ahead
LG Chem / November 2016

© 2016 IHS. ALL RIGHTS RESERVED.
Global Ethylene Prices US moves up: higher cash cost on ethane feed and spot price increases
LG Chem / November 2016
400
600
800
1,000
1,200
1,400
1,600
1,800
14 M M J S N 15 M M J S N 16 M M J S N 17 M M J S N 18 M M J S N
US Average Acquisition Price WEP Contract Price SEA CFR Spot Price
Global Monthly Ethylene Prices
Source: IHS © 2016 IHS
Do
lla
rs P
er
Me
tric
To
n

© 2016 IHS. ALL RIGHTS RESERVED.
Timely Start-up of Ethylene Crackers is Critical
LG Chem / November 2016
----
500
1,000
1,500
2,000
2,500
3,000
3,500
4,000
4,500
5,000
2016 2017 2018 2019 2020
Mexico US
New Ethylene Capacity in NAM
Source: IHS © 2016 IHS
Th
ou
sa
nd
Me
tric
To
ns
* Capacity is prorated depending on startup date.

© 2016 IHS. ALL RIGHTS RESERVED.
Higher PVC Operating Rates as Capacity Stabilizes
LG Chem / November 2016
50%
60%
70%
80%
90%
100%
0.0
10.0
20.0
30.0
40.0
50.0
60.0
70.0
80.0
11 12 13 14 15 16 17 18 19 20 21 26
Demand (2.6/3.0) Total Capacity (2.1/1.3) Operating Rate
World: PVC Supply & Demand
Source: IHS © 2016 IHS
(% AAGR = 11-16/16-26)
Millio
n M
etr
ic T
on
s
Op
era
tin
g R
ate

© 2016 IHS. ALL RIGHTS RESERVED.
PVC Trade Grows, More Intra-Region Flow
1,164 kt
612 kt
511 kt
292 kt 515 kt 180 kt
465 kt
950 kt
535 kt
260 kt 570 kt 300 kt
1,450 kt
500 kt
2015
2018 Trade: 2015 = 8.6 Million Metric Tons
2018 = 8.9 Million Metric Tons
© 2016 IHS. ALL RIGHTS RESERVED.
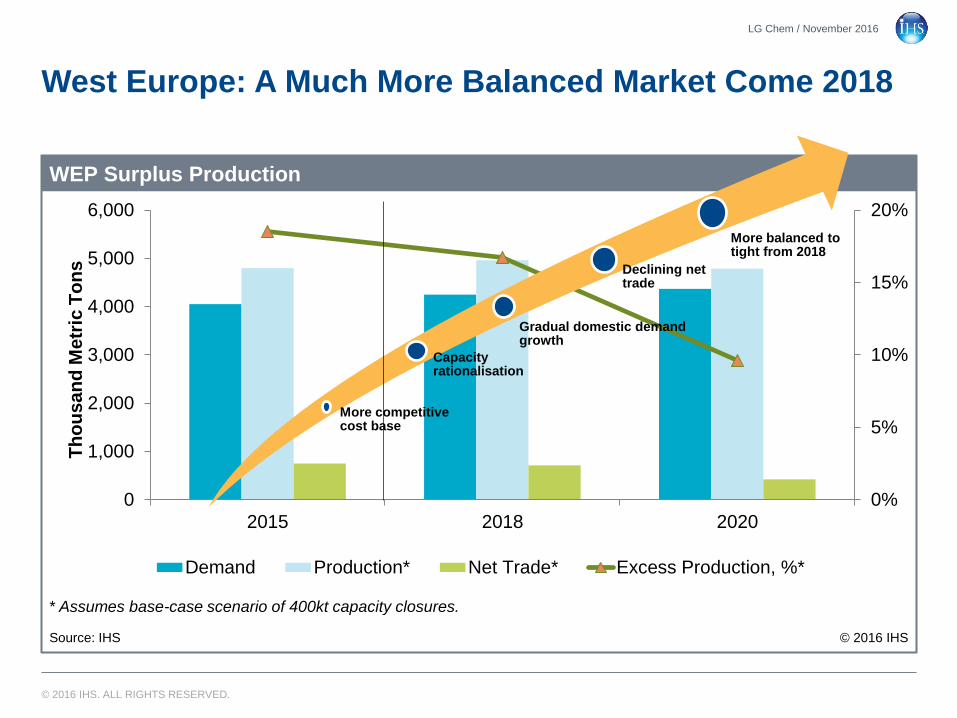
West Europe: A Much More Balanced Market Come 2018
0%
5%
10%
15%
20%
0
1,000
2,000
3,000
4,000
5,000
6,000
2015 2018 2020
Demand Production* Net Trade* Excess Production, %*
WEP Surplus Production
Source: IHS
* Assumes base-case scenario of 400kt capacity closures.
© 2016 IHS
Th
ou
sa
nd
Me
tric
To
ns
More competitive cost base
Capacity rationalisation
Gradual domestic demand growth
Declining net trade
More balanced to tight from 2018
LG Chem / November 2016

© 2016 IHS. ALL RIGHTS RESERVED.
PVC Global Prices: From Downhill To Uphill
LG Chem / November 2016
600
800
1,000
1,200
10
11
12
13
14
15
16
17
18
19
20
US
Do
lla
rs P
er
Me
tric
To
n
U.S. Netback West Europe Netback Asia Spot
Regional PVC Netback Comparison
Source: IHS © 2016 IHS
Note: Contracts After Discount and Freight

© 2016 IHS. ALL RIGHTS RESERVED.
PVC Market in the Balance
LG Chem / November 2016
Strong Market
Factors PVC
North America
Weak Market
Factors
New PVC capacity
Relative low ECU & PVC costs
Crude oil
rebounding
Volatile
ethylene prices in US
Snug ethylene supply in
spring due to turnarounds
High growth in multifamily
and single family
residential construction

© 2016 IHS. ALL RIGHTS RESERVED.
PVC Margins: Recovery On The Horizon
-80
0
80
160
240
320
400
2011 2012 2013 2014 2015 2016 2017 2018 2019 2020 2021
NAM WEP NEA
Regional PVC Margins
Source: IHS © 2016 IHS
Do
lla
rs p
er
Me
tric
To
n
LG Chem / November 2016

© 2016 IHS. ALL RIGHTS RESERVED.
PVC Key Take-Aways
• Ethylene trend is a key driver for PVC
prices.
• The cost advantage for PVC producers
in North America has narrowed, but
rising oil price will increase advantage.
• US housing starts are still increasing.
• Excess PVC capacity curtailments in
China.
• No more new PVC capacity announced,
hence operating rates are expected to
increase in the next few years.
• Growth demand in Asia is key for the
global market.
LG Chem / November 2016

© 2016 IHS. ALL RIGHTS RESERVED.
The Big Picture: Road map take-aways for the
CAV Future
• Caustic soda, PVC and ethylene
prices trend up through the forecast
period
• Until operating rates reach a level
sufficient to sustain reinvestment
grade returns, there will be no
significant new capacity
• Location of new investment will be
defined by relative energy costs
• South American growth will be fueled
by caustic soda and vinyls imports
through the forecast period
LG Chem / November 2016
CAV
© 2016 IHS. ALL RIGHTS RESERVED.. No portion of this report may be reproduced, reused, or otherwise distributed in any form without prior written consent,
with the exception of any internal client distribution as may be permitted in the license agreement between client and IHS. Content reproduced or redistributed
with IHS permission must display IHS legal notices and attributions of authorship. The information contained herein is from sources considered reliable but its
accuracy and completeness are not warranted, nor are the opinions and analyses which are based upon it, and to the extent permitted by law, IHS shall not be
liable for any errors or omissions or any loss, damage or expense incurred by reliance on information or any statement contained herein. For more information,
please contact IHS at [email protected], +1 800 IHS CARE (from North American locations), or +44 (0) 1344 328 300 (from outside North America). All
products, company names or other marks appearing in this publication are the trademarks and property of IHS or their respective owners. V2.0-29.04.14
Americas:
+1.800.IHS.CARE (+1.800.447.2273);
Europe, Middle East, and Africa:
+44.(0).1344.328.300;
Asia and the Pacific Rim:
+604.291.3600;
Contact us