november 2005 examinations - cima · 2009-11-06 · november 2005 examinations managerial level...
TRANSCRIPT

The Chartered Institute of Management Accountants 2005
November 2005 Examinations Managerial Level
Management Accounting – Decision Management (Paper P2) Question Paper 2 Brief Guide 18 Examiner’s Answers 19 The answers published here have been written by the Examiner and should provide a helpful guide for both tutors and students. Published separately on the CIMA website (www.cimaglobal.com) from the end of February 2006 is a Post Examination Guide for this paper, which provides much valuable and complementary material including indicative mark information. 2005 The Chartered Institute of Management Accountants. All rights reserved. No part of this publication may be reproduced, stored in a retrieval system, or transmitted, in any form or by any means, electronic, mechanical, photocopying, recorded or otherwise, without the written permission of the publisher.

P2 2 November 2005
Management Accounting Pillar
Managerial Level Paper
P2 – Management Accounting - Decision Management
23 November 2005 – Wednesday Morning Session
Instructions to candidates
You are allowed three hours to answer this question paper
You are allowed 20 minutes reading time before the examination begins during which you should read the question paper, and if you wish, make annotations on the question paper. However, you will not be allowed, under any circumstances, to open the answer book and start writing or use your calculator during this reading time.
You are strongly advised to carefully read ALL the question requirements before attempting the question concerned (that is, all parts and/or sub-questions). The requirements for the questions in Sections B and C are contained in a dotted box.
Answer the ONE compulsory question in Section A. This is comprised of eight sub-questions and is on pages 3 to 5.
Answer ALL THREE compulsory questions in Section B on pages 6 to 8.
Answer TWO of the three questions in Section C on pages 9 to 14.
Maths Tables and Formulae are provided on pages 15 to 17.
Write your full examination number, paper number and the examination subject title in the spaces provided on the front of the examination answer book. Also write your contact ID and name in the space provided in the right hand margin and seal to close.
Tick the appropriate boxes on the front of the answer book to indicate which questions you have answered.
P2 –
Dec
isio
n M
anag
emen
t
November 2005 3 P2
SECTION A – 20 MARKS [the indicative time for answering this section is 36 minutes] ANSWER ALL EIGHT SUB-QUESTIONS
Question One 1.1 A five year project has a net present value of $160,000 when it is discounted at 12%. The
project includes an annual cash outflow of $50,000 for each of the five years. No tax is payable on projects of this type.
The percentage increase in the value of this annual cash outflow that would make the project no longer financially viable is closest to
A 64%
B 89%
C 113%
D 156% (2 marks)
Instructions for answering Section A: The answers to the eight sub-questions in Section A should ALL be written in your answer book. Your answers should be clearly numbered with the sub-question number and then ruled off, so that the markers know which sub-question you are answering. For multiple choice questions, you need only write the sub-question number and the letter of the answer option you have chosen. You do not need to start a new page for each sub-question. For sub-questions 1.6, 1.7, and 1.8 you should show your workings as marks are available for the method you use to answer these sub-questions.

P2 4 November 2005
The following data are to be used when answering questions 1.2 and 1.3 A company expects to sell 1,000 units per month of a new product but there is uncertainty as to both the unit selling price and the unit variable cost of the product. The following estimates of selling price, variable costs and their related probabilities have been made:
Selling Price Unit Variable Cost £ per unit Probability £ per unit Probability
20 25% 8 20% 25 40% 10 50% 30 35% 12 30%
There are specific fixed costs of £5,000 per month expected for the new product. 1.2 The expected value of monthly contribution is
A £5,890
B £10,300
C £10,890
D £15,300 (2 marks)
1.3 The probability of monthly contribution from this new product exceeding £13,500 is A 24·5%
B 30·5%
C 63·0%
D 92·5%
(2 marks)
1.4 PT has discovered that when it employs a new test engineer there is a learning curve with a 75% rate of learning that exists for the first 12 customer assignments. A new test engineer completed her first customer assignment in 6 hours.
Calculate the time that she should take for her 7th assignment to the nearest 0·01 hours. Note: The index for a 75% learning curve is -0·415.
(2 marks)

November 2005 5 P2
The following data are to be used when answering questions 1.5 and 1.6 JKL plc has $1 million available for investment. It has identified three possible investments, J, K and L, which each have a life of three years. The three year period coincides with JKL plc’s investment plans. JKL plc uses a 15% cost of capital when appraising investments of this type. Details of these investments are set out below:
J K L $000 $000 $000 Initial investment 400 500 300 Net positive cashflows:
Year 1 40 70 50 Year 2 80 90 50 Year 3 510 630 380
Net Present Value 31 43 31
1.5 Assuming that each of the investments is divisible, they are not mutually exclusive and
cannot be invested in more than once, state the optimum investment plan for JKL plc.
(2 marks)
1.6 Calculate the Internal Rate of Return of an investment in project K to the nearest 0·01%.
(3 marks)
1.7 FH is an electronics company that has developed a new product for the video conferencing market. The product has successfully completed its testing phase and FH has now produced the first four production units. The first unit took 3 hours of labour time and the total time for the first four units was 8·3667 hours.
Calculate the learning curve improvement rate (rate of learning) to the nearest 0·1%.
(3 marks)
1.8 A baker is trying to decide the number of batches of a particular type of bread that he should bake each day. Daily demand ranges from 10 batches to 12 batches. Each batch of bread that is baked and sold yields a positive contribution of £50, but each batch of bread baked that is not sold yields a negative contribution of £20.
Assuming the baker adopts the minimax regret decision rule, calculate the number of batches of bread that he should bake each day. You must justify your answer.
(4 marks)
(Total for Section A = 20 marks)
End of Section A
Section B starts on the opposite page

P2 6 November 2005
SECTION B – 30 MARKS [the indicative time for answering this section is 54 minutes] ANSWER ALL THREE QUESTIONS Question Two The owner of a taxi company is considering the replacement of his vehicles. He is planning to retire in 6 years’ time and is therefore only concerned with that period of time, but cannot decide whether it is better to replace the vehicles every two years or every three years. The following data have been estimated (all values at today's price levels): Purchase cost and trade in values Taxi cost £15,000 Trade-in value of taxi:
after 2 years £7,000 after 3 years £4,000
Annual costs and revenues Vehicle running cost £20,000 per year Fares charged to customers £40,000 per year Vehicle servicing and repair costs Vehicle servicing and repair costs depend on the age of the vehicle. In the following table year 1 represents the cost in the first year of the vehicle's ownership; year 2 represents the cost in the second year of ownership, and so on:
Year 1 £500 Year 2 £2,500 Year 3 £4,000
Inflation New vehicle costs and trade in-values are expected to increase by 5% per year. Vehicle running costs and fares are expected to increase by 7% per year. Vehicle servicing and repair costs are expected to increase by 10% per year.
Required:
Advise the company on the optimum replacement cycle for its vehicles and state the net present value of the opportunity cost of making the wrong decision. Use a discount rate of 12% per year. All workings and assumptions should be shown. Ignore taxation.
(10 marks)

November 2005 7 P2
Question Three ML is an engineering company that specialises in providing engineering facilities to businesses that cannot justify operating their own facilities in-house. ML employs a number of engineers who are skilled in different engineering techniques that enable ML to provide a full range of engineering facilities to its customers. Most of the work undertaken by ML is unique to each of its customers, often requiring the manufacture of spare parts for its customers’ equipment, or the building of new equipment from customer drawings. As a result most of ML’s work is short-term, with some jobs being completed within hours while others may take a few days. To date ML has adopted a cost plus approach to setting its prices. This is based upon an absorption costing system that uses machine hours as the basis of absorbing overhead costs into individual job costs. The Managing Director is concerned that over recent months ML has been unsuccessful when quoting for work with the consequence that there has been an increase in the level of unused capacity. It has been suggested that ML should adopt an alternative approach to its pricing based on marginal costing since “any price that exceeds variable costs is better than no work”.
Required:
With reference to the above scenario
(i) briefly explain absorption and marginal cost approaches to pricing; (ii) discuss the validity of the comment “any price that exceeds variable costs is
better than no work”.
(10 marks)
P2 8 November 2005
Question Four You are the assistant management accountant within PK plc. PK plc manufactures high quality self-assembly furniture from raw materials utilising highly skilled labour within a computer-controlled manufacturing facility. The company produces a range of furniture, and, because of the lead time to receive delivery of its raw materials, has a finished goods inventory policy of holding an average of two weeks estimated sales in inventory. Customer demand is seasonal and, as a consequence, this finished goods inventory level fluctuates throughout the year. The company also holds inventories of raw materials based upon estimates of its production requirements. An absorption costing system is used to attribute all manufacturing costs to output. Increasingly PK plc is facing competition, particularly from overseas manufacturers and its sales team have to make decisions about the extent to which it can offer price discounts in order to win customer orders.
Required: Prepare a report addressed to the Management Team of PK plc that explains the changing nature of cost structures in the modern manufacturing environment and the implications for PK plc’s
(i) inventory valuation (ii) short term decision making
(10 marks)
Note: There are 2 marks available for format and presentational style
(Total for Section B = 30 marks)
End of Section B
Section C starts on the next page

November 2005 9 P2
SECTION C – 50 MARKS [the indicative time for answering this section is 90 minutes] ANSWER TWO QUESTIONS OUT OF THREE
Question Five The MP Organisation is an independent film production company. It has a number of potential films that it is considering producing, one of which is the subject of a management meeting next week. The film which has been code named CA45 is a thriller based on a novel by a well respected author. The script has already been written at a cost of $10,000 and preliminary discussions have been held with the lead actors. The MP Organisation has incurred travel and other incidental costs of $4,000 to date. The following additional costs have been estimated in order to produce the film:
$000 Production director’s fee 100 Set design 10 Costumes and wardrobe 20 Actors’ fees 50 Musician / Songwriter for soundtrack 5 Camera and equipment hire 20 Actors’ travel and accommodation costs 10 Other production costs 5
Production of the film is estimated to take 16 weeks, and all of the above costs would be incurred during this period, though there is some uncertainty about the accuracy of these cost estimates. These cost values are those most likely to be incurred. With the exception of the payment to the production director which is a fixed fee, the other costs could be up to 10% higher or lower than the values estimated. In addition there will be advertising, promotion and marketing costs of $15,000 immediately, $10,000 in each of years 1 and 2, and then $5,000 during each of the next three years. These figures are not subject to any uncertainty. The film is expected to have a life of five years. During the first three years the film will be sold to cinemas through distributors and MP will receive 25% of the gross revenues. The film will be sold as a DVD for the remaining two years and MP will receive 100% of these revenues. The expected gross revenues are as follows:
Year Source Gross revenue MP’s share 1 Cinema $400,000 25% 2 Cinema $600,000 25% 3 Cinema $450,000 25% 4 DVD $50,000 100% 5 DVD $30,000 100%
However it is thought that the gross revenues could vary by as much as 20% higher or lower than those stated, depending on the popularity of the film. The initial level of popularity will continue for all five years. The MP Organisation evaluates new films using a cost of capital of 15% per year.

P2 10 November 2005
Required: (a) Prepare calculations for each combination of the most likely, optimistic and
pessimistic cost and revenue values to evaluate whether or not the MP Organisation should continue with the production of the film. Discuss your analysis and make a recommendation to MP.
(15 marks)
(b) Prepare notes for the management meeting that explain how probabilities can be used
(i) to calculate the expected NPV; and (ii) in a simulation model to evaluate the risk of a long term decision.
(10 marks)
(Total for Question Five = 25 marks)

November 2005 11 P2
Question Six QP plc is a food processing company that produces pre-prepared meals for sale to consumers through a number of different supermarkets. The company specialises in three particular pre-prepared meals and has invested significantly in modern manufacturing processes to ensure a high quality product. The company is very aware of the importance of training and retaining high quality staff in all areas of the company and, in order to ensure their production employees’ commitment to the company, the employees are guaranteed a weekly salary that is equivalent to their normal working hours paid at their normal hourly rate of £7 per hour. The meals are produced in batches of 100 units. Costs and selling prices per batch are as follows:
Meal TR PN BE £/batch £/batch £/batch Selling Price 340 450 270 Ingredient K (£5/kg) 150 120 90 Ingredient L (£10/kg) 70 90 40 Ingredient M (£15/kg) 30 75 45 Labour (£7/hour) 21 28 42 Factory costs absorbed 20 80 40
QP plc has adopted throughput accounting for its short-term decisions.
Required:
(a) State the principles of throughput accounting and the effects of using it for short-term decision making.
(6 marks)
(b) QP plc is preparing its production plans for the next three months and has estimated the maximum demand from its customers to be as follows:
TR 500 batches PN 400 batches BE 350 batches
These demand maximums are amended figures because a customer has just delayed its request for a large order and QP has unusually got some spare capacity over the next three months. However, these demand maximums do include a contract for the delivery of 50 batches of each to an important customer. If this minimum contract is not satisfied then QP plc will have to pay a substantial financial penalty for non-delivery. The Production Director is concerned at hearing news that two of the ingredients used are expected to be in short supply for the next three months. QP plc does not hold inventory of these ingredients and although there are no supply problems for ingredient K, the supplies of ingredients L and M are expected to be limited to:
Ingredient L 7,000 kilos Ingredient M 3,000 kilos

P2 12 November 2005
The Production Director has researched the problem and found that ingredient V can be used as a direct substitute for ingredient M. It also costs the same as ingredient M. There is an unlimited supply of ingredient V.
Required: Prepare calculations to determine the production mix that will maximise the profit of QP plc during the next three months.
(10 marks)
(c) The World Health Organisation has now announced that ingredient V contains
dangerously high levels of a chemical that can cause life-threatening illnesses. As a consequence it can no longer be used in the production of food.
As a result, the production director has determined the optimal solution to the company’s production mix problem using linear programming. This is set out below:
Objective function value 110,714TR value 500PN value 357BE value 71TR slack value 0PN slack value 43BE slack value 279L value 3M value 28
Required: Explain the meaning of each of the values contained in the above solution.
(9 marks)
(Total for Question Six = 25 marks)

November 2005 13 P2
Question Seven ZP plc is a marketing consultancy that provides marketing advice and support to small and medium sized enterprises. ZP plc employs 4 full time marketing consultants who each expect to deliver 1,500 chargeable hours per year and each receive a salary of £60,000 per year. In addition the company employs 6 marketing support/administration staff whose combined total salary cost is £120,000 per year. ZP plc has estimated its other costs for the coming year as follows:
£000 Office premises: rent, rates, heating 50Advertising 5Travel to clients 15Accommodation whilst visiting clients 11Telephone, fax, communications 10
ZP plc has been attributing costs to each client (and to the projects undertaken for them) by recording the chargeable hours spent on each client and using a single cost rate of £75 per chargeable hour. The same basis has been used to estimate the costs of a project when preparing a quotation for new work. ZP plc has reviewed its existing client database and determined the following three average profiles of typical clients:
Client profile D E F Chargeable hours per client 100 700 300 Distance (Miles) to client 50 70 100 Number of visits per client 3 8 3 Number of clients in each profile 10 5 5
The senior consultant has been reviewing the company’s costing and pricing procedures. He suggests that the use of a single cost rate should be abandoned and, where possible, activities should be costed individually. With this is mind he has obtained the following further information:
• It is ZP plc’s policy that where a visit is made to a client and the distance to the client is more than 50 miles, the consultant will travel the day before the visit and stay in local accommodation so that the maximum time is available for meeting the client the following day.
• The cost of travel to the client is dependent on the number of miles travelled to visit the client.
• Other costs are facility costs – at present the senior consultant cannot identify an alternative basis to that currently being used to attribute costs to each client.

P2 14 November 2005
Required:
(a) Prepare calculations to show the cost attributed to each client group using an
activity based system of attributing costs. (7 marks)
(b) Discuss the differences between the costs attributed using activity based costing
and those attributed by the current system and advise whether the senior consultant’s suggestion should be adopted.
(9 marks)
(c) In a manufacturing environment activity based costing often classifies activities into those that are: unit; batch; product sustaining; and facility sustaining. Discuss, giving examples, how similar classifications may be applied to the use of the technique in consultancy organisations such as ZP plc.
(9 marks) (Total for Question Seven = 25 marks)
(Total for Section C = 50 marks)
End of question paper
Maths Tables and Formulae follow

November 2005 15 P2
PRESENT VALUE TABLE
Present value of $1, that is ( ) nr −+1 where r = interest rate; n = number of periods until payment or receipt.
Interest rates (r) Periods (n) 1% 2% 3% 4% 5% 6% 7% 8% 9% 10%
1 0.990 0.980 0.971 0.962 0.952 0.943 0.935 0.926 0.917 0.909 2 0.980 0.961 0.943 0.925 0.907 0.890 0.873 0.857 0.842 0.826 3 0.971 0.942 0.915 0.889 0.864 0.840 0.816 0.794 0.772 0.751 4 0.961 0.924 0.888 0.855 0.823 0.792 0.763 0.735 0.708 0.683 5 0.951 0.906 0.863 0.822 0.784 0.747 0.713 0.681 0.650 0.621 6 0.942 0.888 0.837 0.790 0.746 0705 0.666 0.630 0.596 0.564 7 0.933 0.871 0.813 0.760 0.711 0.665 0.623 0.583 0.547 0.513 8 0.923 0.853 0.789 0.731 0.677 0.627 0.582 0.540 0.502 0.467 9 0.914 0.837 0.766 0.703 0.645 0.592 0.544 0.500 0.460 0.424 10 0.905 0.820 0.744 0.676 0.614 0.558 0.508 0.463 0.422 0.386 11 0.896 0.804 0.722 0.650 0.585 0.527 0.475 0.429 0.388 0.350 12 0.887 0.788 0.701 0.625 0.557 0.497 0.444 0.397 0.356 0.319 13 0.879 0.773 0.681 0.601 0.530 0.469 0.415 0.368 0.326 0.290 14 0.870 0.758 0.661 0.577 0.505 0.442 0.388 0.340 0.299 0.263 15 0.861 0.743 0.642 0.555 0.481 0.417 0.362 0.315 0.275 0.239 16 0.853 0.728 0.623 0.534 0.458 0.394 0.339 0.292 0.252 0.218 17 0.844 0.714 0.605 0.513 0.436 0.371 0.317 0.270 0.231 0.198 18 0.836 0.700 0.587 0.494 0.416 0.350 0.296 0.250 0.212 0.180 19 0.828 0.686 0.570 0.475 0.396 0.331 0.277 0.232 0.194 0.164 20 0.820 0.673 0.554 0.456 0.377 0.312 0.258 0.215 0.178 0.149
Interest rates (r) Periods
(n) 11% 12% 13% 14% 15% 16% 17% 18% 19% 20% 1 0.901 0.893 0.885 0.877 0.870 0.862 0.855 0.847 0.840 0.833 2 0.812 0.797 0.783 0.769 0.756 0.743 0.731 0.718 0.706 0.694 3 0.731 0.712 0.693 0.675 0.658 0.641 0.624 0.609 0.593 0.579 4 0.659 0.636 0.613 0.592 0.572 0.552 0.534 0.516 0.499 0.482 5 0.593 0.567 0.543 0.519 0.497 0.476 0.456 0.437 0.419 0.402 6 0.535 0.507 0.480 0.456 0.432 0.410 0.390 0.370 0.352 0.335 7 0.482 0.452 0.425 0.400 0.376 0.354 0.333 0.314 0.296 0.279 8 0.434 0.404 0.376 0.351 0.327 0.305 0.285 0.266 0.249 0.233 9 0.391 0.361 0.333 0.308 0.284 0.263 0.243 0.225 0.209 0.194 10 0.352 0.322 0.295 0.270 0.247 0.227 0.208 0.191 0.176 0.162 11 0.317 0.287 0.261 0.237 0.215 0.195 0.178 0.162 0.148 0.135 12 0.286 0.257 0.231 0.208 0.187 0.168 0.152 0.137 0.124 0.112 13 0.258 0.229 0.204 0.182 0.163 0.145 0.130 0.116 0.104 0.093 14 0.232 0.205 0.181 0.160 0.141 0.125 0.111 0.099 0.088 0.078 15 0.209 0.183 0.160 0.140 0.123 0.108 0.095 0.084 0.079 0.065 16 0.188 0.163 0.141 0.123 0.107 0.093 0.081 0.071 0.062 0.054 17 0.170 0.146 0.125 0.108 0.093 0.080 0.069 0.060 0.052 0.045 18 0.153 0.130 0.111 0.095 0.081 0.069 0.059 0.051 0.044 0.038 19 0.138 0.116 0.098 0.083 0.070 0.060 0.051 0.043 0.037 0.031 20 0.124 0.104 0.087 0.073 0.061 0.051 0.043 0.037 0.031 0.026

P2 16 November 2005
Cumulative present value of $1 per annum, Receivable or Payable at the end of each year for n
years rr n−+− )(11
Interest rates (r) Periods
(n) 1% 2% 3% 4% 5% 6% 7% 8% 9% 10% 1 0.990 0.980 0.971 0.962 0.952 0.943 0.935 0.926 0.917 0.909 2 1.970 1.942 1.913 1.886 1.859 1.833 1.808 1.783 1.759 1.736 3 2.941 2.884 2.829 2.775 2.723 2.673 2.624 2.577 2.531 2.487 4 3.902 3.808 3.717 3.630 3.546 3.465 3.387 3.312 3.240 3.170 5 4.853 4.713 4.580 4.452 4.329 4.212 4.100 3.993 3.890 3.791 6 5.795 5.601 5.417 5.242 5.076 4.917 4.767 4.623 4.486 4.355 7 6.728 6.472 6.230 6.002 5.786 5.582 5.389 5.206 5.033 4.868 8 7.652 7.325 7.020 6.733 6.463 6.210 5.971 5.747 5.535 5.335 9 8.566 8.162 7.786 7.435 7.108 6.802 6.515 6.247 5.995 5.759 10 9.471 8.983 8.530 8.111 7.722 7.360 7.024 6.710 6.418 6.145 11 10.368 9.787 9.253 8.760 8.306 7.887 7.499 7.139 6.805 6.495 12 11.255 10.575 9.954 9.385 8.863 8.384 7.943 7.536 7.161 6.814 13 12.134 11.348 10.635 9.986 9.394 8.853 8.358 7.904 7.487 7.103 14 13.004 12.106 11.296 10.563 9.899 9.295 8.745 8.244 7.786 7.367 15 13.865 12.849 11.938 11.118 10.380 9.712 9.108 8.559 8.061 7.606 16 14.718 13.578 12.561 11.652 10.838 10.106 9.447 8.851 8.313 7.824 17 15.562 14.292 13.166 12.166 11.274 10.477 9.763 9.122 8.544 8.022 18 16.398 14.992 13.754 12.659 11.690 10.828 10.059 9.372 8.756 8.201 19 17.226 15.679 14.324 13.134 12.085 11.158 10.336 9.604 8.950 8.365 20 18.046 16.351 14.878 13.590 12.462 11.470 10.594 9.818 9.129 8.514
Interest rates (r) Periods
(n) 11% 12% 13% 14% 15% 16% 17% 18% 19% 20% 1 0.901 0.893 0.885 0.877 0.870 0.862 0.855 0.847 0.840 0.833 2 1.713 1.690 1.668 1.647 1.626 1.605 1.585 1.566 1.547 1.528 3 2.444 2.402 2.361 2.322 2.283 2.246 2.210 2.174 2.140 2.106 4 3.102 3.037 2.974 2.914 2.855 2.798 2.743 2.690 2.639 2.589 5 3.696 3.605 3.517 3.433 3.352 3.274 3.199 3.127 3.058 2.991 6 4.231 4.111 3.998 3.889 3.784 3.685 3.589 3.498 3.410 3.326 7 4.712 4.564 4.423 4.288 4.160 4.039 3.922 3.812 3.706 3.605 8 5.146 4.968 4.799 4.639 4.487 4.344 4.207 4.078 3.954 3.837 9 5.537 5.328 5.132 4.946 4.772 4.607 4.451 4.303 4.163 4.031 10 5.889 5.650 5.426 5.216 5.019 4.833 4.659 4.494 4.339 4.192 11 6.207 5.938 5.687 5.453 5.234 5.029 4.836 4.656 4.486 4.327 12 6.492 6.194 5.918 5.660 5.421 5.197 4.988 7.793 4.611 4.439 13 6.750 6.424 6.122 5.842 5.583 5.342 5.118 4.910 4.715 4.533 14 6.982 6.628 6.302 6.002 5.724 5.468 5.229 5.008 4.802 4.611 15 7.191 6.811 6.462 6.142 5.847 5.575 5.324 5.092 4.876 4.675 16 7.379 6.974 6.604 6.265 5.954 5.668 5.405 5.162 4.938 4.730 17 7.549 7.120 6.729 6.373 6.047 5.749 5.475 5.222 4.990 4.775 18 7.702 7.250 6.840 6.467 6.128 5.818 5.534 5.273 5.033 4.812 19 7.839 7.366 6.938 6.550 6.198 5.877 5.584 5.316 5.070 4.843 20 7.963 7.469 7.025 6.623 6.259 5.929 5.628 5.353 5.101 4.870
November 2005 17 P2
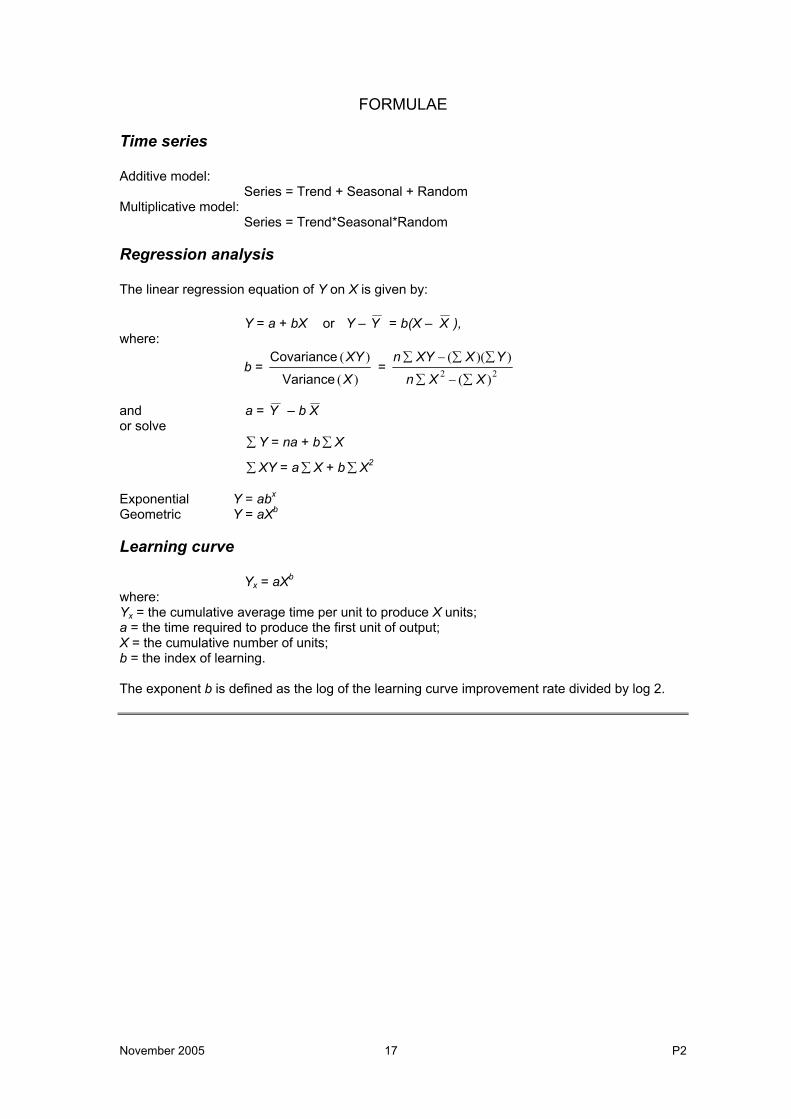
FORMULAE Time series Additive model:
Series = Trend + Seasonal + Random Multiplicative model:
Series = Trend*Seasonal*Random
Regression analysis The linear regression equation of Y on X is given by:
Y = a + bX or Y – Y = b(X – X ), where:
b = )(
)(
X
XY
Variance
Covariance = 22 )(
))((
XXn
YXXYn
∑−∑
∑∑−∑
and a = Y – b X or solve
∑Y = na + b∑X
∑XY = a∑X + b∑X2
Exponential Y = abx Geometric Y = aXb
Learning curve
Yx = aXb
where: Yx = the cumulative average time per unit to produce X units; a = the time required to produce the first unit of output; X = the cumulative number of units; b = the index of learning. The exponent b is defined as the log of the learning curve improvement rate divided by log 2.

P2 18 November 2005
The Examiner for Management Accounting – Decision Management offers to future candidates and to tutors using this booklet for study purposes, the following
background and guidance on the questions included in this examination paper.
Section A – Question One – Compulsory Question One comprises eight sub questions in objective testing format. Some of the questions provide a choice of answers of which only one is correct whilst others require solution by the candidate. This question covers a number of syllabus areas and learning outcomes and is designed to complement the syllabus coverage of the remaining questions on the paper. Section B – Questions Two, Three and Four – Compulsory Question Two requires candidates to determine the optimum replacement cycle for the vehicles of a taxi company and advise the company accordingly. The question addresses the learning outcome “Evaluate project proposals using the techniques of investment appraisal”. Question Three requires candidates to interpret a short scenario and to then briefly explain absorption and marginal cost approaches to pricing and discuss a comment made by one of the managers concerning the acceptance of prices which are lower than full cost. This question addresses the learning outcome “Explain the particular issues that arise in pricing decisions and the conflict between marginal cost principles and the need for full recovery of all costs incurred” Question Four requires candidates to interpret a short scenario and then prepare a report that explains the changing nature of cost structures in the modern manufacturing environment and its implications for stock valuation and short-term decision making. This question addresses the learning outcome “Explain the possible conflicts between cost accounting for profit reporting and stock valuation and the convenient availability of information for decision making” Section C – answer two of three questions Question Five requires candidates to prepare calculations to enable them to evaluate whether or not the organisation in the scenario should continue with the production of a film in part (a) and then to discuss the use of probabilities in long term decision making in part (b). This question addresses the learning outcomes “Evaluate project proposals using the techniques of investment appraisal” and “Evaluate the impact of uncertainty and risk on decision models that may be based on CVP analysis, relevant cash flows, learning curves, discounting techniques, etc” Question Six requires candidates to state the principles of throughput accounting in part (a), determine an optimum production mix when there is a single scarce resource in part (b) and explain the meaning of a linear programming solution in part (c). This question addresses the learning outcomes “Discuss the meaning of optimal solutions and show how linear programming methods can be employed for profit maximising, revenue maximising and satisfying objectives” and “Evaluate the impacts of just in time production, the theory of constraints and total quality management on efficiency, inventory and cost”. Question 7 requires candidates to apply the principles of activity based costing to a marketing consultancy in part (a), to discuss the differences between an activity based approach and a tradition overhead absorption approach in part (b) and to explain how activity based costing cost classifications could be used in consultancy organisations in part (c). This question addresses the learning outcomes “Apply the techniques of activity-based management in identifying cost drivers / activities and explain how process re-engineering can be used to eliminate non-value adding activities and reduce activity costs” and “Apply activity based costing ideas to analyse direct customer profitability and extend this analysis to distribution channel profitability”.

November 2005 19 P2
Managerial Level Paper
P2 – Management Accounting – Decision Management
Examiner’s Answers
SECTION A Answer to Question One 1.1 Years 1 – 5 $50,000 x 3·605 = $180,250
$160,000/$180,250 = 0·8876
The correct answer is B 1.2 £ Selling price expected value = (£20 x 25%) + (£25 x 40%) + (£30 x 35%) = 25·50 Variable cost expected value = (£8 x 20%) + (£10 x 50%) + (£12 x 30%) = 10·20 Expected unit contribution 15·30 1,000 units x £15·30 = £15,300
The correct answer is D

P2 20 November 2005
1.3 The total contribution must exceed £13,500, so to achieve this from a volume of 1,000 units, the unit contribution must exceed £13·50. The following combinations of selling price and variable cost and their respective combined probabilities meet this target:
Selling Price Variable cost Probability
£ £ 25 8 0·4 x 0·2 = 0·0825 10 0·4 x 0·5 = 0·2030 8 { 30 10 { 0·35 x 1·0 = 0·3530 12 {
Combined probability total 0·63
The correct answer is C
1.4 The average time for 7 assignments = 6 x 7-0·415 = 2·6757 hours
Total time for 7 assignments = 7 x 2·6757 hours 18·730 hours The average time for 6 assignments = 6 x 6-0·415 = 2·8525 hours Total time for 6 assignments = 6 x 2·8525 hours 17·115 hours Time for the 7th assignment 1·615 hours i.e. 1·62 hours 1.5 Profitability Index values are:
J 31/400 = 0·0775 3rd K 43/500 = 0·0860 2nd L 31/300 = 0·1033 1st
Therefore the investment plan should be to invest: L in full K in full J x 50%

November 2005 21 P2
1.6 The return is greater than 15% so try 20%:
Year Cashflow $000
Discount Factor Present Value$000
0 (500) 1·000 (500·00) 1 70 0·833 58·31 2 90 0·694 62·46 3 630 0·579 364·77 NPV (14·46)
Since the NPV is negative when the cashflows are discounted at 20%, the IRR of the project lies between 15% and 20%. The IRR = 15% + [(43/57·46) x 5] = 18·74% 1.7 The average time per unit for 4 units = 8·3667 / 4 = 2·0917 hours
2·0917/3 = 0·6972 √0·6972 = 0·835 The rate of learning is 83·5%
1.8 Contribution table (all contribution figures in £): Sale/Demand
Make 10 11 12 10 500 500 500 11 480 550 550 12 460 530 600
Regret table (all contribution figures in £): Sale/Demand Maximum Regret
Make 10 11 12 10 0 50 100 100 11 20 0 50 50 12 40 20 0 40
The answer is to make 12.

P2 22 November 2005
SECTION B Answer to Question Two 2-year plan Year Cashflow
£ Discount Factor
Present Value
£ 2 Replacement 8,000 x 1·052 8,820 ·797 7,030 3 Servicing 500 x 1·103 666 ·712 474 4 Servicing 2,500 x 1·104 3,660 Replacement 8,000 x 1·054 9,724 13,384 ·636 8,512 5 Servicing 500 x 1·105 805 ·567 456 6 Servicing 2,500 x 1·106 4,429 Trade In Value 7,000 x 1·056 (9,381) (4,952) ·507 (2,511) 13,961 3-year plan Year Cashflow
£ Discount Factor
Present Value
£ 3 Servicing 4,000 x 1·103 5,324 Replacement 11,000 x 1·053 12,734 18,058 ·712 12,857 4 Servicing 500 x 1·104 732 ·636 466 5 Servicing 2,500 x 1·105
4,026 ·567 2,283
6 Servicing 4,000 x 1·106 7,086 Trade In Value 4,000 x 1·056 (5,360) 1,726 ·507 875 16,481 The above values exclude the non relevant costs. The 2-year replacement cycle is the lower cost option by £2,510 in present value terms.

November 2005 23 P2
Answer to Question Three (i) There are a number of approaches to pricing that may be used by organisations
depending on the nature of their business, their products and services and the extent to which these are personalised to the requirements of their customers. ML is an engineering company that provides a unique service to each of their customers using a range of engineering skills. As a consequence there is no “real” market for their services so a cost based approach to pricing must be used. There are a number of cost based approaches to pricing that may be adopted by ML ranging from a variable cost approach (Marginal costing) to a total cost approach (Absorption costing). The main difference between these approaches is their differing treatment of fixed production overhead costs.
Absorption costing attributes fixed production overhead costs to individual jobs or units using an absorption rate which in ML is based on machine hours, whereas marginal costing makes no attempt to attribute fixed production overhead costs to individual jobs. This results in a lower unit cost under marginal costing compared to absorption costing.
As a consequence the percentage mark up added to these absorption/marginal costs to determine the selling price will be different so as to result in the same level of profits overall. However, the use of absorption costing approaches may lead the manager to believe that the fixed production overhead cost absorbed per unit is incurred at a unit level (which is wrong). In turn this may mean that the manager will not be prepared to offer a price below this absorption cost because to do so “incurs a loss.” However, the marginal costing approach may lead the manager to ignore the fixed production overhead costs with the consequence that the overall performance of ML may be loss making.
(ii) In the short term the comment is valid since the fixed costs will continue to be incurred
whether work is being undertaken or not. Any price in excess of variable costs provides a contribution towards the fixed costs of ML. Therefore it would be true to say that “any price that exceeds variable costs is better than no work” in the short term. However, care needs to be taken when accepting work at lower than normal profit margins because it is very difficult to increase prices in the future when the same customer requires further spare parts for its machine.
Furthermore, in the long term, a company needs to be profitable to survive, so that there is a need to charge selling prices that fully recover all of the costs incurred. The acceptance of lower prices in order to utilise spare capacity is acceptable in the short term but cannot continue into the long term because the fixed costs are still being incurred and need to be at least covered by the overall contribution earned.
P2 24 November 2005
Answer to Question Four
REPORT To: Management Team From: Assistant Management Accountant Subject: Cost Structures Date: November 2005 Introduction The company is facing increasing competition particularly from overseas suppliers. It is thus becoming more and more important that we understand the cost structures of the company so that our managers can make informed decisions about the price discounts that may be offered in order to win customer orders. The purpose of this report is to explain the implications of the changing nature of cost structures in our company. Traditional classifications for management decisions Traditionally costs were classified between those that are affected by a change in the level of activity (known as variable costs) and those that are not affected by a change in the level of activity (known as fixed costs). For this purpose the level of activity was an output measure, often the number of units of a product or the number of hours of output. In PK plc, because we produce a range of self assembly furniture, a number of hours measure would need to be used in order to allow us to accumulate the total output of a particular accounting period by adding the equivalent standard hours of each unit produced. The modern manufacturing environment PK plc operates a computer controlled manufacturing facility using highly skilled labour. Therefore many of its production costs will be incurred as a consequence of investing in the production system and employing skilled staff on a salaried basis. As a consequence the majority of its costs would be classified as fixed if the traditional cost classification were to be applied. The development of modern manufacturing systems has resulted in greater investigation into the causes of costs rather than the simple assumption that costs can be classified according to their behaviour in relation to changes in output. As a result activity is considered from a number of different perspectives, including the measurement of the activities carried out in order to produce the output and the costs incurred in relation to each of those input activities. This is known as activity based costing, and when this system is fully applied costs that were previously believed to be fixed are in fact found to be variable in relation to a particular input activity. Stock valuation The need for profit reporting and stock valuation is usually the result of external reporting requirements imposed by legislation and governed by accounting standards. These stock valuation rules require that the stock be valued at the lower of cost or net realisable value (the latter being the application of the prudence concept). In this context cost is explained to be “the total cost incurred in bringing the item to its present location and condition, including an appropriate proportion of production overhead cost.” In other words, stock should be valued at total production cost, including both fixed and variable production costs. Thus for the purposes of stock valuation it is not necessary to classify costs according to whether or not they are affected by changes in activity.

November 2005 25 P2
Short-term decision making The majority (if not all) short-term decisions involve changes in activities; either a change in the level of output or a change in the activities used to create the output. Thus it is appropriate when making such decisions to be aware of the expected changes in costs as a result of the proposed changes in activity. An analysis of the causes of costs allows managers to predict the cost changes that are expected as a result of the changes to the activity and thus make the appropriate decision. Conclusion Thus there is a conflict between the accounting classifications and techniques that are most useful for short-term decision making and those that are required for external profit reporting and stock valuation.
P2 26 November 2005
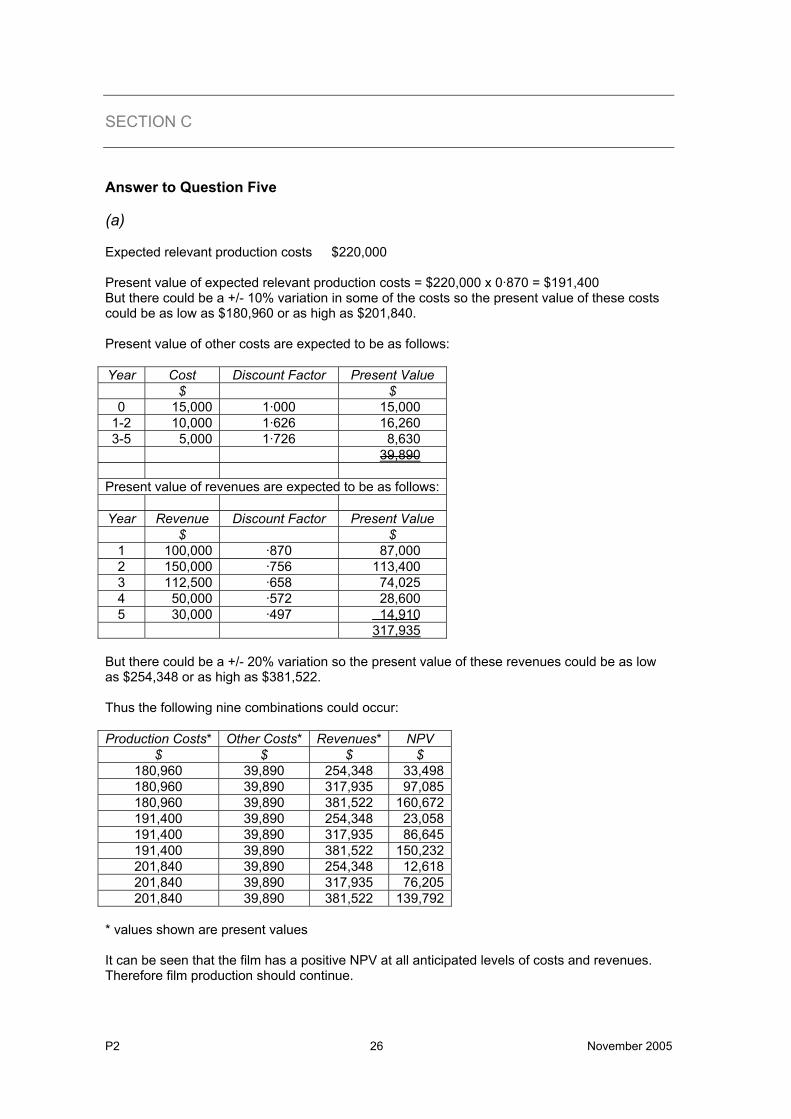
SECTION C Answer to Question Five (a) Expected relevant production costs $220,000 Present value of expected relevant production costs = $220,000 x 0·870 = $191,400 But there could be a +/- 10% variation in some of the costs so the present value of these costs could be as low as $180,960 or as high as $201,840. Present value of other costs are expected to be as follows: Year Cost Discount Factor Present Value
$ $ 0 15,000 1·000 15,000
1-2 10,000 1·626 16,260 3-5 5,000 1·726 8,630
39,890 Present value of revenues are expected to be as follows: Year Revenue Discount Factor Present Value
$ $ 1 100,000 ·870 87,000 2 150,000 ·756 113,400 3 112,500 ·658 74,025 4 50,000 ·572 28,600 5 30,000 ·497 14,910
317,935 But there could be a +/- 20% variation so the present value of these revenues could be as low as $254,348 or as high as $381,522. Thus the following nine combinations could occur: Production Costs* Other Costs* Revenues* NPV
$ $ $ $ 180,960 39,890 254,348 33,498180,960 39,890 317,935 97,085180,960 39,890 381,522 160,672191,400 39,890 254,348 23,058191,400 39,890 317,935 86,645191,400 39,890 381,522 150,232201,840 39,890 254,348 12,618201,840 39,890 317,935 76,205201,840 39,890 381,522 139,792
* values shown are present values It can be seen that the film has a positive NPV at all anticipated levels of costs and revenues. Therefore film production should continue.

November 2005 27 P2
(b) Although any number of possible values may be used for each variable, the use of probabilities when evaluating the risk of long term decisions is usually based on three possible values being determined for each input variable. It is then possible to evaluate each of the most likely, optimistic and pessimistic outcomes that could occur (as in (a) above), and make a decision based upon the range of results. The next step is to assign probabilities to each of the possible input values (production costs and revenues) and determine the combined probability of each combination of these input values occurring. These combined probabilities can then be used with the output values (NPV values) to calculate the expected NPV and the probability of the NPV exceeding a target value set by management. Alternatively the input value probabilities can be used to assign random number ranges to each input value. Random number generators may then be used to determine many combinations of input values in a simulation modelling technique and for each combination the model determines the output value (NPV). The output values can then be analysed to determine the range of values that could occur and make the decision depending on the manager’s attitude to risk. Answer to Question Six (a) Throughput accounting falls within a wider management philosophy known as the theory of constraints. It recognises that where production is carried out through a series of processes on machines then there may be varying capacities in each of these resources. If production demand is high then it may be the case that total demand cannot be met and the organisation needs to identify the bottleneck resource that is causing the constraint. Having done this, the short-term objective is to maximise the return yielded by this scarce resource and we seek to utilise it on those products that yield the highest contribution per unit of scarce resource. Here contribution is defined as sales revenue less directly attributable variable costs. In the modern manufacturing environment it is commonly perceived that the only truly variable cost in the short term is materials since other costs that have been traditionally regarded as variable such as direct labour and some expenses are the subject of minimum payment arrangements and are therefore fixed costs. As a consequence the calculation of contribution in this modern business environment is sales revenue less direct material cost. (b)
TR PN BE Total £/batch £/batch £/batch Selling Price 340 450 270 K 150 120 90 L 70 90 40 M/V 30 75 45 Contribution 90 165 95 Kgs of L 7 9 4

P2 28 November 2005
Contribution per kg of L 12·86 18·33 23·75 Ranking 3rd 2nd 1st Minimum output (batches) 50 50 50 Uses (kg of L) 350 450 200 1,000 Balance (kg of L) 1,650 3,150 1,200 6,000 Discretionary manufacture (batches) 235 350 300 Total output (batches) 285 400 350
(c) Objective function value of £110,714 is the contribution from the optimal solution which is to produce 500 batches of TR, 357 batches of PN and 71 batches of BE. The product slack values of 0, 43 and 279 represent the unsatisfied demand (in batches) of products TR, PN, and BE respectively. The slack values for ingredients L and M of £3 and £28 respectively represent the shadow prices of the scarce resources. There is no shadow price for ingredient K because the supply is unlimited. Answer to Question Seven (a)
Client profile D E F Number of visits 30 40 15Return mileage 100 140 200 Total mileage 3,000 5,600 3,000 Costs £ £ £ Travel to clients 3,880 7,240 3,880Accommodation Nil 8,000 3,000Other 70,833 247,917 106,250Total costs 74,713 263,157 113,130
Travel costs
mileageTotaltcosTotal
600,11000,15£ = £1·29/mile
Accommodation costs
staysovernightofNumbertcosTotal
55000,11£ = £200/stay
Other costs
hoursChargeablecostTotal
000,6000,425£ = £70·833/hour

November 2005 29 P2
(b) D E F Chargeable hours 1,000 3,500 1,500 Total cost attributed using current system £75,000 £262,500 £112,500 Activity based cost attributed £74,713 £263,157 £113,130 (£1,000 not attributed due to roundings)
Although there are some differences between the costs attributed to each type of client they are not significant and it is questionable whether the added complexity of the ABC approach can be justified in these circumstances. However, the senior consultant’s suggestion is theoretically correct, and if the profile of prospective clients were to be significantly different from those of the existing client profiles then the use of ABC would be justified. One of the main reasons for the similarity in the cost values is that only 6% of the existing costs are believed to be caused by activities other than chargeable hours. In fact the senior consultant recognises that the majority of the costs that are incurred are facility type costs that will continue to exist (in the short term at least) as a consequence of a past decision to engage the consultants and their support staff. These costs would continue to be incurred even if there were no client projects to be undertaken. The validity of attempting to attribute these costs to such clients is therefore questionable. (c) The four classifications are based upon the different factors that may cause a cost to vary. Unit level costs are driven by the quantity of products made. These costs may typically include raw material.
Batch level costs are those that are incurred every time a batch is processed. However large a batch is (whether it is, for example, 1 unit or 1,000 units), there may be a cost such as tool setting which falls under this category.
Product sustaining costs are those that exist as long as the product or product range continues to be manufactured. Such costs may include the salary of the “Product Manager” who is responsible for the overall marketing of the product.
Facility sustaining costs are seen as the costs that are truly fixed and relate to the overall organisation. These costs may include the rent on a factory that manufactures the full range of the company’s products or head office costs that do not relate to any specific product.
ZP is a service organisation, but there may still be some relevance in the above classifications.
The unit level costs relate to the chargeable hour. Although the consultants are salaried, they are expected to deliver 1,500 hours of chargeable effort per year at a cost of £40 per hour.
The batch concept also exists in that there will be a number of contracts involved in this type of business. Each contract may involve any number of chargeable hours. The client director may have to spend the same amount of time negotiating each contract whether it is large or small. Similarly some administrative functions may be batch/contract related; for example it takes just as long for credit control to chase payment on a £750 contract as it does to chase a £7,500 contract.
The product sustaining level may be related to each client. If each client has a number of contracts then there may be a “Client director” and other administrative costs that are incurred on a client basis.
The facility sustaining costs are also in evidence; these include the infrastructure costs of telephone, fax and communications.
In conclusion, the four classifications do appear to be of potential use to a service organisation such as ZP.