november 17, 2010 ensuring educator excellence. ctc and cde btsa induction interagency task force ...
TRANSCRIPT

BTSA Induction Directors Meeting
November 17, 2010
Ensuring Educator Excellence
2
CTC and CDE BTSA Induction Interagency Task Force
Welcome and Introductions Reviewing the Agenda Process for sending in afternoon questions
BTSA Induction Directors Meeting 2010
3
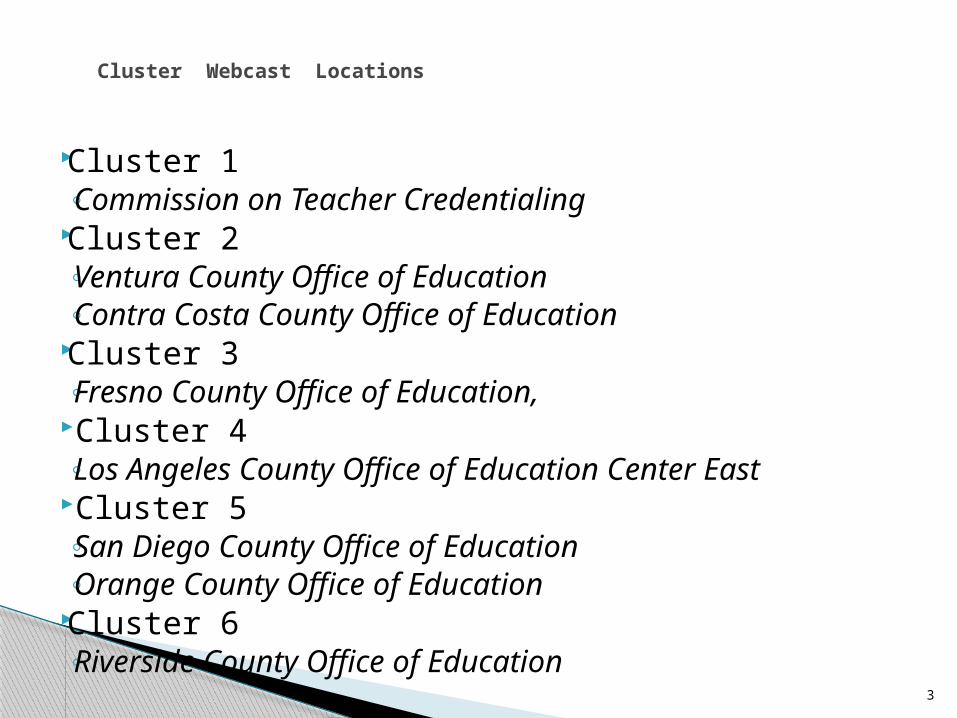
Cluster 1◦ Commission on Teacher Credentialing
Cluster 2◦ Ventura County Office of Education◦ Contra Costa County Office of Education
Cluster 3◦ Fresno County Office of Education,
Cluster 4◦ Los Angeles County Office of Education Center
East Cluster 5
◦ San Diego County Office of Education◦ Orange County Office of Education
Cluster 6◦ Riverside County Office of Education
Cluster Webcast Locations
4
BTSA Induction Cluster Region Directors
◦ Meeting logistics
◦ Lunch details
◦ Introductions
◦ Activating Activities
Talk to you again at 10:15!
Local Venue Information
5
SB 2042 (1998) allows an individual a route to earn a Clear Multiple or Single Subject Teaching Credential by completing an approved BTSA Induction Program
AB 2210 (2004) states that Induction is the required route to earn the general education Clear Teaching Credential
BTSA Induction

6
Provide job-embedded, differentiated support and professional development for beginning teachers
Provide the pathway for preliminary credential holders to earn a clear credential
Goals of the Induction Program(EC 44279)
7
Selected findings from2009-2010
Statewide Consent Forms
A Statewide Look at BTSA Induction:
8
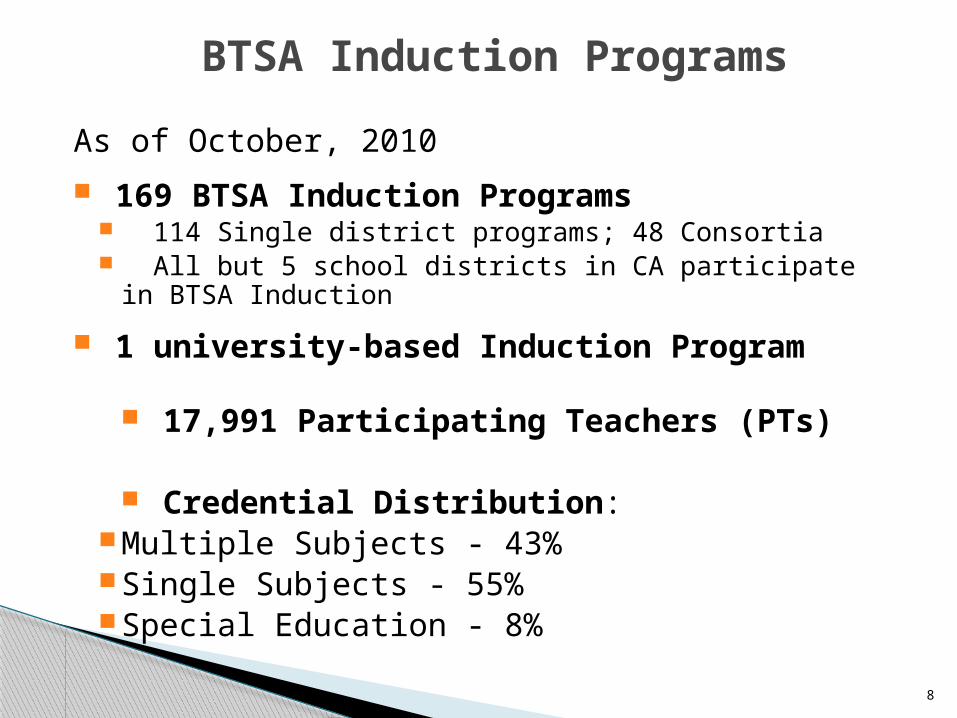
As of October, 2010
169 BTSA Induction Programs 114 Single district programs; 48 Consortia All but 5 school districts in CA participate in BTSA Induction
1 university-based Induction Program 17,991 Participating Teachers (PTs)
Credential Distribution:Multiple Subjects - 43%Single Subjects - 55%Special Education - 8%
BTSA Induction Programs
9
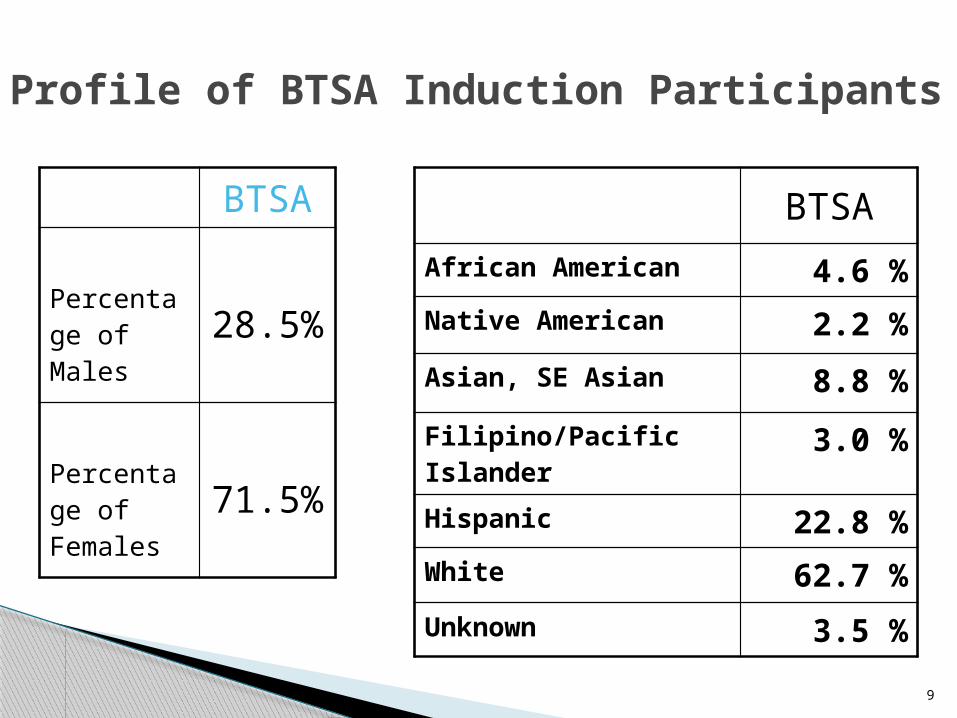
BTSA
Percentage of Males 28.5%
Percentage of Females 71.5%
BTSA
African American 4.6 %
Native American 2.2 %
Asian, SE Asian 8.8 %
Filipino/Pacific Islander 3.0 %
Hispanic 22.8 %
White 62.7 %
Unknown 3.5 %
Profile of BTSA Induction Participants
10
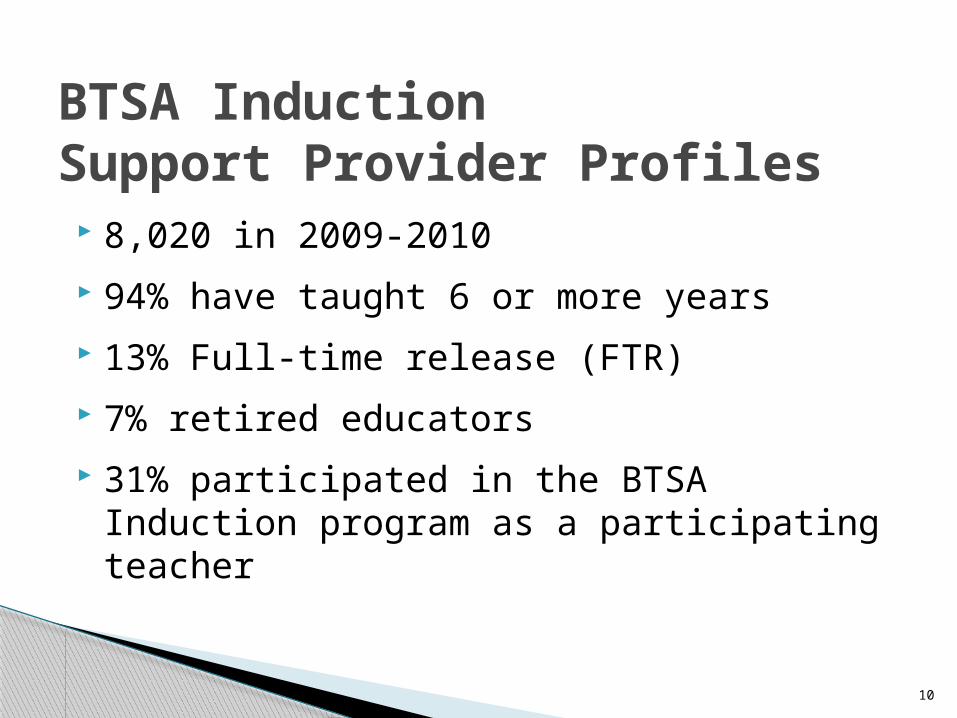
8,020 in 2009-2010
94% have taught 6 or more years
13% Full-time release (FTR)
7% retired educators
31% participated in the BTSA Induction program as a participating teacher
BTSA Induction Support Provider Profiles
11
2009-2010Statewide Program Evaluation Surveys
Participating Teachers (PT) Support Providers (SP) Site Administrators (SA)
Selected findings from
12
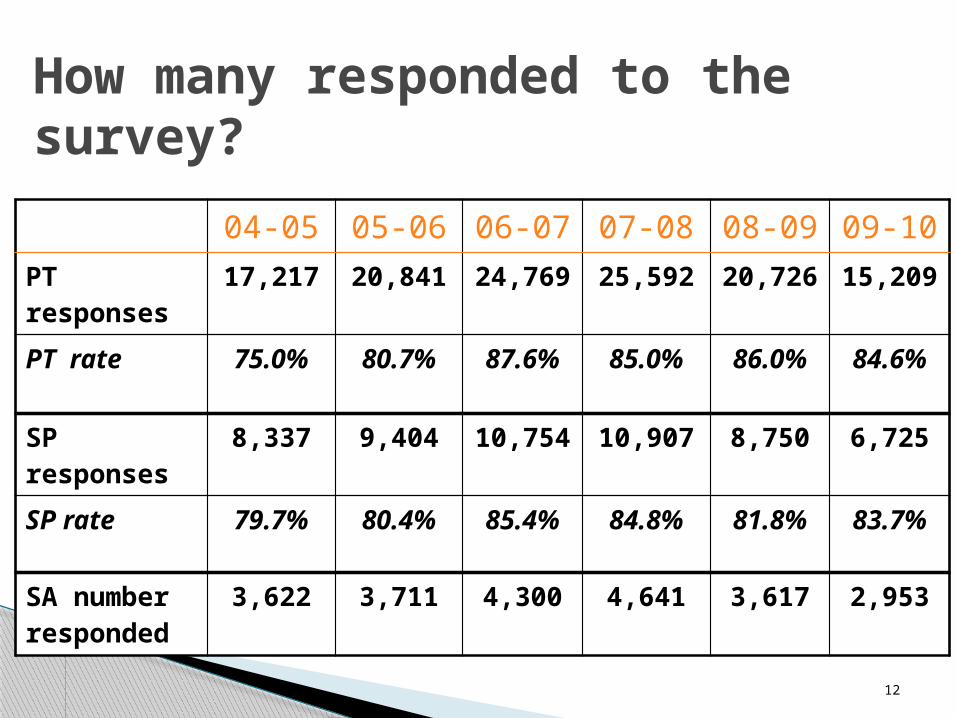
How many responded to the survey?
04-05 05-06 06-07 07-08 08-09 09-10
PT responses
17,217 20,841 24,769 25,592 20,726 15,209
PT rate 75.0% 80.7% 87.6% 85.0% 86.0% 84.6%
SP responses
8,337 9,404 10,754 10,907 8,750 6,725
SP rate 79.7% 80.4% 85.4% 84.8% 81.8% 83.7%
SA number responded
3,622 3,711 4,300 4,641 3,617 2,953
13
More than three-fourths Support Providers (76%) are full-time classroom teachers
Half Support Providers support more than one participating teacher
More than three-fourths Support Providers (81%) have served as a SP more than two years.
Support Provider Responsibilities
14
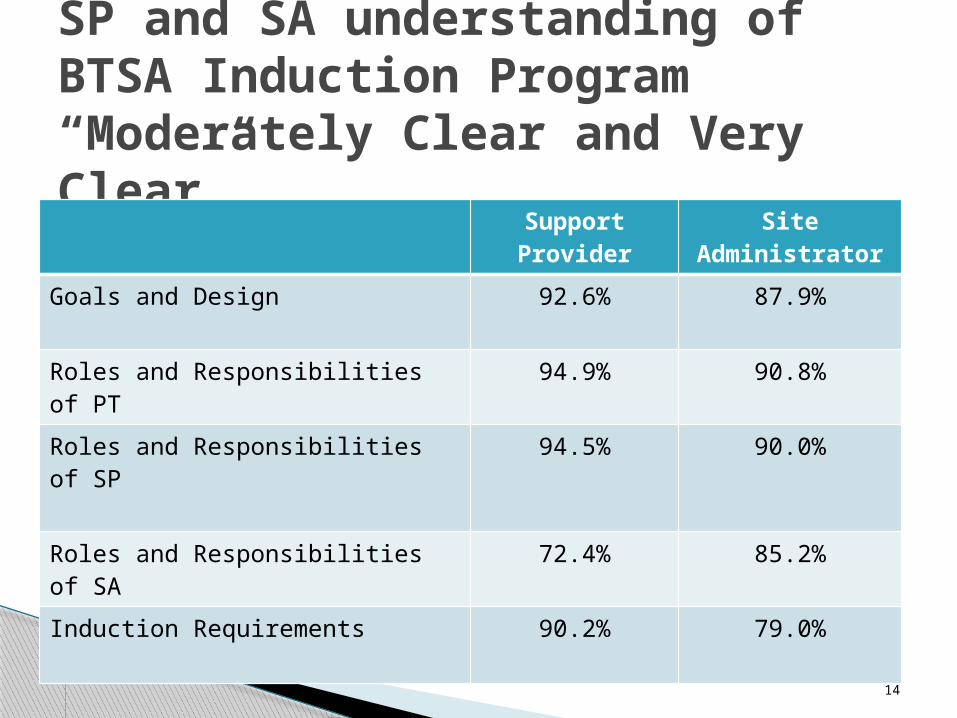
SP and SA understanding of BTSA Induction Program “Moderately Clear and Very Clear”
Support Provider
Site Administrator
Goals and Design 92.6% 87.9%
Roles and Responsibilities of PT 94.9% 90.8%
Roles and Responsibilities of SP 94.5% 90.0%
Roles and Responsibilities of SA 72.4% 85.2%
Induction Requirements 90.2% 79.0%
15
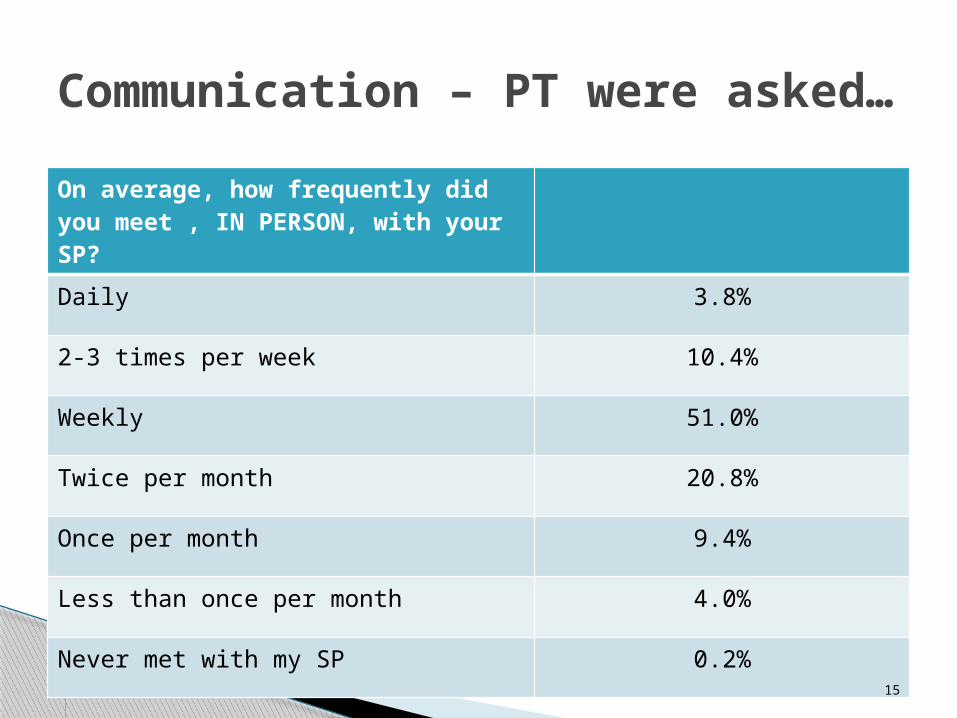
Communication – PT were asked…On average, how frequently did you meet , IN PERSON, with your SP?
Daily 3.8%
2-3 times per week 10.4%
Weekly 51.0%
Twice per month 20.8%
Once per month 9.4%
Less than once per month 4.0%
Never met with my SP 0.2%
16
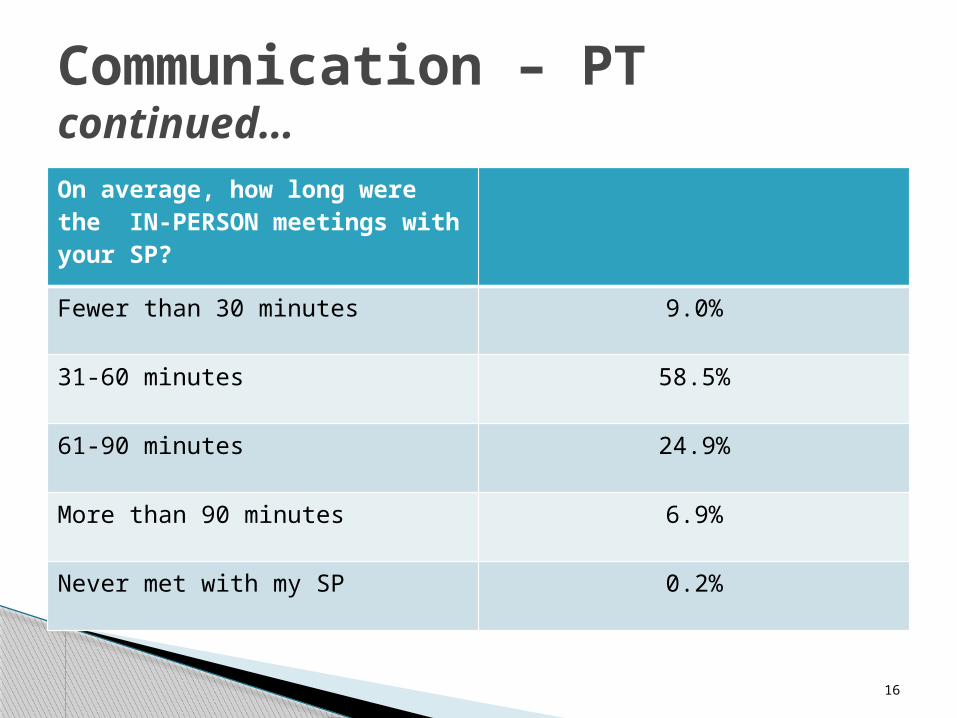
Communication – PT continued…On average, how long were the IN-PERSON meetings with your SP?
Fewer than 30 minutes 9.0%
31-60 minutes 58.5%
61-90 minutes 24.9%
More than 90 minutes 6.9%
Never met with my SP 0.2%
17
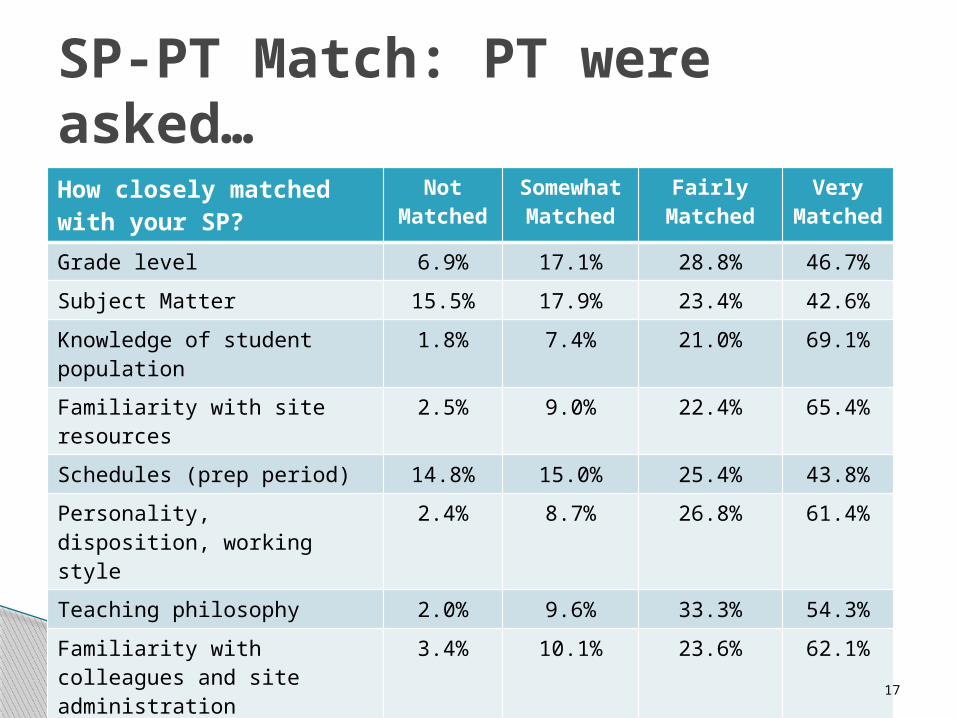
SP-PT Match: PT were asked… How closely matched with your SP?
Not Matche
d
Somewhat
Matched
Fairly Matched
Very Matche
d
Grade level 6.9% 17.1% 28.8% 46.7%
Subject Matter 15.5% 17.9% 23.4% 42.6%
Knowledge of student population
1.8% 7.4% 21.0% 69.1%
Familiarity with site resources
2.5% 9.0% 22.4% 65.4%
Schedules (prep period) 14.8% 15.0% 25.4% 43.8%
Personality, disposition, working style
2.4% 8.7% 26.8% 61.4%
Teaching philosophy 2.0% 9.6% 33.3% 54.3%
Familiarity with colleagues and site administration
3.4% 10.1% 23.6% 62.1%
18
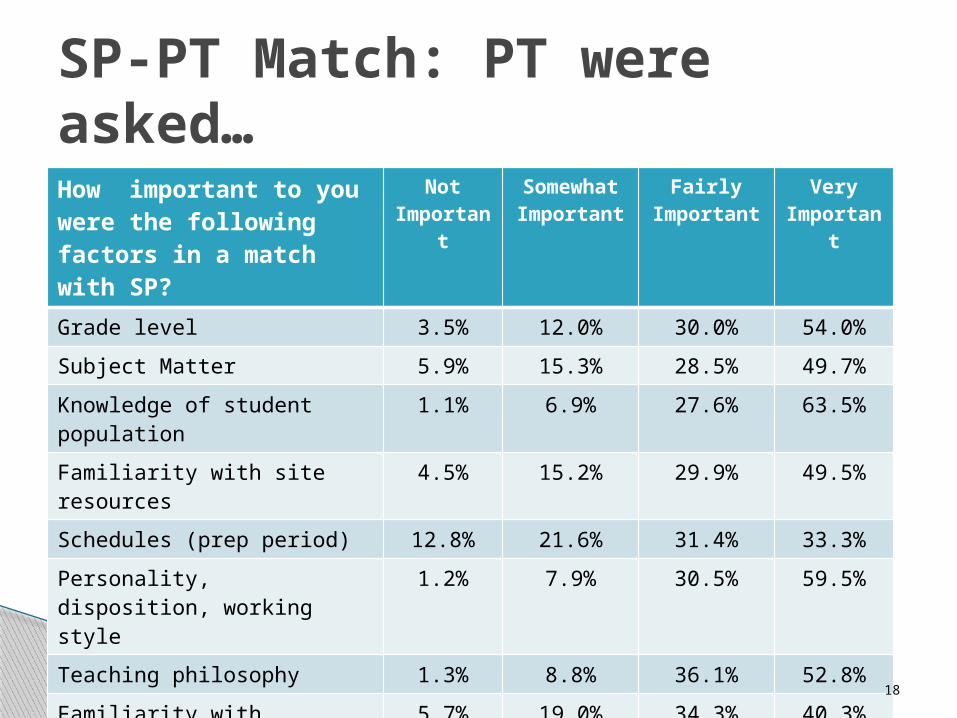
SP-PT Match: PT were asked… How important to you were the following factors in a match with SP?
Not Importa
nt
Somewhat
Important
Fairly Important
Very Importa
nt
Grade level 3.5% 12.0% 30.0% 54.0%
Subject Matter 5.9% 15.3% 28.5% 49.7%
Knowledge of student population
1.1% 6.9% 27.6% 63.5%
Familiarity with site resources
4.5% 15.2% 29.9% 49.5%
Schedules (prep period) 12.8% 21.6% 31.4% 33.3%
Personality, disposition, working style
1.2% 7.9% 30.5% 59.5%
Teaching philosophy 1.3% 8.8% 36.1% 52.8%
Familiarity with colleagues and site administration
5.7% 19.0% 34.3% 40.3%
19
Collected in fall, annually
This year, matched with BTSA Consent database and SEID information from PAIF data from CDE
May become even more important with the flexible funding in 2009-10
Retention Data
20
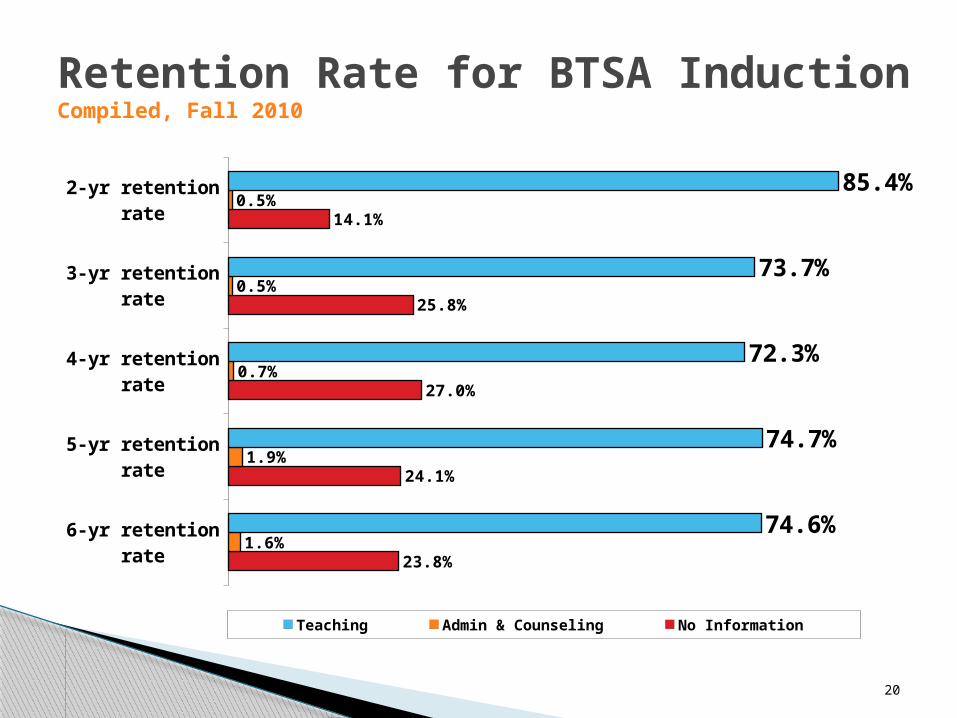
Retention Rate for BTSA InductionCompiled, Fall 2010
6-yr retention rate
5-yr retention rate
4-yr retention rate
3-yr retention rate
2-yr retention rate
23.8%
24.1%
27.0%
25.8%
14.1%
1.6%
1.9%
0.7%
0.5%
0.5%
74.6%
74.7%
72.3%
73.7%
85.4%
Teaching Admin & Counseling No Information
21
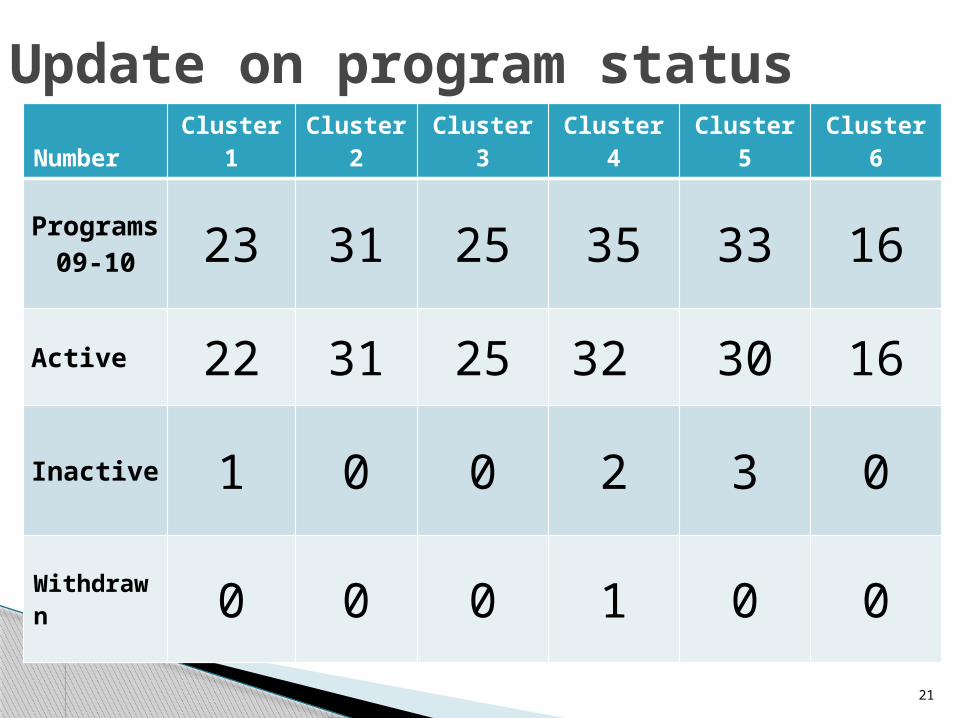
Update on program statusNumber Cluster 1 Cluster 2 Cluster 3 Cluster 4 Cluster 5 Cluster 6
Programs09-10 23 31 25 35 33 16
Active 22 31 25 32 30 16
Inactive 1 0 0 2 3 0
Withdrawn 0 0 0 1 0 0
22
Cluster 1
Cluster 2
Cluster 3
Cluster 4
Cluster 5
Cluster 6
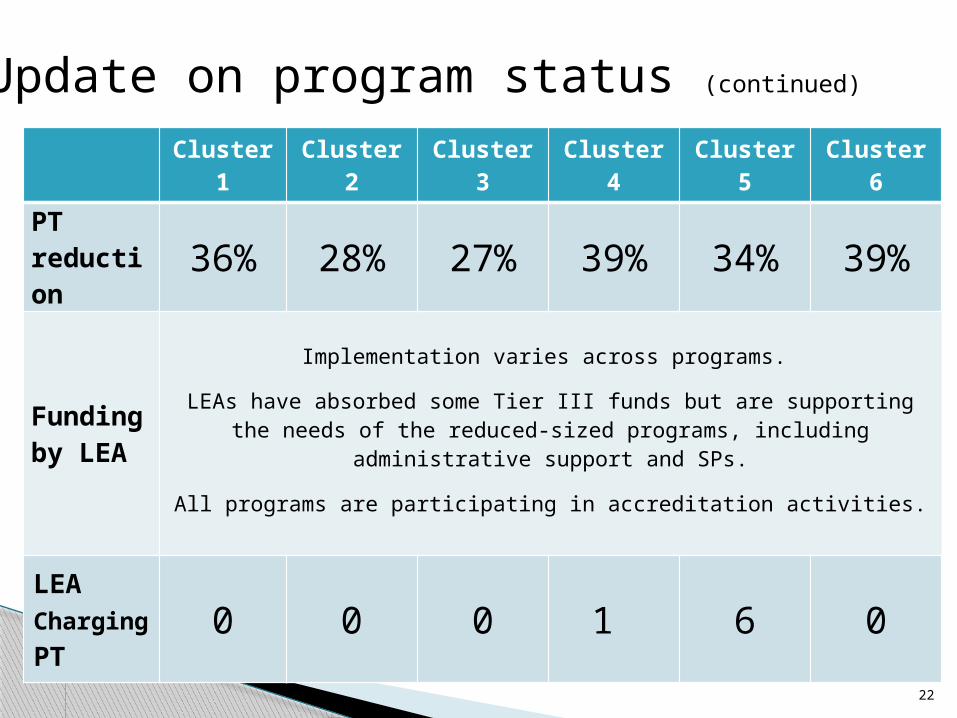
PT reduction
36% 28% 27% 39% 34% 39%
Funding by LEA
Implementation varies across programs.
LEAs have absorbed some Tier III funds but are supporting the needs of the reduced-sized programs, including administrative support and SPs.
All programs are participating in accreditation activities.
LEA Charging PT
0 0 0 1 6 0
Update on program status (continued)
23
Budget Information
New administration +
New legislature +
New Superintendent of
Public Instruction =
WAIT AND SEE
24
Commission on Teacher
Credentialing:
Accreditation System
25
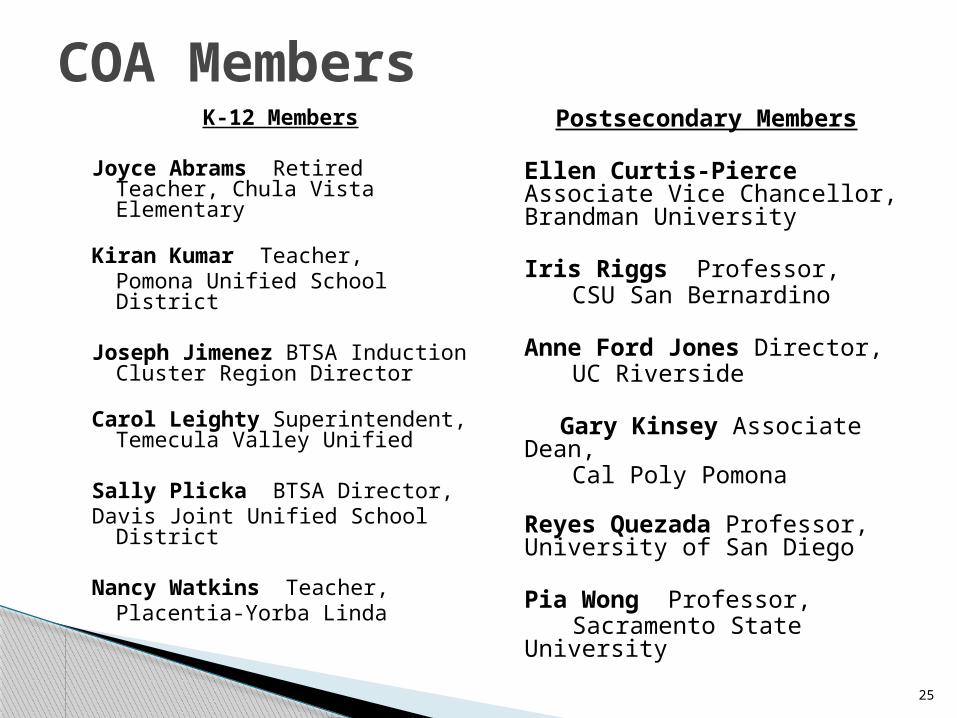
K-12 Members
Joyce Abrams Retired Teacher, Chula Vista Elementary
Kiran Kumar Teacher,Pomona Unified School District
Joseph Jimenez BTSA Induction Cluster Region Director
Carol Leighty Superintendent, Temecula Valley Unified
Sally Plicka BTSA Director,Davis Joint Unified School District
Nancy Watkins Teacher, Placentia-Yorba Linda
COA MembersPostsecondary Members
Ellen Curtis-Pierce Associate Vice Chancellor, Brandman University
Iris Riggs Professor, CSU San Bernardino
Anne Ford Jones Director,UC Riverside
Gary Kinsey Associate Dean, Cal Poly Pomona
Reyes Quezada Professor, University of San Diego
Pia Wong Professor, Sacramento State University
26
Must continuously meet
Common Standards Program Standards, and Preconditions
regardless of state funding levels, how the local program sponsor elects to allocate its
funding, and whether or not candidate fees are collected.
Approved Program
27
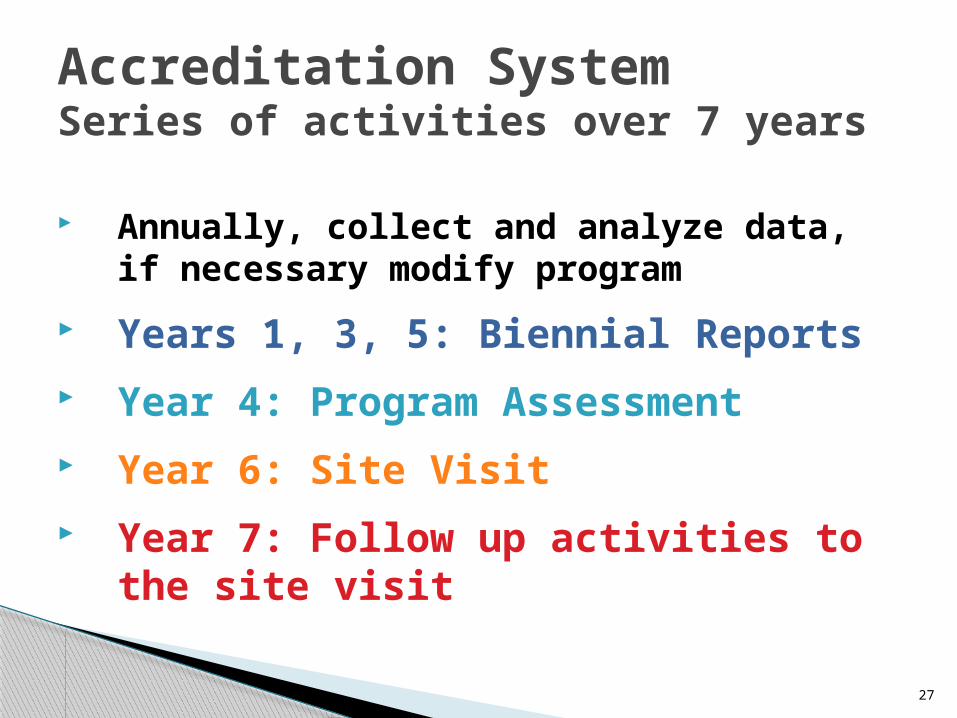
Annually, collect and analyze data, if necessary modify program
Years 1, 3, 5: Biennial Reports
Year 4: Program Assessment
Year 6: Site Visit
Year 7: Follow up activities to the site visit
Accreditation SystemSeries of activities over 7 years
28
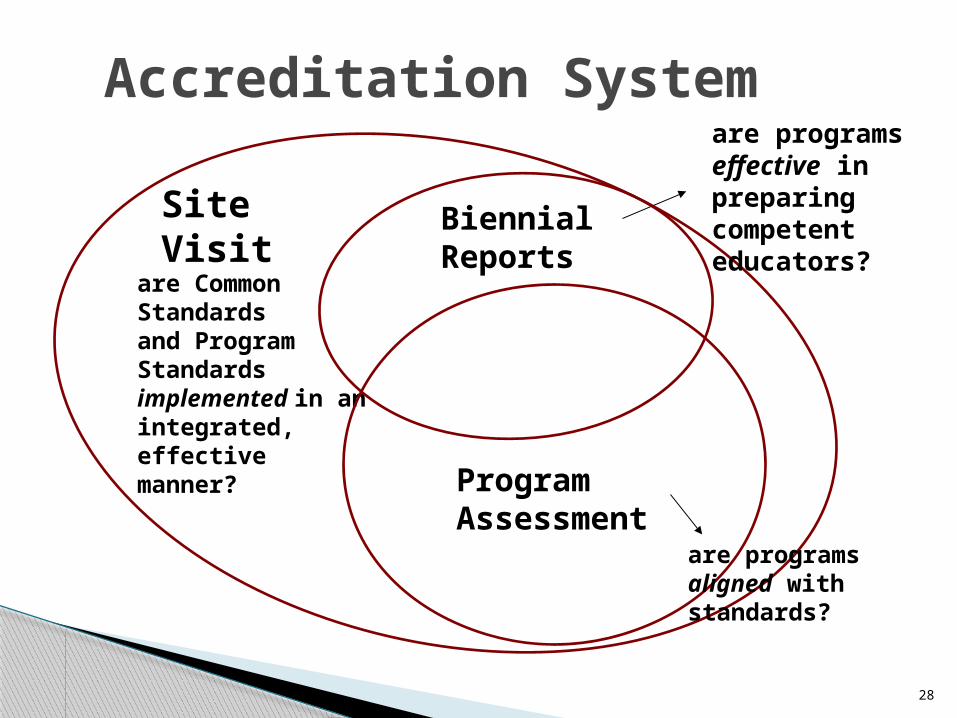
Accreditation System
are Common Standards and Program Standards implemented in an integrated, effective manner?
Biennial Reports
are programs effective in preparing competent educators?
are programs aligned with standards?
Site Visit
Program Assessment
29
California education professionals who have attended the Commission training sessions
Representatives from IHE, school districts, and county offices of education
BIR members ◦ Review Initial Program Review and Program Assessment
documentation◦ Serve on site visit teams◦ Training sessions occur twice a year
January summer
Board of Institutional Reviewers (BIR)

30
Due in fall of the year following the Biennial Report year…so fall 2010 for Orange, Blue, and Violet cohorts; fall, 2011 for Red, Green, Indigo.
4-6 key assessments◦ Candidate Competence and
◦ Program Effectiveness
Template available from CTC Web page;BTSA template available on btsa.ca.gov
Reports on prior 2 years of data
Biennial Report
31
New this year: All programs will be required to submit Part B, a verification that the report has been reviewed by the Superintendent or designee
Reports are emailed to the CTC:
[email protected], with a copy to CRD
Commission staff will review and respond to the report
Response will be provided to the institution (Superintendent with a cc to the program director) with 6-12 weeks
Biennial Reports
32
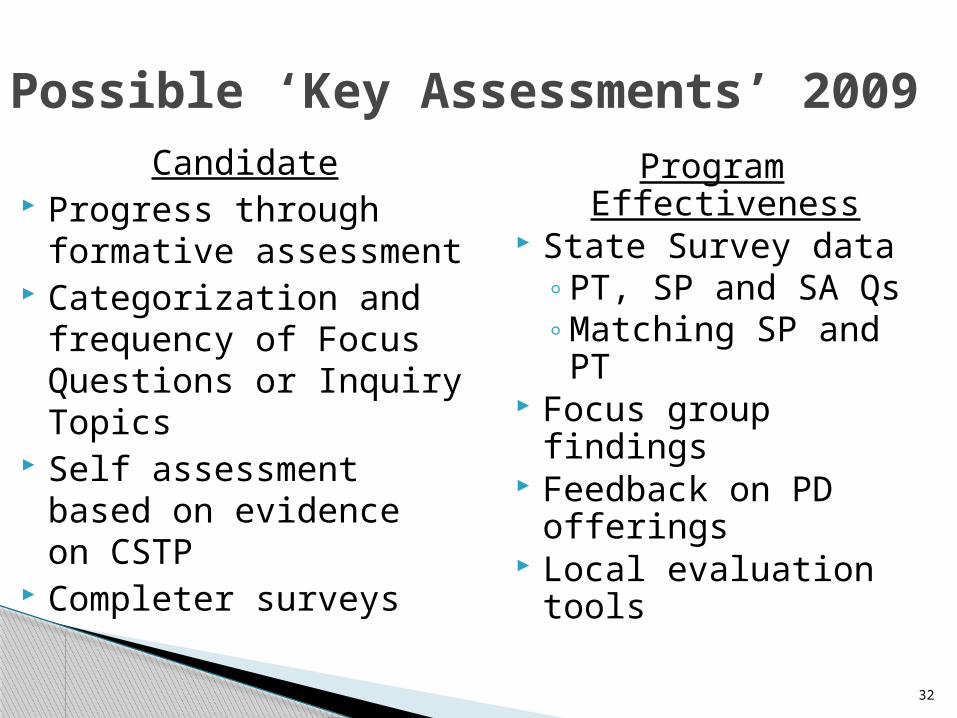
Candidate Progress through
formative assessment Categorization and
frequency of Focus Questions or Inquiry Topics
Self assessment based on evidence on CSTP
Completer surveys
Program Effectiveness State Survey data
◦PT, SP and SA Qs◦Matching SP and
PT Focus group findings Feedback on PD
offerings Local evaluation
tools
Possible ‘Key Assessments’ 2009
33
Handout #1: The Frankenstein Report
Put together from “parts” of many Biennial Report submissions
Like Frankenstein, it doesn’t fit together well or make much sense, but fits our purposes
Highlights of the 2010 Biennial Reports (so far)
34
Section A, Part I: Contextual Info and Program
Status
Sample 1
35
Section A, Part I: Contextual Info and Program
Status
Sample 2
36
Look for patterns in the data Consult multiple years to identify trends Avoid individual questions Select data that illuminates your focus
question It’s not just presentation, but also analysis Steps to using state survey well
◦ Read it for content first◦ Identify common themes within each survey◦ Work across stakeholder groups◦ Include perspectives of all groups
Using the State Survey. . .
37
Data that is too global to help determine its effect on effectiveness or competence
• For example: district pd that all personnel attended and completed evaluations for, or program completion rate of your candidates
Data that you have no influence upon• For example: retention data
Data that is not tied to standards For example: evaluations with room temp &
food quality comments
Three things to avoid. . .
38
Section A, Part II: Assessments of Candidate Competence and Program
Effectiveness
Sample 3

39
Section A, Part III: Presentation and Analysis of Data
Sample 4

40
Section A, Part III: Presentation and Analysis of Data
Sample 5

41
Section A, Part III: Presentation and Analysis of Data
Sample 6

42
Section A, Part III: Presentation and Analysis of Data
Sample 7
43
Section A, Part III: Presentation and Analysis of Data
Sample 8

44
Section A, Part III: Presentation and Analysis of Data
Sample 9

45
Section A, Part III: Presentation and Analysis of Data
Sample 10

46
Section A, Part III: Presentation and Analysis of Data
Sample 11

47
Section A, Part III: Presentation and Analysis of Data
Sample 12

48
Section A, Part III: Presentation and Analysis of Data
Sample 13
49
Section A, Part III: Presentation and Analysis of Data
Sample 14
50
Section A, Part III: Presentation and Analysis of Data
Sample 15

51
Section A, Part III: Presentation and Analysis of Data
Sample 16

52
Section A, Part III: Presentation and Analysis of Data
Sample 17

53
Section A, Part III: Presentation and Analysis of Data
Sample 18

54
Section A, Part III: Presentation and Analysis of Data
Sample 19
55
Section A, Part III: Presentation and Analysis of Data
Sample 20

56
Section A, Part IV: Changes made to program design
Sample 21
57
Section A, Part IV: Changes made to program design
Sample 22

58
Section A, Part IV: Changes made to program design
Sample 23
59
Section B Unit Review of the Report
Sample 24
60
Section B Unit Review of the Report
Sample 25
61
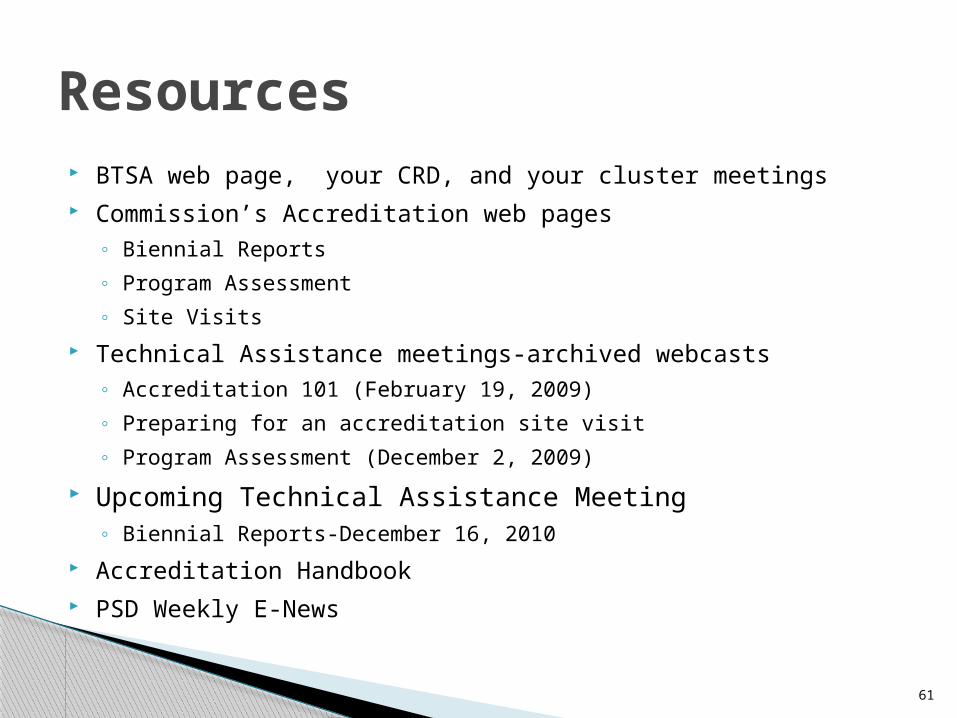
BTSA web page, your CRD, and your cluster meetings Commission’s Accreditation web pages
◦ Biennial Reports
◦ Program Assessment
◦ Site Visits
Technical Assistance meetings-archived webcasts◦ Accreditation 101 (February 19, 2009)
◦ Preparing for an accreditation site visit
◦ Program Assessment (December 2, 2009)
Upcoming Technical Assistance Meeting◦ Biennial Reports-December 16, 2010
Accreditation Handbook PSD Weekly E-News
Resources

62
LUNCH!
Generate, Sort & Synthesize
Individually
Record ideas from today’s topic “Biennial Reports”, each on a separate index card, that address:
1. effective practices for the BR process
2. things to avoid in this process
Generate several ideas for each of these areas. Adapted from: Groups at Work – Copyright MiraVia LLC – All rights
reserved

Table Groups:
Share ideas from cards using a round-robin protocol (one at a time, in sequence).
Decide as a table what ideas to put on the wall charts. Post cards with table’s ideas on corresponding chart.
At the signal, walk-around to read each groups ideas
What are some ‘ahas’ you have?
Adapted from: Groups at Work- Copyright 2010 – MiraVia LLC –
All rights reserved
66
1. If a program is inactive in 2010-2011 and have a Biennial Report due in the fall, do we report on the 2009-2010 data only?
Questions and Answers:
67
2. How do we report the anomalies in program design this year, caused by the temporary budget crisis (e.g. PT numbers, implementation changes) when we expect to return to the program as written as soon as possible?
Questions and Answers
68
3. Is there a minimum number of candidates needed to make a Biennial Report viable or required?
Questions and Answers
69
4. The different formats for the state survey have caused difficulties in comparing data from one year to another. Will there be a third format in 2010-2011?
Questions and Answers
70
5. Logistics question about the submission electronically:
1 file for Biennial Report AND Program Assessment document?
Program Assessment documents have caused issues with linked documents and zipped files.
Questions and Answers
71
6. Will the clear Ed. Specialist program be on the same cycle as General Ed. cycle?
Questions and Answers
72
7. If a program with a Biennial Report is due next fall has been recently approved to serve Ed. Specialist PTs/ should that report include Ed. Specialist?
Questions and Answers
73
8. If a program is inactive in 2010-2011 and have a Biennial Report due in the fall, do we report on 2009-2010 data only?
Questions and Answers
74
9. All of the samples shown have a single year of data displayed. For the Biennial Reports being submitted this year, will the focus be on a comparison of two years of data in reports submitted in 2011?
Questions and Answers
75
10. I’m supposed to be using two year’s worth of data. But what if I use an assessment tool that I gave this year, but not last year? Can I include the analysis of that data?
Questions and Answers
76
11. In looking at the samples presented today, is it enough to present the data in a table, chart, graph, etc. or do I also have to attach the complete assessment tool?
Questions and Answers
77
12. Is the standard deviation required on all assessments used? If it is required for all assessments, will it be provided by this year’s state survey?
Questions and Answers
78
13. If data shows and area of growth, can a program choose not to focus on that area in the Biennial Report?
Questions and Answers
79
14. Part B: I don’t get it. Who writes it, who signs it? Is there 1 narrative per credential or 1 narrative per program? Narrative vs. last page.
Questions and Answers
80
15. Sample 11….was it program effectiveness or candidate competence? How did participants in the room feel? What are some examples of how it might be expanded to include both?
Questions and Answers

81
16. Can you please define completer for induction?
Questions and Answers

82
17. Can you say more about employment is not required for Induction participation. How is it job-embedded support if they are not working with students? How do they meet the standards if not working with students?
Questions and Answers
83
18. Members reviewed samples of a BTSA program with multiple programs in a single district. Can you discuss what a Biennial Report would look like of a program with multiple induction programs?
Questions and Answers

84
19. What does a Biennial Report look like for an LEA that offers a BTSA program and a multiple subject clear credential program?
Questions and Answers

85
20. Back to charging candidates…re program budgets being reviewed for possible reasons why a program may be charging candidates?
Questions and Answers
86
21. How major do program changes need to be in order to be listed on the Program Changes section of the Contextual Information and Program Status page?
Questions and Answers

87
22. If we are on a program site visit, we will have access to the program documents prior to the visit. If we found they have not done any assessment of a particular standard, is the review team expected to go deeper in the review of this standard because the program has done no review on its own?
Questions and Answers
88
23. Did the reviewers find Sample 10 to be a good example of how to represent data on Exit Interview? Did the readers like this sample?
Questions and Answers

89
24. Do we have enough rigor in the system to use the Accreditation system in places where LEA are not doing the right thing for their candidates?
Questions and Answers
90
25. Please confirm that you are requiring 4-6 assessments to be referenced in the Biennial Report.
Questions and Answers
91
26. Does CTC have a specific expectation for the submission format or can other internet options be used, such as Google, Blackboard, Moodle, etc. for:◦ new program submission? ◦ biennial reports? ◦ other?
OR do we need an “old school” back-up plan such as a cd through snail mail?
Questions and Answers
92
27. How can program charge PT and get state funding? Isn’t this double-dipping?
Questions and Answers
93
28. How about last year’s 2nd installment for 2009-2010? When do we receive these funds?
Funding for 2009-2010 have all be sent to LEA.
Questions and Answers
94
29. What do you anticipate for induction funding in 2013 and beyond? Will dollars be allocated on enrollment?
Questions and Answers

95
30. In Section A, Part I, how do you report the # of Career Adult Education and community schools and # of PT?
Questions and Answers

96
31. Where does student achievement enter into the equation as part of measuring candidate growth?
Questions and Answers

97
32. Still unclear about teacher competence versus completion. Can this be put in writing as a guideline to follow with definitions and suggested evidence?
Questions and Answers
98
33. Can there be an evidence suggestion calendar year for each cohort to help support our different accreditation activities?
Questions and Answers
99
34. The statewide survey data is perception data, so how do you measure growth over time. Do you want growth or competence?
Questions and Answers
100
35. Can we be given the link to the TCGB at CDE when the monies are released so that we know when in happens? (As opposed to waiting for our fiscal people to tell us...)
Questions and Answers
101
36. With the number of programs charging
in clusters 4 and 5, are they charging for BTSA Induction, or Ed Specialist. Is this a trend we want to embrace in the state? Is there a philosophical shift?
Questions and Answers

102
37. On Section B (page. 25 of packet), do we need to submit the institutional plan of action for each program?
Questions and Answers
103
38. Please review the difference between a program “withdrawal” versus “going inactive”.
Questions and Answers